Analysis and Modelling of Mineral and Element Composition ... · Coarse comminution proessed by the...
69
THESIS FOR THE DEGREE OF LICENTIATE OF ENGINEERING Analysis and Modelling of Mineral and Element Composition in Compression Breakage LORENA GULDRIS LEON Department of Industrial and Materials Science CHALMERS UNIVERSITY OF TECHNOLOGY Gothenburg, Sweden 2018
Transcript of Analysis and Modelling of Mineral and Element Composition ... · Coarse comminution proessed by the...
THESIS FOR THE DEGREE OF LICENTIATE OF ENGINEERING
Analysis and Modelling of Mineral and Element Composition in Compression Breakage
LORENA GULDRIS LEON
Department of Industrial and Materials Science
CHALMERS UNIVERSITY OF TECHNOLOGY
Gothenburg, Sweden 2018

Analysis and Modelling of Mineral and Element Composition in Compression Breakage LORENA GULDRIS LEON
© LORENA GULDRIS LEON, 2018
IMS-2018-9
Department of Industrial and Materials Science Chalmers University of Technology SE-412 96 Gothenburg Sweden Telephone + 46 (0)31-772 1000
Cover: The cover illustration is a backscattered electron image of a composite particle after a compressive breakage process. The particle is embedded in by tantalite, quartz, muscovite and albite.
Printed by Chalmers Reproservice Gothenburg, Sweden 2018

iii
To my family


i
ABSTRACT The outstanding properties of tungsten and tantalum make them valuable metals and, in some cases, irreplaceable in applications. The growing interest due to the high economic importance and the limited supply places these metals in the critical metals risk list. As a consequence of the increasing global demand for these metals, there is also a need to develop more efficient extraction processes. Coarse comminution processes are commonly assessed by the size reduction of particles, however, liberation and mineralogy are not taken into consideration.
The main hypothesis of this research is that critical metals are not evenly distributed in the different size fractions during coarse comminution processes since the breakage of particles will be affected by the mineralogy and texture. Further, to demonstrate the significant impact that mineralogy understanding has during breakage and develop a test procedure to include the concentration of the critical metals which will increase the resolution of coarse comminution models.
This thesis focuses on finding an experimental methodology to analyse the rock properties and its general characteristics, followed by defining a multicomponent model that combines size reduction and concentration for critical metals. In this research, the work is divided into 3 stages. The first main stage is the rock materials characterisation which consists of two parts: mechanical and mineralogical analyses. The second stage is the modelling and the third stage is theoretic implementation.
The mechanical characterisation includes compressive breakage through the use of interparticle breakage. Mineralogical characterisation was evaluated through the assessment of size fractions with a scanning electron microscopy (SEM) and geochemical analysis. Results from these tests give information about breakage, mineral composition and element concentration.
The second main stage corresponds to modelling. The first modelling part was the methodology of fitting measured data into a size reduction model. The second part corresponds developing a model capable of predicting the rare metal concentration as a function of the particle size distribution after a cycle of the compression crushing process. The model was developed by selecting a bimodal Weibull distribution for calibration which is shown to be capable of simulating critical metal concentration as a function of the compression ratio.
The third stage is a simulation. The aim of this section is to demonstrate a theoretical case where the concentration model allows to make well based estimations of how a plant should be designed. Evaluations have shown that by considering the information of the ore and its behaviour in terms of concentration and performance of the crushing, the process could be improved by changing machine parameters, i.e. closed side setting and adding a pre-screening before the milling process.
The work shows that considering the effect of mineralogy and element concentration in the coarse comminution models, it is possible to achieve better performance in terms of cone crusher and plant design.
Keywords: compressive crushing, modelling, rare metals, cone crusher, minerals, elements.

ii
iii
ACKNOWLEDGEMENTS
The research presented in this thesis has been carried out at the Department of Industrial and Materials Science (IMS) at Chalmers University of Technology in Gothenburg. This work is based on research supported by the OPTIMORE, project number 642201, funded by the European Union for the H2020 project. I gratefully acknowledge their financial support. I would like to thank my supervisors, Professor Dr. Magnus Evertsson and Professor Dr. Magnus Bengtsson. First of all, thank you very much for having selected me, and giving me the opportunities, support and feedback for carrying out this project. It has been a great and highly motivating experience working with both of you.
Thanks to my colleagues at Chalmers Rock Processing Systems (CRPS) for their support and availability: Dr. Erik Hulthen, Dr. Gauti Asbjörnsson, Dr. Johannes Quist, Ali Davioodi, Kanishk Bhadani, Marcus Johansson, Josefine Bentsson, Anna Rydin, Albin Gröndahl and Anton Hjalmarsson. In special, thanks to the best office partners Simon Grunditz and Panagiota Papadopoulou, for making my days better with our conversations, answering questions and solving problems.
I wish to acknowledge Optimore consortium partners for the work and suggestions. I would like to make special mention to the team from Universitat Politècnica de Catalunya and Universidad de Oviedo, your suggestions and time were very valuable. I would like to express my gratitude to Dr. Johan Hogmalm and Irma Håkansson. Your help and support was invaluable. Thank you for all information and guidance. Thank you Irma for so many hours, work and also for the enjoyable time. Without any doubt, you were the best person to help me with all my SEM tests. My personal thank you also goes to the IMS department on the 5th floor for motivating me and making this experience the best every day. I am also especially grateful for sharing this experience in the company of people like Julia, Julia, Malin, Roham, Aderiani, Maria and Olivia, more than colleagues you are my friends who accompany me on this journey. A mi familia, nada de esto sería posible sin el apoyo de todos y cada uno de ustedes. Gracias por siempre apoyarme, aun estando lejos, gracias por siempre estar presente y darme lo mejor de ustedes. Gracias a mi mama Ivonne, a mi mama Flor, a mi papa Genio, a mis tías Norelly y Nancy, a mis primas Oriana y Valentina, a mis tíos Hector y Arnoldo. Gracias igualmente a mi esposo Lars, por comprenderme y darme lo mejor de sí. A todos, gracias por la motivación, inspiración y amor. Sin ustedes nada, nada, sería posible.
Por último, sin embargo el más importante, gracias a Dios por hacer todo posible en mi vida.
Lorena Guldris Leon Gothenburg, Sweden, April 2018

iv
v
APPENDED PUBLICATIONS The licentiate thesis contains the following papers: Paper A: Guldris, L., Bengtsson, M., and Evertsson, C. M. Reduction and
fracture analysis of a tungsten ore and its use for fundamental liberation modelling. 12a Conferencia Internacional de Procesamiento de Minerales (PROCEMIN 2016). 2016. Santiago, Chile.
Paper B: Guldris, L., Bengtsson, M., and Evertsson, C. M. Mineralogical characterisation, reduction and liberation analysis of tungsten ore. Emerging Trends in Minerals Engineering Conference (IOM3). 2016. London, U.K
Paper C: Guldris, L., Bengtsson, M., and Evertsson, C. M., Modelling Reduction and Liberation for Rare Earth Minerals Applications. International Comminution Symposium (Comminution '16). 2016. Cape Town, South Africa.
Paper D: Guldris, L., Bengtsson, M., and Evertsson, C. M. Analysis of
concentration in rare metal ores during compression crushing. International Journal of Mineral Engineering (Journal). January 2018.
In papers A-C, Guldris and Bengtsson initiated the idea. The testing was performed by Guldris. Guldris wrote the paper with Evertsson as reviewer.
In papers D, Guldris and Bengtsson initiated the idea and co-wrote the paper with Evertsson as reviewer.

vi

vii
TABLE OF CONTENTS INTRODUCTION ..................................................................................................................... 1
1.1 Minerals and mineral processing ................................................................................... 1
1.2 Comminution ................................................................................................................. 3
1.3 Breakage principles ........................................................................................................ 4
1.3.1 Impact breakage ................................................................................................................... 4
1.3.2 Attrition ................................................................................................................................ 5
1.3.3 Compressive breakage ......................................................................................................... 5
1.4 Cone crushers ................................................................................................................. 5
1.5 Liberation of value minerals .......................................................................................... 6
1.6 Challenges associated with coarse comminution process .............................................. 8
OBJECTIVES ............................................................................................................................ 9
2.1 Research outline ............................................................................................................. 9
2.2 Research questions ....................................................................................................... 11
2.3 Delimitations ................................................................................................................ 11
SCIENTIFIC APPROACH ..................................................................................................... 13
LITERATURE REVIEW ........................................................................................................ 15
4.1 Compressive breakage models ..................................................................................... 15
4.2 Liberation models......................................................................................................... 15
MATERIAL CHARACTERISATION ................................................................................... 17
5.1 Material characterisation breakage .............................................................................. 17
5.2 Mineralogical characterisation ..................................................................................... 19
5.3 Elemental analysis characterisation ............................................................................. 20
5.4 Cumulative distribution of concentration .................................................................... 21
5.5 Experimental study....................................................................................................... 21
5.5.1 Materials............................................................................................................................. 21
5.5.2 Discussion .......................................................................................................................... 35
MODELLING .......................................................................................................................... 39
6.1 Modelling particle size ................................................................................................. 39
viii
6.1.1 Calibration of the particle size reduction model ................................................................ 40
6.2 Modelling of concentration .......................................................................................... 41
6.2.1 Development of the model ................................................................................................. 42
6.2.2 Calibration of the model .................................................................................................... 43
6.2.3 Application of the model .................................................................................................... 44
IMPLEMENTATION - CASE STUDY .................................................................................. 45
DISCUSSIONS AND CONCLUSION ................................................................................... 49
8.1 General ......................................................................................................................... 49
8.2 Answers to research questions ..................................................................................... 50
FUTURE WORK ..................................................................................................................... 53
APPENDED PAPERS
Paper A: Reduction and fracture analysis of a tungsten ore and its use for fundamental liberation
modelling.
Paper B: Mineralogical characterisation, reduction and liberation analysis of tungsten ore.
Paper C: Modelling Reduction and Liberation for Rare Earth Minerals Applications.
Paper D: Analysis of concentration in rare metal ores during compression crushing.

ix
LIST OF ABBREVIATIONS
CRPS Chalmers Rock Processing Systems CSS Close Side setting BCA Bulk chemical analysis EDS Energy Dispersive Spectroscopy ICP-AES Inductively Coupled Plasma Mass Spectrometry ICP-MS Inductively-Coupled Mass Spectrometry IPB Interparticle Breakage SEM Scanning Electron Microscopy SPB Single particle Breakage QMA Quantitative Microstructural Analysis VSI Vertical Shaft Impactor
b Bed height [mm] s displacement of the piston [mm] s/b Compression ratio [–] xs/b Normalized particle size [–] x Particle size [mm] B Breakage matrix [–] f Feed distribution [mm] I Identity matrix [–] p Product distribution [mm] S Selection matrix [–] α Calibration constant [–] β Calibration constant [–] γo Normalized frequency distribution concentration [–] ν Calibration constant [–] λ Calibration constant [–] d Integration interval fraction size [mm] c Integration interval fraction size [mm] i Element index [–] mi Mass in each fraction [g] mt ot Total mass [g] pi Size fraction [–] H0 Cumulative normalized distribution concentration [–]


Analysis and Modelling of Mineral and Element Composition in Compression Breakage
1
1 INTRODUCTION
The aim of this chapter is to: − Introduce minerals and mineral processing. − Provide an overview of comminution processes. − Introduce the principles of breakage. − Provide an overview of cone crushers. − Define liberation of valuable minerals. − Describe challenges associated with coarse comminution processes.
Tungsten and tantalum are valuable and irreplaceable metals with multiple ranges of applications in modern technologies ranging from industrial to electronic applications. This is due to the properties that these metals have, such as the high density, the highest melting point of all metals, low reactivity, and also when combined with other material they are well known for improving mechanical properties as hardness, toughness and corrosion resistance. Tungsten and tantalum are raw materials with very high economic importance and with a medium supply risk, which is the reason why the extraction of these metals is positioned in the top of the “risk list”, from the British Geological Survey (2012) immediately after the rare earth elements.
These critical metals, like all metals, are extracted from ores through processes that include numerous steps, beginning with size reduction of the ore particles through to separation. The size reduction of the particles is known as comminution, and it includes crushing (coarse comminution) and grinding (fine comminution).
1.1 MINERALS AND MINERAL PROCESSING
Minerals are everything with an economic value which is extracted from the earth. The minerals are found in ores or rocks which are typically not homogeneous in chemical and physical composition. Normally, minerals are finely disseminated and intimately associated with gangue which has no commercial value. To achieve the extraction of the valuable minerals it is necessary to process the ore through different steps including size reduction and physical separation. Mineral processing refers to the different necessary processes for the extraction of valuable metals and produces a commercial end product or products.

Lorena Guldris Leon
2
There are two fundamental operations in mineral processing, the liberation or release of the valuable minerals from their waste gangue minerals, and the separation into two products one the concentrate that is the enriched product with most of the valuable minerals, and the tailings which are the discard product that contains predominately the gangue minerals. Figure 1 illustrates the simple flowsheet of mineral processing process.
Figure 1. Principle flowsheet of the mineral processing stages.
The liberation of the valuable minerals is achieved by the reduction of particles in sizes through comminution processes. It is necessary to reduce the size particles to reach a mixture of relatively clean and pure particles of either mineral or gangue (Wills and Finch, 2016). Figure 2 illustrates a more detailed flowsheet of the mineral processing process focusing on the interactions during the comminution stage.
Figure 2. Flowsheet of the mineral processing process.
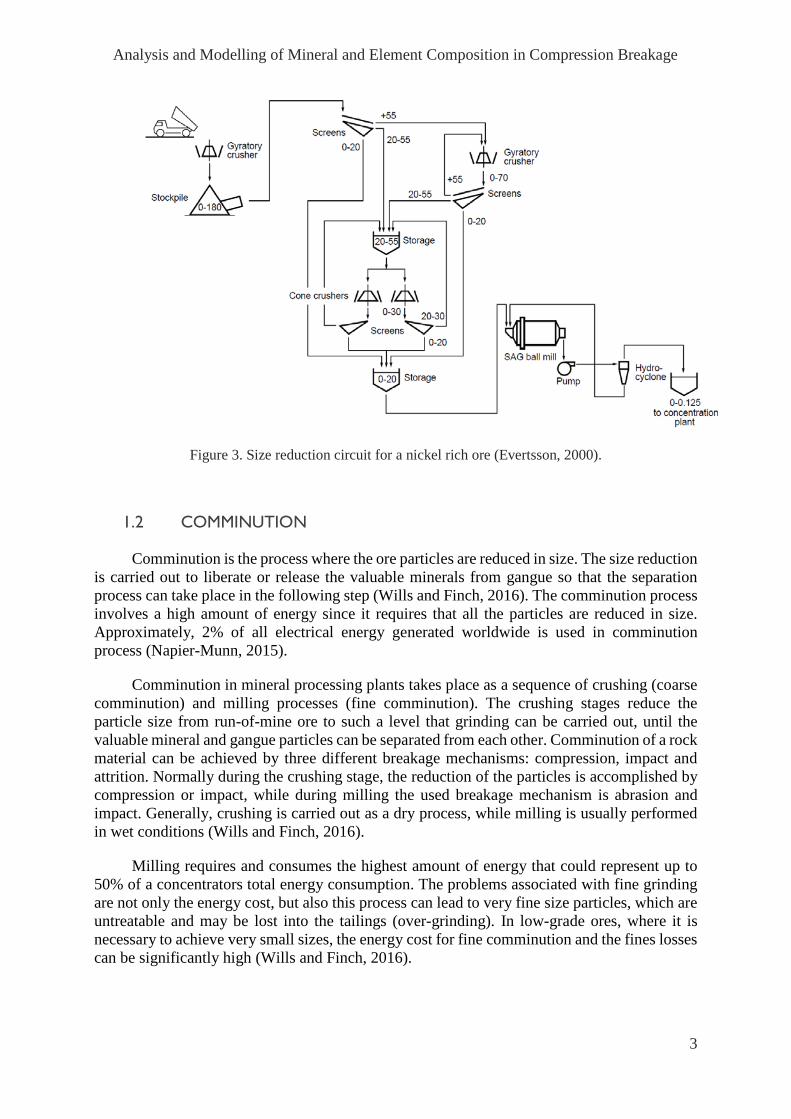
The comminution circuit is comprises crushing, grinding and initial rejection. Usually, a comminution plant consists of two to three crushing stages and one to three milling stages, as Figure 3 illustrates. The purpose of each stage of is to reduce the particle size to a certain degree. When the particles reach the desired reduction, they are transferred to the next process to be reduced to a smaller size until achieving the required size. Usually, the primary crusher is a jaw or gyratory crusher, secondary crushers can be of gyratory or cone type, while tertiary crushers are cone crushers (Bengtsson, 2009). Normally the design of a plant depends on several factors including ore grade, ore type, ore deposit variability, the scale of the operation and investment capital.
Analysis and Modelling of Mineral and Element Composition in Compression Breakage
3
Figure 3. Size reduction circuit for a nickel rich ore (Evertsson, 2000).
1.2 COMMINUTION
Comminution is the process where the ore particles are reduced in size. The size reduction is carried out to liberate or release the valuable minerals from gangue so that the separation process can take place in the following step (Wills and Finch, 2016). The comminution process involves a high amount of energy since it requires that all the particles are reduced in size. Approximately, 2% of all electrical energy generated worldwide is used in comminution process (Napier-Munn, 2015).
Comminution in mineral processing plants takes place as a sequence of crushing (coarse comminution) and milling processes (fine comminution). The crushing stages reduce the particle size from run-of-mine ore to such a level that grinding can be carried out, until the valuable mineral and gangue particles can be separated from each other. Comminution of a rock material can be achieved by three different breakage mechanisms: compression, impact and attrition. Normally during the crushing stage, the reduction of the particles is accomplished by compression or impact, while during milling the used breakage mechanism is abrasion and impact. Generally, crushing is carried out as a dry process, while milling is usually performed in wet conditions (Wills and Finch, 2016).
Milling requires and consumes the highest amount of energy that could represent up to 50% of a concentrators total energy consumption. The problems associated with fine grinding are not only the energy cost, but also this process can lead to very fine size particles, which are untreatable and may be lost into the tailings (over-grinding). In low-grade ores, where it is necessary to achieve very small sizes, the energy cost for fine comminution and the fines losses can be significantly high (Wills and Finch, 2016).

Lorena Guldris Leon
4
The evaluation of the quality and performance of coarse comminution processes are normally assessed by measuring the particle size distribution. Measuring of the mineral liberation is just considered at the end of the fine comminution process.
1.3 BREAKAGE PRINCIPLES
There are three main comminution principles of industrial interest:
• Impact breakage • Attrition • Compressive breakage
The three principles are shown in Figure 4. In the sub-sections below the different mechanisms will be described.
Figure 4. Particle breakage mechanisms, forces present in the particles and the resultant distribution of broken particles
1.3.1 Impact breakage
During impact breakage, the energy is transmitted to the particles as kinetic energy by the acceleration. The fragmentation occurs when the particles impact with walls or other particles. Figure 4 shows the basic principle of this type of breakage, as well as the resultant particle size distribution. The size reduction is controlled by the amount of energy transmitted to the particle which, at the same time, is dependent on the speed of the rotor. For this reason the breakage could be controlled by the speed. Crusher equipment using this principle are known as impact crushers. Some equipment that work with this principle are: the vertical shaft impactor (VSI), hammer mill and impact mill. The purpose of this type of crushers is to reduce the size particle,

Analysis and Modelling of Mineral and Element Composition in Compression Breakage
5
but during the process, the generation of fine particles is high due to the abrasive forces present which is sometimes required but sometimes undesirable (Evertsson, 2000).
1.3.2 Attrition
Attrition forces are caused by shear failure and occur due to the interaction between particles. The attrition mostly generates fine material. Figure 4 shows the basic principle of attrition in breakage, as well as the resultant particle size distribution. The attrition is a result of impact, compression or shear forces, or the combination of them.
1.3.3 Compressive breakage
During compressive breakage, the rock material is crushed by compression forces between two surfaces. In this type of breakage, the contact forces between the particles create an increase in the tensile stresses in the particles. When the tensile stresses exceed a critical value, cracks are generated that propagate and break the rock into smaller pieces. The compression forces are achieved through the displacement of the surfaces (or one surface). It is possible to regulate the size reduction by controlling the compression, using the forces and input energy. Some examples of crushing equipment that uses compressive breakage as a principle to achieve particle size reduction are jaw, gyratory, cone and roller crushers. The compressive forces could be applied one at a time or in a repetitive process. As a consequence of the compressive forces the particles will break, the shape and the size of these broken particles can be divided into two size classes. Some larger fragments formed by the fractures and cracking as a consequence of the tensile stress state will be generated, but also some amount of fine particles will be generated through the shear stresses in the contact points. The principle of compressive breakage and forces present are illustrated in Figure 5 (Evertsson, 2000).
Figure 5. Breakage principles. a) Description of cracks and fractures generated by tensile stress. b) Description of fine particles generated through shear stress. (Bengtsson, 2009)
1.4 CONE CRUSHERS
For secondary and tertiary crushing stages, the most commonly used equipment is the so called cone crusher. Cone crushers use the compressive breakage principle as a functional principle. During the reduction process in this machine, the particles are subjected to single particle breakage (SPB) and interparticle breakage (IPB) throughout the different steps of the process. The compression of the particles is achieved by the movement of the inner cone (mantle) while the outer cone (concave) is fixed.

Lorena Guldris Leon
6
It is possible to control the final particle size by controlling the distance between the mantle and the concave. This machine parameter is known as closed side setting (CSS). There are different types of cone crushers on the market, all of them use the same principle but with different design or sizes. The choice of crusher size and chamber design depends on the requirements regarding of capacity, material and feed particle distribution. Figure 6 shows a general cone crusher and its design.
Figure 6. Cone Crusher (Bengtsson, 2009).
1.5 LIBERATION OF VALUE MINERALS
As previously explained, the objective of comminution is to liberate or release the valuable minerals from the gangue minerals as coarsely as possible to facilitate the separation in following processes.
The liberation is measured by the percentage of the mineral occurring as free particles in the ore in relation to the total content. This concept is known as the degree of liberation. Complete liberation between mineral and gangue particles is seldom achieved, even when the ore is reduced to the desired grain size. The properties of the grains and the grain boundaries determine the difficulties to achieve the complete liberation.
Depending on the process and separation techniques, a high degree of liberation is not necessary for achieving high recovery values. In general, a gravity separation process does not need particles with a high degree of liberation, if a pronounced density is apparent between the locked particles and the free gangue particle, the separation is possible. The same happens during magnetic separation processes, due to the magnetic susceptibility difference between gangue and valuable mineral (Wills and Finch, 2016).

Analysis and Modelling of Mineral and Element Composition in Compression Breakage
7
Figure 7. Ore particles. (Wills and Finch, 2016)
Figure 7 shows an ore particle, it is possible to identify two section in the particle. One rich in the valuable mineral (black section), and other rich in the valuable mineral but highly interspersed with the gangue mineral. The reduction of this particle through comminution process will generate liberated fragments of mineral and gangue particles, but will also generate composite particles with different degrees of valuable minerals. Depending on the degree or amount of valuable mineral, the particles will be classified as a concentrate (In Figure 8, particles similar at A), tailings (particles D) or middlings (particles B, C and D) (Wills and Finch, 2016).
During liberation analysis, the size reduction of the particles is not the only interesting concept. In this stage it is also important to understand how the minerals break. The responsibility of the mineral liberation was first attributed by A. M. Gaudin (1939), who described two types of mineral liberation: by comminution and by detachment. Liberation by comminution or random breakage, is the liberation achieved by random fracture mechanism, meaning the crack propagation is through the mineral grains without consideration of the different phases present in the ore. In this type of breakage, the particles from a single size class will be broken into a predictable unimodal distribution of finer particles, allowing the composition of all particles to remain constant. In this case, the ore texture, grain boundaries or mineral properties do not influence the breakage.
The second type is liberation by detachment or non-random breakage. In this type of breakage the fractures or cracks propagation are situated along the grain boundaries allowing the preferential liberation of the phases, also known as an intergranular fracture. This will generate a different concentration in the composition of different size fractions alloying the uses selective comminution techniques. There are different definitions of non-random breakage, however, regardless of their classification, they show a variation in the mineral composition of different size fraction.
There are two forms of non-random breakage in particle bed breakage: interfacial breakage (grain/phase boundary fracture) and preferential breakage. In interfacial breakage, the fracture occurs between different grains or between the phase boundaries, allowing the preferential liberation of the phases. In the second case, preferential breakage occurs when the characteristics of the phases are different, resulting in breakage at different rates according to the soft mineral and hard mineral contents of the ore. The soft minerals will break more rapidly

Lorena Guldris Leon
8
than the hard minerals, considering the same amount of forces, generating different concentrations in the composition of the fine fraction and the coarse fraction (Fandrich, 1997); (Mariano, 2016); (Hesse, 2017).
1.6 CHALLENGES ASSOCIATED WITH COARSE COMMINUTION PROCESS
Comminution processes involve a high amount of energy to assure the optimal size range of the ore particles until the separation. The evaluation of the quality and performance of coarse comminution processes are normally assessed by measuring the particle size distribution. Measuring the mineral liberation and composition is just considered at the end of the process.
All of the minerals that form the ore exhibit diverse characteristics and properties, including grain size, grain shape, bounding between grains and mechanical properties of the minerals such as Young's modulus and strength. All of these properties may affect how the ore is broken and the result achieved after the breakage process, by means the particle size distribution Vizcarra et al. (2010). Recently, the early rejection of the coarse materials has been identified as an alternative to upgrading the process, especially to decrease energy consumption. The early rejection or preferential grade by size, is based on the propensity of some ores to deport metal into specific size fractions (Carrasco, 2016a; Carrasco, 2016b), but to achieve this it is necessary to take advantage of the variances between the minerals phases that integrate the ore. To recognize these differences, it is important to identify some concepts such as grain shape, grain size, crack propagation, breakage mechanism and element concentration (Hesse, 2017).
Significant advances in comminution technologies may come from the exploitation of the basic fundamental understanding of the fracture process. Demonstrating the significant impact of phase boundary, breakage mechanism and element concentration increase the resolution of the process.

Analysis and Modelling of Mineral and Element Composition in Compression Breakage
9
2 OBJECTIVES
The goal of this chapter is to: − Describe the aim of this research. − Formulate the research questions. − Define the delimitations of the research.
2.1 RESEARCH OUTLINE
The aim of this work is to gain fundamental understanding of how different ore materials break after compressive crushing in terms of minerals and elements distribution. Consequently, the main hypothesis of this research is that critical metals are not evenly distributed in different size fractions during coarse comminution processes since the breakage of particles will be affected by the mineralogy and texture.
Further, the aim of this work is to understand how ore characteristics can be measured and integrated into coarse comminution models. The specific objective of this work is to develop a test procedure capable of predicting the critical metal concentration as a function of the particle size distribution after a cycle of the compression crushing process.
The material characterisation process and methodology for the analysis is shown in Figure 8. The research focuses on compressive breakage in tertiary crushing stages, as shown in Figure 9.

Lorena Guldris Leon
10
Figure 8. Material characterisation test procedure.
Figure 9. The focus of this work is the tertiary crushing in mineral plants as shown in the dashed box (Evertsson, 2000).

Analysis and Modelling of Mineral and Element Composition in Compression Breakage
11
2.2 RESEARCH QUESTIONS
A set of research questions has been formulated to guide the research work. The focus of the research questions varies from material characterisation to modelling.
RQ 1) What type of material properties beside particle size need to be analysed to model element grade?
RQ 2) How can liberation in coarse comminution be measured?
RQ 3) Is it possible to achieve liberation of critical metals in coarse comminution?
RQ 4) What factors influence the concentration distribution and how can it be measured?
RQ 5) How can concentration of critical metals be modelled?
RQ 6) How can coarse comminution improve the extraction of critical metals?
The research questions are going to be discussed throughout this thesis and will be
answered in the conclusions chapter. The relation and dependency of the research questions and the appended papers are shown in Figure 10. The figure refers to the degree to which the research questions are addressed in different chapters.
Figure 10. Relationship between research questions and papers.
2.3 DELIMITATIONS
In order to limit the scope of the research a set of delimitations have been formulated as listed below:
• The work is based on compressive breakage. • The work is based on the study and characterisation of critical metal ores. The
modelling of the concentration was validated for tantalum and tungsten ores. • The work does not include screening and classification • This work is not including on dynamic process simulations.
Lorena Guldris Leon
12

Analysis and Modelling of Mineral and Element Composition in Compression Breakage
13
3 SCIENTIFIC APPROACH
The aim of this chapter is to: − Introduce the methodology used in the research.
This work has been carried out at the Chalmers Rock Processing Systems (CRPS) research group at the Department of Industrial and Materials Science at Chalmers University of Technology. CRPS is a part of the Machine Elements group. The research topic addressed by the group is focused on processes for producing crushed rock materials applied to the mining and aggregate industry.
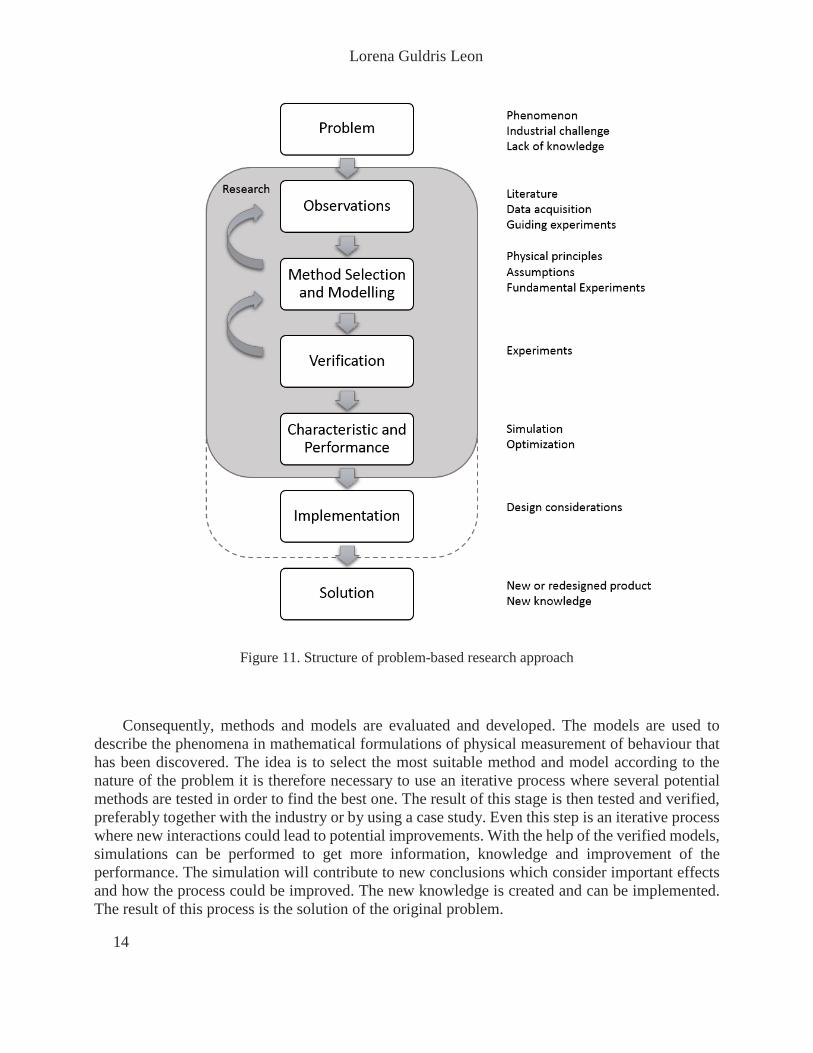
The adopted scientific approach used by the Machine Elements group is characterized as a problem-oriented research methodology. In problem-oriented research approaches the methods selected for solving the problem are based on the nature of the problem rather than tools or methods required to solve it. The method has been thoroughly described by Evertsson (2000) and Hulthén (2010). The schematic diagram of the problem-oriented research methodology is shown in Figure 11.
Research is defined as a detailed study to discover new information or reach a new level of understanding. The need for the new understanding or new knowledge is based on a problem that requires a solution-finding where the existing knowledge is not sufficient and a deeper understanding is needed. The first step in the process is to identify the lack of knowledge. The next step observes the reality and the physical principles that are related to the specific problem. Different kinds of observations are used for this purpose. The literature reviews are used as the basis of the existing knowledge in the research area and experiments can be used to clarify the nature of the problem. The data acquisition or experiments can be evaluated and used in the process of building theory.
Lorena Guldris Leon
14
Figure 11. Structure of problem-based research approach
Consequently, methods and models are evaluated and developed. The models are used to describe the phenomena in mathematical formulations of physical measurement of behaviour that has been discovered. The idea is to select the most suitable method and model according to the nature of the problem it is therefore necessary to use an iterative process where several potential methods are tested in order to find the best one. The result of this stage is then tested and verified, preferably together with the industry or by using a case study. Even this step is an iterative process where new interactions could lead to potential improvements. With the help of the verified models, simulations can be performed to get more information, knowledge and improvement of the performance. The simulation will contribute to new conclusions which consider important effects and how the process could be improved. The new knowledge is created and can be implemented. The result of this process is the solution of the original problem.
Analysis and Modelling of Mineral and Element Composition in Compression Breakage
15
4 LITERATURE REVIEW
The aim of this chapter is to: − Explain the traditional compressive breakage models. − Describe the bases of liberation models. − Describe fundamental concepts.
4.1 COMPRESSIVE BREAKAGE MODELS
Over the years attention when assessing quality and performance of comminution processes has been focused on particle size distribution. There are different studies, knowledge and models in coarse comminution that predict the size distribution after crushing. At present, the models in coarse comminution are capable of predicting particle size distribution, capacity and energy. These models have their bases in the empirical model of Whiten (1972), where he presented a model using a population balance model to predict particle size.
Evertsson (2000) presented a model for rock breakage in cone crushers. His work was based on rock breakage characterisation by a piston and die test. This work resulted in a laboratory test procedure for calibrating the crusher model using single and inter-particle breakage. Subsequently, Bengtsson (2009) developed a model capable of predicting particle shape by using bimodal Weibull distribution. His work demonstrates the possibility to use empirical models to model characteristics.The compressive breakage models predict the particle size distribution, however, the existing models are limited by the intrinsic physical properties of the ore, such as the element/mineral concentration or mineral liberation.
4.2 LIBERATION MODELS
The evaluation of the mineral liberation is measured in the last step of the comminution process, when all particles are reduced to a certain size in microscale. There are a large number of liberation models that attempt to quantify the degree of liberation by predicting the behaviour of a
Lorena Guldris Leon
16
particle in a separation process, all of them are focused on fine comminution and consider random fracture.
The liberation models and their mathematical equations are based on the work of A. M. Gaudin (1939) which evaluated the breakage mechanism based on the structure and bonding of the grain. The author described two types of mineral liberation: by comminution and by detachment. Andrew and Mika (1975), Wiegel (1976), Barbery (1987) and King and Schneider (1998) continue with the research and developed a model for the fraction of particles of a certain size that contained less than a determinate fraction of a particular mineral. These models are the basis for today’s research, however they have unrealistic assumptions in reference to the grain structure of the minerals. Their work has been followed by others such as Wei and Gay (1999), Gay (2004) and Gay and Latti (2006), who introduced multi-mineral systems, the models of which are valid for different breakage mechanisms. In their work it is suggested that liberation analysis and modelling are beneficial when determining the optimal grind size for the comminution unit, specifically for fine particles, for which they connected the liberation distribution with the texture of the ore and the dispersion rate function. Others works, such as Fandrich et al. (1997), investigated how the mineral liberation was influenced by particle bed breakage. The liberation analysis and modelling are beneficial when determining the optimal grind size for the comminution unit, especially for fine particles, for which they connected the liberation distribution with the texture of the ore and the dispersion rate function.
Moreover, the liberation analysis and prediction is not the only basic fundamental concept that must be understood; it is necessary to understand and assess other concepts, such as fracture process, mineral concentration, breakage mechanisms and the behaviour of different minerals. Fandrich et al. (1997) established different types of breakage of ore, including random and selective breakage. In random breakage, the fracture occurs randomly, without consideration of the different phases present in the ore, allowing the composition of all particles to remain constant. In contrast, in selective or non-random breakage, the fracture is preferential and as a consequence it generates a different concentration in the composition of different size fractions. The work by Mariano et al. (2016) summarized the perspectives on random and non-random breakage. In more recent works, Vizcarra et al. (2010) and Ozcan, Benzer (2013) the mineral liberation was evaluated using different breakage mechanisms.
The liberation of minerals occurs at finer size particles and for this reason all models apply for fine comminution processes. However, during coarse comminution liberation is believed to be minor, although the mineral concentrations in different particle sizes could affect the liberation performance in later stages. Recently, Carrasco et al. (2016) proposed a coarse liberation model based on preferential grade by size response in terms of ranking the response parameter of ores as a function of the particle size distribution and the size reduction process using the Monte Carlo method. Other research such as Bazin et al. (1994), considers that some ores preferentially deport metal into specific size fractions, supporting the development of a mineral concentration model by fitting a third order polynomial. In recent research Hesse et al. (2017), selective breakage was investigated using quantitative microstructural analysis (QMA). The paper contains a detailed analysis on the problems associated with understanding selective breakage, e.g., the mineral geometry and orientation inside the structure.

Analysis and Modelling of Mineral and Element Composition in Compression Breakage
17
5 MATERIAL CHARACTERISATION
The aim of this chapter is to: − Explain the breakage methodology to characterize an ore. − Describe surface analysis of the ore through SEM. − Describe the elemental analysis characterisation.
5.1 MATERIAL CHARACTERISATION BREAKAGE
Evertsson developed a method for characterizing the compressive breakage behaviour of a rock material with the use of a piston and die test. Subsequently Lee (2012) optimized this method. The characterisation method for interparticle breakage (IPB) described by Evertsson (2000) and Lee (2012) was used in this research. A schematic illustration of IPB is shown in Figure 12.
Figure 12. Illustration of Interparticle breakage before and after the compression.
Lorena Guldris Leon
18
The compressive breakage methodology allows analysis and mechanical characterisation of the rock behaviour in terms of the breakage, particle size distribution and energy consumption when compressive forces are applied. For this analysis, a specific amount of material (350 particles) was placed in a cylinder to apply compression forces. The method suggested the use of monosized particles of 16-19 mm, however, it was not possible to use the same size in all tested ores.
The bed height (𝑏𝑏) is generated through the thickness occupied by the material. The displacement of the piston (𝑠𝑠) and the compression ratio (𝑠𝑠 𝑏𝑏⁄ ) are fixed values. The definition of the compression ratio is presented in equation (1) and it represent the compression by the relation between the initial and final height.
sb
sSb
= ( 1 )
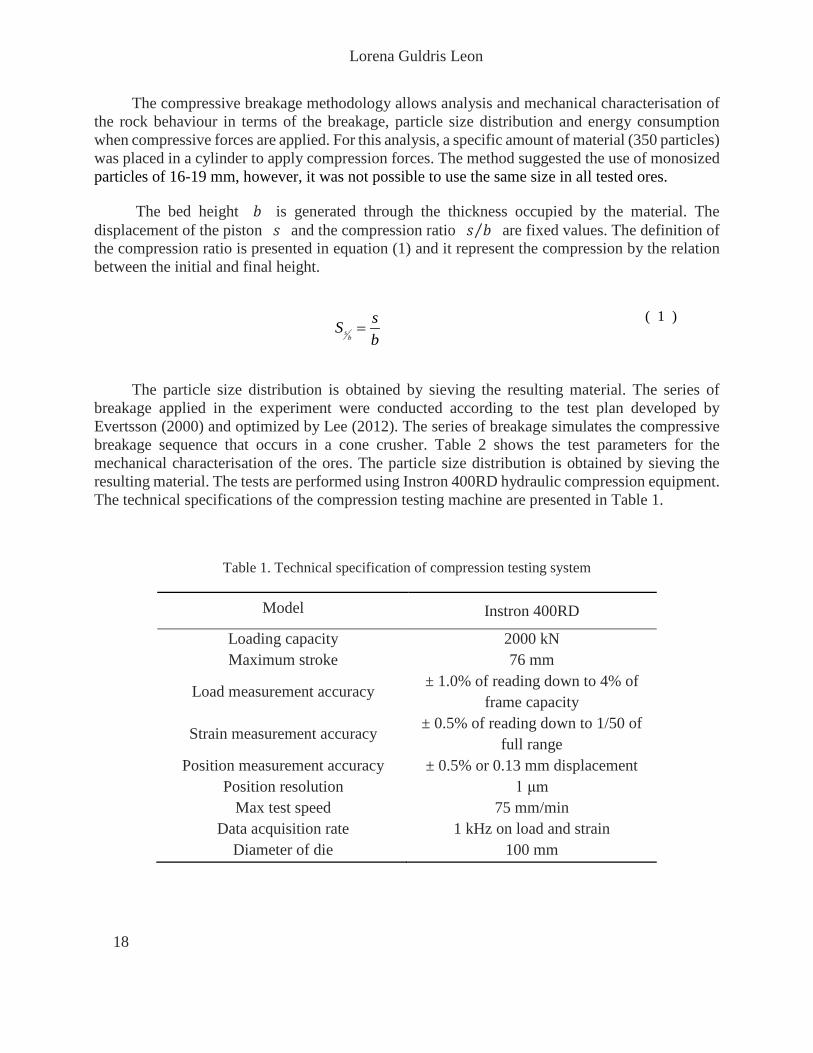
The particle size distribution is obtained by sieving the resulting material. The series of breakage applied in the experiment were conducted according to the test plan developed by Evertsson (2000) and optimized by Lee (2012). The series of breakage simulates the compressive breakage sequence that occurs in a cone crusher. Table 2 shows the test parameters for the mechanical characterisation of the ores. The particle size distribution is obtained by sieving the resulting material. The tests are performed using Instron 400RD hydraulic compression equipment. The technical specifications of the compression testing machine are presented in Table 1.
Table 1. Technical specification of compression testing system
Model Instron 400RD
Loading capacity 2000 kN Maximum stroke 76 mm
Load measurement accuracy ± 1.0% of reading down to 4% of
frame capacity
Strain measurement accuracy ± 0.5% of reading down to 1/50 of
full range Position measurement accuracy ± 0.5% or 0.13 mm displacement
Position resolution 1 μm Max test speed 75 mm/min
Data acquisition rate 1 kHz on load and strain Diameter of die 100 mm
Analysis and Modelling of Mineral and Element Composition in Compression Breakage
19
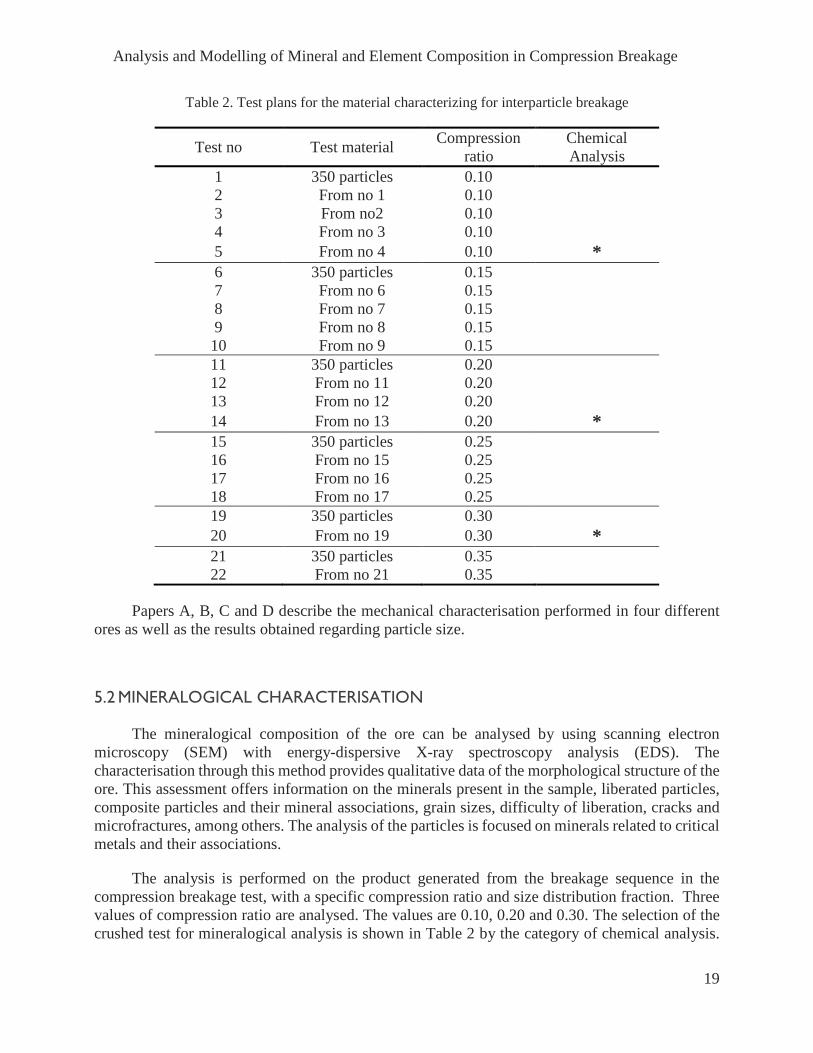
Table 2. Test plans for the material characterizing for interparticle breakage
Test no Test material Compression ratio
Chemical Analysis
1 350 particles 0.10 2 From no 1 0.10 3 From no2 0.10 4 From no 3 0.10 5 From no 4 0.10 * 6 350 particles 0.15 7 From no 6 0.15 8 From no 7 0.15 9 From no 8 0.15 10 From no 9 0.15 11 350 particles 0.20 12 From no 11 0.20 13 From no 12 0.20 14 From no 13 0.20 * 15 350 particles 0.25 16 From no 15 0.25 17 From no 16 0.25 18 From no 17 0.25 19 350 particles 0.30 20 From no 19 0.30 * 21 350 particles 0.35 22 From no 21 0.35
Papers A, B, C and D describe the mechanical characterisation performed in four different ores as well as the results obtained regarding particle size.
5.2 MINERALOGICAL CHARACTERISATION
The mineralogical composition of the ore can be analysed by using scanning electron microscopy (SEM) with energy-dispersive X-ray spectroscopy analysis (EDS). The characterisation through this method provides qualitative data of the morphological structure of the ore. This assessment offers information on the minerals present in the sample, liberated particles, composite particles and their mineral associations, grain sizes, difficulty of liberation, cracks and microfractures, among others. The analysis of the particles is focused on minerals related to critical metals and their associations.
The analysis is performed on the product generated from the breakage sequence in the compression breakage test, with a specific compression ratio and size distribution fraction. Three values of compression ratio are analysed. The values are 0.10, 0.20 and 0.30. The selection of the crushed test for mineralogical analysis is shown in Table 2 by the category of chemical analysis.

Lorena Guldris Leon
20
After the IPB test, the product is divided in nine size fractions as shown in Table 3. The test procedure for mineralogical analysis included 27 samples for the analysis of one ore.
Table 3. Test plan for the mineralogical characterisation
Particle size fraction (mm) 5.6 > 4.0 5.6 2.0 4.0 1.0 2.0 0.5 1.0
0.25 0.5 0.125 0.25 0.063 0.125
0 0.063
The particles from each size fraction are mounted separately in embedded epoxy resin and polish until a mirror-like surface is achieved. The surface is carbon coated and inspected under the microscope.
The analysis is performed using a Hitachi S-3400N SEM coupled to an Oxford Instrument X-Max EDS, at the Department of Geosciences at the University of Gothenburg. The Oxford Inca software is set up to automatically detect high density minerals by the back-scatter intensity and to analyse the chemistry of each detected grain by EDS.
Papers A, B and C describe the qualitative mineral characterisation performed on three different ores. These papers also address the results obtained regarding minerals, minerals association with respect to the critical metal minerals, fracture of the phases and liberation of the particles, in different size fractions.
5.3 ELEMENTAL ANALYSIS CHARACTERISATION
Analytical data of the ore can be acquired using geochemical analysis (bulk chemical analysis - BCA). The geochemical analysis provides quantitative data. This assessment offers analytical data on the distribution and amount of chemical elements in the rock. The rock analysis corresponds to fused bead and acid digestion, then inductively coupled plasma mass spectrometry (ICP-AES) and inductively-coupled mass spectrometry (ICP-MS). ICP-AES is used to measure the content of the major rock-forming elements and minor elements. Major elements are ones whose oxides constitute more than 1% in weight; silica oxide (Si), aluminium (Al), iron (Fe), calcium (Ca), magnesium (Mg), sodium (Na), potassium (K). Minor elements are ones whose oxides constitute between 0.1 and 1% by weight of rock and include titanium (Ti), phosphorus (P), chromium (Cr), and manganese (Mn). ICP-MS quantify the content of trace elements, which are all other metal elements in the periodic table, and occur in concentrations of several parts per million (ppm) and include barium (Ba), gallium (Ga), tantalum (Ta) and tungsten (W) amongst others.

Analysis and Modelling of Mineral and Element Composition in Compression Breakage
21
The selection of samples is the same as for the mineral characterisation, meaning that the tested samples are particles from the last interparticle breakage test with a specific compression ratio and size distribution fraction. Nine fractions for three values of compression ratio are analysed. The values are 0.10, 0.20 and 0.30. The selection of the crushed test for mineralogical analysis is shown in Table 2 by the category of chemical analysis. After the IPB test, the product is divided into nine size fractions as shown in Table 3. The test requires a particle size smaller than 70 microns to ensure the quality and validity of the results. Once the product is divided into the fractions, it is necessary to mill all samples to ensure the size requirement of the test. The test procedure for mineralogical analysis includes 27 samples for the analysis of an ore. Additionally, one sample without any compression is tested.
Although, the limitation of this test is the lack of information regarding which minerals the studied element belongs to, also is lacking information on if the particle is being composite or liberated.
The test is performed at the company ALS Geochemistry.
Papers A, B and C describe the quantitative elemental characterisation performed in three different ores. As well as the results obtained regarding major elements, minor and trace elements in different size fractions.
5.4 CUMULATIVE DISTRIBUTION OF CONCENTRATION
A cumulative distribution function is going to be the methodology for analysing the geochemical data of the critical metals. The advantage of uses this mathematical technique is that the normalized frequency distribution has no relationship to mass. The data are normalized by dividing each fraction mass by the total mass of all fractions. The cumulative distribution (𝐻𝐻𝑜𝑜(𝑥𝑥)) is the integration of the normalized frequency distribution concentration values (𝛾𝛾𝑜𝑜) between an interval of fraction size, where (𝑐𝑐) is the lower size particle limit and (𝑑𝑑) is the upper size particle limit, as shown in equation (2).
( ) ( ) ( )1
d d
o o oic
H x x xγ γ=
= ≈∑∫
( 2 )
5.5 EXPERIMENTAL STUDY
5.5.1 Materials
In this study, four different ores were tested: two tungsten ores and two tantalum ores. The studied materials include: one tungsten ore W1 from Spain (granite); one tungsten ore W2 from Austria (felsic gneisses) and one tantalum ore from different sampling, T3 and T4, from Spain (granite). Table 4 shows the distribution of the ores and nomenclature.
Lorena Guldris Leon
22
Table 4. Test material
Material Test name Paper Tungsten Ore type 1 W1 A Tungsten Ore type 2 W2 B Tantalum Ore type 3 T1 Tantalum Ore type 4 T2 C
All materials were analysed using the procedure for material characterisation presented in previous section. The material characterisation includes interparticle breakage through a series of compressions with three values of compression ratio, followed by the analysis of the product divided in different sizes fractions. These fractions were evaluated with a SEM and geochemical analysis.
Papers A, B and C describe the test method and the results for the three ores in terms of the particle size distribution, minerals and element concentration for different particle size fractions. In the section below some of the obtained results are shown. This method demonstrates that it is possible to analyse different types of ores with different behaviour and properties, and obtain the parameters that can be compared and modelled.
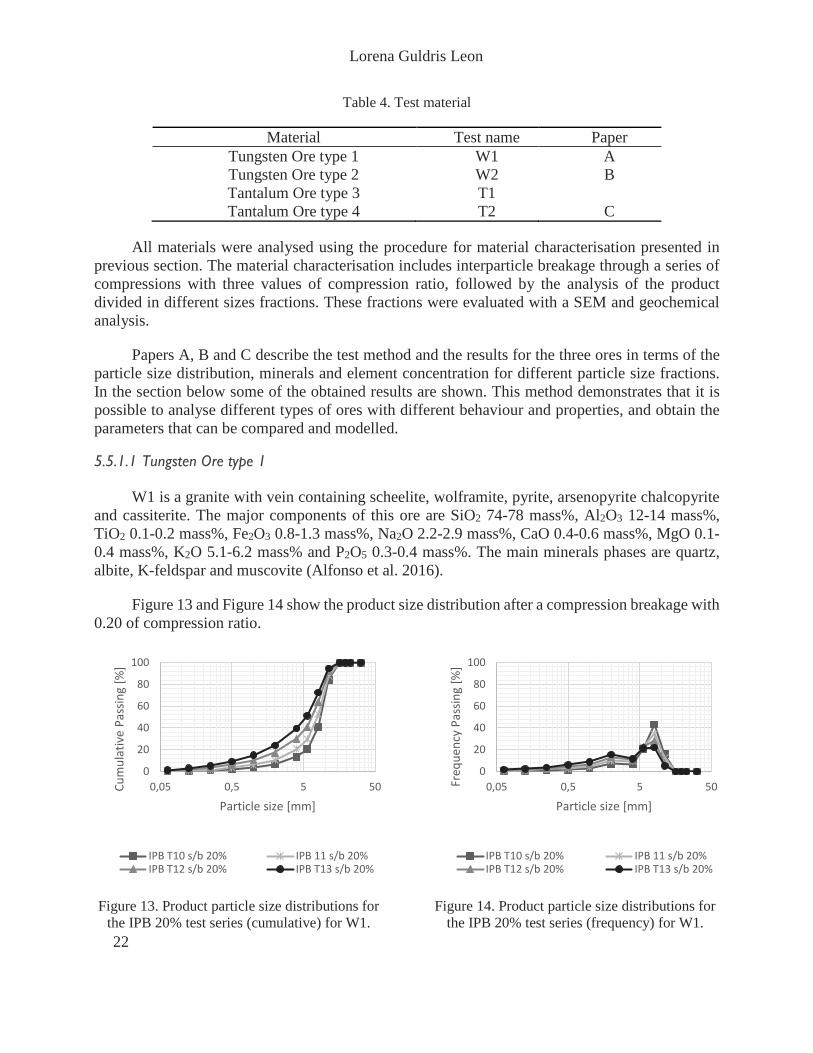
5.5.1.1 Tungsten Ore type 1
W1 is a granite with vein containing scheelite, wolframite, pyrite, arsenopyrite chalcopyrite and cassiterite. The major components of this ore are SiO2 74-78 mass%, Al2O3 12-14 mass%, TiO2 0.1-0.2 mass%, Fe2O3 0.8-1.3 mass%, Na2O 2.2-2.9 mass%, CaO 0.4-0.6 mass%, MgO 0.1-0.4 mass%, K2O 5.1-6.2 mass% and P2O5 0.3-0.4 mass%. The main minerals phases are quartz, albite, K-feldspar and muscovite (Alfonso et al. 2016).
Figure 13 and Figure 14 show the product size distribution after a compression breakage with 0.20 of compression ratio.
Figure 13. Product particle size distributions for the IPB 20% test series (cumulative) for W1.
Figure 14. Product particle size distributions for the IPB 20% test series (frequency) for W1.
0
20
40
60
80
100
0,05 0,5 5 50Cum
ulat
ive
Pass
ing
[%]
Particle size [mm]
IPB T10 s/b 20% IPB 11 s/b 20%IPB T12 s/b 20% IPB T13 s/b 20%
0
20
40
60
80
100
0,05 0,5 5 50Freq
uenc
y Pa
ssin
g [%
]
Particle size [mm]
IPB T10 s/b 20% IPB 11 s/b 20%IPB T12 s/b 20% IPB T13 s/b 20%

Analysis and Modelling of Mineral and Element Composition in Compression Breakage
23
After the compression, size fractions of the product were analysed in SEM. W1 is a tungsten ore with two main sources of this metal, scheelite and wolframite. In backscattered images, the heavy minerals are recognised by their lightness and brightness. As tungsten is a dense element, it is possible to recognise the particles with the content of these minerals (scheelite or wolframite), because they are lighter and brighter compared with other minerals.
Scheelite was found together with muscovite, K-feldspar, quartz, apatite and albite. Normally the surrounded minerals show the presence of fractures or micro-fractures. The scheelite particles present a simple locking texture, which allows liberation due to the rectilinear or gently curved boundaries. Figure 15 to Figure 18 show composite particles of scheelite, and Figure 19 and Figure 20 shown liberated particles of scheelite.
Figure 15. Backscattered electron image of a composite particle of W1 after IPB at 0.30. The particle is embedded in by scheelite and albite.
Figure 16. Backscattered electron image of a composite particle of W1 after IPB at 0.10. The
particle is embedded in by scheelite and K-feldspar.
Figure 17. Backscattered electron image of a composite particle of W1 after IPB at 0.10. The particle is embedded in by scheelite and apatite
and muscovite.
Figure 18. Backscattered electron image of a composite particle of W1 after IPB at 0.30. The particle is embedded in by scheelite in apatite.
Lorena Guldris Leon
24
Figure 19. Backscattered electron image of a scheelite liberated particle of W2 after IPB at
0.10.
Figure 20. Backscattered electron image of a scheelite liberated particle of W2 after IPB at
0.20.
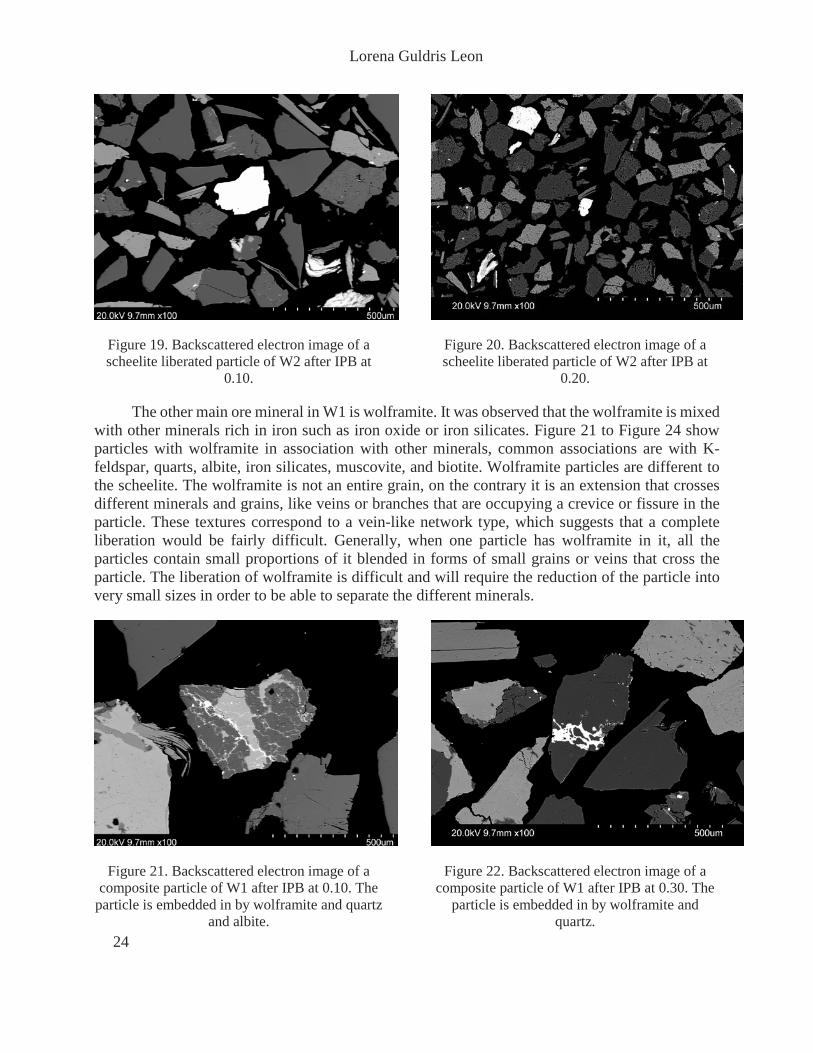
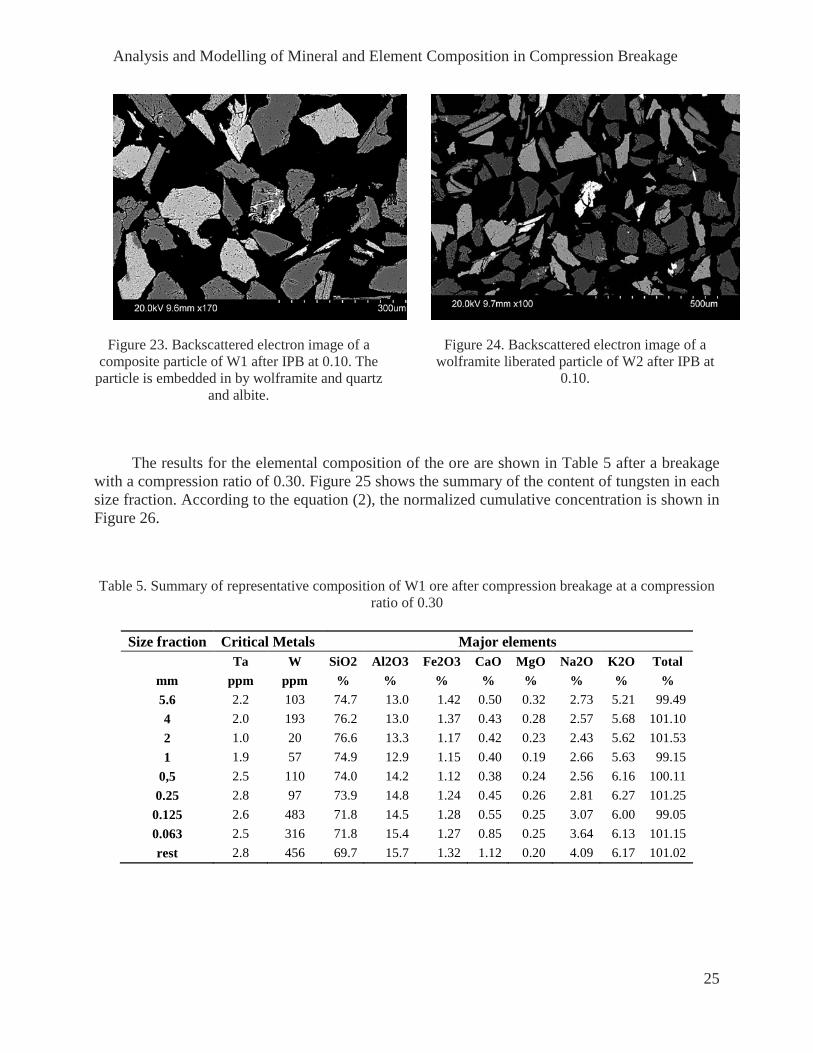
The other main ore mineral in W1 is wolframite. It was observed that the wolframite is mixed with other minerals rich in iron such as iron oxide or iron silicates. Figure 21 to Figure 24 show particles with wolframite in association with other minerals, common associations are with K-feldspar, quarts, albite, iron silicates, muscovite, and biotite. Wolframite particles are different to the scheelite. The wolframite is not an entire grain, on the contrary it is an extension that crosses different minerals and grains, like veins or branches that are occupying a crevice or fissure in the particle. These textures correspond to a vein-like network type, which suggests that a complete liberation would be fairly difficult. Generally, when one particle has wolframite in it, all the particles contain small proportions of it blended in forms of small grains or veins that cross the particle. The liberation of wolframite is difficult and will require the reduction of the particle into very small sizes in order to be able to separate the different minerals.
Figure 21. Backscattered electron image of a composite particle of W1 after IPB at 0.10. The
particle is embedded in by wolframite and quartz and albite.
Figure 22. Backscattered electron image of a composite particle of W1 after IPB at 0.30. The
particle is embedded in by wolframite and quartz.
Analysis and Modelling of Mineral and Element Composition in Compression Breakage
25
Figure 23. Backscattered electron image of a composite particle of W1 after IPB at 0.10. The
particle is embedded in by wolframite and quartz and albite.
Figure 24. Backscattered electron image of a wolframite liberated particle of W2 after IPB at
0.10.
The results for the elemental composition of the ore are shown in Table 5 after a breakage with a compression ratio of 0.30. Figure 25 shows the summary of the content of tungsten in each size fraction. According to the equation (2), the normalized cumulative concentration is shown in Figure 26.
Table 5. Summary of representative composition of W1 ore after compression breakage at a compression ratio of 0.30
Size fraction Critical Metals Major elements Ta W SiO2 Al2O3 Fe2O3 CaO MgO Na2O K2O Total
mm ppm ppm % % % % % % % % 5.6 2.2 103 74.7 13.0 1.42 0.50 0.32 2.73 5.21 99.49 4 2.0 193 76.2 13.0 1.37 0.43 0.28 2.57 5.68 101.10 2 1.0 20 76.6 13.3 1.17 0.42 0.23 2.43 5.62 101.53 1 1.9 57 74.9 12.9 1.15 0.40 0.19 2.66 5.63 99.15
0,5 2.5 110 74.0 14.2 1.12 0.38 0.24 2.56 6.16 100.11 0.25 2.8 97 73.9 14.8 1.24 0.45 0.26 2.81 6.27 101.25
0.125 2.6 483 71.8 14.5 1.28 0.55 0.25 3.07 6.00 99.05 0.063 2.5 316 71.8 15.4 1.27 0.85 0.25 3.64 6.13 101.15 rest 2.8 456 69.7 15.7 1.32 1.12 0.20 4.09 6.17 101.02

Lorena Guldris Leon
26
Figure 25. Measured data from geochemical analysis for W1.
Figure 26. Cumulative normalized concentration for ore W1
5.5.1.2 Tungsten Ore type 2
W2 comes from a scheelite deposit of amphibolites and felsic gneisses. The grade of the deposit is 0.3 mass% located in quartz veins. The main constituents are hornblendites and coarse grained amphibolites. The major minerals present in the ore are amphibole, biotite, quartz, plagioclase, scheelite and some pyrite, pyrrhotite and limonite are present as accessory minerals. The major components of this ore are SiO2 49-78 mass%, Al2O3 4-19 mass%, Fe2O3 0.6-12 mass%,
> 5,64210,50,250,1250,063< 0,063W1-030 103193205711097483316456W1-020 2522813848444772677812W1-010 221373924970200239193241
0100200300400500600700800900
Conc
entr
atio
n [p
pm]
Particle size [mm]
Analysis and Modelling of Mineral and Element Composition in Compression Breakage
27
Na2O 0.3-6 mass%, CaO 3.5-12.5 mass%, MgO 5-38 mass% and K2O 0.8-2.8 mass% (Thalhammer 1987).
Figure 27 and Figure 28 show the product size distribution after a compression breakage with 0.20 compression ratio.
Figure 27. Product particle size distributions for the IPB 20% test series (cumulative) for W2.
Figure 28. Product particle size distributions for the IPB 20% test series (frequency) for W2.
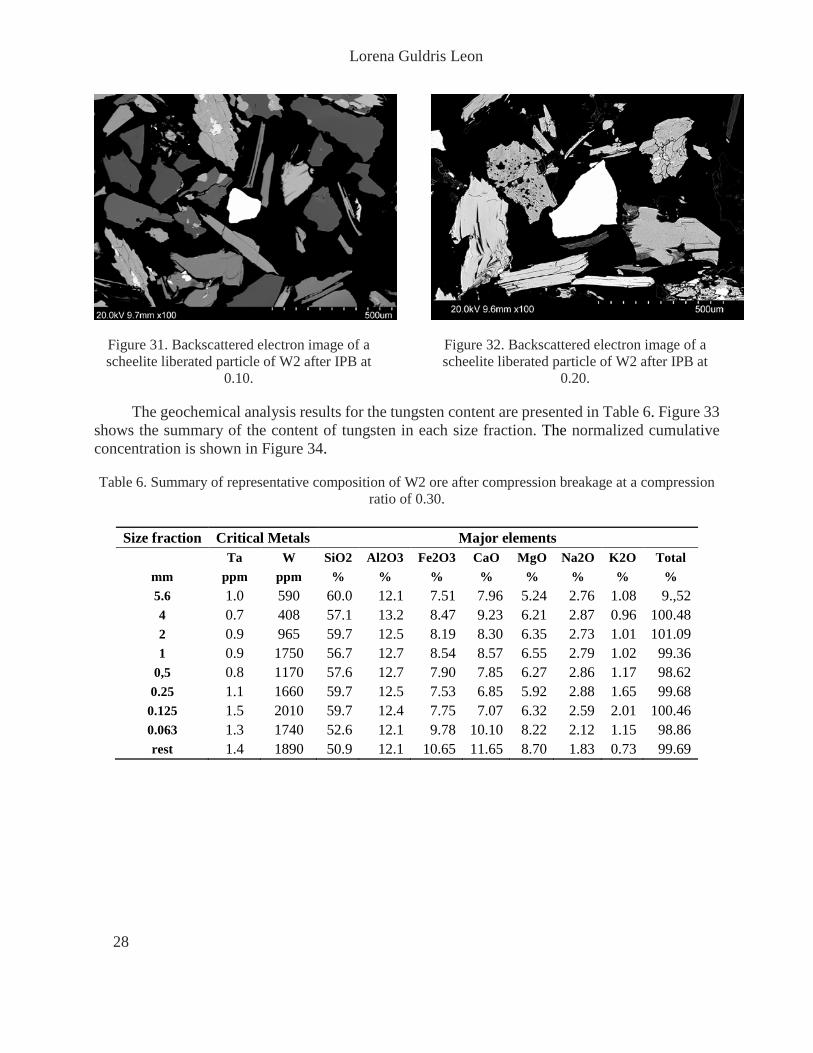
After the compression, size fractions of the product were analysed in SEM. W2 is dominated by major minerals such as quartz, albite, biotite, k-feldspar, chlorite, anorthite, hornblende, calcite and fluorite. The main ore mineral is scheelite. Generally, scheelite was found in association with biotite, K-feldspar, quartz, apatite and albite, as Figure 29 and Figure 30 show. Figure 31 and Figure 32 show liberated scheelite particles, it was common to find liberated scheelite at finer particle size fraction, between 0.063 and 0.125 mm at any compression ratio.
Figure 29. Backscattered electron image of a composite particle of W2 after IPB at 0.30. The particle is embedded in by scheelite and quartz,
apatite, chlorite, hornblende and titanite.
Figure 30. Backscattered electron image of a composite particle of W2 after IPB at 0.10. The particle is embedded in by scheelite and quartz,
hornblende and calcite.
0
20
40
60
80
100
0,05 0,5 5 50
Cum
ulat
ive
Pass
ing
[%]
Particle size [mm]
IPB T10 s/b 20% IPB 11 s/b 20%IPB T12 s/b 20% IPB T13 s/b 20%
0
20
40
60
80
100
0,05 0,5 5 50
Freq
uenc
y Pa
ssin
g [%
]
Particle size [mm]
IPB T10 s/b 20% IPB 11 s/b 20%IPB T12 s/b 20% IPB T13 s/b 20%
Lorena Guldris Leon
28
Figure 31. Backscattered electron image of a scheelite liberated particle of W2 after IPB at
0.10.
Figure 32. Backscattered electron image of a scheelite liberated particle of W2 after IPB at
0.20.
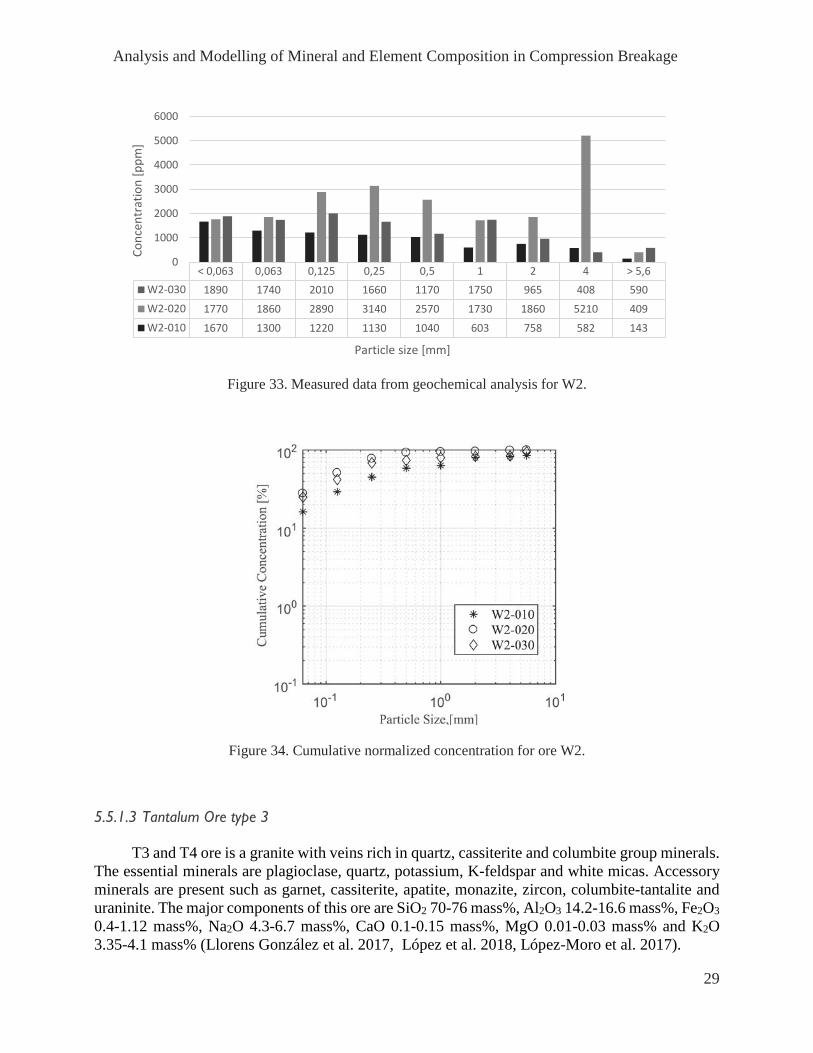
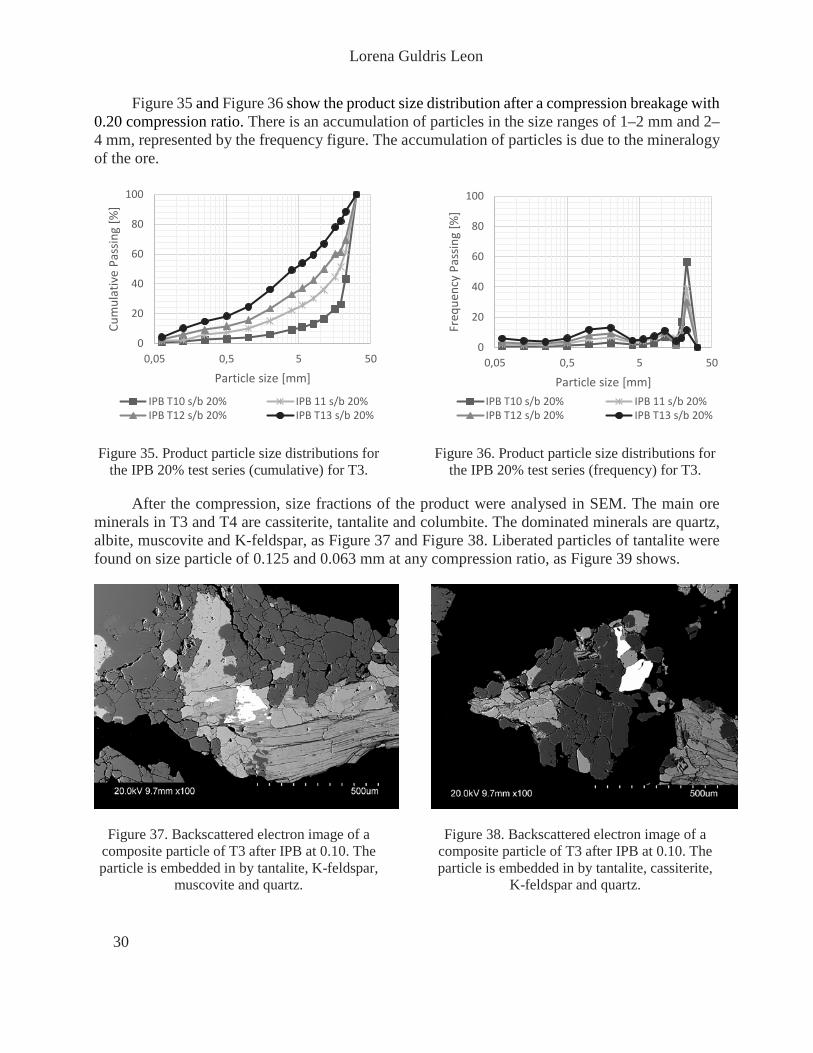
The geochemical analysis results for the tungsten content are presented in Table 6. Figure 33 shows the summary of the content of tungsten in each size fraction. The normalized cumulative concentration is shown in Figure 34.
Table 6. Summary of representative composition of W2 ore after compression breakage at a compression ratio of 0.30.
Size fraction Critical Metals Major elements Ta W SiO2 Al2O3 Fe2O3 CaO MgO Na2O K2O Total
mm ppm ppm % % % % % % % % 5.6 1.0 590 60.0 12.1 7.51 7.96 5.24 2.76 1.08 9.,52 4 0.7 408 57.1 13.2 8.47 9.23 6.21 2.87 0.96 100.48 2 0.9 965 59.7 12.5 8.19 8.30 6.35 2.73 1.01 101.09 1 0.9 1750 56.7 12.7 8.54 8.57 6.55 2.79 1.02 99.36
0,5 0.8 1170 57.6 12.7 7.90 7.85 6.27 2.86 1.17 98.62 0.25 1.1 1660 59.7 12.5 7.53 6.85 5.92 2.88 1.65 99.68
0.125 1.5 2010 59.7 12.4 7.75 7.07 6.32 2.59 2.01 100.46 0.063 1.3 1740 52.6 12.1 9.78 10.10 8.22 2.12 1.15 98.86 rest 1.4 1890 50.9 12.1 10.65 11.65 8.70 1.83 0.73 99.69
Analysis and Modelling of Mineral and Element Composition in Compression Breakage
29
Figure 33. Measured data from geochemical analysis for W2.
Figure 34. Cumulative normalized concentration for ore W2.
5.5.1.3 Tantalum Ore type 3
T3 and T4 ore is a granite with veins rich in quartz, cassiterite and columbite group minerals. The essential minerals are plagioclase, quartz, potassium, K-feldspar and white micas. Accessory minerals are present such as garnet, cassiterite, apatite, monazite, zircon, columbite-tantalite and uraninite. The major components of this ore are SiO2 70-76 mass%, Al2O3 14.2-16.6 mass%, Fe2O3 0.4-1.12 mass%, Na2O 4.3-6.7 mass%, CaO 0.1-0.15 mass%, MgO 0.01-0.03 mass% and K2O 3.35-4.1 mass% (Llorens González et al. 2017, López et al. 2018, López-Moro et al. 2017).
> 5,64210,50,250,1250,063< 0,063W2-030 590408965175011701660201017401890W2-020 40952101860173025703140289018601770W2-010 14358275860310401130122013001670
0
1000
2000
3000
4000
5000
6000
Conc
entr
atio
n [p
pm]
Particle size [mm]
Lorena Guldris Leon
30
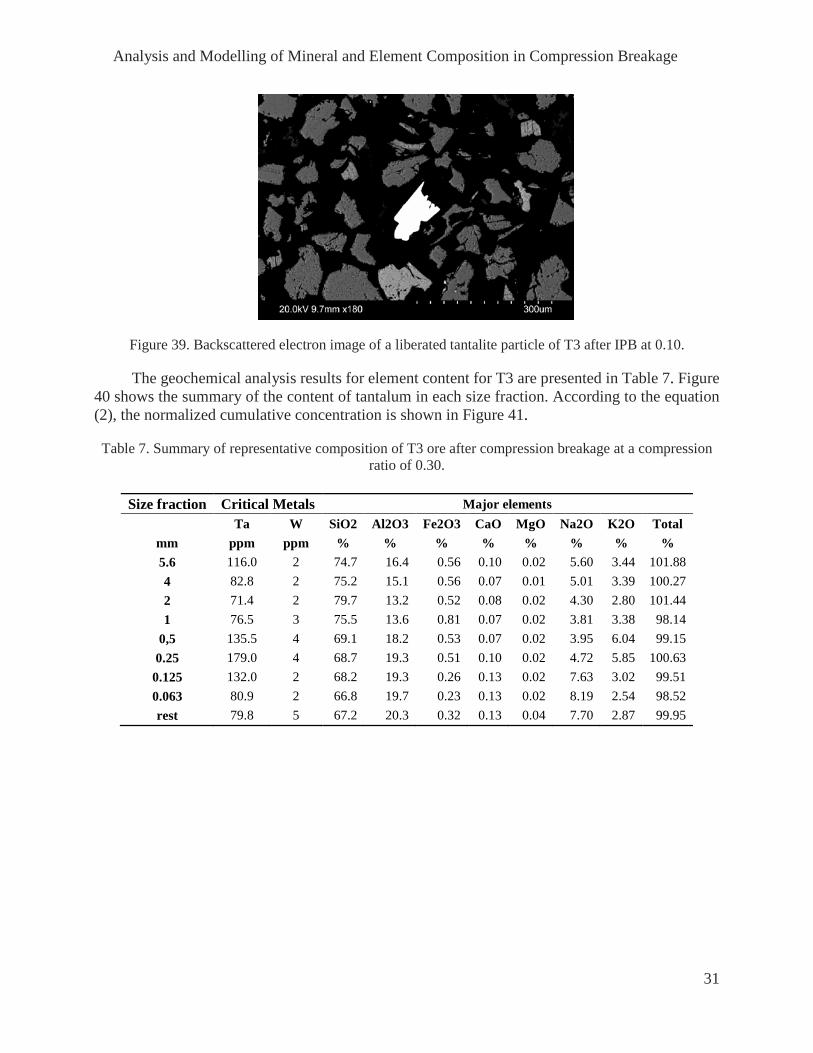
Figure 35 and Figure 36 show the product size distribution after a compression breakage with 0.20 compression ratio. There is an accumulation of particles in the size ranges of 1–2 mm and 2–4 mm, represented by the frequency figure. The accumulation of particles is due to the mineralogy of the ore.
Figure 35. Product particle size distributions for the IPB 20% test series (cumulative) for T3.
Figure 36. Product particle size distributions for the IPB 20% test series (frequency) for T3.
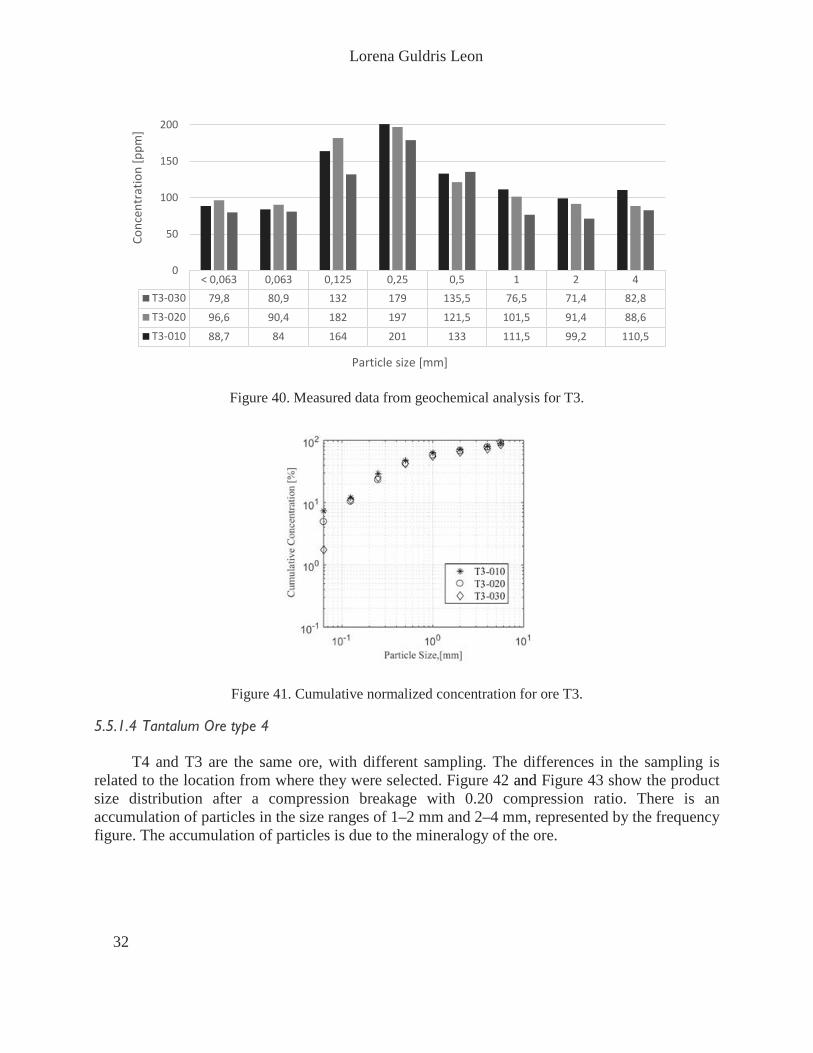
After the compression, size fractions of the product were analysed in SEM. The main ore minerals in T3 and T4 are cassiterite, tantalite and columbite. The dominated minerals are quartz, albite, muscovite and K-feldspar, as Figure 37 and Figure 38. Liberated particles of tantalite were found on size particle of 0.125 and 0.063 mm at any compression ratio, as Figure 39 shows.
Figure 37. Backscattered electron image of a composite particle of T3 after IPB at 0.10. The particle is embedded in by tantalite, K-feldspar,
muscovite and quartz.
Figure 38. Backscattered electron image of a composite particle of T3 after IPB at 0.10. The particle is embedded in by tantalite, cassiterite,
K-feldspar and quartz.
0
20
40
60
80
100
0,05 0,5 5 50
Cum
ulat
ive
Pass
ing
[%]
Particle size [mm]
IPB T10 s/b 20% IPB 11 s/b 20%IPB T12 s/b 20% IPB T13 s/b 20%
0
20
40
60
80
100
0,05 0,5 5 50
Freq
uenc
y Pa
ssin
g [%
]
Particle size [mm]IPB T10 s/b 20% IPB 11 s/b 20%IPB T12 s/b 20% IPB T13 s/b 20%
Analysis and Modelling of Mineral and Element Composition in Compression Breakage
31
Figure 39. Backscattered electron image of a liberated tantalite particle of T3 after IPB at 0.10.
The geochemical analysis results for element content for T3 are presented in Table 7. Figure 40 shows the summary of the content of tantalum in each size fraction. According to the equation (2), the normalized cumulative concentration is shown in Figure 41.
Table 7. Summary of representative composition of T3 ore after compression breakage at a compression ratio of 0.30.
Size fraction Critical Metals Major elements Ta W SiO2 Al2O3 Fe2O3 CaO MgO Na2O K2O Total
mm ppm ppm % % % % % % % % 5.6 116.0 2 74.7 16.4 0.56 0.10 0.02 5.60 3.44 101.88 4 82.8 2 75.2 15.1 0.56 0.07 0.01 5.01 3.39 100.27 2 71.4 2 79.7 13.2 0.52 0.08 0.02 4.30 2.80 101.44 1 76.5 3 75.5 13.6 0.81 0.07 0.02 3.81 3.38 98.14
0,5 135.5 4 69.1 18.2 0.53 0.07 0.02 3.95 6.04 99.15 0.25 179.0 4 68.7 19.3 0.51 0.10 0.02 4.72 5.85 100.63
0.125 132.0 2 68.2 19.3 0.26 0.13 0.02 7.63 3.02 99.51 0.063 80.9 2 66.8 19.7 0.23 0.13 0.02 8.19 2.54 98.52 rest 79.8 5 67.2 20.3 0.32 0.13 0.04 7.70 2.87 99.95
Lorena Guldris Leon
32
Figure 40. Measured data from geochemical analysis for T3.
Figure 41. Cumulative normalized concentration for ore T3.
5.5.1.4 Tantalum Ore type 4
T4 and T3 are the same ore, with different sampling. The differences in the sampling is related to the location from where they were selected. Figure 42 and Figure 43 show the product size distribution after a compression breakage with 0.20 compression ratio. There is an accumulation of particles in the size ranges of 1–2 mm and 2–4 mm, represented by the frequency figure. The accumulation of particles is due to the mineralogy of the ore.
4210,50,250,1250,063< 0,063T3-030 82,871,476,5135,517913280,979,8T3-020 88,691,4101,5121,519718290,496,6T3-010 110,599,2111,51332011648488,7
0
50
100
150
200Co
ncen
trat
ion
[ppm
]
Particle size [mm]

Analysis and Modelling of Mineral and Element Composition in Compression Breakage
33
Figure 42. Product particle size distributions for the IPB 20% test series (cumulative) for T4.
Figure 43. Product particle size distributions for the IPB 20% test series (frequency) for T4.
Figure 44, Figure 45 and Figure 46 show composite particles. Liberated particles of tantalite were found at fractions of 0.125 and 0.063 mm at any compression ratio, as shown in Figure 47.
Figure 44. Backscattered electron image of a composite particle of T4 after IPB at 0.10. The particle is embedded in by tantalite, K-feldspar
and muscovite.
Figure 45. Backscattered electron image of a composite particle of T4 after IPB at 0.10. The particle is embedded in by tantalite, K-feldspar
and albite.
0
20
40
60
80
100
0,05 0,5 5 50
Cum
ulat
ive
Pass
ing
[%]
Particle size [mm]
IPB T10 s/b 20% IPB 11 s/b 20%IPB T12 s/b 20% IPB T13 s/b 20%
0
20
40
60
80
100
0,05 0,5 5 50
Freq
uenc
y Pa
ssin
g [%
]
Particle size [mm]
IPB T10 s/b 20% IPB 11 s/b 20%IPB T12 s/b 20% IPB T13 s/b 20%
Lorena Guldris Leon
34
Figure 46. Backscattered electron image of a composite particle of T4 after IPB at 0.20. The
particle is embedded in by tantalite, albite and K-feldspar.
Figure 47. Backscattered electron image of a tantalite liberated particle of T4 after IPB at
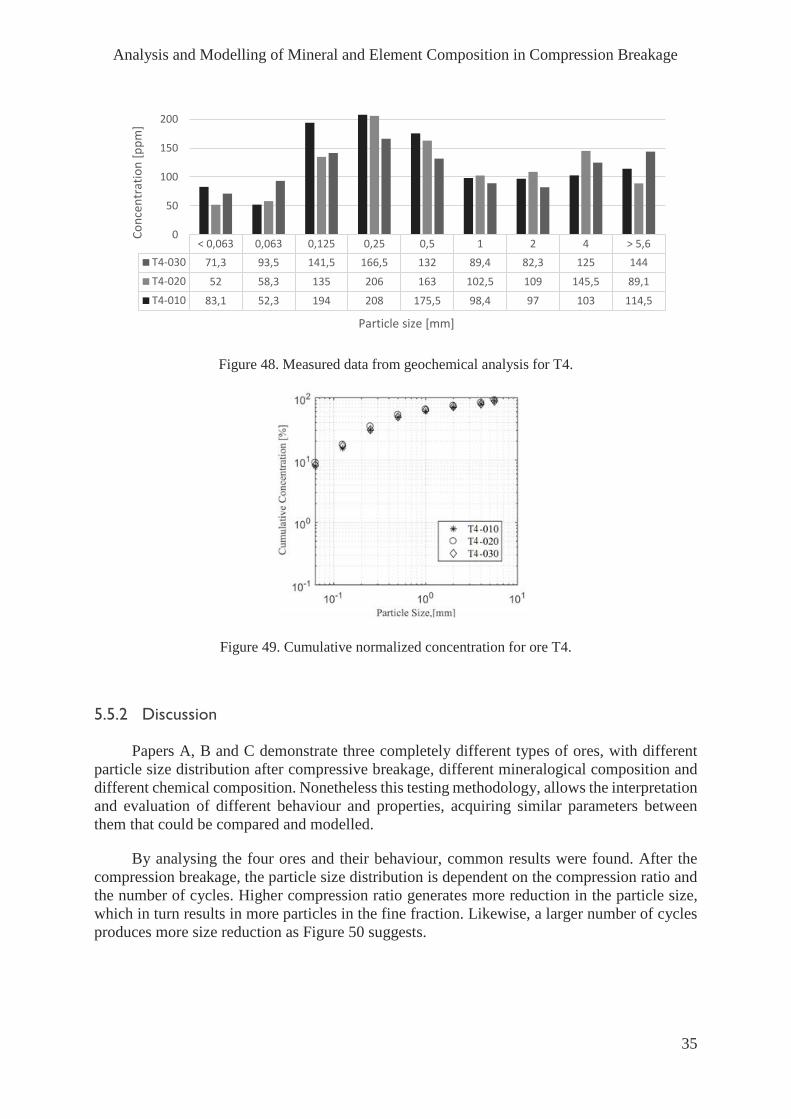
0.10.
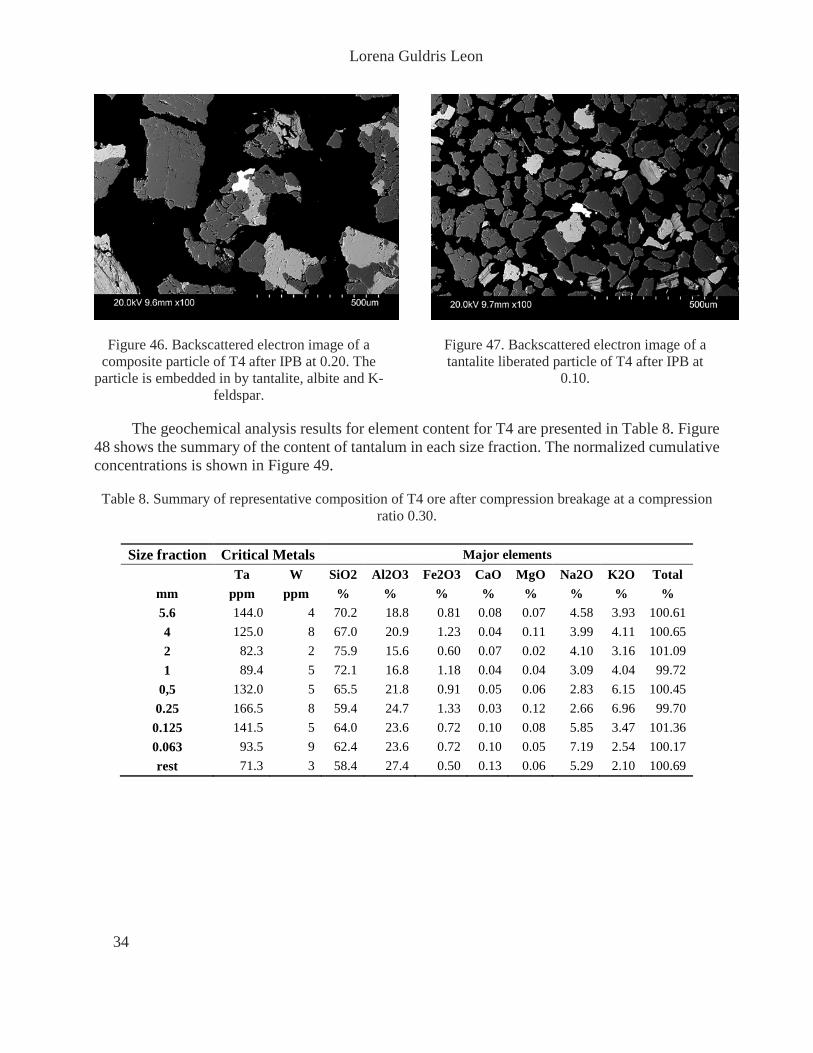
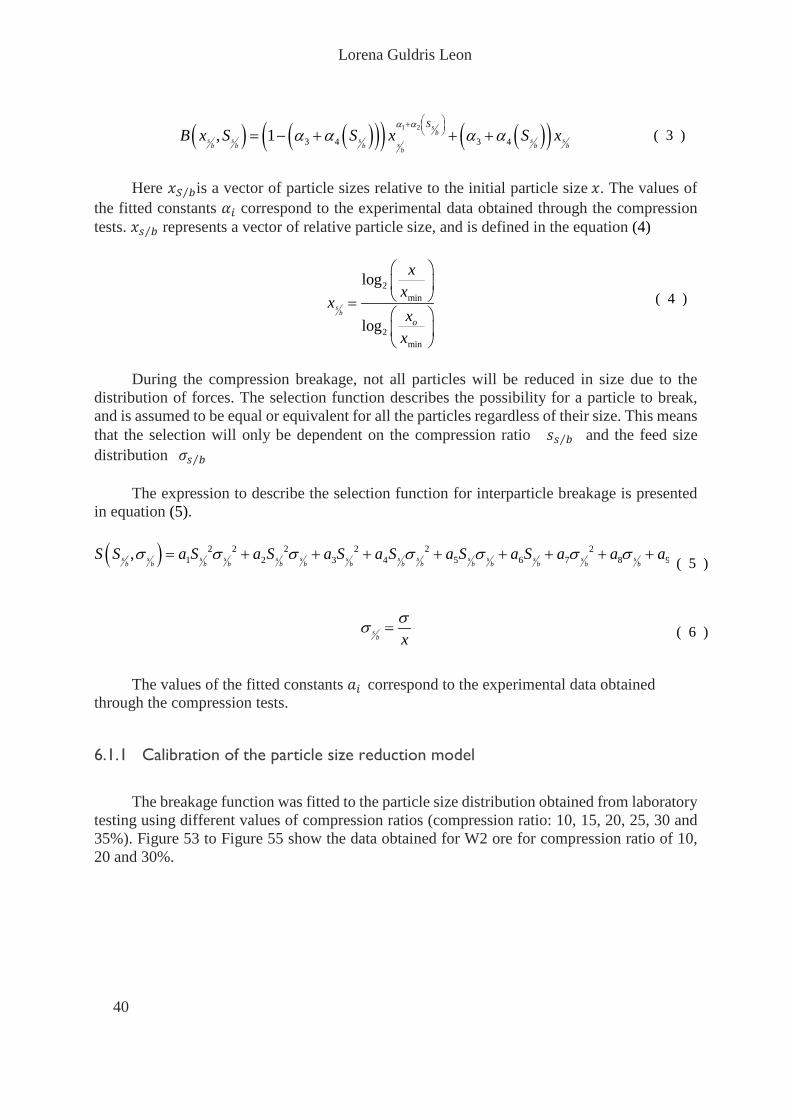
The geochemical analysis results for element content for T4 are presented in Table 8. Figure 48 shows the summary of the content of tantalum in each size fraction. The normalized cumulative concentrations is shown in Figure 49.
Table 8. Summary of representative composition of T4 ore after compression breakage at a compression ratio 0.30.
Size fraction Critical Metals Major elements Ta W SiO2 Al2O3 Fe2O3 CaO MgO Na2O K2O Total
mm ppm ppm % % % % % % % % 5.6 144.0 4 70.2 18.8 0.81 0.08 0.07 4.58 3.93 100.61 4 125.0 8 67.0 20.9 1.23 0.04 0.11 3.99 4.11 100.65 2 82.3 2 75.9 15.6 0.60 0.07 0.02 4.10 3.16 101.09 1 89.4 5 72.1 16.8 1.18 0.04 0.04 3.09 4.04 99.72
0,5 132.0 5 65.5 21.8 0.91 0.05 0.06 2.83 6.15 100.45 0.25 166.5 8 59.4 24.7 1.33 0.03 0.12 2.66 6.96 99.70
0.125 141.5 5 64.0 23.6 0.72 0.10 0.08 5.85 3.47 101.36 0.063 93.5 9 62.4 23.6 0.72 0.10 0.05 7.19 2.54 100.17 rest 71.3 3 58.4 27.4 0.50 0.13 0.06 5.29 2.10 100.69
Analysis and Modelling of Mineral and Element Composition in Compression Breakage
35
Figure 48. Measured data from geochemical analysis for T4.
Figure 49. Cumulative normalized concentration for ore T4.
5.5.2 Discussion
Papers A, B and C demonstrate three completely different types of ores, with different particle size distribution after compressive breakage, different mineralogical composition and different chemical composition. Nonetheless this testing methodology, allows the interpretation and evaluation of different behaviour and properties, acquiring similar parameters between them that could be compared and modelled.
By analysing the four ores and their behaviour, common results were found. After the compression breakage, the particle size distribution is dependent on the compression ratio and the number of cycles. Higher compression ratio generates more reduction in the particle size, which in turn results in more particles in the fine fraction. Likewise, a larger number of cycles produces more size reduction as Figure 50 suggests.
> 5,64210,50,250,1250,063< 0,063T4-030 14412582,389,4132166,5141,593,571,3T4-020 89,1145,5109102,516320613558,352T4-010 114,51039798,4175,520819452,383,1
0
50
100
150
200Co
ncen
trat
ion
[ppm
]
Particle size [mm]

Lorena Guldris Leon
36
Figure 50. Compression ratio and its influence on size reduction.
The surface analysis with SEM gives qualitative information on the minerals that constitute the particle. With this method it is possible to identify how minerals fracture and how simple the liberation is. In the case of W1 the use of SEM is extremely important due to the fact that this ore has two minerals with tungsten, scheelite and wolframite. Even when both minerals contain tungsten, the texture is different, causing the necessity of using different techniques for the comminution of both minerals. Wolframite require high reduction, as was observed in the SEM pictures, while scheelite is easily liberated with normal comminution process.
Likewise, this method allows the identification of other minerals related to the rare metal mineral. For example, for ores W2, T3 and T4, a strong relation was observed between micas and critical metals. The tantalite and scheelite was generally sitting together with the muscovite, biotite or other micas. Micas are a brittle mineral due to its crystalline structure, so less energy is required to break it and to achieve the size reduction of its particles. This type of mineral rupture generated finer particles and good liberation during the early stages of the breakage process. As the critical mineral was sitting together with the micas, the critical mineral is going to be easily liberated or located in finer size fractions. The coarser fraction is going to be formed mainly by the hardest minerals such as quartz and K-feldspar. Figure 51 suggests the theoretical distribution of the minerals after the size reduction.

Analysis and Modelling of Mineral and Element Composition in Compression Breakage
37
Figure 51. Schematic model of theoretical distribution of minerals.
In regards to the element concentration, major, minor and traces elements, exhibit a smooth variation in concentration with respect to particle size fraction, this means that the distribution cannot be defined as unimodal. This fact is an indication that when the breakage occurs, the minerals are broken differently and into different sizes. Nevertheless, the element concentration did not show any relation to the compression ratio. No relation between the variation in the element content and the value of compression ratio at different sizes was evident in any of the ores.
Another general observation was that some major elements, specifically silica and aluminium presented smaller variations in each size fractions. Quartz is the main mineral that forms these ores and its volume could represent between 45 and 80% of the total volume. For large amounts of mineral content, it would be expected that its concentration would present low variation in different size fractions.
As was mentioned before, the element concentration is a quantitative method capable of measuring the amount of an element in the sample. However, this value cannot be directly related to the minerals or the amount of, minerals, in particular when two or more minerals contribute to the same element. Likewise, this analytical data is not related to the liberation of particles.

Lorena Guldris Leon
38

Analysis and Modelling of Mineral and Element Composition in Compression Breakage
39
6 MODELLING
The aim of this chapter is to: − Present the particle size model and its calibration. − Describe the concentration model.
6.1 MODELLING PARTICLE SIZE
The compressive reduction process consists of two basic mechanisms: selection of the particles for breakage (S) and breakage of the particles (B). The presented model is based on the work of Evertsson (2000). The model predicts the size distribution as a function of compressing forces and material characteristics. In his work the inter-particle breakage (IPB) test was modelled using a nonlinear regression model following the principle presented by Whiten (1972), and is based on the population balance model presented by Broadbent and Callcott (1956). The model is presented in Figure 52. The selection, S, represents the probability of a particle being broken, and breakage, B, represents the way a particle is broken.
Figure 52. Simplified model of a reduction cycle
The breakage function describes how a compressed particle breaks into smaller fragments. The outcome of this function is the resulting particle size distribution, which is expressed cumulatively. The relative breakage of particles is dependent only on the applied compression ratio 𝑠𝑠𝑠𝑠 𝑏𝑏⁄ . According to Evertsson, the breakage function for interparticle breakage is represented in equation (3).
Lorena Guldris Leon
40
( ) ( )( )( ) ( )( )1 2
3 4 3 4, 1s
bs s s s ssb b b b bb
SB x S S x S x
α αα α α α
+ = − + + + ( 3 )
Here 𝑥𝑥𝑆𝑆 𝑏𝑏⁄ is a vector of particle sizes relative to the initial particle size 𝑥𝑥. The values of
the fitted constants 𝛼𝛼𝑖𝑖 correspond to the experimental data obtained through the compression tests. 𝑥𝑥𝑠𝑠 𝑏𝑏⁄ represents a vector of relative particle size, and is defined in the equation (4)
2min
2min
log
logs
bo
xx
xx
x
=
( 4 )
During the compression breakage, not all particles will be reduced in size due to the
distribution of forces. The selection function describes the possibility for a particle to break, and is assumed to be equal or equivalent for all the particles regardless of their size. This means that the selection will only be dependent on the compression ratio ( 𝑠𝑠𝑠𝑠 𝑏𝑏⁄ ) and the feed size distribution (𝜎𝜎𝑠𝑠 𝑏𝑏⁄ )
The expression to describe the selection function for interparticle breakage is presented
in equation (5).
( ) 2 2 2 2 2 21 2 3 4 5 6 7 8 9,s s s s s s s s s s s s s s
b b b b b b b b b b b b b bS S a S a S a S a S a S a S a a aσ σ σ σ σ σ σ= + + + + + + + +
( 5 )
sb x
σσ = ( 6 )
The values of the fitted constants 𝑎𝑎𝑖𝑖 correspond to the experimental data obtained
through the compression tests.
6.1.1 Calibration of the particle size reduction model
The breakage function was fitted to the particle size distribution obtained from laboratory
testing using different values of compression ratios (compression ratio: 10, 15, 20, 25, 30 and 35%). Figure 53 to Figure 55 show the data obtained for W2 ore for compression ratio of 10, 20 and 30%.

Analysis and Modelling of Mineral and Element Composition in Compression Breakage
41
Figure 53. Comparison between the simulated and measured data of the particle size
distribution for W2 at 10% of compression ratio.
Figure 54. Comparison between the simulated and measured data of the particle size
distribution for W2 at 20% of compression ratio.
Figure 55. Comparison between the simulated and measured data of the particle size distribution for W2 at 30% of compression ratio.
As can be seen in the figures, the model correlates well with the measured data. Also, from the results it is possible to conclude that the size reduction is affected by the compression ratio. At higher compression ratio the reduction will be higher.
The same validation process was applied for all ores. The fitted breakage function for each ore is described in Paper B and Paper C.
6.2 MODELLING OF CONCENTRATION
As previously stated, during coarse comminution the available models are able to predict size reduction, size distribution, capacity and energy composition. This chapter aims to increase the resolution of the crusher models, considering or adding new factors that haven’t been considered previously. One important concept is the liberation, however, in coarse

Lorena Guldris Leon
42
comminution the liberation is minor due to the sizes of the particles. During crushing processes the particle size occurs in millimetres, when in general the liberation occurs in microns range. This explains the reason that it is complex to include liberation concepts in coarse comminution models. Despite this after the characterisation of different ores it was observed that the distribution of certain elements are not homogeneous or constant in each size fraction, this opens up new possibilities to model the distribution of the critical elements after compressive breakage. Paper D describes the methodology to develop a model capable of predicting the critical element concentration.
6.2.1 Development of the model
The Weibull distribution has been used for modelling reliability distributions and it is well known for its flexibility. The Weibull distribution is shown in equation (7). The parameters λ and ν are calibration constants that can be determined by the Weibull diagram. As shown in Figure 56 by working mathematically with equation (2) it is possible to obtain the following equations. Equation (8) is obtained by rearranging the terms in the equation, whereas equation (9) is obtained applying the logarithm twice in the equation.
( ) ( )1x vF x e λ−= − ( 7 )
( )( )1
1x ve
F xλ=
− ( 8 )
( ) ( ) ( )1ln ln ln ln1
v x vF x
λ
= − − ( 9 )
For a better visualization, equation (9) can be transformed into equation (10) to (13).
( )1ln ln
1Y
F x
= − ( 10 )
( )lnX x= ( 11 )
( )lnC v λ= − ( 12 )
Y vX C= + ( 13 )
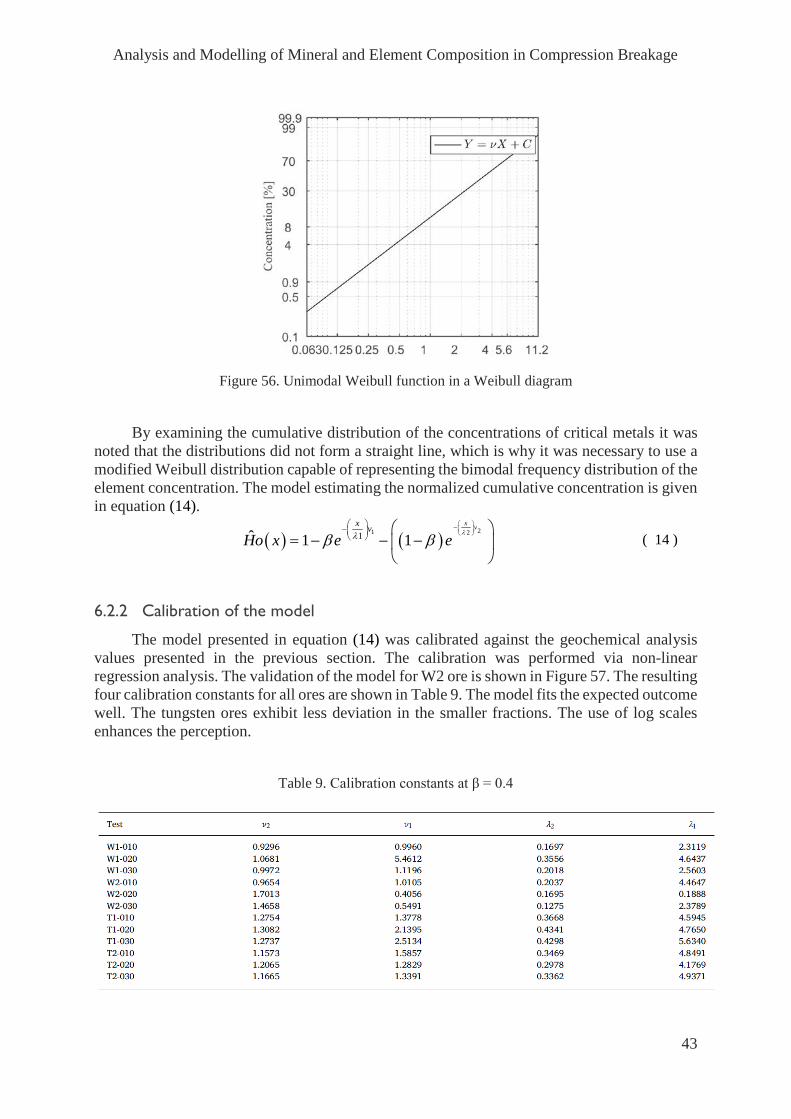
Analysis and Modelling of Mineral and Element Composition in Compression Breakage
43
Figure 56. Unimodal Weibull function in a Weibull diagram
By examining the cumulative distribution of the concentrations of critical metals it was
noted that the distributions did not form a straight line, which is why it was necessary to use a modified Weibull distribution capable of representing the bimodal frequency distribution of the element concentration. The model estimating the normalized cumulative concentration is given in equation (14).
( ) ( )21 21ˆ 1 1
x vx vHo x e e
λλβ β −
−
= − − −
( 14 )
6.2.2 Calibration of the model
The model presented in equation (14) was calibrated against the geochemical analysis values presented in the previous section. The calibration was performed via non-linear regression analysis. The validation of the model for W2 ore is shown in Figure 57. The resulting four calibration constants for all ores are shown in Table 9. The model fits the expected outcome well. The tungsten ores exhibit less deviation in the smaller fractions. The use of log scales enhances the perception.
Table 9. Calibration constants at β = 0.4
Lorena Guldris Leon
44
Figure 57. Calibration of cumulative concentration against W2
6.2.3 Application of the model
The model for simulating the absolute elemental concentration brings new opportunities and applications since increasing the resolution of coarse comminution models. Nevertheless, this model must be combined with other modelling components in the crusher model. Coarse comminution models are capable of predicting process data (output) by using mathematical models once the operating parameters (input) are known in Figure 58. Generally, the process data for coarse comminution is limited to the prediction of the energy consumption, capacity and particle size distribution. The possibility to evaluate material properties to the prediction of element concentration increase the resolution.
Figure 58. Predictive modelling parameters for coarse comminution.
Analysis and Modelling of Mineral and Element Composition in Compression Breakage
45
7 IMPLEMENTATION -
CASE STUDY The aim of this chapter is to:
− Verify the usefulness of the developed concentration model in a case study. − Describe how a plant can be optimized by using the concentration model in a
cone crusher.
The concentration model itself offers limited information, but when it is combined with other models proposed by previous researchers in Chalmers Rock Processing System, it is possible to attain more details of the process and offer improvements in the process.
The aim of this section is to demonstrate a theoretical case where the concertation model allows educated or well-based estimations of how a plant should be designed. One of the ores that were analysed was W2. The W2 plant was analysed in order to propose theoretical arranging that could benefit the process. Figure 59 show the configuration of the W2 plant. The process starts with a conveyor that transports the material to the jaw crushers. After the primary reduction the material goes through a second conveyor to a screen that will divide the material flow into three parts depending on the sizes. The first product will return to the primary reduction step. The second product goes to the cone crusher in order to be reduced in size again and the third product goes to the gyratory crusher. After the cone crusher the fraction between 0-10mm is fed into the ball mill, to later be classified and sent to future separation processes. The concentration model was developed for particle sizes smaller than 12 mm, and the application of this model therefore corresponds to the cone crusher.

Lorena Guldris Leon
46
+10 mm-0.5 mm
Figure 59. W2 ore dressing plant.
The tungsten distribution in different size fractions after the reduction step in the cone crusher is shown in Figure 60. The metal content in different size fractions is not homogeneous, and varies by the size of the particles. For size fractions smaller than 500 microns, high concentration of the element has been observed. This fact suggests that carrying out an early separation of the material after the cone crusher could benefit the process, but the early separation should be connected with an increase in the generation of fine particles.
Figure 60. Predictive modelling of the tungsten concentration in W2 ore after compressive breakage.
The increase of the fine particles will be achieved by changing the machine parameters, such as the close side setting of the machine (CSS). Higher opening values will generate larger particles and closer opening values will generate finer particles. It is known that the tungsten concentration will be larger in fine particles, which is why the creation of more fine particles is desirable and hence why closer values of CSS are suggested.
Analysis and Modelling of Mineral and Element Composition in Compression Breakage
47
The increase of fine particles must be accompanied by a screening and classification before the milling stage. Not separating this product could generate risk of overgrinding during the milling process and using more energy than necessary. The separation by size could be done by placing a classifier after the cone crusher. The classifier will allow the finest material (sizes smaller than 1mm) to be sent to separation processes such as flotation. On the other hand, the largest particles (sizes larger than 1mm) will be sent to the milling process in order to be reduced in size. The fraction between 0 and 1mm represents18% of the total fraction. By reducing the mass flow by up to 18 % into the mill a huge amount of energy could be saved.
Evidently the integration of a new machine will generate an investment cost in equipment and additional maintenance, but this could be solved by rearranging the equipment that the plant already has. Figure 61 and Figure 62 show both options of rearrangement, case one by adding an extra classifier, and case two by moving an existing classifier.
Figure 61. Theoretical suggestion for rearrangement of W2 plant. Case 1, additional pre-mill screening.
Figure 62. Theoretical suggestion for rearrangement of W2 plant. Case 2, pre-mill classifier.
+4 mm
-4mm
-1mm
+4 mm
-1mm
-4mm

Lorena Guldris Leon
48

Analysis and Modelling of Mineral and Element Composition in Compression Breakage
49
8 DISCUSSIONS AND
CONCLUSION The aim of this chapter is to:
− Present the most important conclusions drawn in this thesis. − Answer the research questions stated in Chapter 2. − Discuss what has been found as important for future work but not researched.
The purpose of this work was to investigate how ore characteristics can be measured and
integrated into coarse comminution models, followed by developing a test procedure capable of predicting the critical metal concentration as a function of the particle size distribution after a compression cycle in a crushing process.
The main hypothesis of this research stated that critical metals are not evenly distributed
in different size fractions during coarse comminution processes, since the breakage of particles is affected by the mineralogy and texture. Furthermore, it has been demonstrated how significant the impact of having a better understanding of minerology has when working with breakage.
8.1 GENERAL
The research results that have been discussed aimed at increasing the platform for modelling the compressive breakage. A test procedure capable of analysing ore characteristics after compressive breakage forces has been integrated into coarse comminution routines. The procedure includes mechanical characterisation of the particles after compressive breakage as well as mineralogical analysis through the use of a Scanning Electron Microscope and element concentration completed by geochemical analysis. The procedure is capable of measuring the element concentration and identifying minerals in different size fractions after a cycle of the compressive crushing sequence. Moreover a model with the capability to analyse the critical metal concentration as a function of the particle size distribution has been developed. In order to achieve this, four ores of tungsten and tantalum were evaluated and characterized.

Lorena Guldris Leon
50
Some general conclusions are formulated below:
• It is possible to achieve liberation of critical metals after coarse comminution processes, however the amount of liberated particles is low.
• The developed test methodology, allow the interpretation, evaluation and comparison of different ores with different behaviour and properties by acquiring similar parameters.
• Different types of ores with different mechanical and chemical behaviour show similar properties that can be analysed and modelled for, for example, the critical metals content.
• Different types of ores with different mineral composition show the same type of breakage and accumulation of minerals in different fractions, such as for example, an accumulation of micas and critical metals in fine particle size fractions.
• The distribution of critical metals after a series of compressive breakage processes has been evaluated. It has been observed that the critical elements are not evenly distributed in different size fractions during coarse comminution processes.
• It is possible to model the critical metal content in different size fraction after a series of compressive breakage processes.
• Plant performance and cone crusher performance could be improved by incorporating the composition model.
• The resolution of the comminution models has been increased by the addition of the concentration model. The material properties could be used as an input parameter, to get the element concentration as an output.
8.2 ANSWERS TO RESEARCH QUESTIONS
The following answers are given to the research questions stated in Chapter 2 of this thesis:
RQ 1) What type of material properties beside particle size need to be analysed in order
to model element grade?
It is necessary to analyse more properties in addition to particle size distribution. An ore is an aggregate of minerals. When an ore is broken and divided into different particles, each of these particles is going to have different composition. Each particle will be constituted by different minerals in different portions, therefore the element grade will vary in each of them. By analysing element concentration in different particle size fraction it is possible to construct a model that reflects what occurs in each size fraction.
RQ 2) How can liberation in coarse comminution be measured?
The liberation during coarse comminution process can be investigated through the use of a Scanning Electron Microscope. SEM is a qualitative method in which it is possible to examine and identify mineral composition in the particles. During the analysis it is possible to evaluate how a particle is composed, if it is integrated by one mineral or if it is a composite particle. When a particle is integrated by only one mineral it is considered to be liberated, and this is possible to analyse by the use of SEM.

Analysis and Modelling of Mineral and Element Composition in Compression Breakage
51
RQ 3) Is it possible to achieve liberation of critical metals in coarse comminution?
Yes, it is possible to achieve liberation of critical metals minerals during coarse comminution processes. It was demonstrated that after a repeated compression at different compression ratios, it is possible to find liberated particles in sizes fractions finer than 0.125 mm.
RQ 4) What factors influence the concentration distribution and how can it be measured?
The element concentration could be measured by performing a geochemical analysis of the rock. The geochemical analysis is a qualitative method that measures the content of different elements in the rock sample. By analysing the element concentration in different size faction particles, after compressive breakage, it is possible to analyse the distribution of the critical elements.
When an ore is broken and divided into different particles, each of these particles is going
to have different composition. Each particle will be constituted by different minerals in different portions, therefore the element grade will vary in each of them. By analysing the element concentration in different particles size fractions, after compressive breakage, it is possible to analyse the distribution of the critical elements.
RQ 5) How can concentration of critical metals be modelled?
A model procedure has been developed where it is possible to predict the concentration of critical metals after a series of compressive crushing. The critical element concentration needs to be normalized and presented as cumulative distribution. The normalized cumulative element concentration can be modelled by using a bimodal Weibull distribution.
RQ 6) How can coarse comminution improve the extraction of critical metals?
An industrial case study has demonstrated where in the process improvements can be made to enhance the performance. By using the concentration model in a cone crusher from the plant, it was perceived that in finer particle sizes the concentration of tungsten was higher. To ensure an improvement it is first necessary to change machine settings in the cone crusher in order to produce finer particles. By then adding an extra screening and classifying particles by size before the milling stage the finest material (sizes smaller than 1mm) will be sent to a separation processes such as for example, flotation. The largest particles (sizes larger than 1mm) will be sent to the milling process in order to be reduced in size. By reducing the mass flow into the mill, energy could be saved.
Lorena Guldris Leon
52
Analysis and Modelling of Mineral and Element Composition in Compression Breakage
53
9 FUTURE WORK
The aim of this chapter is to: − Discuss what has been found important for future work but so far not researched.
The work presented in this thesis has been dedicated to the development of a test procedure capable of measuring ore characteristics and integrating them into coarse comminution models. A model was developed which has the capability to predict critical element concentration after repeated compression at different compression ratios. This model could be expanded by analysing the behaviour of major elements and proposing a model capable of predicting their concentration as a function of the size particle.
Moreover, element concentration is not the only ore characteristic that could be measured and integrated in coarse comminution models. It was observed that minerals are also not evenly distributed in different size fractions after compression breakage, but this affirmation was not quantified. Quantification of minerals in different size fractions is necessary to develop new models that relate mineralogy with particle size distribution.
Another characteristic that needs to be quantified is liberation of particles. It was observed that it is possible to achieve liberation during coarse comminution, however it is necessary to have quantitative data in order to develop a liberation model for coarse comminution. Quantitative data of liberation and minerals can be obtained by performing mineral liberation analysis (MLA) or Quantitative Evaluation of Minerals by SCANning electron microscopy (QEMSCAN).
The concentration model was validated for low grade ores of tantalum and tungsten. The next step could include the validation of this model for other types of ores, as well validating the possibility to apply this model to high grade ores.
A plant validation is needed for future work. Working with real data will increase the value of the concentration model and its possibilities. By analysing real cases and real data it will be possible to validate the usage of the model and its capacities.
Lorena Guldris Leon
54
REFERENCES A. M. Gaudin (1939): Principles of Mineral Dressing. By A. M. Gaudin. In J. Phys. Chem. 44 (4), pp. 532–533. DOI: 10.1021/j150400a020.
Alfonso, P.; Castro, D.; Garcia-Valles, M.; Tarragó, M.; Tomasa, O.; Martínez, S. (2016): Recycling of tailings from the Barruecopardo tungsten deposit for the production of glass. In J Therm Anal Calorim 125 (2), pp. 681–687. DOI: 10.1007/s10973-016-5332-y.
Bazin, C.; Grant, R.; Cooper, M.; Tessier, R. (1994): A method to predict metallurgical performances as a function of fineness of grind. In Minerals Engineering 7 (10), pp. 1243–1251. DOI: 10.1016/0892-6875(94)90115-5.
Bengtsson, Magnus (2009): Quality-driven production of aggregates in crushing plants. Göteborg: Chalmers Univ. of Technology (Doktorsavhandlingar vid Chalmers Tekniska Högskola, N.S., 2934).
British Geological Survey (2012): Annual Science Review 2011-12. Nottingham: NERC.
Broadbent, S. R.; Callcott, T. G. (1956): A Matrix Analysis of Processes Involving Particle Assemblies. In Philosophical Transactions of the Royal Society A: Mathematical, Physical and Engineering Sciences 249 (960), pp. 99–123. DOI: 10.1098/rsta.1956.0016.
Carrasco, C.; Keeney, L.; Napier-Munn, T. J. (2016a): Methodology to develop a coarse liberation model based on preferential grade by size responses. In Minerals Engineering 86, pp. 149–155. DOI: 10.1016/j.mineng.2015.12.013.
Carrasco, C.; Keeney, L.; Walters, S. G. (2016b): Development of a novel methodology to characterise preferential grade by size deportment and its operational significance. In Minerals Engineering 91, pp. 100–107. DOI: 10.1016/j.mineng.2015.08.013.
Evertsson, Carl Magnus (2000): Cone crusher performance. Göteborg: Chalmers Univ. of Technology (Doktorsavhandlingar vid Chalmers Tekniska Högskola, N.S., 1551).
Fandrich, R. G.; Bearman, R. A.; Boland, J.; Lim, W. (1997): Mineral liberation by particle bed breakage. In Minerals Engineering 10 (2), pp. 175–187. DOI: 10.1016/S0892-6875(96)00144-6.
Gay, S. L. (2004): A liberation model for comminution based on probability theory. In Minerals Engineering 17 (4), pp. 525–534. DOI: 10.1016/j.mineng.2003.11.012.
Hesse, Max; Popov, Oleg; Lieberwirth, Holger (2017): Increasing efficiency by selective comminution. In Minerals Engineering 103-104, pp. 112–126. DOI: 10.1016/j.mineng.2016.09.003.
Hulthén, Erik (2010): Real-Time Optimization of Cone Crushers. PhD. Chalmers University of Technology. Available online at http://publications.lib.chalmers.se/records/fulltext/128844.pdf, checked on 10/7/2017 AM.
King, R. P.; Schneider, C. L. (1998): Mineral liberation and the batch communition equation. In Minerals Engineering 11 (12), pp. 1143–1160. DOI: 10.1016/S0892-6875(98)00102-2.
Lee, Elisabeth (2012): Optimization of compressive crushing. Göteborg: Chalmers University of Technology (Doktorsavhandlingar vid Chalmers tekniska högskola, 0346-718X, ny ser., nr. 3395).
Analysis and Modelling of Mineral and Element Composition in Compression Breakage
55
Llorens González, Teresa; García Polonio, Francisco; López Moro, Francisco Javier; Fernández Fernández, Agustina; Sanz Contreras, José Luis; Moro Benito, María Candelas (2017): Tin-tantalum-niobium mineralization in the Penouta deposit (NW Spain). Textural features and mineral chemistry to unravel the genesis and evolution of cassiterite and columbite group minerals in a peraluminous system. In Ore Geology Reviews 81, pp. 79–95. DOI: 10.1016/j.oregeorev.2016.10.034.
López, Félix; García-Díaz, Irene; Rodríguez Largo, Olga; Polonio, Francisco; Llorens, Teresa (2018): Recovery and Purification of Tin from Tailings from the Penouta Sn–Ta–Nb Deposit. In Minerals 8 (2), p. 20. DOI: 10.3390/min8010020.
López-Moro, Francisco Javier; García Polonio, Francisco; Llorens González, Teresa; Sanz Contreras, José Luis; Fernández Fernández, Agustina; Moro Benito, María Candelas (2017): Ta and Sn concentration by muscovite fractionation and degassing in a lens-like granite body. The case study of the Penouta rare-metal albite granite (NW Spain). In Ore Geology Reviews 82, pp. 10–30. DOI: 10.1016/j.oregeorev.2016.11.027.
Mariano, R. A.; Evans, C. L.; Manlapig, E. (2016): Definition of random and non-random breakage in mineral liberation - A review. In Minerals Engineering 94, pp. 51–60. DOI: 10.1016/j.mineng.2016.05.005.
Napier-Munn, Tim (2015): Is progress in energy-efficient comminution doomed? In Minerals Engineering 73, pp. 1–6. DOI: 10.1016/j.mineng.2014.06.009.
Ozcan, Ozgur; Benzer, Hakan (2013): Comparison of different breakage mechanisms in terms of product particle size distribution and mineral liberation. In Minerals Engineering 49, pp. 103–108. DOI: 10.1016/j.mineng.2013.05.006.
Thalhammer, O. (1987): Boninites as source rocks of tungsten mineralization at Mittersill, Austria? In Mineralogy and Petrology 37 (3-4), pp. 221–242. DOI: 10.1007/BF01161818.
Wei, X.; Gay, S. (1999): Liberation modelling using a dispersion equation. In Minerals Engineering 12 (2), pp. 219–227. DOI: 10.1016/S0892-6875(98)00133-2.
Wills, B. A.; Finch, James A. (2016): Wills' mineral processing technology. An introduction to the practical aspects of ore treatment and mineral recovery. Eighth edition. Amsterdam: Elsevier; Butterworth-Heinemann.
Vizcarra, T. G.; Wightman, E. M.; Johnson, N. W.; Manlapig, E. V. (2010): The effect of breakage mechanism on the mineral liberation properties of sulphide ores. In Minerals Engineering 23 (5), pp. 374–382. DOI: 10.1016/j.mineng.2009.11.012.