Analysis and Modeling of the Open Source Software Community Yongqin Gao, Greg Madey Computer Science...
23
Analysis and Modeling of the Open Source Software Community Yongqin Gao, Greg Madey Computer Science & Engineering University of Notre Dame Vincent Freeh Computer Science Dept. NCSU NAACSOS Conference Pittsburgh, PA June 25, 2003 Supported in part by the National Science Foundation – Digital Science & Technology
-
Upload
thomas-eaton -
Category
Documents
-
view
215 -
download
1
Transcript of Analysis and Modeling of the Open Source Software Community Yongqin Gao, Greg Madey Computer Science...

Analysis and Modeling of the Open Source Software
Community
Yongqin Gao, Greg MadeyComputer Science & Engineering
University of Notre Dame
Vincent FreehComputer Science Dept.
NCSU
NAACSOS ConferencePittsburgh, PAJune 25, 2003
Supported in part by the National Science Foundation – Digital Science & Technology

Outline
Overview Data collection Network modeling Topological statistical analysis Conclusion

Overview
What is OSS Free to use, distribution Unlimited user and usage Source code available and modifiable
Potential advantages over commercial software Higher quality Faster development Lower cost
Our goal Understanding the OSS phenomenon
Approach SourceForge is the source of our empirical data Modeling as social network Analysis of topological statistics

Data Collection — Monthly Web crawler (scripts)
Python Perl AWK Sed
Monthly Since Jan 2001 ProjectID DeveloperID Almost 2 million records Relational database
PROJ|DEVELOPER8001|dev3488001|dev89728001|dev99228002|dev276508005|dev313518006|dev124098007|dev199358007|dev42628007|dev367118008|dev8972

Modeling as collaboration network
What is collaboration network A social network representing the collaborating
relationships. Movie actor network and scientist collaboration network
Difference of SourceForge collaboration network Detachment Virtual collaboration Voluntary Global
Bipartite property of collaboration network
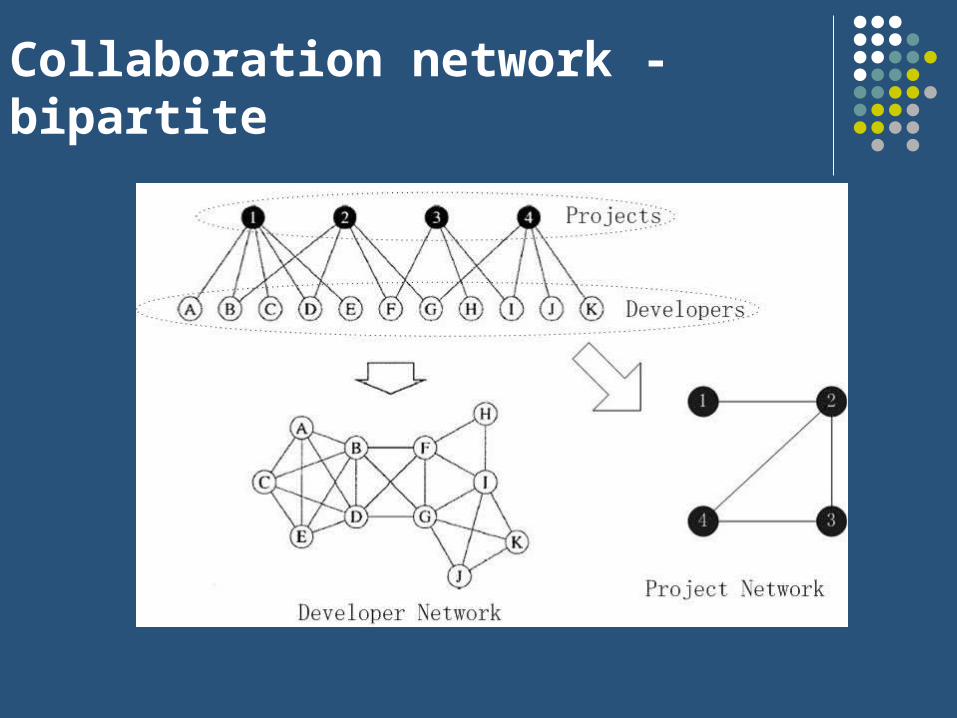
Collaboration network - bipartite
SourceForge developer network
15850 dev[46]dev[83] 15850 dev[46]
dev[48]
15850 dev[46]dev[56]
15850 dev[46]dev[58]
6882 dev[58]dev[47]
6882 dev[47]dev[79]
6882 dev[47]dev[52]
6882 dev[47]dev[55]
7028 dev[46]dev[99]
7028 dev[46]dev[51]
7028 dev[46]dev[57]
7597 dev[46]dev[45]
7597 dev[46]dev[72]
7597 dev[46]dev[55]
7597 dev[46]dev[58]
7597 dev[46]dev[61]
7597 dev[46]dev[64]7597 dev[46]
dev[67]
7597 dev[46]dev[70]
9859 dev[46]dev[49]9859 dev[46]
dev[53]
9859 dev[46]dev[54]
9859 dev[46]dev[59]
dev[46]
dev[83] dev[56]
dev[48]
dev[52]
dev[79]
dev[72]
dev[51]
dev[57]
dev[55]
dev[99]
dev[47]
dev[58]
dev[53]
dev[58]
dev[65]
dev[45]
dev[70]
dev[67]
dev[59]
dev[54]
dev[49]
dev[64]
dev[61]
Project 6882
Project 9859
Project 7597
Project 7028
Project 15850
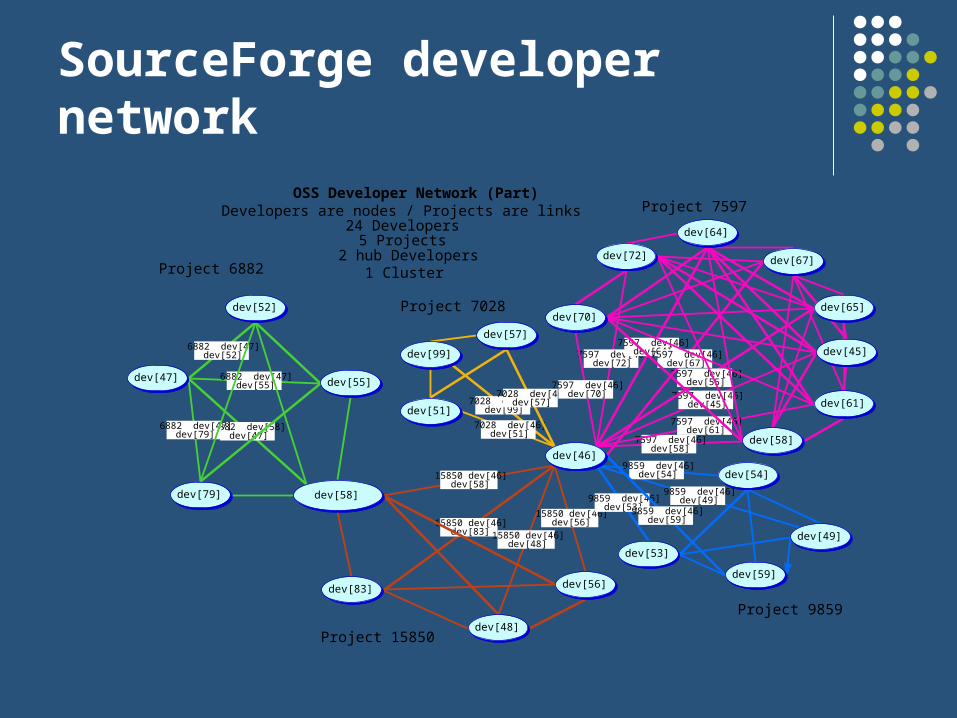
OSS Developer Network (Part)Developers are nodes / Projects are links
24 Developers5 Projects
2 hub Developers1 Cluster
Topological analysis
Statistics inspected Diameter Average degree Clustering coefficient Degree distribution Cluster size distribution Relative size of major cluster Fitness and lift cycle
Evolution of these statistics

Diameter of developer network vs. time
The average of shortest paths between any pairs of vertices
The values for developer network (30,000 – 70,000) are between 6 and 8
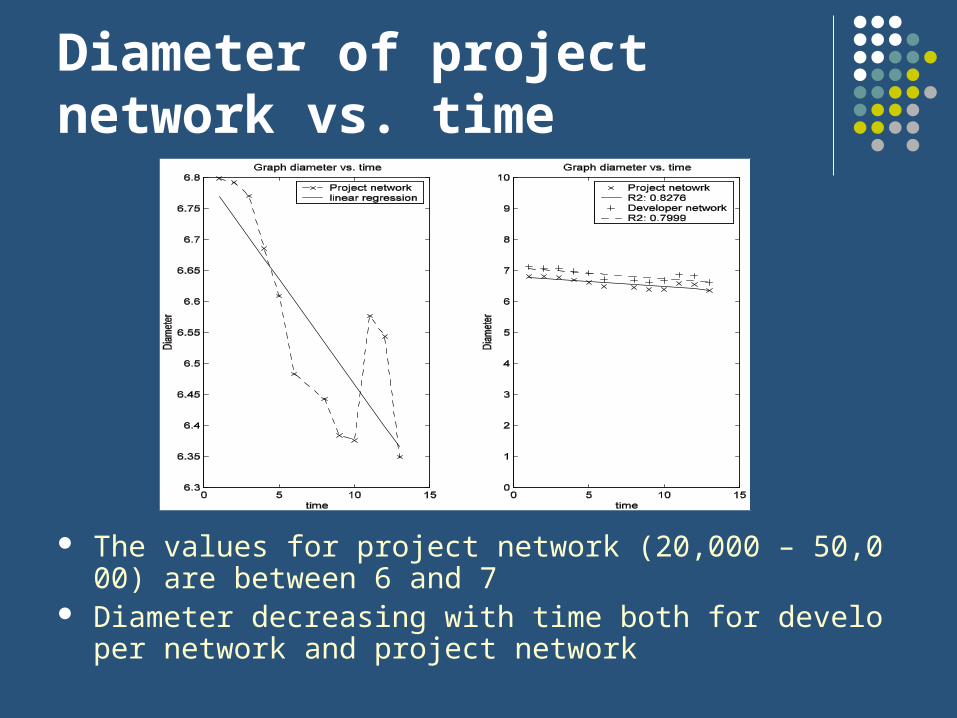
Diameter of project network vs. time
The values for project network (20,000 – 50,000) are between 6 and 7
Diameter decreasing with time both for developer network and project network

Average degree vs. time
The values for developer network are between 7 and 8
The values for project network are just between 3 and 4

Clustering coefficient of developer network vs. time

Clustering coefficient of project network vs. time

Degree distribution (developers)
Power law in developer distribution.
R2 = 0.9714

Degree distribution (projects)
Power law in project distribution
R2 = 0.9838
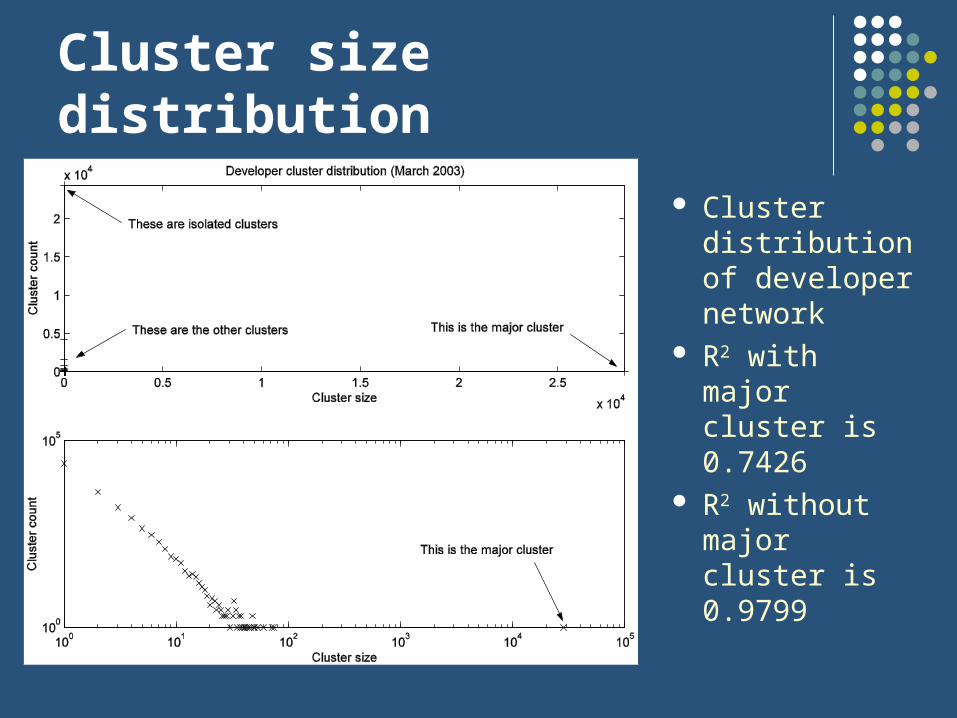
Cluster size distribution
Cluster distribution of developer network
R2 with major cluster is 0.7426
R2 without major cluster is 0.9799
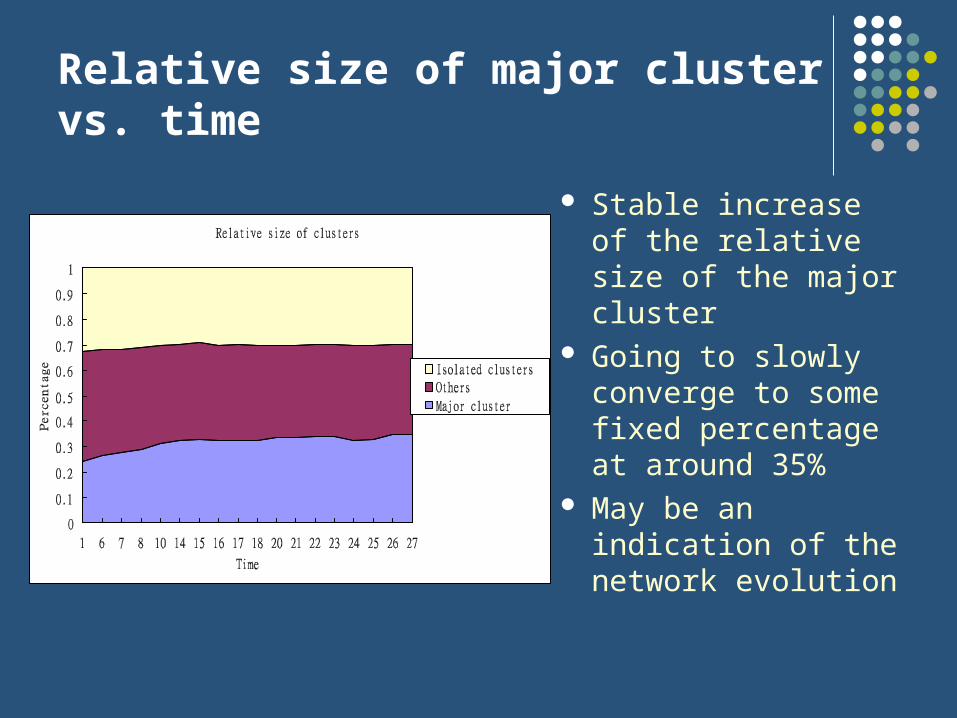
Relative size of major cluster vs. time
Stable increase of the relative size of the major cluster
Going to slowly converge to some fixed percentage at around 35%
May be an indication of the network evolution
Existence of fitness
Investigation of development of single project can verify the existence of “young upcomer” phenomenon
We tracked the development of every new project in July 2001 until now (total 1660 projects)
Maximal monthly growth per project is 13 while average monthly growth per project is just 0.3639

Life cycle of project

Summary of results
Power law rules Degree distributions, cluster distribution
Average degree increasing with time Diameter decreasing with time Clustering coefficient decreasing with time Fitness existed in SourceForge Projects have life cycle behaviors

Conclusion
Study of SourceForge collaboration network can help us understanding the OSS community
We investigate not only the topological statistics but also the evolution of these statistics.
Simulation is needed to further investigation of SourceForge collaboration network.

Thank you

Terminology Degree
The count of edges connected to given vertex Degree distribution
The distribution of degrees throughout a network Cluster
The connected components of the network Diameter
Average length of shortest paths between all pairs of vertices Clustering coefficient (CC)
CCi: Fraction representing the number of links actually present relative to the total possible number of links among the vertices in its neighborhood.
CC: average of all CCi in a network