Analysis and evaluation of the impact of privatisation on ...
93
World Maritime University World Maritime University The Maritime Commons: Digital Repository of the World Maritime The Maritime Commons: Digital Repository of the World Maritime University University World Maritime University Dissertations Dissertations 2000 Analysis and evaluation of the impact of privatisation on the Analysis and evaluation of the impact of privatisation on the performance of container handling equipment in Jakarta performance of container handling equipment in Jakarta International Container Terminal (JICT), Indonesia International Container Terminal (JICT), Indonesia Kartiko Yuwono World Maritime University Follow this and additional works at: https://commons.wmu.se/all_dissertations Recommended Citation Recommended Citation Yuwono, Kartiko, "Analysis and evaluation of the impact of privatisation on the performance of container handling equipment in Jakarta International Container Terminal (JICT), Indonesia" (2000). World Maritime University Dissertations. 310. https://commons.wmu.se/all_dissertations/310 This Dissertation is brought to you courtesy of Maritime Commons. Open Access items may be downloaded for non-commercial, fair use academic purposes. No items may be hosted on another server or web site without express written permission from the World Maritime University. For more information, please contact [email protected].
Transcript of Analysis and evaluation of the impact of privatisation on ...

World Maritime University World Maritime University
The Maritime Commons: Digital Repository of the World Maritime The Maritime Commons: Digital Repository of the World Maritime
University University
World Maritime University Dissertations Dissertations
2000
Analysis and evaluation of the impact of privatisation on the Analysis and evaluation of the impact of privatisation on the
performance of container handling equipment in Jakarta performance of container handling equipment in Jakarta
International Container Terminal (JICT), Indonesia International Container Terminal (JICT), Indonesia
Kartiko Yuwono World Maritime University
Follow this and additional works at: https://commons.wmu.se/all_dissertations
Recommended Citation Recommended Citation Yuwono, Kartiko, "Analysis and evaluation of the impact of privatisation on the performance of container handling equipment in Jakarta International Container Terminal (JICT), Indonesia" (2000). World Maritime University Dissertations. 310. https://commons.wmu.se/all_dissertations/310
This Dissertation is brought to you courtesy of Maritime Commons. Open Access items may be downloaded for non-commercial, fair use academic purposes. No items may be hosted on another server or web site without express written permission from the World Maritime University. For more information, please contact [email protected].
WORLD MARITIME UNIVERSITYMalmö, Sweden
ANALYSIS AND EVALUATION OF THE IMPACT
OF PRIVATISATION ON THE PERFORMANCE
OF CONTAINER HANDLING EQUIPMENT IN
JAKARTA INTERNATIONAL CONTAINER
TERMINAL (JICT), INDONESIA
By
KARTIKO YUWONOThe Republic of Indonesia
A dissertation submitted to the World Maritime University in partial
fulfilment of the requirements for the award of the degree of
MASTER OF SCIENCE
in
PORT MANAGEMENT
2000 Copyright Kartiko Yuwono, 2000

ii
DEDICATION
I dedicate this paper to:
- my mother, to whom I always berth my boat of life
- my father, who has built the strong boat of life in my heart
- my wife, who always accompanies me in the sailing of life
- my son, to whom I am preparing the strong boat of life in his heart
“So verily, with the hardship, there is relief,”
(Surat Alam Nashrah: 5)

iii
DECLARATION
I certify that all the material in this dissertation that is not my own work has been
identified, and that no material is included for which a degree has previously been
conferred on me.
The contents of this dissertation reflect my own personal views, and are not
necessarily endorsed by the University.
…………………….. (Signature)
…………………….. (Date)
Supervised by:
Name : Prof. Dr. Bernard L. Francou
Office : Associate Professor, Port Management
World Maritime University
Assessor:
Name : Prof. Dr. Ma Shuo
Office : Course Professor, Port and Shipping Management
World Maritime University
Co-assessor:
Name : Michael C. Ircha, PhD, Peng, MCIP
Office : Professor of Civil Engineering
The University of New Brunswick, Canada
iv
ACKNOWLEDGEMENT
First and foremost, I would like to thank Allah The Almighty, who has helped and
guided me during my studies at World Maritime University and with living here in
Malmö, Sweden. Because of His blessing I have been able to complete this period of
my life.
My sincere gratitude goes to the Danish International Development Agency
(DANIDA), Denmark, for funding and financing my studies at this University.
I would also like to address my thanks and appreciation to The Government of The
Republic of Indonesia, particularly the Indonesia Port Corporation II, Ltd., Jakarta,
which have given me the opportunity to study at World Maritime University.
My gratitude is also addressed to the Rector of WMU, Dr. Karl Lubstein, my course
professor, Dr. Ma Shuo, my supervisor, Dr. Bernard L. Francou, my lecturer, Capt.
Jan Horck and visiting professors in sharing their knowledge, experience and for
their support and valuable guidance in writing this dissertation.
The great contribution from Faculty staff of the World Maritime University, lecturers
of the English Department, and Librarian staff is highly appreciated.
Special thanks I deliver to the Port of Le Havre, Malta Freeport, Port of Rotterdam,
Port of Felixstowe, Port of Århus, Port of Copenhagen and Port of Malmö that have
given me very useful knowledge and information to broaden my horizon in the port
management field.
Special thanks I would also like to deliver to my Ambassador in Stockholm and his
staff, the Indonesian society in Malmö and Lund, Majelis Ta’lim Forum in Malmö,

v
and my colleagues the Indonesian students of WMU, who have made my living in
Malmö just like in my own family.
Next, I would like to express my deepest gratitude to my parents, my brothers and
sisters, my nephews, my parents-in-law, my brothers and sisters in-law for their
prayers and moral support during my study. And finally, my special appreciation I
address to my dear and lovely wife Upit Nurlita for her prayers, understanding and
continued encouragement during my study, and to my dear and lovely son Zuhdi
Ilmawan, in whom I place all of my hopes.

vi
ABSTRACT
Title : Analysis and Evaluation of the Impact of Privatisation on the
Performance of Container Handling Equipment in Jakarta
International Container Terminal (JICT), Indonesia.
Degree : MSc
Equipment maintenance in an organisation is often deemed as a cost centre. In order
to achieve a maximum profit an organisation often pressures the cost. In this case,
equipment maintenance is often to be an object in decreasing that cost. On the other
hand, the lack of maintenance may lead equipment to perform poorly. In addition,
these poor performances may lead the organisation to perform poorly as well.
In a container terminal organisation, equipment maintenance plays an important role
for the terminal performance. A good practice of maintenance policy and strategy
leads the terminal to perform well and vice versa. As a State-owned company, Unit
Terminal Petikemas (UTPK) Tanjung Priok, Jakarta, often faced barriers which came
from government regulations in practising those maintenance policies and strategies.
That barrier does not exist anymore after the terminal was privatised and given the
name Jakarta International Container Terminal (JICT).
This dissertation studies and analyses the impact of privatisation on the performance
indicators of equipment maintenance, namely equipment availability, utilisation,
MTBF, MMBF and MTTR. It is also proposed to practise some action in order to
improve the performances by practising predictive maintenance as well as preventive
maintenance and corrective maintenance, and by restructuring the organisation
structure in order to raise the quality of the professional engineers and maintenance
staff.
KEYWORDS: Privatisation, JICT, Availability, MTBF, MMBF, MTTR, Predictive
Maintenance, Preventive Maintenance, Corrective Maintenance.

vii
TABLE OF CONTENTS
DEDICATION iiDECLARATION iiiACKNOWLEDGEMENT ivABSTRACT viTABLE OF CONTENTS viiLIST OF TABLES xLIST OF FIGURES xiLIST OF ABBREVIATIONS xiii
INTRODUCTION 1A. Port Privatisation 1B. The Importance of Equipment Maintenance 2C. The Objective 3D. Methodologies 3
1. JAKARTA INTERNATIONAL CONTAINER TERMINAL AT AGLANCE
5
1.1 History of JICT 51.2 Container Throughput 61.3 Structure of Organisation 81.4 Vision and Mission of JICT 111.5 Summary 12
2. CONTAINER HANDLING EQUIPMENT 132.1 Existing Container Handling Equipment 132.2 Performance of Equipment before Privatisation 152.3 Performance of Equipment after Privatisation 19
2.3.1 Changing in measuring methods 202.3.2 Equipment performances 21
2.4 Summary 27
3. ANALYSIS AND EVALUATION OF EQUIPMENTPERFORMANCES FROM VARIOUS POINTS OF VIEW
28
3.1 Introduction 283.2 Analysis of Equipment Performances before Privatisation 30
3.2.1 Equipment operation 303.2.1.1 Terminal I 30
viii
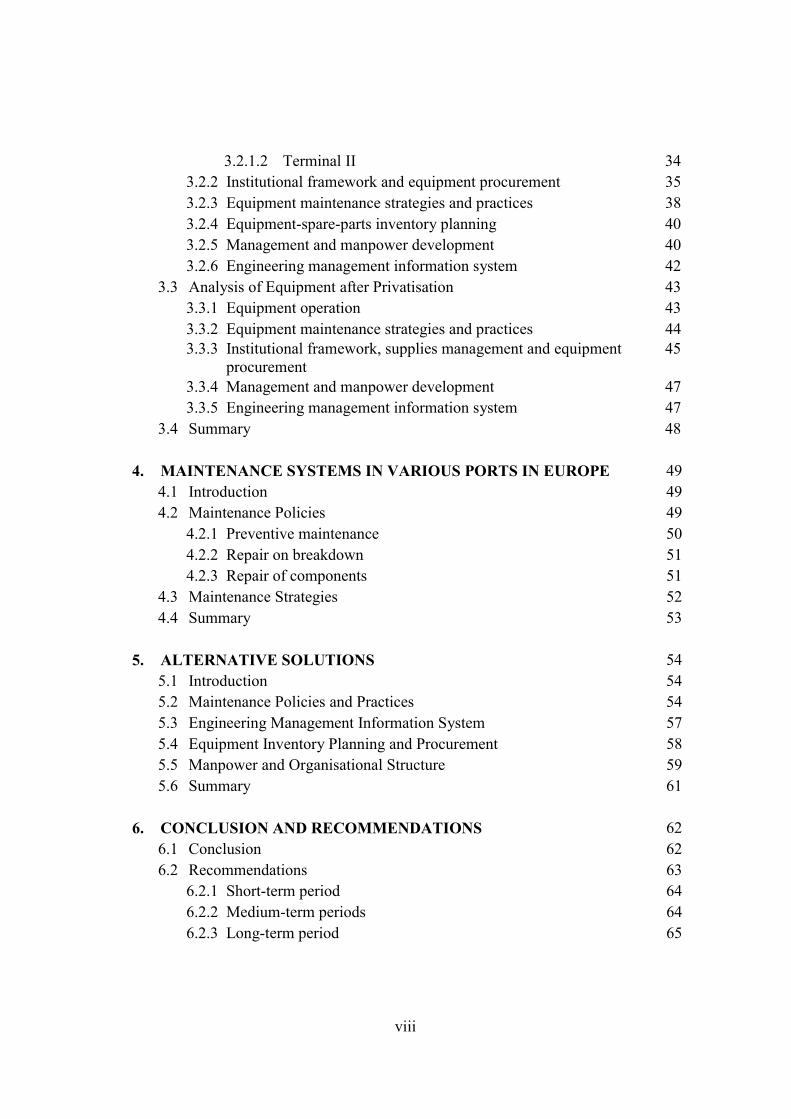
3.2.1.2 Terminal II 343.2.2 Institutional framework and equipment procurement 353.2.3 Equipment maintenance strategies and practices 383.2.4 Equipment-spare-parts inventory planning 403.2.5 Management and manpower development 403.2.6 Engineering management information system 42
3.3 Analysis of Equipment after Privatisation 433.3.1 Equipment operation 433.3.2 Equipment maintenance strategies and practices 443.3.3 Institutional framework, supplies management and equipment
procurement45
3.3.4 Management and manpower development 473.3.5 Engineering management information system 47
3.4 Summary 48
4. MAINTENANCE SYSTEMS IN VARIOUS PORTS IN EUROPE 494.1 Introduction 494.2 Maintenance Policies 49
4.2.1 Preventive maintenance 504.2.2 Repair on breakdown 514.2.3 Repair of components 51
4.3 Maintenance Strategies 524.4 Summary 53
5. ALTERNATIVE SOLUTIONS 545.1 Introduction 545.2 Maintenance Policies and Practices 545.3 Engineering Management Information System 575.4 Equipment Inventory Planning and Procurement 585.5 Manpower and Organisational Structure 595.6 Summary 61
6. CONCLUSION AND RECOMMENDATIONS 626.1 Conclusion 626.2 Recommendations 63
6.2.1 Short-term period 646.2.2 Medium-term periods 646.2.3 Long-term period 65

ix
BIBLIOGRAPHY 66
APPENDICESAppendix A : The Location of JICT 70Appendix B : The Layout of Terminal I 71Appendix C : The Layout of Terminal II 72Appendix D : Fault Code List 73Appendix E : The Age and Conditions of Equipment in JICT 74
x
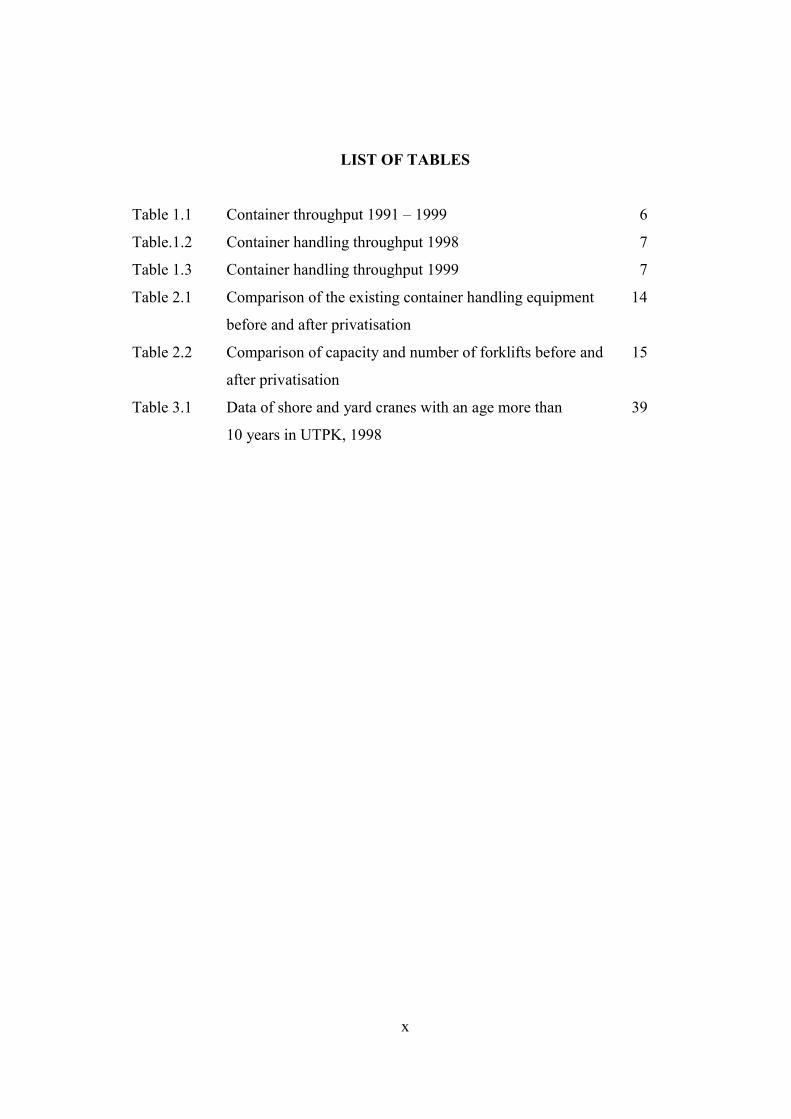
LIST OF TABLES
Table 1.1 Container throughput 1991 – 1999 6
Table.1.2 Container handling throughput 1998 7
Table 1.3 Container handling throughput 1999 7
Table 2.1 Comparison of the existing container handling equipment 14
before and after privatisation
Table 2.2 Comparison of capacity and number of forklifts before and 15
after privatisation
Table 3.1 Data of shore and yard cranes with an age more than 39
10 years in UTPK, 1998
xi
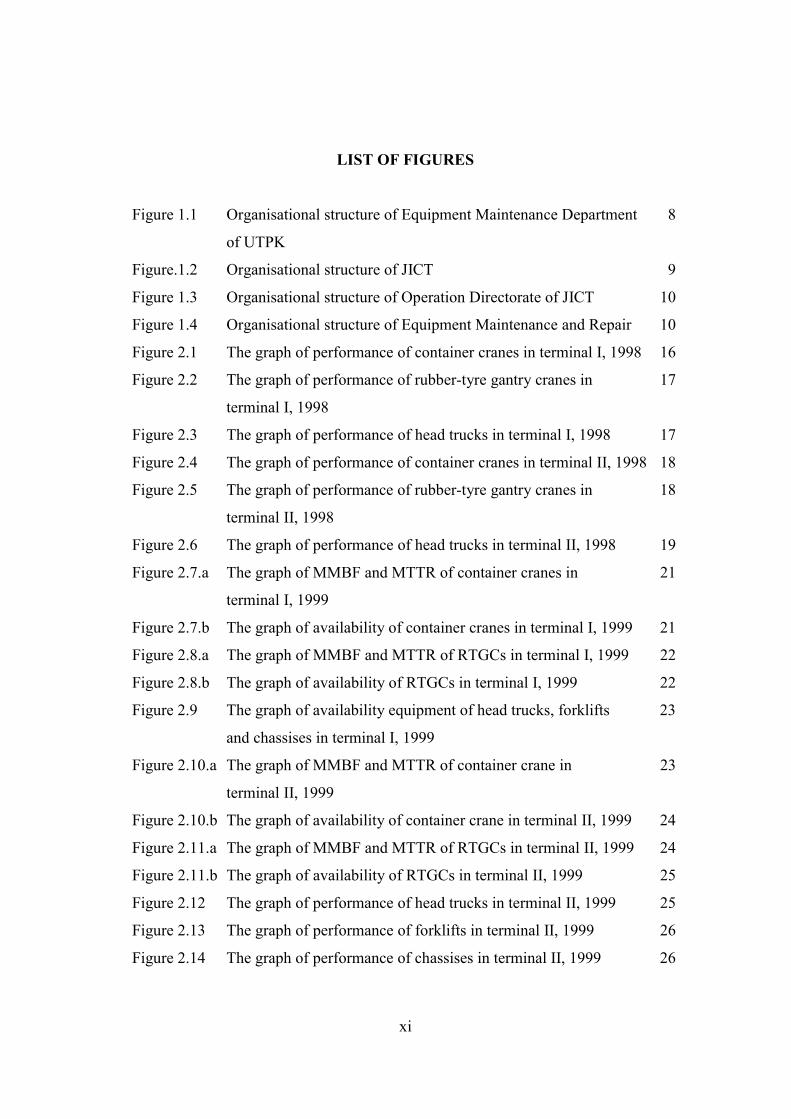
LIST OF FIGURES
Figure 1.1 Organisational structure of Equipment Maintenance Department 8
of UTPK
Figure.1.2 Organisational structure of JICT 9
Figure 1.3 Organisational structure of Operation Directorate of JICT 10
Figure 1.4 Organisational structure of Equipment Maintenance and Repair 10
Figure 2.1 The graph of performance of container cranes in terminal I, 1998 16
Figure 2.2 The graph of performance of rubber-tyre gantry cranes in 17
terminal I, 1998
Figure 2.3 The graph of performance of head trucks in terminal I, 1998 17
Figure 2.4 The graph of performance of container cranes in terminal II, 1998 18
Figure 2.5 The graph of performance of rubber-tyre gantry cranes in 18
terminal II, 1998
Figure 2.6 The graph of performance of head trucks in terminal II, 1998 19
Figure 2.7.a The graph of MMBF and MTTR of container cranes in 21
terminal I, 1999
Figure 2.7.b The graph of availability of container cranes in terminal I, 1999 21
Figure 2.8.a The graph of MMBF and MTTR of RTGCs in terminal I, 1999 22
Figure 2.8.b The graph of availability of RTGCs in terminal I, 1999 22
Figure 2.9 The graph of availability equipment of head trucks, forklifts 23
and chassises in terminal I, 1999
Figure 2.10.a The graph of MMBF and MTTR of container crane in 23
terminal II, 1999
Figure 2.10.b The graph of availability of container crane in terminal II, 1999 24
Figure 2.11.a The graph of MMBF and MTTR of RTGCs in terminal II, 1999 24
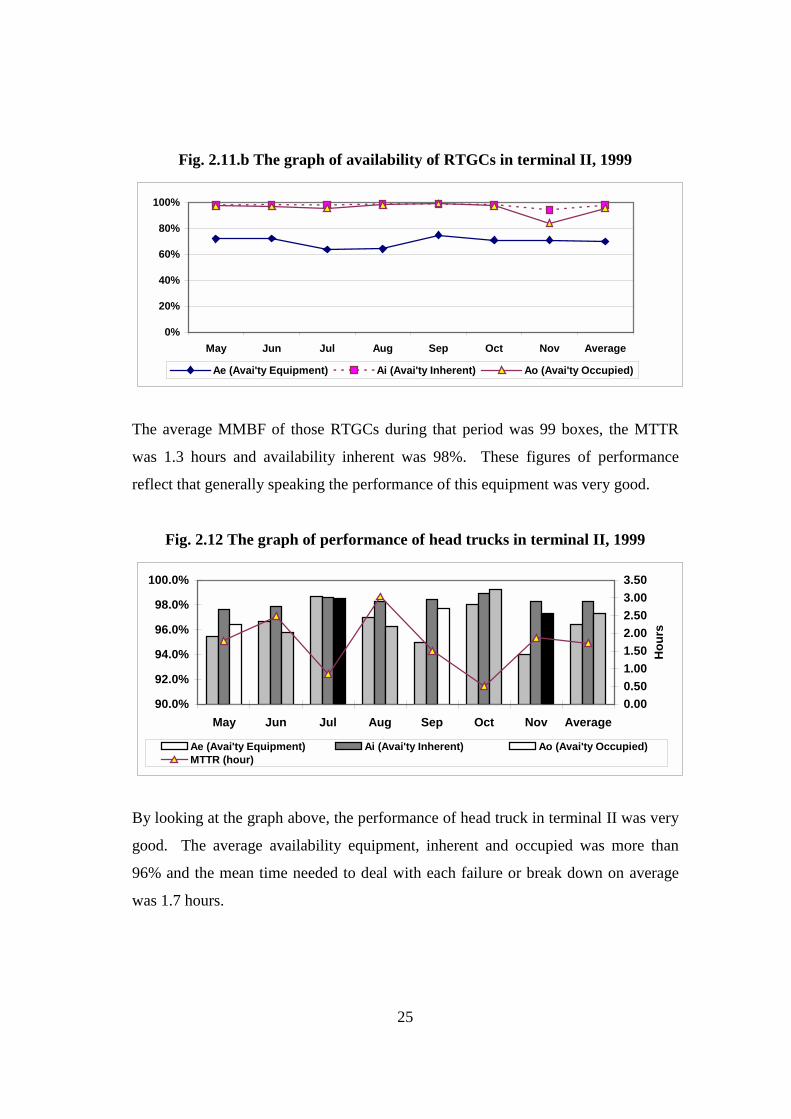
Figure 2.11.b The graph of availability of RTGCs in terminal II, 1999 25
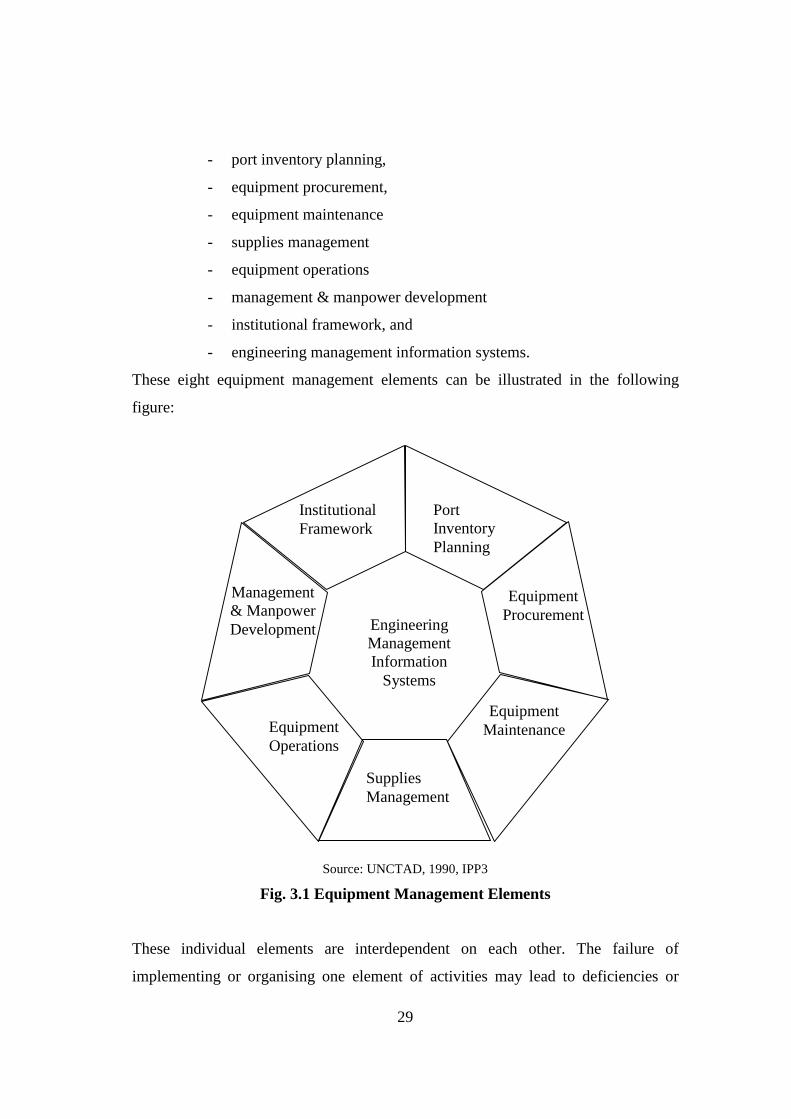
Figure 2.12 The graph of performance of head trucks in terminal II, 1999 25
Figure 2.13 The graph of performance of forklifts in terminal II, 1999 26
Figure 2.14 The graph of performance of chassises in terminal II, 1999 26

xii
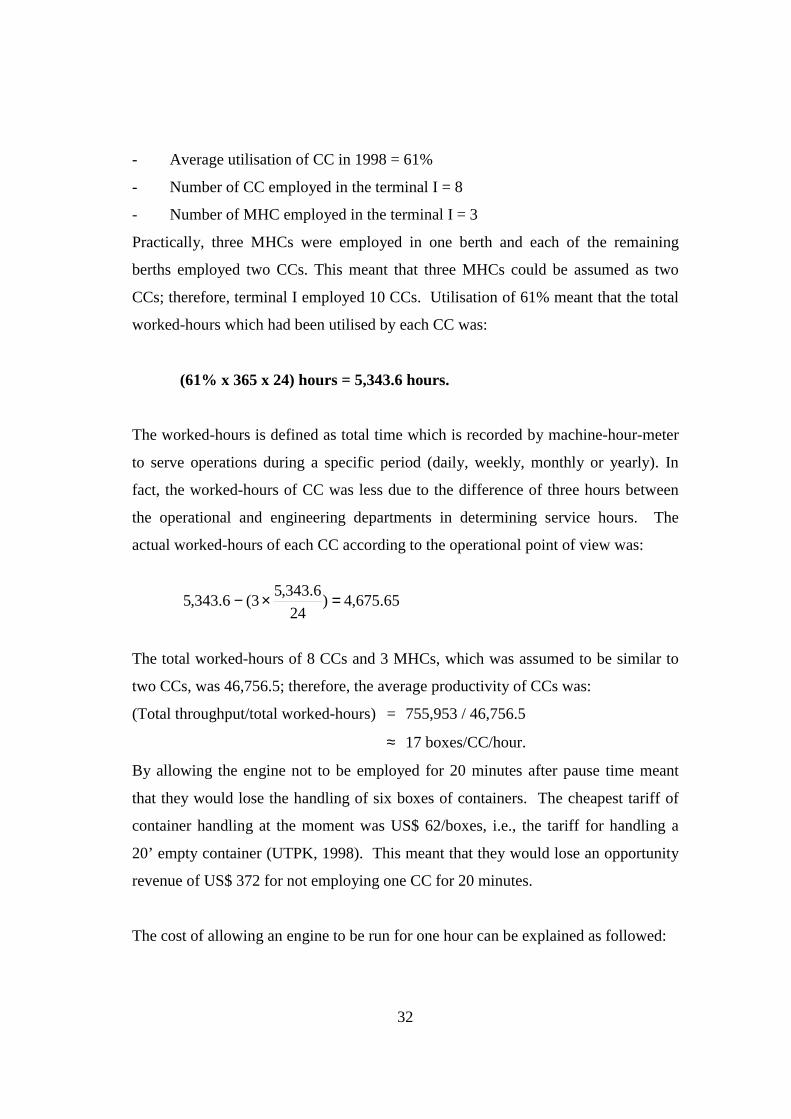
Figure 3.1 Equipment Management Elements 29
Figure 3.2 Graph of average equipment performances in terminal I, 1998 30
Figure 3.3 Graph of average equipment performances in terminal II, 1998 34
Figure 3.4 Distribution of human resources in UTPK 1998 according to 41
education level
Figure 3.5 Graph of average MMBF and MTTR of CCs and RTGCs 43
in terminal I, 1999
Figure 3.6.a Graph of average equipment availability in terminal I, 1999 44
Figure 3.6.b Graph of average equipment availability and MTTR in 45
terminal II, 1999

xiii
LIST OF ABBREVIATIONS
Ae Availability equipment
Ai Availability inherent
Ao Availability occupied
Bappenas Badan Perencanaan Pembangunan Nasional (National Development
Planning Agency)
BOT Build Operate and Transfer
CAMC Computer Assisted Maintenance Control
CC Container Crane
CHS Chassis
CM Corrective Maintenance
EMIS Engineering Management Information System
FD Forklift Diesel
HPH Hutchison Port Holding
HRPD Human Resources Planning and Development
HT Head Truck
IPC II, Ltd. Indonesia Port Corporation II, Limited
ISO International Organisation for Standardisation
JICT Jakarta International Container Terminal
Keppres Keputusan Presiden (Presidential Decree)
M&R Maintenance and Repair
MHC Mobile Harbour Crane
MIS Management Information System
MMBF Mean Movement Between Failure
MTBF Mean Time Between Failure
MTTR Mean Time To Repair
PdM Predictive Maintenance
PM Preventive Maintenance
RTGC Rubber Tyre Gantry Crane

xiv
TEUs Twenty Foot Equivalent Units
UNCTAD United Nations Conference on Trade and Development
UTPK Unit Terminal Petikemas Tanjung Priok (Tanjung Priok Container
Terminal Unit)

1
INTRODUCTION
The Jakarta International Container Terminal (JICT), formerly the Unit Terminal
Petikemas Tanjung Priok (UTPK) or Tanjung Priok Container Terminal Unit, is the
largest container terminal in Indonesia presently. The terminal is mainly serving
Indonesian sea-borne trade. As the largest container terminal and the server of
Indonesian sea-borne trade, JICT has a big contribution in the developing of
Indonesian exports and imports trading; furthermore in the growth of the Indonesian
national economy. This has been proven by the increase in the terminal throughput
since operations began in 1978 up to 1996. In the middle of 1997, Indonesia suffered
an economic crisis, which had a great impact on the performance of the terminal up
to 1999. In April 1999, the terminal was privatised by selling 51% of the shares to a
private company. What are the impacts of this privatisation on the performance
of container handling equipment? This is the essential question to be discussed in
this dissertation.
A. Port Privatisation
The technologies of containerisation, either the container itself or container vessel,
are developing so quickly. Shipping companies provide services to meet and satisfy
either shippers or cargo-owners for transporting cargo. There is no doubt that sea
transportation is the cheapest transportation mode among other modes. In order to
achieve the economies of scale, some high-value cargoes now are transported by
container vessels. Therefore, the time in port has become an essential factor for
shipowners, shippers and cargo-owners.
2
The port as a service-supplier institution is required to perform as well as the
customers’ requirements. Shipping companies as port users have a right to select
which port they want to call at. The better the ports can perform, the more they can
likely attract shipping companies. This situation creates competition among the ports
to attract customers.
Since time in ports as an element of competition becomes more significant for port
users, the port operators have been required to improve their performances. In most
developing countries, ports are owned and operated by the state or government. Here
regulations and public control limit performance and consequently efficiency is not
as good as in the private sector (Kolderie, 1986). Investment and competition ability
are often the main difficulties that state or government in developing countries face
in improving port performances. In order to overcome these problems, privatisation
becomes an alternative way. This is what happened in JICT in order to strengthen
the capital structure.
B. The Importance of Equipment Maintenance
Historically, maintenance probably started out as a need to fix a machine when it was
breaking down during operations. As the first person who faced the failure, the
machine operator performed the repair on the machine (UNCTAD, 1983). Together
with the development of technology, equipment becomes much more complex,
leading to special skills, tools, equipment and material for the repairs. These typical
requirements are almost impossible to be discovered by the operators themselves.
Therefore, to deal with modern and more complex equipment, well-trained
maintenance staff are needed as well as operator staff.
Such symptoms also happen in the ports. The development of containerisation has
led the ports to change the operational pattern from traditional to fully automatic.
This situation requires ports to provide facilities in order to perform cargo handling
well; therefore, equipment maintenance becomes an essential factor.
3
C. The Objective
The objective of this study is to understand the impact of privatisation on the
performance of container handling equipment, especially in JICT. It also attempts to
find out and explain the problems which are often faced by management related to
the management of equipment maintenance.
D. Methodologies
In order to know those impacts of port privatisation on the performance of container
handling equipment, a comparative method is used, that is the comparison of
equipment before and after privatisation. Basically, the equipment to be compared is
physically the same. The differences are only the organisation which manages that
equipment and the time frame in which the equipment performs.
From the organisation point of view, comparison is done between UTPK and JICT.
UTPK is one of the operation units of Indonesia Port Corporation II, Ltd. (IPC II),
which is a fully State-owned company. Several months before privatisation, UTPK
was changed from an operation unit to a subsidiary company, namely Jakarta
International Container Terminal (JICT). The new management, which consists of
IPC II and Hutchison Port Holding as another share holder, has kept the name JICT.
From the time-frame point of view, JICT was established when Indonesia was facing
an economic crisis, which began in the middle of 1997 and has not finished yet.
Therefore, it is necessary to consider taking two periods of time which are relatively
similar. This means that by taking two one-year periods of 1998 (before
privatisation) and 1999 (after privatisation) the analysis would represent periods
which are as close to the same situation as possible.
Comparison is done by measuring the availability, utilisation, break down time and
other equipment performance parameters which might be affected by the
performances of the two different organisations. In order to get accurate data,
4
interviewing and investigation of the management of JICT is done. Correspondence
to the management of JICT is also the important method in order to clarify the
arguments with the realities in the field. Furthermore, comparison is done by taking
the author’s knowledge, experiences and information during field trips to other ports,
in order to find out the ideal model which might be applied to JICT.

5
CHAPTER I
JAKARTA INTERNATIONAL CONTAINER TERMINAL AT A GLANCE
1.1 History of JICT
The history of JICT can not be separated from the history of containerised-goods
transportation in Indonesia, which was first introduced in 1973. Then there was a
small number of containers being unloaded in the Port of Tanjung Priok by
conventional equipment (Indonesia Port Corporation [IPC] II, 1996). Since then the
growth of container traffic has increased steadily from year to year.
In October 1974, a new container terminal was built in the Port of Tanjung Priok in
order to anticipate growth in both container vessel and container traffic. In
December 1978, the terminal started to operate services although the process of
building the terminal had not finished. In May 1981 the terminal was inaugurated by
the President of the Republic of Indonesia.
In 1990, the second terminal was built by modifying the existing conventional berths
to anticipate the growth of container traffic. The terminal was inaugurated in
September 1991 and within the same year the container terminal was managed by a
separate unit which was as level as the Port of Tanjung Priok Branch, namely Unit
Terminal Petikemas Tanjung Priok (UTPK) or Tanjung Priok Container Terminal
Unit. Since then UTPK has grown together with the growth of the Indonesian
economy.
In the middle of 1997, Indonesia suffered a monetary and economic crisis. The crisis
led government, which is the single shareholder of State-owned companies, decided
6
to privatise some of the companies including the Indonesia Port Corporation II, Ltd.,
in order to strengthen its capital structure (“Suara Pembaruan Daily,” 1998). In order
to execute the privatisation, Indonesia Port Corporation II, Ltd. established UTPK as
a subsidiary firm of Indonesia Port Corporation II in March 2000, namely Jakarta
International Container Terminal (JICT). On 1st April 1999, JICT was privatised by
selling 51% of the shares to Hutchison Port Holding (HPH), Hongkong. The
remaining 49% of the shares were owned by Indonesia Port Corporation II, Ltd. The
joint venture company of JICT would operate and develop container terminals I and
II for a period of 20 years under a Build Operate and Transfer (BOT) concession
(Agustomo, 1999). This means that after JICT has built and operated the terminal
for 20 years, JICT has to transfer the terminal to the previous owner, i.e., Indonesia
Port Corporation II, Ltd.
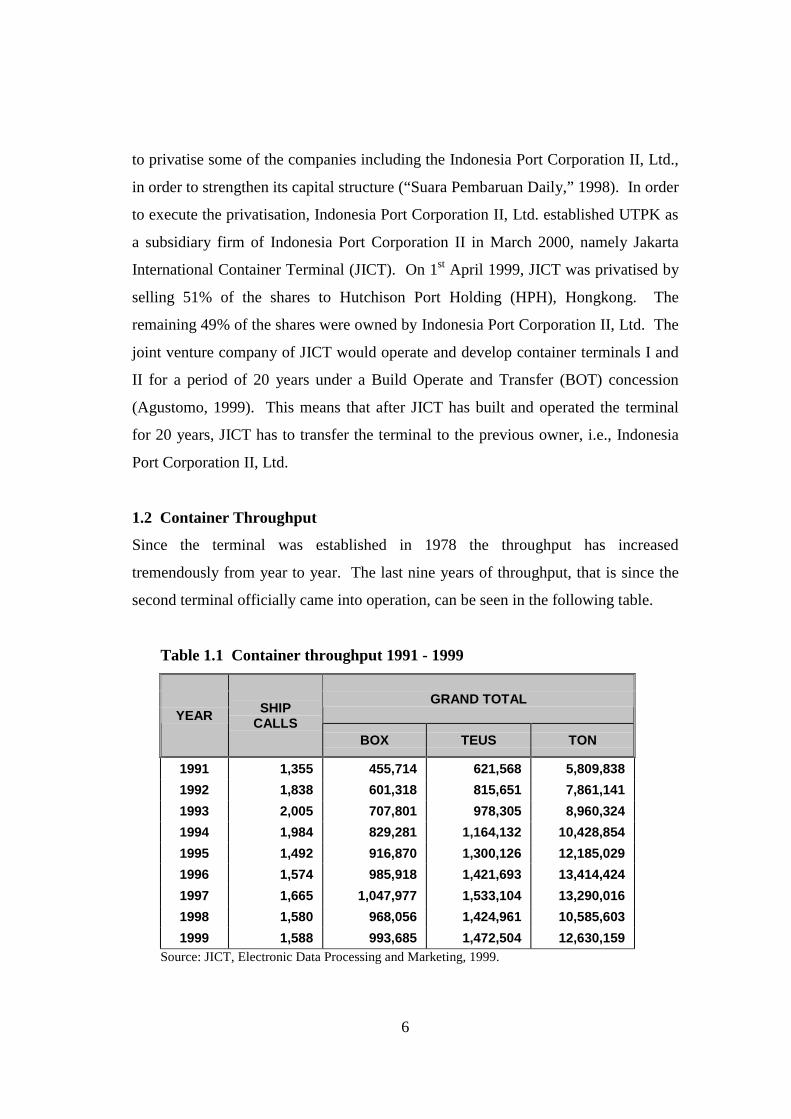
1.2 Container Throughput
Since the terminal was established in 1978 the throughput has increased
tremendously from year to year. The last nine years of throughput, that is since the
second terminal officially came into operation, can be seen in the following table.
Table 1.1 Container throughput 1991 - 1999
GRAND TOTALYEAR SHIP
CALLSBOX TEUS TON
1991 1,355 455,714 621,568 5,809,8381992 1,838 601,318 815,651 7,861,1411993 2,005 707,801 978,305 8,960,3241994 1,984 829,281 1,164,132 10,428,8541995 1,492 916,870 1,300,126 12,185,0291996 1,574 985,918 1,421,693 13,414,4241997 1,665 1,047,977 1,533,104 13,290,0161998 1,580 968,056 1,424,961 10,585,6031999 1,588 993,685 1,472,504 12,630,159
Source: JICT, Electronic Data Processing and Marketing, 1999.
7
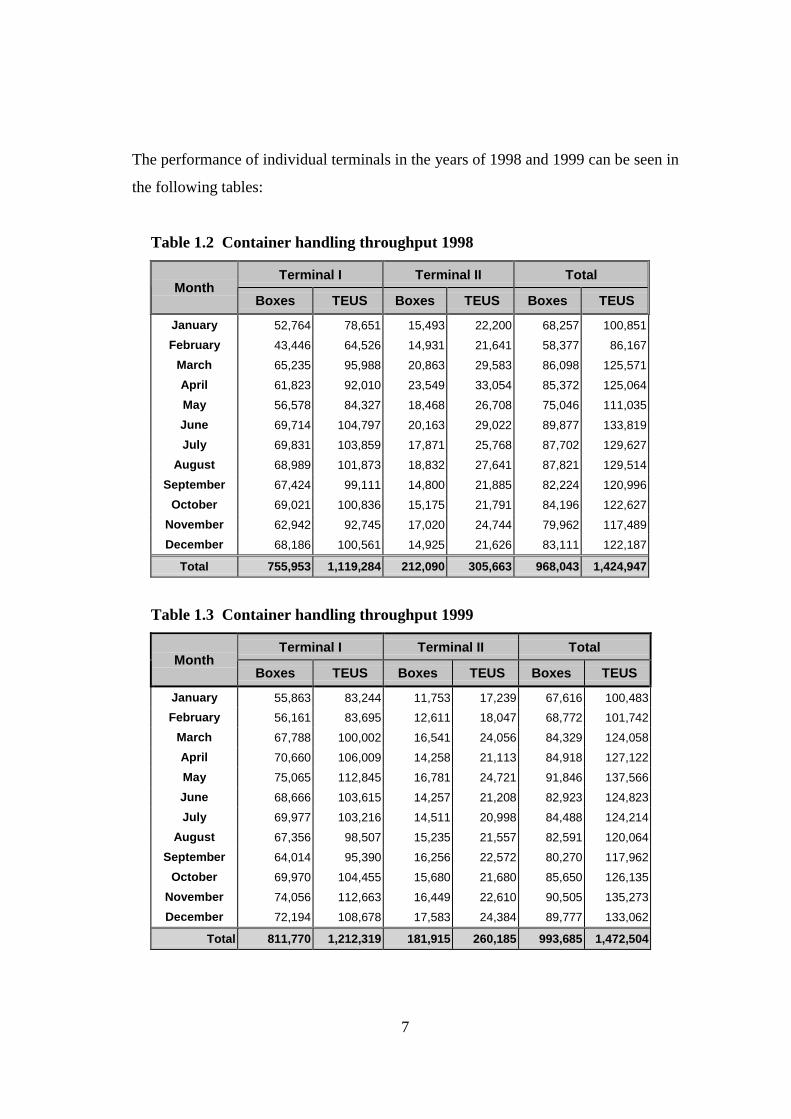
The performance of individual terminals in the years of 1998 and 1999 can be seen in
the following tables:
Table 1.2 Container handling throughput 1998
Terminal I Terminal II TotalMonth
Boxes TEUS Boxes TEUS Boxes TEUS
January 52,764 78,651 15,493 22,200 68,257 100,851February 43,446 64,526 14,931 21,641 58,377 86,167
March 65,235 95,988 20,863 29,583 86,098 125,571April 61,823 92,010 23,549 33,054 85,372 125,064May 56,578 84,327 18,468 26,708 75,046 111,035June 69,714 104,797 20,163 29,022 89,877 133,819July 69,831 103,859 17,871 25,768 87,702 129,627
August 68,989 101,873 18,832 27,641 87,821 129,514September 67,424 99,111 14,800 21,885 82,224 120,996
October 69,021 100,836 15,175 21,791 84,196 122,627November 62,942 92,745 17,020 24,744 79,962 117,489December 68,186 100,561 14,925 21,626 83,111 122,187
Total 755,953 1,119,284 212,090 305,663 968,043 1,424,947
Table 1.3 Container handling throughput 1999
Terminal I Terminal II TotalMonth
Boxes TEUS Boxes TEUS Boxes TEUS
January 55,863 83,244 11,753 17,239 67,616 100,483February 56,161 83,695 12,611 18,047 68,772 101,742
March 67,788 100,002 16,541 24,056 84,329 124,058April 70,660 106,009 14,258 21,113 84,918 127,122May 75,065 112,845 16,781 24,721 91,846 137,566June 68,666 103,615 14,257 21,208 82,923 124,823July 69,977 103,216 14,511 20,998 84,488 124,214
August 67,356 98,507 15,235 21,557 82,591 120,064September 64,014 95,390 16,256 22,572 80,270 117,962
October 69,970 104,455 15,680 21,680 85,650 126,135November 74,056 112,663 16,449 22,610 90,505 135,273December 72,194 108,678 17,583 24,384 89,777 133,062
Total 811,770 1,212,319 181,915 260,185 993,685 1,472,504
8
From the tables above, it can be seen that the total throughput of container handling
increased by 3%. However, in terminal II, the annual throughput of 1999 decreased
by 15%. One of the reasons was that the number of gantry cranes in terminal II was
reduced by one unit.
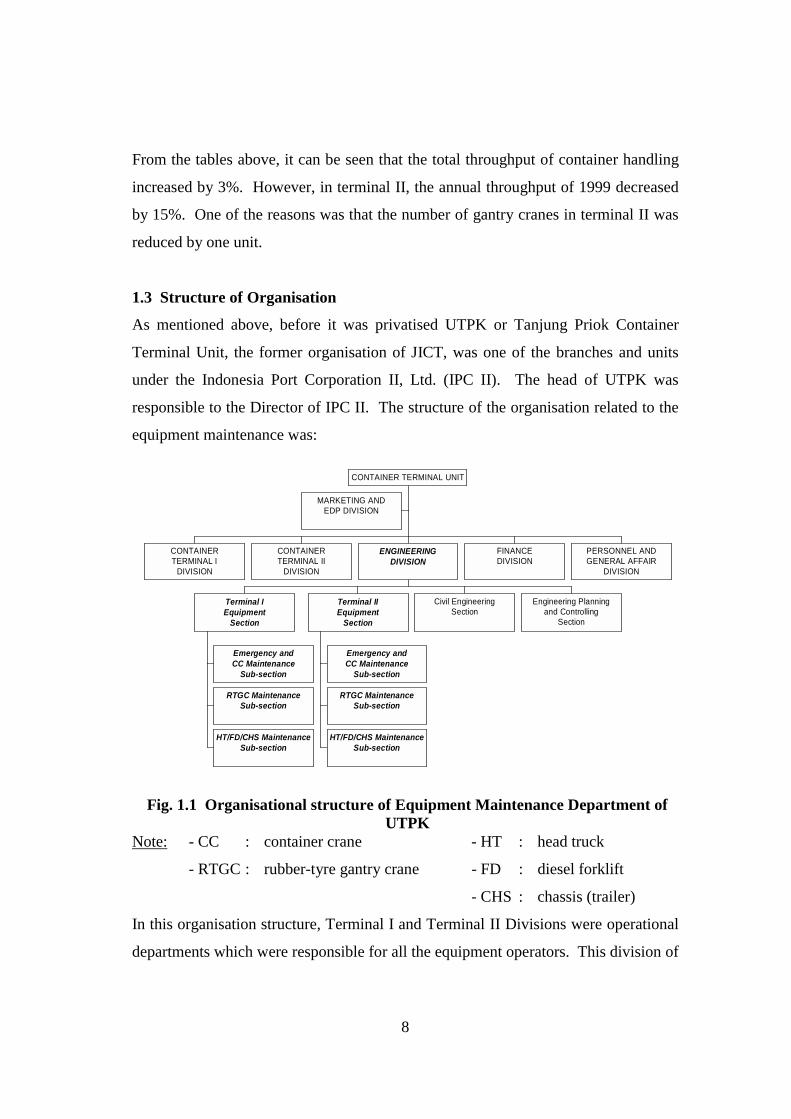
1.3 Structure of Organisation
As mentioned above, before it was privatised UTPK or Tanjung Priok Container
Terminal Unit, the former organisation of JICT, was one of the branches and units
under the Indonesia Port Corporation II, Ltd. (IPC II). The head of UTPK was
responsible to the Director of IPC II. The structure of the organisation related to the
equipment maintenance was:
Fig. 1.1 Organisational structure of Equipment Maintenance Department ofUTPK
Note: - CC : container crane - HT : head truck
- RTGC : rubber-tyre gantry crane - FD : diesel forklift
- CHS : chassis (trailer)
In this organisation structure, Terminal I and Terminal II Divisions were operational
departments which were responsible for all the equipment operators. This division of
MARKETING ANDEDP DIVISION
CONTAINERTERMINAL I
DIVISION
CONTAINERTERMINAL II
DIVISION
Emergency andCC Maintenance
Sub-section
RTGC MaintenanceSub-section
HT/FD/CHS MaintenanceSub-section
Terminal IEquipment
Section
Emergency andCC Maintenance
Sub-section
RTGC MaintenanceSub-section
HT/FD/CHS MaintenanceSub-section
Terminal IIEquipment
Section
Civil EngineeringSection
Engineering Planningand Controlling
Section
ENGINEERINGDIVISION
FINANCEDIVISION
PERSONNEL ANDGENERAL AFFAIR
DIVISION
CONTAINER TERMINAL UNIT
9
the organisation seemed less effective from the co-ordination point of view as the
operators were the first people who faced equipment trouble. In case there was
trouble, operators should inform the maintenance staff as soon as possible so that the
idle time could be shortened.
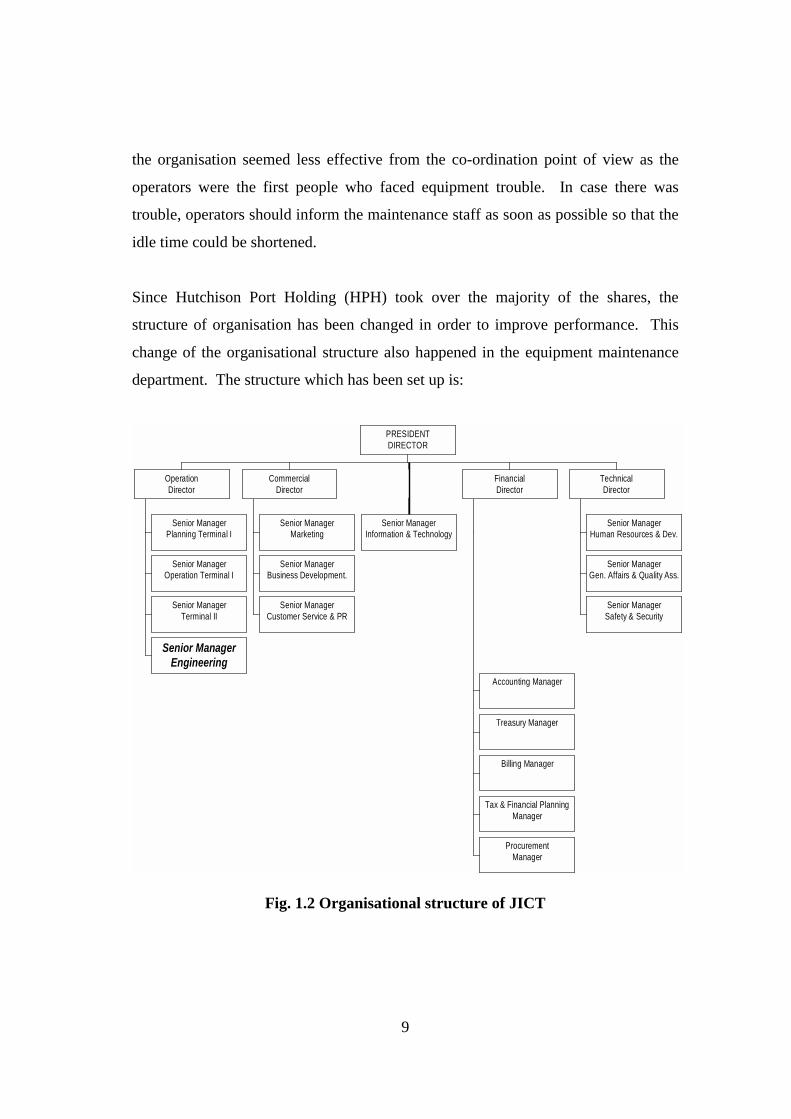
Since Hutchison Port Holding (HPH) took over the majority of the shares, the
structure of organisation has been changed in order to improve performance. This
change of the organisational structure also happened in the equipment maintenance
department. The structure which has been set up is:
Fig. 1.2. Organisation structure of JICT
Fig. 1.2 Organisational structure of JICT
Senior ManagerPlanning Terminal I
Senior ManagerOperation Terminal I
Senior ManagerTerminal II
Senior ManagerEngineering
OperationDirector
Senior ManagerMarketing
Senior ManagerBusiness Development.
Senior ManagerCustomer Service & PR
CommercialDirector
Senior ManagerInformation & Technology
Accounting Manager
Treasury Manager
Billing Manager
Tax & Financial PlanningManager
ProcurementManager
FinancialDirector
Senior ManagerHuman Resources & Dev.
Senior ManagerGen. Affairs & Quality Ass.
Senior ManagerSafety & Security
TechnicalDirector
PRESIDENTDIRECTOR

10
Organisational structure related to Equipment Maintenance
As shown above, the engineering department is the sub-ordinate of the Operation
Director. This organisation structure is set up in order to shorten and simplify the co-
ordination of the operation department and equipment maintenance department;
therefore, a harmonised communication between both departments could be created
(UNCTAD, 1986). The entire organisational structure under the Operational
Directorate and the organisational structure related to equipment maintenance
management are:
Fig. 1.3. Organisational structure of Operation Directorate of JICT
Fig. 1.4. Organisational structure of Equipment Maintenance and Repair
Ship & YardPlanning A Mgr.
Ship & YardPlanning B Mgr.
Senior ManagerPlanning Terminal I
Shift Operation AManager
Shift Operation BManager
Shift Operation CManager
Shift Operation DManager
Gate Manager
Senior ManagerOperation Terminal I
Planning &Operation A Mgr.
Planning &Operation B Mgr.
Senior ManagerTerminal II
Equipment M&RManager
Civil Manager
Senior ManagerEngineering
OPERATIONDIRECTOR
Terminal ICC Maintenance
Supervisor
Terminal IRTGC Maintenance
Supervisor
Terminal IHT/FD/CHS Maintenance
Supervisor
Terminal IICC/RTGC Maintenance
Supervisor
Terminal IIHT/FD/CHS Maintenance
Supervisor
Equipment EmergencySupervisor
Equipment M & RManager
11
The change which occurs at the level of supervisors is that the supervisors of
maintenance of CC and RTGC in the terminal II are under the responsibility of one
person, due to the reduction in the number of owned-CC from two units to one unit
only. By involving CC and RTGC in one supervisor level, the JICT’s management
hopes that the efficiency of employment can be improved. Another change is that
equipment emergency staff has become one level of supervision. The purpose of
setting up this supervisor is to simplify co-ordination among staff. In the previous
organisation, the equipment emergency staff belonged to each supervisor
(maintenance of CC, RTGC and HT/FD/CHS).
1.4 Vision and Mission of JICT
Having been established as a subsidiary company of Indonesia Port Corporation II,
JICT is ready to be the best container terminal in Indonesia and at a world class level
of container terminals, by employing modern equipment and facilities (JICT, 1999).
In order to achieve these objectives, JICT has set up its vision, mission and company
commitment.
The company’s vision is to service its customers or port users by consistent
professional-service in order to meet the customer requirements. The company’s
mission is to develop a port system and technology to support the role of port as the
national economic gateway.
The company’s commitments are:
• to continuously improve the quality of services,
• to maintain the synergy between the company and its environment by involving
and maintaining the right man in the port business, and
• to continuously improve and develop company’s skill and ability as the
guarantee in maintaining the leadership in the port sector.
(JICT, 1999).
12
The company management recognises that in order to realise its vision and mission
the company should understand and balance the needs of customers, employees,
shareholders and company environments. JICT in the Quality Manual of ISO 9002
document, 1999, states:
Commitment to the customers is to meet the requirements that have
been agreed. Commitment to the employees is to guarantee the
work condition and environment that leads to be conducive and
providing the occasion for the employees to develop all of their
potency. Commitment to the share holders is to highly honour the
ethic and principle of law in doing business planning by
professional way. Commitment to environments is to create job
opportunities to involve in the port business.
1.5 Summary
1. In 1999, when Indonesia suffered an economic crisis, UTPK was privatised in
order to strengthen its capital structure. The terminal henceforth was named
Jakarta International Container Terminal (JICT), and operated by a joint venture
company between Indonesia Port Corporation II, Ltd. and Hutchison Port
Holding (HPH), Hongkong.
2. HPH as the majority shareholder of JICT in operating the terminal changes the
structure of organisation in order to improve the efficiency and performance of
the company. Change also occurred in the amount of container handling
equipment, which has led to affect annual throughput.
13
CHAPTER II
CONTAINER HANDLING EQUIPMENT
2.1 Existing Container Handling Equipment
In order to realise the achievement of the vision and mission, JICT continuously
serves its customer by increasing the quality of service as close to the customer
requirement as possible. The quick, right, safe and convenient service at a level as a
world class container terminal always becomes a priority. This condition leads JICT
to have a commitment to meet and exceed the customer requirements by being
professional, innovative and continuously improving service. One of the actions
which has been taken by JICT is to provide adequate equipment in order to quickly
serve loading, unloading, receipt or delivery operations.
One of disadvantages which is presently faced by JICT is the limitation of land
resources to develop either the berths or container yards. Presently, JICT has two
terminals. Terminal I is composed of a 900 meter-length quay with 31.4 Ha
container yard and –12 meter-depth. Terminal II has a 510 meter-length quay with
6.83 Ha container yard and –9 meter-depth (Jakarta International Container
Terminal, 1999). Presently, JICT is also preparing a 262 meter-length new quay in
the terminal I with –14 meter-depth. This new quay is prepared to anticipate post
panamax container vessels which are expected to call at JICT. On the other hand, the
supply of human resources which is relatively plentiful and cheap is one of the
advantages of JICT.
By taking into consideration those advantages and disadvantages, JICT employs a
rubber-tyre gantry crane (RTGC) system for the operation system. This system
14
needs trailers to support the operation by transporting containers from the quay to the
yard. For imports or discharging operations, containers are discharged from the ship
by container crane (CC) and picked up and transported to the yard by trailer. The
trailer is composed of head truck (HT) and chassis. In the stacking yard, the
containers are picked up by RTGC and stacked to the slot which is planned before.
The system is also applied to the exports or loading operation. In a particular case,
the handling of containers is done by top loader or side loader. Top loader and side
loader are a kind of forklift which is completed by a specific attachment to handle the
container, namely a spreader. This kind of operation is normally applied to the
receiving of export empty containers from the external trailer.
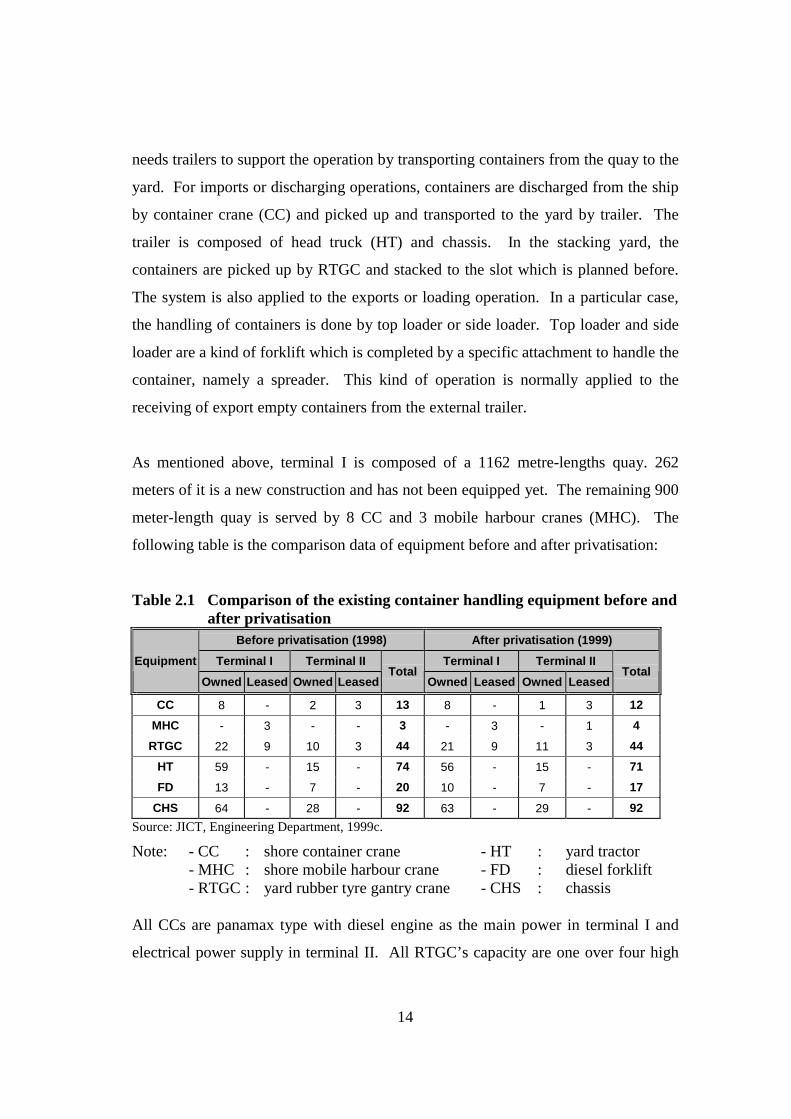
As mentioned above, terminal I is composed of a 1162 metre-lengths quay. 262
meters of it is a new construction and has not been equipped yet. The remaining 900
meter-length quay is served by 8 CC and 3 mobile harbour cranes (MHC). The
following table is the comparison data of equipment before and after privatisation:
Table 2.1 Comparison of the existing container handling equipment before andafter privatisation
Before privatisation (1998) After privatisation (1999)Terminal I Terminal II Terminal I Terminal IIEquipment
Owned Leased Owned LeasedTotal
Owned Leased Owned LeasedTotal
CC 8 - 2 3 13 8 - 1 3 12MHC - 3 - - 3 - 3 - 1 4
RTGC 22 9 10 3 44 21 9 11 3 44HT 59 - 15 - 74 56 - 15 - 71FD 13 - 7 - 20 10 - 7 - 17
CHS 64 - 28 - 92 63 - 29 - 92Source: JICT, Engineering Department, 1999c.
Note: - CC : shore container crane - HT : yard tractor- MHC : shore mobile harbour crane - FD : diesel forklift- RTGC : yard rubber tyre gantry crane - CHS : chassis
All CCs are panamax type with diesel engine as the main power in terminal I and
electrical power supply in terminal II. All RTGC’s capacity are one over four high

15
container stack, except 7 units owned-RTGC in terminal II which are one over three
high container stack. The loading capacities of CC, RTGC and HT are 40 tons. The
forklift (FD) consists of:
Table 2.2 Comparison of capacity and number of forklifts before and afterprivatisation
Before privatisation (1998) After privatisation (1999)Capacity
Terminal I Terminal II Total Terminal I Terminal II Total
2 tons 4 3 7 4 3 73.5 tons 1 - 1 1 - 110 tons - 1 1 - 1 115 tons 4 1 5 2 1 325 tons 2 - 2 1 - 136 tons 1 1 2 1 1 242 tons 1 1 2 1 1 2
Total 20 Total 17
The function of forklifts is mainly to support the operation and maintenance
activities. They are not classified as the main container handling equipment. For the
main handling operation system, JICT only employs CC, RTGC and trailer, which is
composed of HT and chassis. Due to such a function of the forklifts, the analysis of
forklift performance will be less than other kinds of equipment.
In terms of leased equipment, all maintenance matters are under the responsibility of
the owner or lessor. Due to the condition, an analysis of this leased equipment is
excluded.
2.2 Performance of Equipment before Privatisation
The management of UTPK measured the performance of equipment by taking into
account the achievement of equipment availability, utilisation and break down. The
management of UTPK defined those of the performance indicators as follows:
16
a). Availability was defined as the comparison between the total number of time
available for equipment to be utilised and the total number of working hours in a
specific time period (monthly).
b). Utilisation was defined as the comparison between the total number of time that
equipment has been utilised and the total number of working hours in a specific
time period (monthly).
c). Break-down was defined as the comparison between the total number of time
that equipment has broken down or been failure and the total number of working
hours in a specific time period.
Available time was defined as total working hours minus total break down time and
total maintenance time. Working hours is defined as total time when terminals open
to operate. By taking into account those performances in the evaluation, the
management expected that the achievement of either equipment operation or
personnel of the maintenance staff could be measured.
It has been mentioned in the previous chapter that the privatisation was done when
Indonesia was facing an economic crisis, and economically, the impact of the crisis
had not finished up to the beginning of 2000. Referring to such a condition, data of
performances was taken from the same situation, that is during the economic crisis.
Data of performance before privatisation was taken during the year of 1998 and can
be seen in its entirely in the following graphs:
Fig. 2.1 The graph of performance of container cranes in terminal I, 1998
Source: Unit Terminal Petikemas Tanjung Priok, Report of Equipment Performances, 1998
0
1 0
2 0
3 0
4 0
5 0
6 0
7 0
8 0
9 0
1 0 0
J A N F E B M A R A P R M A Y J U N J U L A U G S E P O C T N O V D E C A V R G
% o
f tot
al w
orki
ng h
ours
0
2
4
6
8
1 0
1 2
1 4
1 6
1 8
% o
f Tot
al w
orki
ng h
ours
U t i l i s a t i o n ( % ) A v a i l a b i l i t y ( % )
D o w n t i m e ( % ) P r e v e n t i v e M a i n t e n a n c e ( % )

17
By the average availability of 87%, CCs’ performance was less standard compared to
the standard availability of 95% in Europe (Crook & Ircha, 2000b, Lecture Note).
Preventive Maintenance in the periods of March to June was quite high, on average
15%. This was mainly caused by the low traffic at the moment, so that there was
enough time available to maintain that equipment.
Fig. 2.2 The graph of performance of rubber-tyre gantry cranes in terminal I,1998
In January 1998 there were three units of RTGC under retrofit process, so that the
figure of preventive maintenance in this month was very high (41%). Retrofit is
defined as the maintenance activity by checking, readjusting, reconditioning and
replacing the whole system of the machine in order to improve the reliability of the
machine as close to the new condition as possible.
Fig. 2.3 The graph of performance of head trucks in terminal I, 1998
0
2 0
4 0
6 0
8 0
1 0 0
J A N F E B M A R A P R M A Y J U N J U L A U G S E P O C T N O V D E C A V R G
% o
f Tot
al w
orki
ng h
ours
0
5
1 0
1 5
2 0
2 5
3 0
3 5
4 0
4 5
% o
f Tot
al w
orki
ng h
ours
U t i l i s a t i o n ( % ) A v a i l a b i l i t y ( % )
D o w n t i m e ( % ) P r e v e n t i v e M a i n t e n a n c e ( % )
0
15
30
45
60
75
90
JAN FEB MAR APR MAY JUN JUL AUG SEP OCT NOV DEC AVRG
% o
f Tot
al w
orki
ng h
ours
0
20
40
60
80
% o
f Tot
al w
orki
ng h
ours
Utilisation (%) Availability (%)Down time (%) Preventive Maintenance (%)

18
The main problem that led to the down time being very high in the periods of the first
six months was the lack of rubber wheel-tyre available at the moment. The impact of
the economic crisis affected the increase in the parts’ price. Another reason was that
the long procedure should be done in obtaining spare parts. This was why the
availability of that equipment was very low, on average 60%.
Fig. 2.4 The graph of performance of container cranes in terminal II, 1998
The availability of those CCs was very high, but the utilisation was very low. This
condition was mainly caused by over supply of CC in the terminal II at the moment
(five units), whereas the length of the quay was 510 meters with –9 meters depth,
which is limited to the size of ship to berth.
Fig. 2.5 The graph of performance of rubber-tyre gantry cranes in terminal II,1998
0
20
40
60
80
100
JAN FEB MAR APR MAY JUN JUL AUG SEP OCT NOV DEC AVRG
% o
f Tot
al w
orki
ng h
ours
0
2
4
6
8
10
% o
f Tot
al w
orki
ng h
ours
Utilisation (%) Availability (%)Down time (%) Preventive Maintenance (%)
0
20
40
60
80
100
JAN FEB MAR APR MAY JUN JUL AUG SEP OCT NOV DEC AVRG
% o
f Tot
al w
orki
ng
hour
s
0
5
10
15
20
25
% o
f Tot
al w
orki
ng
hour
s
Utilisation (%) Availability (%)Down time (%) Preventive Maintenence (%)

19
The average availability of RTGCs of 89% and utilisation of 45% was quite good.
The down time of 18% in November and 22% in December was caused by problems
in electrical control system parts which should be imported from the country of
origin. The long time for their procurement was caused by the increase in price as an
impact of the economic crisis and the procedure that should be done at the moment.
Fig. 2.6 The graph of performance of head trucks in terminal II, 1998
The performances of HTs were relatively the same as RTGCs. The availability was
very high, on average 97%, but the utilisation was quite low, on average 37%.
By looking at the graphs above, it can be seen that the availability of equipment in
terminal II was better than in terminal I, but the utilisation of equipment in terminal I
was higher than in terminal II. This condition was reasonable due to container traffic
in both terminals (table 1.2 chapter I).
2.3 Performance of Equipment after Privatisation
Soon after privatisation was complete, the new management modified some policies
and strategies in order to improve the performance of the company. The change of
the policy was not only the change of organisational structure, but also the policy of
the operation system including equipment maintenance.
0
20
40
60
80
100
JAN FEB MAR APR MAY JUN JUL AUG SEP OCT NOV DEC AVRG
% o
f Tot
al w
orki
ng h
ours
0
2
4
6
8
10
%of
Tot
al w
orki
ng h
ours
Utilisation (%) Availability (%)Down time (%) Preventive Maintenance (%)

20
2.3.1 Changing in measuring methods
One of the changes which has happened in the equipment maintenance management
is that the parameters of the evaluation has been changed in order to reflect the
achievement of economic activity. The management of JICT tends to measure the
performance of equipment related to the operation. Due to this objective, JICT
management measures mean movement between failures (MMBF) and mean time to
repair (MTTR).
MMBF is defined as the number of containers that can be moved or handled in
between two failures or break-downs. MMBF is concerned more with production
rather than time scale. The production is expressed by the number of containers
which can be moved by that equipment. MTTR is defined as the average time
needed by maintenance staff to deal with each failure or break down. With such
kinds of parameters JICT’s management expects that the productivity of equipment
can be measured as close to the real condition as possible.
There are also some changes in terminology of equipment performance indicators.
JICT divides availability into three different terms, namely availability equipment,
availability inherent and availability occupied.
a). Availability equipment is defined as:
b). Availability inherent is defined as:
c). Availability occupied is defined as:
equipment ofnumber Totaloperate toavailable equipment ofNumber Ae =
monthpresent in timepossible Total ce Maintenane Preventiv timedownBreak - 1 Ai +=
meterhour Enginedown timeBreak - 1 Ao =

21
2.3.2 Equipment performances
In order to represent the time periods of post-privatisation, data of equipment
performance was taken from May 1999 up to November 1999. This is taken by an
assumption that during April 1999 the company had not been normal for the
operation or by in other words the company was in a transition period and in
December, when data was collected, the updating of performance data in that month
had not properly finished. This period also reflected that economically Indonesia
was facing an economic crisis. The data of the performance can be seen in its
entirely in the following graphs:
Fig. 2.7.a The graph of MMBF and MTTR of container cranes in terminal I,1999
Source: Jakarta International Container Terminal, Report of Equipment Performance, 1999c.
Fig. 2.7.b The graph of availability of container cranes in terminal I, 1999
0
1 0 0
2 0 0
3 0 0
4 0 0
5 0 0
6 0 0
7 0 0
8 0 0
M a y J u n J u l A u g S e p O c t N o v A v e ra g e
Box
/failu
re
0 .0 0
0 .2 0
0 .4 0
0 .6 0
0 .8 0
1 .0 0
1 .2 0
Hou
rs
M M B F (b o x ) M T T R (h o u r )
75.0%
80.0%
85.0%
90.0%
95.0%
100.0%
May Jun Jul Aug Sep Oct Nov Average
Ae (Avai'ty Equipment) Ai (Avai'ty Inherent) Ao (Avai'ty Occupied)
22
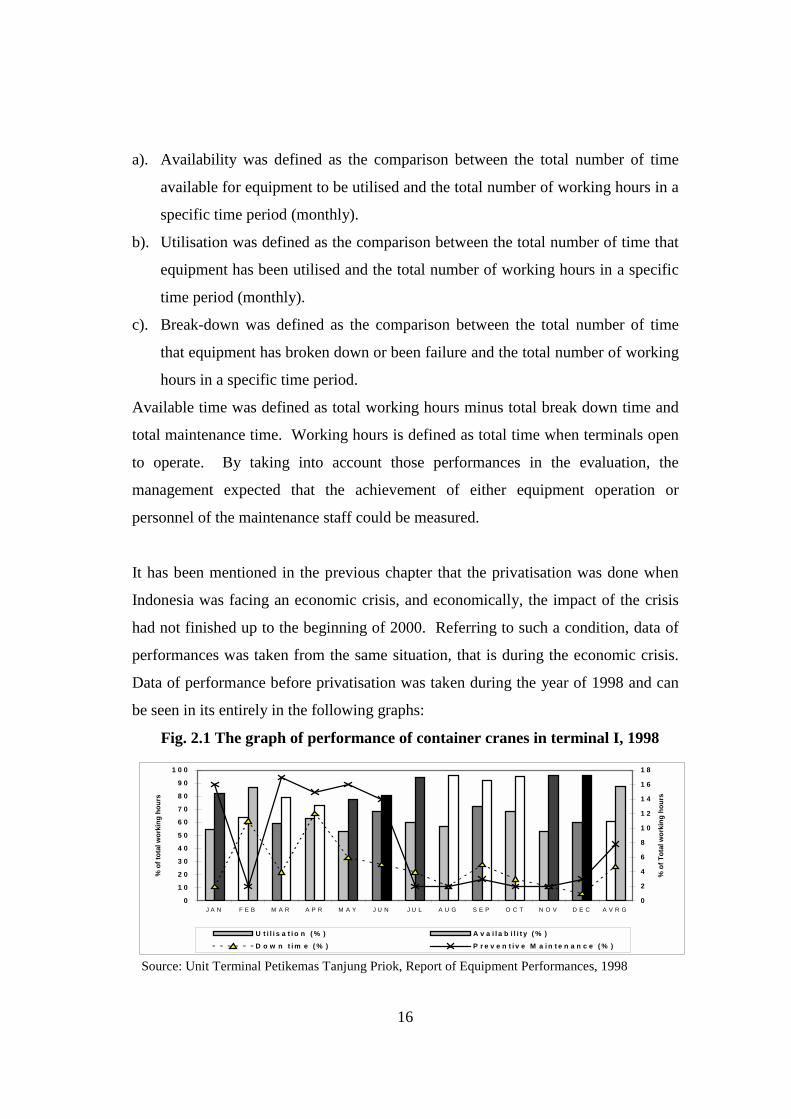
From both tables it can be seen that when MMBF of CC in terminal I was very low,
the availability level was very low as well. Container traffic at the moment was quite
low, with 64,014 movements, so that maintenance could be done more intensively.
The average availability inherent was very high with an average of 96%.
Fig. 2.8.a The graph of MMBF and MTTR of RTGCs in terminal I, 1999
Fig. 2.8.b The graph of availability of RTGCs in terminal I, 1999
Availability inherent of those RTGCs was very high, on average 98%. Availability
equipment in the beginning of the periods was quite low, which might be caused by
the impact of the previous system.
0200400600800
1,0001,2001,400
May Jun Jul Aug Sep Oct Nov Average
Box
es/fa
ilure
0.000.200.400.600.801.001.201.40
Hou
rs
MMBF (box) MTTR (hour)
0.0%
20.0%
40.0%
60.0%
80.0%
100.0%
May Jun Jul Aug Sep Oct Nov Average
Ae (Avai'ty Equipment) Ai (Avai'ty Inherent) Ao (Avai'ty Occupied)
23
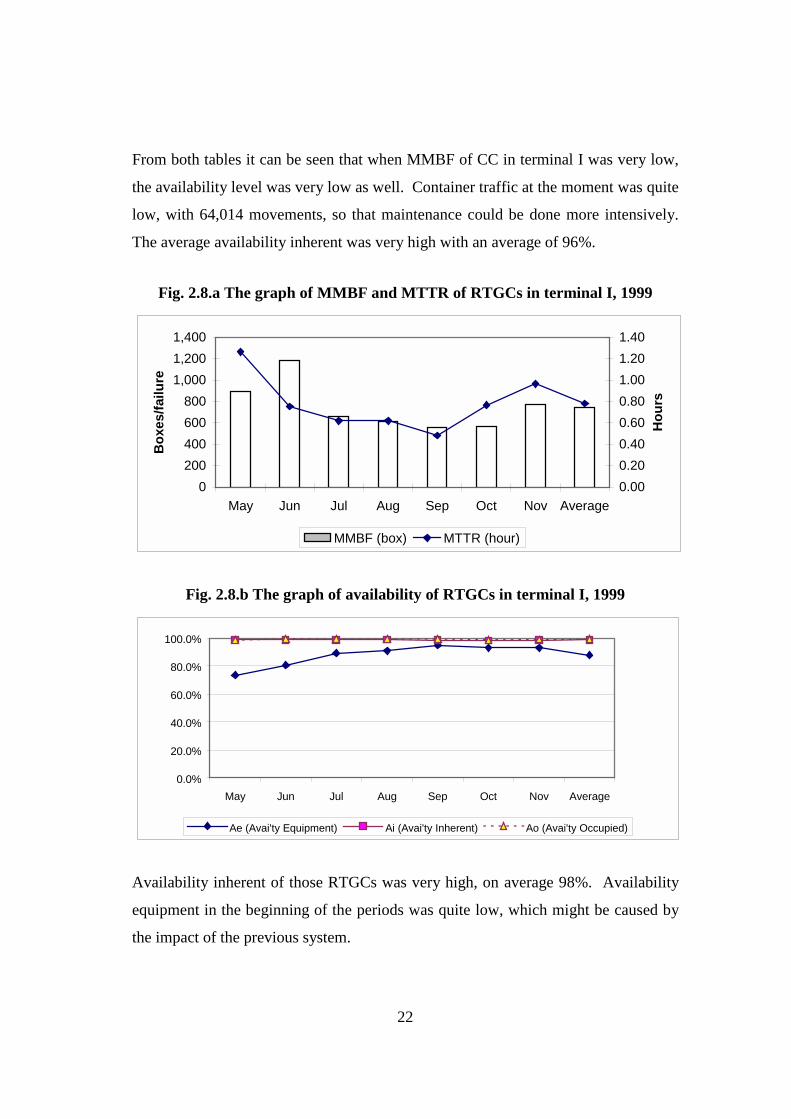
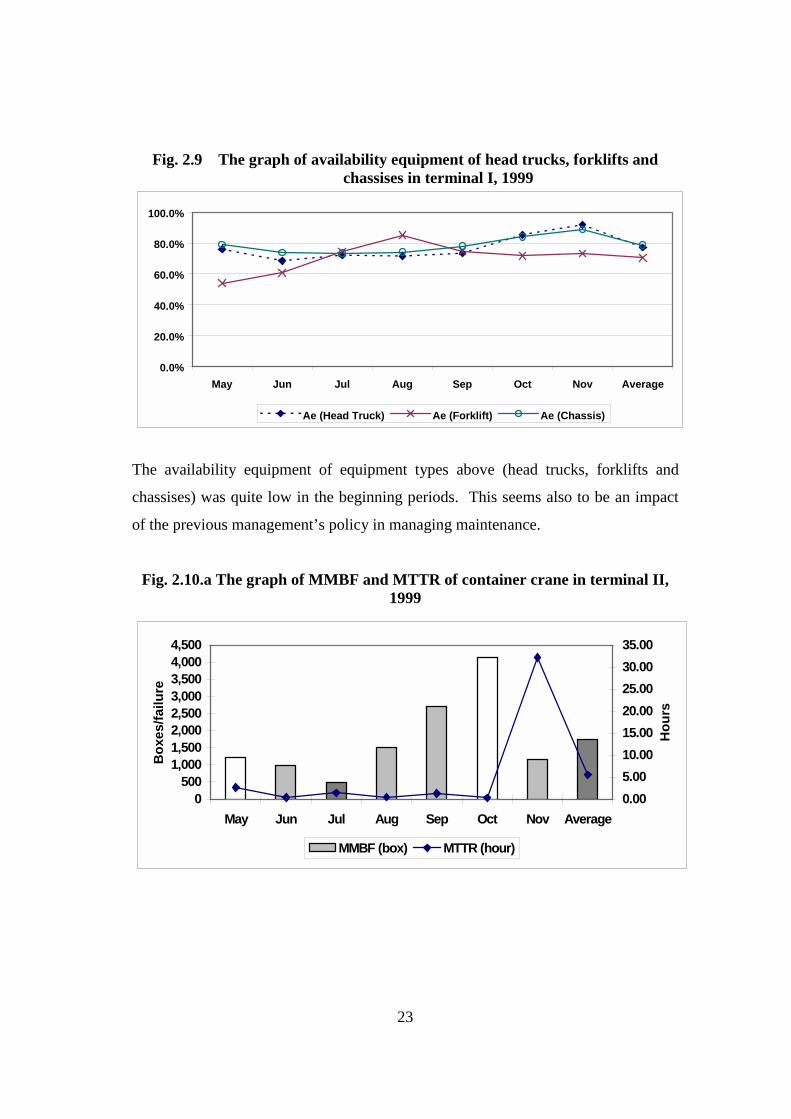
Fig. 2.9 The graph of availability equipment of head trucks, forklifts andchassises in terminal I, 1999
The availability equipment of equipment types above (head trucks, forklifts and
chassises) was quite low in the beginning periods. This seems also to be an impact
of the previous management’s policy in managing maintenance.
Fig. 2.10.a The graph of MMBF and MTTR of container crane in terminal II,1999
0.0%
20.0%
40.0%
60.0%
80.0%
100.0%
May Jun Jul Aug Sep Oct Nov Average
Ae (Head Truck) Ae (Forklift) Ae (Chassis)
0500
1,0001,5002,0002,5003,0003,5004,0004,500
May Jun Jul Aug Sep Oct Nov Average
Box
es/fa
ilure
0.005.0010.0015.0020.0025.0030.0035.00
Hou
rs
MMBF (box) MTTR (hour)

24
Fig. 2.10.b The graph of availability of container crane in terminal II, 1999
Although the average MMBF of CC of 1,739 boxes was very high, the MTTR of this
CC in November 1999 was very high as well at 32 hours. This condition affected
very much the equipment availabilities, whether availability equipment, inherent or
occupied of that equipment.
Fig. 2.11.a The graph of MMBF and MTTR of RTGCs in terminal II, 1999
0.0%
20.0%
40.0%
60.0%
80.0%
100.0%
May Jun Jul Aug Sep Oct Nov Average
Ae (Avai'ty Equipment) Ai (Avai'ty Inherent) Ao (Avai'ty Occupied)
0
50
100
150
200
250
May Jun Jul Aug Sep Oct Nov Average
Box
es/fa
ilure
0.000.501.001.502.002.503.003.50
Hou
rs
MMBF (box) MTTR (hour)
25
Fig. 2.11.b The graph of availability of RTGCs in terminal II, 1999
The average MMBF of those RTGCs during that period was 99 boxes, the MTTR
was 1.3 hours and availability inherent was 98%. These figures of performance
reflect that generally speaking the performance of this equipment was very good.
Fig. 2.12 The graph of performance of head trucks in terminal II, 1999
By looking at the graph above, the performance of head truck in terminal II was very
good. The average availability equipment, inherent and occupied was more than
96% and the mean time needed to deal with each failure or break down on average
was 1.7 hours.
0%
20%
40%
60%
80%
100%
May Jun Jul Aug Sep Oct Nov Average
Ae (Avai'ty Equipment) Ai (Avai'ty Inherent) Ao (Avai'ty Occupied)
90.0%
92.0%
94.0%
96.0%
98.0%
100.0%
May Jun Jul Aug Sep Oct Nov Average0.000.501.001.502.002.503.003.50
Hou
rs
Ae (Avai'ty Equipment) Ai (Avai'ty Inherent) Ao (Avai'ty Occupied)MTTR (hour)

26
Fig. 2.13 The graph of performance of forklifts in terminal II, 1999
In the first two months of the period, the availability occupied of those forklifts was
very low; meanwhile MTTR was very on average 16 hours during the same period.
The problem at the moment was the lack of some spare parts available which seemed
to be an impact of the previous policy.
Fig. 2.14 The graph of performance of chassises in terminal II, 1999
Although the availability equipment and inherent was very high, on average 98% and
99%, the availability inherent of those chassis was quite low, on average only 58%.
This problem was mainly caused by the lack of rubber-wheel availability. The
management took the policy that the rubber wheels, which were installed to the
0%
20%
40%
60%
80%
100%
May Jun Jul Aug Sep Oct Nov Average0369121518
Hou
rs
Ae (Avai'ty Equipment) Ai (Avai'ty Inherent) Ao (Avai'ty Occupied)MTTR (hour)
0%
20%
40%
60%
80%
100%
May Jun Jul Aug Sep Oct Nov Average0
2
4
6
8
Hou
rs
Ae (Avai'ty Equipment) Ai (Avai'ty Inherent) Ao (Avai'ty Occupied)MTTR (hour)

27
chassises, were not new ones, but used ones which were taken from the head trucks’
rubber wheels.
2.4 Summary
1. JICT applies RTGC system in its handling operation, which was applied by
UTPK as well. This operation system requires many trailers to support the
operation as well as container cranes and rubber-tyre gantry cranes. As the main
equipment of the handling operation, the analysis focuses more on that kind of
equipment.
2. In order to compare the two different management systems of UTPK and JICT, it
is necessary to take into account the same time frame with the same economic
situation which is faced by both UTPK and JICT, i.e., the economic crisis
periods.
3. The changes of the management system impacts on the changes of the equipment
performance indicators. Instead of availability inherent, which was traditionally
used by UTPK, JICT adds availability occupied and availability equipment. The
performance is also measured in order to reflect as close as possible the
productivity of either the equipment itself or maintenance staff, by measuring
MMBF and MTTR.
4. Generally speaking, the performance of equipment could be improved by JICT’s
management, for example the improvement of availability inherent and occupied
ratio, and the reduction of MTTR, which are indicated in the graphs above. Even
though there are some improvements, the trend is not clear due to the short period
of recording data, that is eight months. The factors affecting the improvement
will be discussed in the following chapter.

28
CHAPTER III
ANALYSIS AND EVALUATION OF EQUIPMENT PERFORMANCES
FROM VARIOUS POINTS OF VIEW
3.1 Introduction
In most port organisations, the role of the port engineering department is to provide
and maintain, to a high standard, the port’s civil work and infrastructure, its marine
craft and navigational aids, its cargo-handling equipment and its technical services
(Thomas, 1989). This means that the engineering services do not merely mean the
end of providing a full supportive operational activity of the ports to serve the needs
of port users. Even though the engineering department is not directly involved in
serving a port’s customers, it has a vital role to achieve the organisation’s objectives.
Along with the development of technology, equipment is becoming more and more
sophisticated. As the first person who faces failure, the machine operator attempts to
repair a machine. Together with the development of technology, equipment has
become much more complex, leading to the requirement of special skills, tools,
equipment and materials for repairs and operation. These typical requirements are
almost impossible to be met by the operators themselves. Therefore, to deal with this
modern and more complex equipment there is a need for well-trained maintenance
staff as well as operator staff.
Moreover, equipment maintenance and operation need to be overseen by a particular
type of management department, namely maintenance management department.
UNCTAD (1990) in the handbook of Improvement of Port Performance 3, states that
equipment management is composed of eight elements:
29
- port inventory planning,
- equipment procurement,
- equipment maintenance
- supplies management
- equipment operations
- management & manpower development
- institutional framework, and
- engineering management information systems.
These eight equipment management elements can be illustrated in the following
figure:
Source: UNCTAD, 1990, IPP3
Fig. 3.1 Equipment Management Elements
These individual elements are interdependent on each other. The failure of
implementing or organising one element of activities may lead to deficiencies or
PortInventoryPlanning
EquipmentProcurement
EquipmentMaintenance
SuppliesManagement
EquipmentOperations
Management& ManpowerDevelopment
InstitutionalFramework
EngineeringManagementInformation
Systems

30
problems in others (Thomas, et. al, 1989). This means that the success of the overall
management function depends on the strength and qualities of those elements.
According to the above elements, this chapter will try to analyse the performance of
container handling equipment from point of view of these elements, to find out the
problems which might be faced and the alternative solutions of the problems as well.
3.2 Analysis of Equipment Performances before Privatisation
3.2.1 Equipment operation
3.2.1.1 Terminal I
In chapter 2, the graph of equipment performance was shown. Generally speaking,
the availability of CC and RTGC in terminal I during 1998 was relatively stable.
The average performance of equipment during 1998 can be illustrated in the
following graph:
Fig. 3.2 Graph of average equipment performances in terminal I, 1998
From the graphs above, it can be seen that break time for head truck during the
period of 1998 was very high, due to the lack of spare parts available, which led to
the lack of preventive maintenance as well.
The availability of equipment can be calculated by using the following formula:
0
20
40
60
80
100
CC RTGC HT
% o
f wor
king
hou
rs
0
10
20
30
40
50
% o
f wor
king
hou
rs
U tilisation (%) Availability (%)
Down tim e (%) Preventive M aintenance (%)

31
Av = Availability
n = number of machines (equipment)
Operationally, the management of UTPK determined that the operation time was
divided into three shifts per day and each shift was employed for eight hours with
one-hour pause time. This means that the working hours in UTPK was 21 hours per
day. The terminal was also open 7 days per week. Although operationally the
working hours was 21 hours per day, the Engineering Division of UTPK determined
that the working hours for equipment in terminal I was 24 hours per-day and 7 days
per-week. The main reason why the Engineering Division decided on such a policy
was that the main power installed for container cranes in terminal I was the diesel
engine.
The characteristic of the diesel engine is that it needs time to idle up or to achieve the
maximum power capacity when it starts to run. Instead of being switched-off during
the one-hour pause time, CCs were allowed to be run on. By taking the assumption
that it needed 20 minutes to allow the engine to achieve its maximum power
capacity, this meant that operationally the handling of five to six boxes of container
per CC would be lost. This condition could be explained as followed:
By combining fig. 3.2 above and terminal I throughput in 1998 (table 1.2 chapter I) it
could be assumed that the productivity of the container crane in terminal I was:
- Total throughput in 1998 in the terminal I = 755,953 boxes
=
n
iPMi
1
= total time needed for executing preventive maintenance program
=
n
iDTi
1= total time needed for dealing with down time
24)monthpresent in days ofnumber (n
)24monthpresent in days ofnumber n(Av 1 1
××
−−××= = =
n
i
n
iDTiPMi
32
- Average utilisation of CC in 1998 = 61%
- Number of CC employed in the terminal I = 8
- Number of MHC employed in the terminal I = 3
Practically, three MHCs were employed in one berth and each of the remaining
berths employed two CCs. This meant that three MHCs could be assumed as two
CCs; therefore, terminal I employed 10 CCs. Utilisation of 61% meant that the total
worked-hours which had been utilised by each CC was:
(61% x 365 x 24) hours = 5,343.6 hours.
The worked-hours is defined as total time which is recorded by machine-hour-meter
to serve operations during a specific period (daily, weekly, monthly or yearly). In
fact, the worked-hours of CC was less due to the difference of three hours between
the operational and engineering departments in determining service hours. The
actual worked-hours of each CC according to the operational point of view was:
The total worked-hours of 8 CCs and 3 MHCs, which was assumed to be similar to
two CCs, was 46,756.5; therefore, the average productivity of CCs was:
(Total throughput/total worked-hours) = 755,953 / 46,756.5
≈ 17 boxes/CC/hour.
By allowing the engine not to be employed for 20 minutes after pause time meant
that they would lose the handling of six boxes of containers. The cheapest tariff of
container handling at the moment was US$ 62/boxes, i.e., the tariff for handling a
20’ empty container (UTPK, 1998). This meant that they would lose an opportunity
revenue of US$ 372 for not employing one CC for 20 minutes.
The cost of allowing an engine to be run for one hour can be explained as followed:
65.675,4)24
6.343,53(6.343,5 =×−
33
- The fuel consumption of a diesel engine is 180 grams per-HP per-hour (de
Heer, 2000, p.18).
- Maximum engine horse power capacity was employed to CC = 2095 (for new
engine Caterpillar D.3516 TA)
- The fuel consumption for running the engine for one hour = (180 x 2095) grs.
= 377 kgs.
- Specific gravity of diesel fuel = 0.85 kg/litres
- The volume of diesel fuel needed for running the engine for one hour ≈ 444
litters.
- The price of diesel fuel in Jakarta at the moment = US$ 0.1/litter.
- The fuel cost needed for running the engine for one hour = US$ 44.4
- The cost of lubricant assumed as a percentage of fuel cost (de Heer, 2000,
p.20) was normally no more than 10% of the fuel cost.
By comparing both calculations, it could be said that by allowing the engines to be
run on during one-hour pause time was better than switching-off the engine. This
was why the Engineering Division of UTPK applied a 24 hour working-period for
equipment in terminal I, instead of 21 hours.
During the periods of April and May 1998, from 59 HTs in terminal I, the
availability time of that equipment was 23% and 33% only. This meant that HTs
were only available to be utilised on average 5.5 and 8 hours or 324.5 HT-hours and
472 HT-hours per-day. The total throughput during those periods was 61,823 boxes
and 56,578 boxes (table 1.2 chapter 1); therefore, the daily throughput of the terminal
was 2,061 boxes and 1,825 boxes. Supposing the handling rate of CC was 17
boxes/hours and the availability time of that equipment was 90% and 93% at the
moments, the total CC-hours needed in April was:
hours-CC 1350.917
2,061 hours-CC =×
=
and in May was:

34
hours-CC 115 0.9317
1,825 hours-CC =×
=
The management of UTPK decided to serve one CC by 3 RTGCs and 5 HTs;
therefore, everyday they needed 675 HT-hours during April and 575 HT-hours
during May 1998. In order to cover the lack of HT-hours available, UTPK took
action by leasing trailers from another company.
3.2.1.2 Terminal II
The average equipment performance during the periods of 1998 can be seen in the
following graph:
Fig. 3.3 Graph of average equipment performances in terminal II, 1998
In terminal II, UTPK employed service time of 21 hours per-day and seven days per-
week applied either to the operational division or engineering division. This was
mainly due to the nature of CCs which were employed in the terminal. The CCs
used the electrical generator as the main power. Due to this condition, the formula
for availability therefore becomes:
21)monthpresent in days ofnumber (n
)21monthpresent in days ofnumber n(Av 1 1
××
−−××= = =
n
i
n
iDTiPMi
0
20
40
60
80
100
CC RTGC HT
% o
f wor
king
hou
rs
0
2
4
6
8
10
% o
f wor
king
hou
rsUtilisation (%) Availability (%)Down time (%) Preventive Maintenance (%)

35
Av = Availability
n = number of machine (equipment)
In addition, the productivity of CCs in terminal II which was relatively low
compared to the productivity of terminal I, was the other reason to determine this
service time. From fig. 2.4 chapter II, it can be seen that the average utilisation of
CC in terminal II was 30.67%. This meant that the total worked-hours of each CC
was:
30.67% x 21 x 365 ≈≈≈≈ 2,351 hours.
By combining table 1.2 in chapter I and fig. 2.2 in chapter II and by taking an
assumption that an MHC is similar to 0.67 CC, it can be calculated that the
productivity of each CC was:
212,090 / (2,351 x 5.67) ≈≈≈≈ 16 boxes/CC/hour.
Evaluation
By combining the utilisation and the productivity of CC in terminal II, it can be said
that operationally the utilisation of those CCs could be improved. However,
according to the depth of the quay in terminal II, which is –9 meters only, the
improvement might be very difficult due to this barrier.
3.2.2 Institutional framework and equipment procurement
From the organisational structure of the equipment maintenance department of
UTPK (Fig. 1.1, Chapter I), it can be said that the maintenance department is totally
separated from the operational department. For the lower level, the operator staff are
in a different organisation from the maintenance staff, whereas the equipment
operators should be involved in the maintenance process, at least for the daily
maintenance.
=
n
iDTi
1
= total time needed for executing preventive maintenance program
=
n
iPMi
1
= total time needed for overcoming down time
36
Indonesia Port Corporation II, Ltd. is a State-owned company. Operationally, it
largely depends on government regulations. Tariff policy, tax regulations, control of
investment and capital budgets are examples. UTPK, an organisation under the
Indonesia Port Corporation II, Ltd., was largely affected by government regulations
as well. Maintenance matters, such as equipment purchase, spare parts procurement
and employment of external consultants are some examples which were largely
affected by the regulations.
One regulation which very largely affected maintenance-matter activities was
Keputusan Presiden RI No. 16 Tahun 1994 (Keppres. No. 16/1994) or The
Presidential Decree of the Republic of Indonesia Number 16, 1994. This regulation
arranged the procedure of procurement either for goods or consultant services in
governmental institutions and all State-owned companies. The arrangements were
divided into three categories (Bappenas, 1994):
a. For the procurements which were less than Rp. 15,000,000.00, which was equal
to US$ 2,000, the company could directly pointed out to a supplier, contractor or
sub-contractor to execute those of the procurements.
b. For the procurements’ value between Rp. 15,000,000.00 to Rp. 50,000,000.00 (or
US$ 2,000 to US$ 6,700) the company could select a supplier, contractor or sub-
contractor to execute those of the procurements. Before selecting the contractors,
those contractors had to make a proposal regarding the price of procurements.
c. For the procurements which were more than Rp. 50,000,000.00 or US$ 6,700, the
company had to openly tender the projects to suppliers, contractors or sub-
contractors in order to find the selected party. In terms of determining the
selected party of the participants’ tender in Indonesia Port Corporation II, Ltd.,
the tendering was divided into three categories in accordance with the value of
projects. These are:
- The value of Rp. 50 millions up to Rp. 500 millions (or US$ 6,700 up to
US$ 66,700), the decision could be approved by the Head of Port Branch
Office or the Head of Unit Office.
37
- The value of Rp. 500 millions up to Rp. 10 billions (or US$ 66,700 up to
US$ 1,333,300) the decision had to be approved by the Directors of the
Indonesia Port Corporation II, Ltd.
- The value of more than Rp. 10 billions (or more than US$ 1,333,300) the
decision had to be approved by Badan Perencanaan Pembangunan
Nasional (Bappenas) or National Development Planning Agency, a national
body which is in charge of the planning of development in Indonesia.
In order to implement that regulation, the management of UTPK set up two special
working teams or committees, namely the committee of direct-selection and the
committee of tendering. The members of these committees were composed of inter-
discipline departments or divisions, namely the engineering departments, finance
departments, legal and insurance department, operational department and personnel
and general affairs department.
Practically, the process and procedure of the procurements took quite a long time,
very often up to one-month, even longer. This condition very largely affected the
performance of equipment. The delay of equipment spare parts was one example,
which was the affect of a lack of parts available in the inventory. One impact which
very largely affected the performance of equipment could be seen in the performance
of the head truck in terminal I in 1998 (fig. 2.4 chapter II). During the first semester
of the year, the availability of the head truck was very low, on average 47%. On the
other hand, the down time of that equipment was very high during the same periods,
even up to the first-nine months of the year on average 46%. The main cause of the
high down time was the lack of the head truck’s rubber-wheel (UTPK, Engineering
Division, 1999). The situation also happened to RTGC in terminal II due to the
unavailability of some electrical parts which had to be imported from the
manufacturer’s country. In addition, the policy of the government regarding the
currency policy also greatly affected the purchasing process, especially for parts
which had to be imported from abroad and had to be paid for by foreign currency.
38
3.2.3 Equipment maintenance strategies and practices
Sometimes there is misinterpretation when people try to distinguish maintenance and
repairing, although in fact these two activities are generally under the responsibility
of one department, i.e., maintenance and repair (M&R) department. Bachrun (1993)
defined maintenance and reparation as follows:
“Maintenance is a regular activity in regards to the facility which is
repeatedly done in order to keep that facility in a such condition as well
as its new condition. Reparation can be defined as a restoration in
regards to the facility in order to approach as close as possible to the
new condition by replacing its spare parts, doing overhaul or
reprocessing its material which has been deteriorated” (p.4).
The methods which are very often practised in organising maintenance are
preventive maintenance (PM), corrective maintenance (CM) and break down
maintenance. UNCTAD (1983) defined that “preventive maintenance (PM) as the
regular-maintenance activity which is done periodically in the basis of worked hour
or calendar in order to prevent facilities or equipment from failure during its
operation” (p.10). Warming & Hazama (1985) defined that “corrective maintenance
as the activity of maintenance which is taken as the outcome of investigation or
corrective of the breakdown” (p.19). Breakdown maintenance was defined by
Bachrun (1983) “as the action which is taken in regards to the facility or equipment
when they fail or been breakdown” (p.48).
The strategy which was mainly taken by UTPK in organising maintenance was
preventive maintenance (PM). In practice the maintenance was taken on the basis of
equipment worked-hours, which mainly refers to the manufacturer’s
recommendation. The regular inspection was done periodically every 200 up to 250
hours, 600 up to 750 hours, 2,400 up to 3,000 hours and 6,000 up to 9,000 hours
(UTPK, 1998). In order to more concentrate its human resources on doing

39
maintenance, UTPK contracted out some major maintenance, mainly engine
overhaul, to another company.
In terms of equipment age, there were at least 15 cranes, either shore or yard cranes,
which were more than 10 years old. Following is the table of the ages of those cranes
either in terminal I or terminal II:
Table 3.1 Data of shore and yard cranes with an age of morethan 10 years in UTPK, 1998
RegisterNumber
Manufacture/Brand Location Year of
productYear ofretrofit
CC 01 Sumitomo Terminal I 1983 1998CC 02 Sumitomo Terminal I 1976 1998CC 03 Sumitomo Terminal I 1976 1997
CC 01A Mitsui Terminal II 1972 1997CC 02A Mitsui Terminal II 1972TT 01A Paceco Terminal II 1979 1995TT 02A Paceco Terminal II 1979 1996TT 03A Paceco Terminal II 1979TT 04A Paceco Terminal II 1979TT 05A Paceco Terminal II 1976 1996TT 06A Paceco Terminal II 1979TT 07A Paceco Terminal II 1979TT 08A Hyundai Terminal II 1988 1996TT 09A Hyundai Terminal II 1988 1996TT 10A Hyundai Terminal II 1988 1996
Source: UTPK, Data and Information, 1998
In terms of the old equipment, instead of purchasing new CCs for replacing that
equipment, UTPK took action by doing a retrofit as one of the strategies in
organising maintenance. Retrofit is the process of renewing equipment by totally
checking, repairing and replacing all parts of that equipment when necessary in order
to improve the condition and reliability of the equipment as close to the new
condition as possible. By using this strategy, the reliability of equipment could be
improved up to 90% compared to the new condition (UTPK, 1998). Saving money
was another advantage as well, instead of spending money for purchasing new

40
equipment. The impact of the implementation of retrofit practice can be seen in the
fig. 2.2 and fig 2.3 chapter II. In these figures, the graphs of PM (preventive
maintenance) for CCs and RTGCs in terminal I in the beginning of 1998 was very
high.
3.2.4 Equipment-spare-parts inventory planning
As mentioned in the sub-chapter on institutional framework, the procurement of
either equipment-spare-parts or the equipment itself as a new investment, is very
largely affected by government regulation. In addition, this condition affected spare-
part inventory planning.
The age of some equipment which was relatively old, especially CCs and RTGCs, is
another barrier in organising spare-part inventory planning. By doing retrofits, the
cranes were allowed to use up-to-date technology, which is normally easier to
procure the parts; therefore, it is easier to plan the spare-part inventory. Another
advantage of practising the retrofit system is that equipment can be standardised,
which makes it easier to plan and organise the maintenance program as well.
3.2.5 Management and manpower development
By looking at the organisational structure of UTPK, it can be seen that the operation
and engineering departments were separated. Equipment operators were under the
responsibility of the operation department, meanwhile the equipment belonged to the
engineering department.
UTPK divided operations into three shifts per-day and seven days per-week. In
order to keep and monitor equipment during night-time, the engineering department
set up a group unit staff, namely equipment emergency group, into three shifts as
well. The equipment emergency group consisted of the combination of maintenance
sub-section staff. This is one solution which was taken by the management of UTPK
to involve equipment maintenance staff in operations.
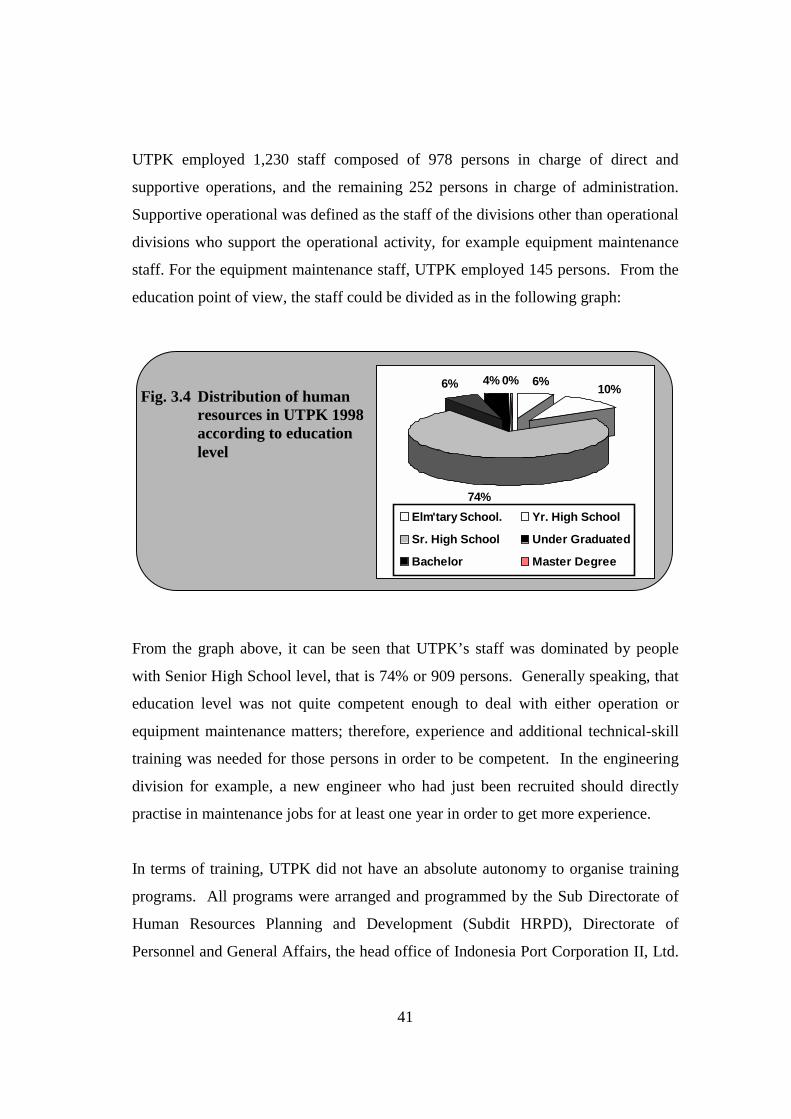
41
UTPK employed 1,230 staff composed of 978 persons in charge of direct and
supportive operations, and the remaining 252 persons in charge of administration.
Supportive operational was defined as the staff of the divisions other than operational
divisions who support the operational activity, for example equipment maintenance
staff. For the equipment maintenance staff, UTPK employed 145 persons. From the
education point of view, the staff could be divided as in the following graph:
From the graph above, it can be seen that UTPK’s staff was dominated by people
with Senior High School level, that is 74% or 909 persons. Generally speaking, that
education level was not quite competent enough to deal with either operation or
equipment maintenance matters; therefore, experience and additional technical-skill
training was needed for those persons in order to be competent. In the engineering
division for example, a new engineer who had just been recruited should directly
practise in maintenance jobs for at least one year in order to get more experience.
In terms of training, UTPK did not have an absolute autonomy to organise training
programs. All programs were arranged and programmed by the Sub Directorate of
Human Resources Planning and Development (Subdit HRPD), Directorate of
Personnel and General Affairs, the head office of Indonesia Port Corporation II, Ltd.
Fig. 3.4 Distribution of humanresources in UTPK 1998according to educationlevel
6% 10%
74%
6% 4% 0%
Elm'tary School. Yr. High School
Sr. High School Under Graduated
Bachelor Master Degree

42
(UTPK, 1998). This was another barrier for UTPK to develop its manpower,
whereas Subdit HRPD organised and arranged training not only to meet UTPK’s
needs, but also for the whole company. One thing that UTPK could do was to
include training programs into purchasing equipment or outsource working contracts
between UTPK and its contractors. By this method, UTPK could prepare its
manpower in order to adopt the new technology which would be employed.
In terms of operator skills, in order to create competent operators, IPC II, Ltd.
provided a crane simulator and organised the training itself. The head truck or
forklift operators could be promoted by involving them in this training program. The
trainees could also be taken from maintenance staff. The advantage of employing
equipment maintenance staff as the operator staff was that they had become familiar
with that equipment.
3.2.6 Engineering management information system
IPC II, Ltd. installed an intranet system among the port’s branches and unit located
in Jakarta, those are, UTPK, Port of Tanjung Priok Branch and the head office of IPC
II. The intranet was built in order to accommodate a management information
system of operation, finance, human resources and engineering. With this system,
the top management level of IPC II could know and access the situation and take
decision as required.
The implementation of an Engineering Management Information System allowed the
equipment manager to directly give information related to equipment matters to
either the management of UTPK itself or IPC II. All of the equipment performance
indicators, i.e., availability, utilisation, down time, had to be up-dated everyday.
Monthly reports of equipment performances were submitted to all persons at the top
management level either in UTPK or in IPC II, Ltd. in order to be evaluated. Action
would be taken if necessary.

43
3.3 Analysis of Equipment after Privatisation
3.3.1 Equipment operation
Related to the operation, equipment performance was measured by determining the
mean number of movements between failure (MMBF) instead of mean time between
failure (MTBF). MMBF can more reflect the real productivity of equipment rather
than MTBF; in addition, the achievement of the maintenance staff can be measured
as well. Another equipment performance indicator is mean time to repair (MTTR).
MTTR reflects the achievement of maintenance staff in organising maintenance.
The average MMBF and MTTR of either CCs or RTGCs in terminal I during the
periods after privatisation can be seen in the following graph:
Fig. 3.5 Graph of average MMBF and MTTR of CCs and RTGCs in terminalI, 1999
Note : - CC tml.1 : CC in terminal I - CC tml.2 : CC in terminal II- RTGC tml.1 : RTGC in terminal I - RTGC tml.2 : RTGC in terminal II
From the graph above, operationally, the achievement of equipment performance in
terminal I was very good. In that terminal, the mean number of movements between
two failures of CC was 587 boxes and for RTGC was 748 boxes. The mean time
needed to deal with each failure was less than one hour for both types of equipment.
In terminal II, MMBF of RTGC was not too good, on average 99 boxes only.
Nevertheless, this achievement in general was quite good, being an outcome of
implementing the new concept of equipment management, such as involving
engineering as a sub-department of the operation department, so that co-ordination
between operators and maintenance staff could be improved.
0300600900
1,2001,5001,800
CC tml.1 CC tml.2 RTGC tml.1 RTGC tml.20.001.002.003.004.005.006.00
MMBF (box) MTTR (hour)

44
3.3.2 Equipment maintenance strategies and practices
Basically, JICT has not changed the maintenance strategies which used to be done by
UTPK, that is doing all preventive maintenance by themselves. One quite big
difference that JICT did make, however, was that they co-operate with the engine
supplier. Instead of contracting out engine-overhaul work, JICT asked the supplier
to provide their engine to be changed with JICT’s engine by selling and buying
system♣. JICT sells the used engine to the supplier and buys a new one or the
overhauled one. This practice seems to significantly shorten the idle time of the
equipment. Instead of waiting two, up to three weeks to do the overhaul, the
machines only need one, up to two days, to loosen and re-installed the engines. In
addition, this selling and buying practice system could also reduce the inventory
level of back-up engine and spare parts, so that the capital cost and inventory cost
could be reduced. In this case, JICT seems to successfully implement this method, as
indicated in the following graphs:
Fig. 3.6.a Graph of average equipment availability in terminal I, 1999
♣ Source: Interview with Equipment Maintenance and Repair Manager, 20 December 1999.
0%
20%
40%
60%
80%
100%
CC RTGC HT FD CHSAe (Avai'ty Equipment) Ai (Avai'ty Inherent) Ao (Avai'ty Occupied)

45
Fig. 3.6.b Graph of average equipment availability and MTTR in terminal II,1999
From those two graphs, it can be seen that availability inherent, which is also
measured and named availability by the previous management (UTPK), on average
more than 95% for each type of equipment, except availability inherent of chassis in
terminal II, on average 58% only.
Even though the capital and inventory costs could be reduced and saved, it does not
mean that the running costs for maintenance could be reduced as well. This is one of
the disadvantages of implementing these systems. The cost of selling and buying or
contracting out major engine overhaul work must cover labour costs and tax. By
practising this overhaul job by itself, at least JICT could save money from tax and
labour costs, due to the labour salary covering all of the labour responsibilities.
3.3.3 Institutional framework, supplies management and equipment
procurement
As a private company, JICT has an absolute right to determine which company is to
be pointed out to meet the needs of goods or service procurements, without
depending on government regulations. Practically, JICT can try to find out the
method of procurement by itself. In order to meet this need, JICT has set up a
specific institution which has the responsibility for any procurement, namely the
procurement department (see fig. 1.2 chapter I).
0%20%40%60%80%
100%
CC RTGC HT FD CHS0.00
2.00
4.00
6.00
8.00
Ae (Avai'ty Equipment) Ai (Avai'ty Inherent) Ao (Avai'ty Occupied) MTTR (hour)

46
The factors that JICT should consider to point out to the supplier, contractor or sub-
contractor to execute the needs of those procurement needs were price and delivery
time♣. Operationally, JICT should consider whether the execution of this
procurement has a direct impact on the operational matters or not, especially from
the delivery time point of view. The impact of implementation on this method very
positively improved its equipment performances, which can be seen in figs. 3.5.a and
3.5.b above. It seems that this practice could minimise the lack of spare parts
available in the inventory, which often happened during the previous management.
In practice, the approval of procurement was taken by the JICT’s management only,
depending on the number of budgets they have, those are♦ :
- The budget up to US$ 64,500 should be approved by the President Director
- The budget up to US$ 30,000 should be approved by the Operation Director
- The budget up to US$ 10,000 should be approved by other Directors
- The budget up to Rp. 5,000,000 or US$ 700 could be approved by the Senior
Manager Engineering
- The budget up to Rp. 4,000,000 or US$ 550 could be approved by the
Accounting Manager.
The implementation of this approval system could very largely shorten the time of
the purchasing process, so that the delivery time could be speeded up.
In terms of organisational structure, the division of supervisor which is based on the
work area and the type of equipment seems not to reflect the specialisation of jobs in
a particular field, those are mechanical, electrical and hydraulic. This condition
seems to be less effective both from the professionalism and efficiency of
employment points of view.
♣ Source: Interview with Procurement Manager of JICT, 20 December 1999.♦ Source: Memorandum of Finance Director of JICT to President Director, other Directors, Senior
Manager of Engineering and Account Manager of JICT about Approval of Purchase, 03December 1999.

47
3.3.4 Management and manpower development
In the beginning of the periods, the management sent some of either the maintenance
or engineer staff to the ports which are operated by Hutchison Port Holding to learn
the method and working ethics being practised by the management. This effort was
to change the traditions of those staff to be private oriented thinking.
In order to develop maintenance staff, management recorded training skills which
had been given to each individual staff member and planned further training that
should be given. Electrical, mechanical and hydraulic skills are the main subjects
that the staff should be competent in.
Basically, the privatisation of JICT involves taking over all of the assets, including
human resources or labour. In terms of the composition of human resources
education level, there is no big difference between UTPK and JICT human resources;
therefore, the personnel need to be trained as well in terms of technical skills.
3.3.5 Engineering management information system
Another system that seems to contribute to the improvement of those performances is
the implementation of a fault code system. Every fault was identified by a certain
code in order to simplify the tracking of equipment history. This information was
very important for the equipment M&R manager to evaluate, plan and make
decisions in order to improve those performances.
The difference of practising this system was that the management did not install the
intranet system anymore, which used to be used by the previous management.
Instead of practising this system, the management employed an expertise advisor in
the engineering sub-department, especially in the equipment maintenance section.
The employment of this advisor was for a short term only, but in the long term, JICT
will install an integrated Information Technology system which can accommodate
the information system of operation, finance, personnel and engineering. The
48
responsibility of this advisor is to assist the equipment maintenance and repair
manager, and to give information to the higher level of management regarding
maintenance matters. The practice of this system seems to be less simple, but in fact
it could more motivate the maintenance staff to exploit their performance.
3.4 Summary
1. The low performance of equipment under UTPK’s management was mainly
caused by the lack of spare parts available in the inventory. This condition
seemed to be a result of the institutional framework with government regulations
which should be followed by all state-owned companies, especially the regulation
of equipment and spare part procurement.
2. JICT as a private company does not have to follow government regulations
related to equipment, spare parts and service procurements. This practice leads
JICT to simplify its procurement procedure, so that the lack of availability spare
parts can be avoided. Furthermore, this practice leads to improvements in the
performance of equipment.
3. Although the achievement of equipment performances can be improved, there are
some practices that need to be evaluated in order to be accepted by the
maintenance staff. These efforts might lead JICT to find an ideal maintenance
management model.
49
CHAPTER IV
MAINTENANCE SYSTEMS IN VARIOUS PORTS IN EUROPE
4.1 Introduction
Port equipment maintenance can critically determine the reputation of ports.
Shipowners as port users can decide to call at a port by using it as a serving feeder or
direct line-haul service depending on its reputation. The poorer the equipment
performs, the longer the ship turnaround time is likely to be. This factor of
turnaround time often becomes a critical factor for shipowners to call at a port.
Maintenance is obviously not the only factor affecting ship turnaround time,
although shortage of equipment could be a major contributor to low output. In terms
of this long ship turnaround time, shipowners often apply additional surcharges to
compensate the cost arising from this condition which should be paid by shippers and
cargo owners. Moreover, this additional surcharge could decrease the
competitiveness of the ports.
What have the major ports in Europe actually done so that they can achieve a high
competitive level? This chapter will try to study and analyse what they have done
from the equipment-maintenance point of view.
4.2 Maintenance Policies
Basically, the maintenance policies that the ports around the world apply are three
types, namely preventive maintenance (PM), corrective maintenance (CM) and
designing out maintenance (Toubhans, 1999).

50
4.2.1 Preventive maintenance
The preventive maintenance that the port implements is characterised by a
repetitivity of tasks and high number of tasks. Practically, the management divides
preventive maintenance into two systems, that is systematic preventive maintenance
and condition-based maintenance.
Systematic preventive maintenance is based on fixed time interval (yearly, monthly,
weekly or daily). This type of maintenance is profitable for the replaced-components
which are cheap or when the consequences involved by a failure are severe, for
example:
- Lubrication and oil changes
- Tightening of clamps
- Checking of safety devices
- Inspection on lifting cables
- Inspection on brake-pads
This type of policy is easy to carry out, but it has shortcomings for equipment where
lifetime heavily depends on the time of use. For this particular case, condition-based
maintenance could be an alternative way.
Condition-based maintenance is the checking of the various components which is
determined if an intervention is necessary. In other words, a component would be
changed only if it is necessary. The most frequent checks concern:
- While equipment is being used:
� Vibrations
� Temperatures
� Warning lights (for brake)
� Pressure levels
- While equipment is not being used:
� Oil analysis
� Visual check

51
� Measurement of functional play
This type of policy needs the purchase of sensors or adequate measuring equipment;
therefore it is more appropriate where the components are expensive to change.
4.2.2 Repair on breakdown
Repair on breakdown or corrective maintenance is the type of maintenance which is
carried out when the parts fail to function. This method could be justified from the
economic point of view for cheap components which are easy to replace. This
practice can be done only when skilled staff are available and preventive
maintenance can not be done when there is pressure from the operation activity. The
difficulties that the port faces are to make a diagnosis in the shortest possible time
and to evaluate very quickly the time needed for repairs.
In order to deal with those difficulties, the solutions that the Port of Le Havre,
France, has arrived at are:
- Specialist training for the workers involved in the diagnosis.
- Programmable logic control supervisor to locate the origin of the problem.
- Some staff should understand the process of equipment installation.
4.2.3 Repair of components
Repair of components or design out maintenance is characterised by the complexity
of the tasks, special tolls that are needed and highly skilled manpower. This method
has difficulties, e.g., to carry out maintenance in depth repair, to determine the root
cause of the trouble and to find a solution to fix the cause. In order to deal with the
problems, what the Port of Le Havre has done is to train the workers by involving
them in the major repairs and to implement computer assisted maintenance control
(CAMC).

52
4.3 Maintenance Strategies
There are two strategies that ports in Europe have employed in organising
maintenance policies, namely on site maintenance and contracting out the
maintenance. On site maintenance sometimes is undertaken when local companies
are not competent enough to undertake maintenance work or local labour costs are
cheap enough to be employed in the ports. Most ports choose this strategy for most
of their maintenance work, for instance, Port of Le Havre, Malta Freeport and Port of
Rotterdam. The advantage of on-site maintenance with their own-resources is that it
is easy to control when scheduling and planning equipment-allocation (Thomas,
1989).
Port of Felixstowe, England, is now considering contracting out all maintenance
work. This action is being taken by taking into consideration the cost effect which
would arise from practising this strategy (Coe, 2000, Lecture notes). This trend
tends to be followed by ports in developed countries due to the expensive labour cost
to employ skilled-manpower in the ports (Toubhans, 1999). Many ports now
contract out specific categories of maintenance or equipment, for example, major
overhauls.
There are some pressures from operations which require equipment to always be
ready to operate; therefore, most ports involve maintenance staff in operation hours.
Practically, the ports set up some special groups, namely an emergency maintenance
group, to be involved in working a certain shift. In order to raise the awareness and
participation of equipment operators to maintenance matters, the Port of
Copenhagen, Denmark, employs operators from the engineering staff (Elmer, 2000,
Lecture notes). This practice is quite efficient in organising preventive maintenance
as well as repairs when equipment fails.
Pressure does not only come from operations, but also from port users, shipping
companies for example. There is no doubt that in order to achieve economies of

53
scale, shipping companies employ big vessels which require a high capacity of port
equipment. In order to meet this requirement, the Port of Le Havre has modified its
equipment, especially container gantry cranes. This is one way to improve
equipment productivity without scraping or selling the existing one.
4.4 Summary
1. Although the maintenance policies which are applied to the ports are similar,
there are no two or more ports that seem to follow exactly the same approach to
maintenance.
2. There are various practices of maintenance strategies in the ports around the
world that can be adopted to apply in a particular port. In order to find out the
ideal equipment maintenance model that the port should apply, modification and
models could be applied by taking into consideration the cost and benefits that
the port could find favourable.

54
CHAPTER V
ALTERNATIVE SOLUTIONS
5.1 Introduction
No two ports actually have exactly the same system to practice maintenance policies
and strategies. One port might adopt another port’s system, but still there are some
actions to be taken to adapt it to the ports’ environment, which could be port
resources, social climate, government regulations, currency etc.
In order to find out the method that the ports could apply, advantages and
disadvantages of the system must be considered. Cost and benefit analysis could be
made in order to measure those advantages and disadvantages. This chapter will try
to find out the ideal method for equipment maintenance management which might be
applied in JICT.
5.2 Maintenance Policy and Practices
Generally, there are three policy options of organising equipment maintenance,
namely preventive maintenance (PM), corrective maintenance (CM) and designing-
out maintenance. The implementation of these policies depends largely on the nature
of maintenance itself.
Preventive maintenance (PM)
The aim of PM is to effect the work of inspection, servicing and adjustment in order
to prevent equipment from failing during operation (Clifton, 1984, p.10). Basically
PM is divided into two categories, i.e., systematic preventive maintenance or time-
based maintenance and condition-based maintenance. Time-based maintenance is

55
maintenance practices which are based on the calendar (yearly, monthly, weekly) or
based on units representative of wear and tear (tonnes production, number of
machine worked-hour, kilometres, etc.).
Among condition-based maintenance practice, there is a kind of maintenance
practice which is well known by predictive maintenance (PdM). Mobley (1990, p.5)
defined PdM is a maintenance practice using specific instruments, e.g., vibration
monitoring, thermal imaging, lubricating oil analysis, etc., to identify whether the
parts of machine need to be changed or not. The aims of PdM are to detect incipient
problems and to prevent catastrophic failures.
In traditional preventive maintenance (PM), the final decision on repairs or
rebuilding schedules are based on the intuition and personal experiences of the
maintenance manager; therefore the PM system can only guarantee that the machine
will be safe to operate, but not guarantee a cost saving. In predictive maintenance
(PdM) a specific failure mode could be identified before failure; therefore, the
correct repair parts, tools, labour skills and methods could be allocated to correct the
problem. PdM programs could provide data on the actual mechanical condition of
the machine as well. These data will enable the maintenance manager to schedule
maintenance activities much more cost-effectively. For example, engine oil is
changed regularly on the basis of a specific machine worked-hours or kilometres.
There is no justification actually that the oil within this time period needs to be
changed. But by using oil analysis for example, the maintenance manager can
determine and decide when the oil must be changed.
Another example is when the maintenance manager should decide that the machine
needs major repairs. By using vibration monitoring instruments and thermal imaging
for example, maintenance staff could identify which parts need to be changed, so that
the problem solving could focus only on those parts. Therefore, either cost or time
could be saved effectively.

56
In order to implement this system, investment in the required instruments, e.g.,
vibration monitoring instrument, thermal-imaging instrument, oil analysis instrument
etc. should be done. According to SKF Service AB, Sweden, (2000), to invest in an
integrated vibration and electric current including oil monitoring analysis and
thermography, costs US$ 50,000. To train an in-house staff specialist, costs at least
US$ 5,000; therefore, US$ 55,000 is needed for the total investment. Compared to
the number of engines which are owned and employed by JICT, i.e., 8 engines of
container cranes, 32 of rubber-tyre gantry cranes, 71 of head trucks and 17 of diesel
forklifts, the benefit of implementing this system would be significant.
The average budget that JICT allocates to contract out engine major repairs or
overhaul is US$ 10,000 per-head truck’s engine and US$ 15,500 per-RTGC’s
engine, including spare parts, service cost and tax. By organising and executing the
major overhaul by itself, JICT could save money from tax and manpower costs, due
to the manpower jobs being covered in their salary. Supposing that 20% of the total
costs cover the service cost and 10% cover tax, this means that by organising and
executing a major overhaul by itself, JICT could save US$ 3,000 for each major
repair or overhaul for an HT’s engine and US$ 4,650 for a RTGC’s engine. By
investing US$ 55,000 in purchasing the PdM’s instrument, the break event point
would be covered within 18 times a head truck’s engine needs a major repair or
overhaul, or 12 times a RTGC’s engine needs a major repair or overhaul. Therefore,
from the financial point of view, implementing the PdM system could benefit the
management.
The consequence of implementing PdM is that all engine overhauls should be done
by maintenance staff themselves in order to save money; therefore, the technical-
skills of maintenance staff should be competent. In order to achieve the
competitiveness of the maintenance staff, technical-skill training should be done.
Another consequence is that there should be back-up engines available in order to
shorten the equipment idle time.

57
5.3 Engineering Management Information System
One of the goals of JICT is to be a world class container terminal. There are no clear
criteria actually what a world class container terminal or port means. According to
the generation of ports, the latest port generation today is the third port generation.
This generation was born with the development of containerisation, intermodalism
and globalisation of the economy in the 1980’s (Francou, 1999a, Lecture note). The
third generation ports are more oriented to the supply of services to cope with the
requirements of shipowners and shippers.
One of the requirements of the third generation port is that the port becomes an
information centre (infostructure). In order to be that, the implementation of
information technology is absolutely required. Moreover, computerised information
technology is more convenient. This type of information technology is now
employed by most of the major ports in Europe.
From the equipment-maintenance point of view, the engineering management
information system (EMIS) should ideally be computerised. Furthermore, this
computerised system should integrate the information centre, so that either
shipowners or shippers could know how reliable the equipment that the port employs
actually is. This is quite important for those port users due to their requirements of
short time in port.
According to UNCTAD (1990, p.178), the benefits of implementing a computerised
EMIS are:
1. Data could be quickly and easily stored, in as great detail as desired.
2. It is easy to be integrated to the ports’ master MIS with access to
operational, financial and personnel databases.
3. It could release operators, engineers and other counterparts in other
departments of the time-consuming burden of analysing, summarising and
circulating maintenance-derived data.

58
4. A computer-based data is generally available for everyone to access to,
meanwhile a paper-based data system is limited to a small area. In the
other side, the computer-based data system combines openness with tighter
control.
5. One computer data entry could be used in a variety of contexts, serving
several systems and function, meanwhile a paper-based data record must
be repeated several times in order to be used in different contexts.
From these benefits, there is no doubt that by using a computerised-data system, the
port could improve the efficiency of management performance.
5.4 Equipment Inventory Planning and Procurement
The joint venture company of JICT is under a Built Operate and Transfer (BOT)
concession, which means that JICT is responsible to build, develop and operate the
terminal for a certain period (20 years) and then to transfer it to the previous owner,
that is, Indonesia Port Corporation II, Ltd. In order to improve the performance,
JICT needs to invest either in new equipment or to refurbish the existing items.
In the case of purchasing new equipment, it should meet the operators’ and
engineers’ requirements. Operationally, equipment should be reliable to operate and
technically should be as close as possible to the port’s technical ability to maintain.
In order to meet the engineering requirement, it would be better to purchase
equipment with the same manufacture as the existing ones in order to standardise the
equipment inventory. The benefits of standardisation of equipment-inventory are:
1. Easy to plan and organise maintenance. By using the same equipment, the
maintenance manager could easier to plan and allocate manpower to do
maintenance due to their experience and sense of familiar to that equipment. The
actions of overcoming the weakness of that kind of equipment will be applicable
to the other one.
2. Easy to plan and procure spare parts inventory. To plan and realise the same
spare parts is much easier than different ones.

59
3. It will be less necessary to prepare or train either maintenance or operator staff
with the new technical skills, unless that equipment uses new technology. The
less training needs the more savings in cost there will be.
Beside these benefits, there is likely to be the disadvantage of purchasing new
equipment with the same manufacture as the existing one; that is, there will be no
choice or alternatives in terms of spare parts procurement. This may lead to the
bargaining power position of the supplier being higher than the buyer’s position.
This situation could be avoided by encouraging maintenance staff to explore their
innovation skills by practising preventive maintenance, predictive maintenance and
corrective maintenance. Modification is one of the outcomes of the innovation that
could help to overcome this disadvantage.
5.5 Manpower and Organisational Structure
Harris (1989) in his article on Port Privatisation: A survey of global trends, in
Research News, stated that one apprehension aspect regarding port privatisation
comes from labour unions which are worried in losing jobs. This also applies to the
manpower of JICT.
In the beginning of operation, the former workers of UTPK were employed under a
contract agreement for two years which will finish on March 27, 2001 when the
management of JICT has guaranteed that all of the workers would be made
permanent employees (http://www.maritimindo.com/, 12 June 2000). What the JICT
management should do now is to maintain the awareness and allegiance of all the
staff to the company. One effort that could be made in terms of equipment
maintenance staff is to give them good practical training (Vang Nielsen, 2000,
lecture notes). Another advantage of giving training is to develop the skills and
competence of the manpower or human resources.
60
There is no doubt that there will be no development of human resources without
training. One advantage that JICT has now is that the management could plan and
realise all the training programs without depending on IPC II anymore, due to the full
autonomy of JICT to operate and manage all of the resources. This kind of
autonomy was not available to the previous management.
In chapter 3, the ineffectiveness and inefficiency of the division of supervisors or
engineers, which is based on the type of equipment and work area, was mentioned.
There are some similarities of work in that type of equipment actually. In the case of
CC and RTGC for example, the supervisors should understand either mechanically,
electrically or hydraulically the equipment. This kind of requirement may lead the
supervisor to not have the proper skills. In this case, the organisational structure
needs to be changed in order to allow the supervisors or engineers to have the proper
specific skill, mechanical or electrical skill only, so that the engineers will be more
professional. Therefore, instead of six supervisors or engineers, JICT could set up
three supervisors or engineers only, namely mechanical, electrical and hydraulic
engineer or supervisor. The advantages of restructuring the organisation by
employing three supervisors or engineers instead of six are:
- To cut labour cost.
- To simplify co-ordination and supervision.
- To make the supervisor or engineers more of a specialist; furthermore, to be more
professional.
The disadvantage of setting up supervisors or engineers not based on the job’s
location is that those engineers or supervisors will have a high mobility in order to
cover the jobs in both locations. This is necessary since the location of the both
terminals are quite far apart (see appendix A).

61
5.6 Summary
Although in general the achievement of the JICT management in terms of container
handling equipment performance is improving, there are still some actions which
could be taken in order to more improve performance. Introducing predictive
maintenance as well as preventive and corrective maintenance is one action that
could be applied. Implementation of the computerised engineering management
information system that could be integrated to other information systems,
standardising equipment by acquiring the same equipment as that existing and
maintaining the awareness and allegiance of staff are other efforts that could be
made. The restructuring of organisational also needs to be acted upon in order to
attain higher professionalism and specialisation skills of the engineers in a particular
field, namely mechanical, electrical and hydraulic.
62
CHAPTER VI
CONCLUSION AND RECOMMENDATIONS
6.1 Conclusion
Unit Terminal Petikemas Tanjung Priok (UTPK Tanjung Priok), the embryo of
Jakarta International Container Terminal (JICT), was the largest existing container
terminal in Indonesia. The terminal was a daughter company of Indonesia Port
Corporation II, Limited (IPC II Ltd.), a State-owned company, and was affected very
largely by government regulations in its operation. The consequence of these
regulations, especially relating to the procurement procedure, had a great negative
impact on the performance of container handling equipment. A long procedure for
equipment spare parts procurement was the biggest reason for the lack of spare parts
available which lead to low equipment availability at any moment. The economic
crisis, which led to an increase in local currency appreciation of foreign currencies,
was another reason for the lack of spare parts availability. Equipment spare-part
prices, which are mostly affected by foreign currency rates, were becoming sky high
so that they were unreachable according to budget set up.
In this situation, the terminal was privatised in order to strengthen its capital
structure. The new privatised container terminal was named Jakarta International
Container Terminal (JICT) and established by IPC II, Ltd. as the previous parent
company and Hutchison Port Holding (HPH) Hongkong as the new investors. HPH,
which owns 51% of the shares, then took more initiative, either managerially or
operationally, in order to improve the company’s performance. The change of
organisational structure was one of the actions. Engineering was set up to be a sub-
department of operations in order to simplify the co-ordination between engineer and
63
maintenance staff on the one hand, and operation supervisor and operator on the
other hand. This kind of co-ordination was significant in planning and organising
equipment maintenance.
Another change which was taken by the new management was to change measuring
equipment performance indicators, which more oriented to the operational
achievement rather than others. Instead of measuring mean time between failures
(MTBF), which is traditionally used by UTPK and other ports around the world,
JICT uses mean movement between failures (MMBF) as one equipment performance
indicator. By measuring the number of containers that could be moved in between
two failures, the reliability of equipment could be measured as objectively as
possible.
As a private company, JICT operates the terminals without very largely depending
on the government regulations, especially for procurement procedures. By short-
cutting the procedure the availability of equipment spare parts could be guaranteed.
Furthermore, the availability of equipment could be improved. Moreover, the
practice of selling and buying used engines to replace new ones or overhauled ones
seems to significantly contribute to the improvement of these performances. The
selling and buying method could effectively shorten equipment idle time, so that the
availability of equipment could be improved.
6.2 Recommendations
Although there are some improvements that can be achieved by the new management
related to equipment performance, there are some efforts that could be made other
than the practising ones in order to achieve the ideal model of maintenance
management. The method could not be adopted directly from other port systems, but
needs to be adapted within JICT’s environment.

64
In order to further improve the performance of container handling equipment in
JICT, there are some recommendations which might be made concerning
management, related to maintenance management and organisation.
6.2.1 Short-term period
In the short-term period, that is less than one year, it is recommended that the
management apply predictive maintenance (PdM) as well as preventive and
corrective maintenance due to the financial advantages. By looking at the large
number of equipment in the JICT inventory, investment for PdM’s instrument
requirement seems to be more useful in achieving a more effective maintenance cost
and time.
Improvement of technical-skill training for the equipment maintenance staff needs to
be made in the short-term period as well, in order to cover the implementation of
PdM system.
6.2.2 Medium-term periods
In the medium-term period, that is between one to five years, it is recommended that
the management restructure the organisation in order to improve the professionalism
of the staff. Instead of setting up supervisors or engineers based on the type of
equipment and work area, it is recommended to change the field of work, namely to
mechanical, electrical and hydraulic engineers or supervisors. More technical
training programs for maintenance staff is another action which should be taken in
order to maintain and more motivate the allegiance of the staff to the company.
Implementation of a computerised-engineering management information system
which could be linked to the master of other management information systems,
namely operation management information system, finance management information
system and personnel management information system, needs to be speeded up. This
kind of implementation would make it easier to plan, control and evaluate the

65
implementation of maintenance programs. Another advantage of this practice is to
speed up the achievement of the company’s objective, that is to be a world class
container terminal which is identical with the information technology centre
(infostructure).
6.2.3 Long-term period
In the long-term period, that is more than five years, the standardisation of equipment
to be employed needs to be acted upon. Replacement of the old equipment with the
new should refer to the manufacture of the equipment-population which has been
employed. This action will make it easier to plan maintenance and spare part
inventory requirements. Retrofitting which would be acted upon should also refer to
the systems and technologies which are employed by the terminals and be familiar to
the maintenance staff.
66
BIBLIOGRAPHY
Agustomo. (2000). Terminal Layout of Jakarta International Container Terminal:
Showing Future Expansion. In Presentation to HIT Commercial, Jakarta 11th
November 1999. Jakarta: JICT.
Bachrun, R. K. (1993). Maintenance Management: Featuring “Preventive
Maintenance”. Jakarta: P.T. Loka Datamas Indah.
Badan Perencanaan dan Pembangunan Nasional (Bappenas). (1994). Keputusan
Presiden Republik Indonesia Nomor 16 Tahun 1994 tentang Pelaksanaan
Anggaran Pendapatan dan Belanja Negara. Jakarta, Indonesia: CV. Eko Jaya.
Clifton, R. H. (1974). Principles of Planned Maintenance. London: Edward Arnold.
Coe, D. (2000). Port of Felixstowe. Lecture Notes. Fieldtrip to London and Port of
Felixstowe, 22 – 26 May 2000. [Unpublished].
Crook, G., & Ircha, M. C. (2000a). Improvement Port Performance (IPP) 2. Lecture
Notes. World Maritime University, Malmö, Sweden.
Crook, G., & Ircha, M. C. (2000b). Improvement Port Performance (IPP) 3. Lecture
Notes. World Maritime University, Malmö, Sweden.
Elmer, J. (2000). Port of Copenhagen. Lecture Notes. Seminar Port Regional
Planning, Malmö 14 – 18 February 2000. World Maritime University,
Malmö, Sweden.
Fitrianto, A. (1998). A Study to Improve the Quality of Services of Container
Terminal in Tanjung Priok Port. Unpublished master’s thesis, M.Sc.
dissertation. World Maritime University, Malmö, Sweden.
Francou, B. L. (2000a). Basic Element of Port Operation. Lecture Notes. World
Maritime University, Malmö, Sweden.
Francou, B. L. (2000b). Port Performance Indicators. Lecture Notes. World
Maritime University, Malmö, Sweden.
Frederic R. Harris, Inc. (1989). Port Privatisation: A Survey of Global Trends. New
York: Author.
Hacker, D. (1998). A Writer’s Reference (3rd. ed.). Boston: Bedford Books.
67
Herbaty, F. (1983). Cost-effective Maintenance Management: Productivity
Improvement and Downtime Reduction. Park Ridges, N.J.: Noyes
Publications.
Horck, J. (2000). Time in Port and Port Productivity – IPP1. Lecture Notes. World
Maritime University, Malmö, Sweden.
Indonesia Port Corporation II . (1996). Tanjung Priok Container Terminal: Changing
Appearance to Face the Period’s Challenge. Jakarta, Indonesia: Author.
Indonesia Port Corporation II. (1997a). Tanjung Priok Container Terminal:
Menyongsong Era Globalisasi. Jakarta, Indonesia: Author.
Indonesia Port Corporation II. (1997b). Tanjung Priok Port: Corporate Profile.
Jakarta, Indonesia: Author.
Jakarta International Container Terminal (JICT). (1999a). Quality Manual ISO 9002.
Jakarta: Author.
JICT. Electronic Data Processing and Marketing Department. (1999b). Data of
Terminal Performance 1999. Jakarta: JICT.
JICT. Engineering Department. (1999c). Report of Equipment Performance. Jakarta:
JICT.
Kolderie, T. (1986, July/August). Currents and Soundings: The Two Different
Concepts of Privatisation. Public Administration Review, 46 (4), 285-291.
Kruk, C. B. (2000). Port of Rotterdam Municipality. Lecture Notes. Fieldtrip in the
Netherlands and Ports of Rotterdam, Amsterdam and Flusshing, 4 – 13 April
2000. [Unpublished].
Legras, F. (1999). Port Operations Course: Port Handling Equipment. IPER – WMU
Seminar on “Port Operations”, Le Havre, 18 – 29 October 1999. Le Havre:
IPER – Port Autonome Du Havre.
Malta Freeport Corporation, Ltd. (1998). Our Maritime Heritage - a Stimulus for the
Future: Annual Review 1998. Valletta, Malta: Author.
Mechanical Solution, Inc. (2000a). Predictive Maintenance. Retrieved on 1 June
2000 from http://www.mechsol.com/pm.html.

68
Mechanical Solution, Inc. (2000b). Vibration and Noise Testing & Troubleshooting.
Retrieved on 1 June 2000 from http://www.mechsol.com/testing.html.
Mobley, R. K. (1990). An Introduction to Predictive Maintenance. New York: Van
Nostrand Reinhold.
Portelli, J. (2000). Malta Freeport. Lecture Notes. Fieldtrip to Malta, 28 February –
3 March 2000. [Unpublished].
Predict DLI. (2000). PdM Express: Machinery Condition Monitoring Services.
Retrieved on 1 June 2000 from http://www.predict-dli.com/.
PT. Pacific Maritim Indonesia Jaya. (2000). JICT Memberi Bonus Enam Bulan Gaji
dan Kepastian Kerja bagi Karyawannya. Retrieved on 11 June 2000 from
http://www.maritimindo.com/.
Shiribabadi, I. (1991). Management of Preventive Maintenance and Its
Implementation in the Southern Ports of Iran. Unpublished master’s thesis,
M.Sc. dissertation. World Maritime University, Malmö, Sweden.
SKF Service AB. (2000). Dina Priser. Gotebörg, Sweden: Author.
SKF USA. (2000). Vibration Monitoring of Electric Motor Bearing. Retrieved on 1
June 2000 from http://www.skfusa.com/training_home.html.
Privatisasi PT Pelabuhan Indonesia II Januari 1999. (1998, December 2). Suara
Pembaruan Daily. Retrieved on 17 March 2000 from
http://suarapembaruan.com/News/1998/12/021298/Ekonomi/ek02/ek02.html.
Thomas, B. J., & Roach, D. K. (1989). Management of Port Maintenance: A Review
of Current Problems and Practices. London: Her Majesty’s Stationery
Offices.
Toubhans, T. (1999). Port Operations Course: Port Maintenance. IPER – WMU
Seminar on “Port Operations”, Le Havre 18 – 29 October 1999. Le Havre:
IPER – Port Autonome Du Havre.
United Nations Conference on Trade and Development (UNCTAD). (1983).
Monograph No. 3: Steps to Effective Equipment Maintenance. New York:
United Nations.
69
UNCTAD. (1986). Improving Port Performance (IPP-2): Container Terminal
Development. Geneva: Author.
UNCTAD. (1987). Operating and Maintenance Features of Container Handling
Systems. Geneva: Author.
UNCTAD. (1990). Improving Port Performance (IPP-3): Port Equipment: Policy,
Management and Maintenance. New York: United Nations.
UNCTAD. (1992). The Management and Development of Human Resources in
Ports. Geneva: Author.
Unit Terminal Petikemas (UTPK) Tanjung Priok. Engineering Division. (1998).
Report of Equipment Performance. Jakarta: UTPK Tanjung Priok.
Vang Nielsen, K. (2000). Århus Stevedore Kompagni A/S. Lecture Notes. Fieldtrip
to Port of Århus, Denmark, 7 – 9 June 2000. [Unpublished].
Warming, C., & Hazama, T. (1985). Port Maintenance Handbook: Chapter 5 –
Mechanical Equipment. Brussels: Permanent International Association of
Navigation Congresses (PIANC).
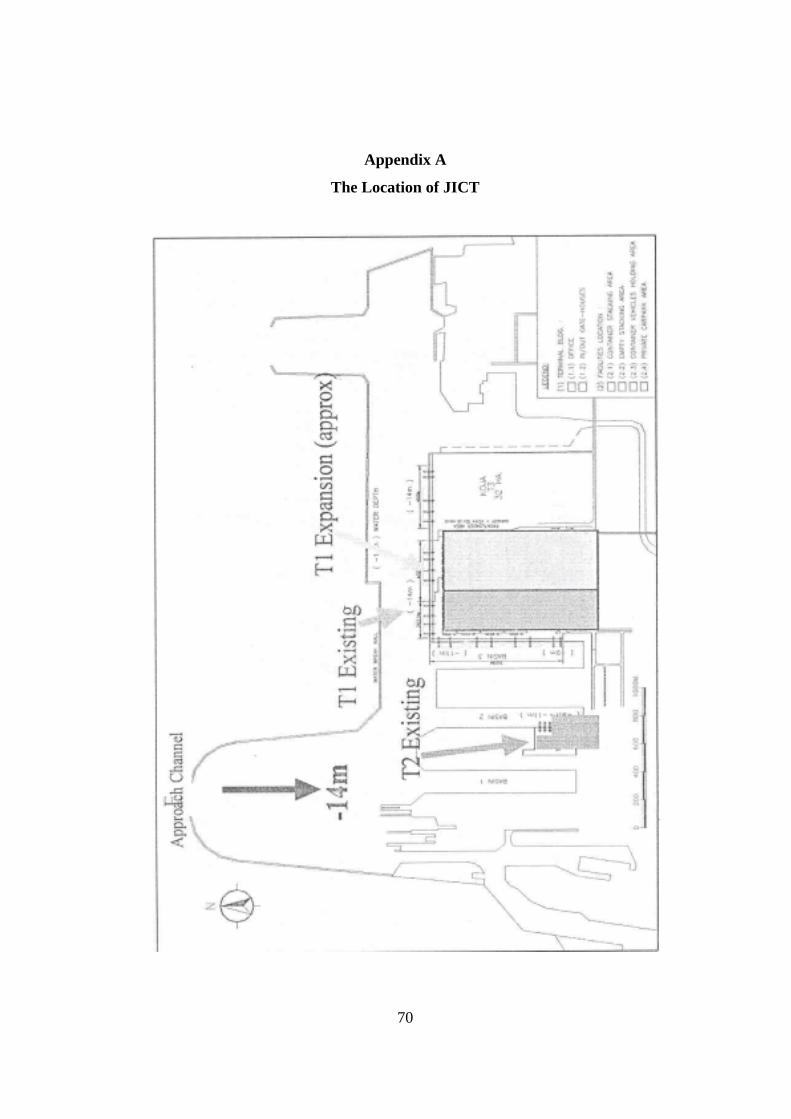
70
Appendix A
The Location of JICT
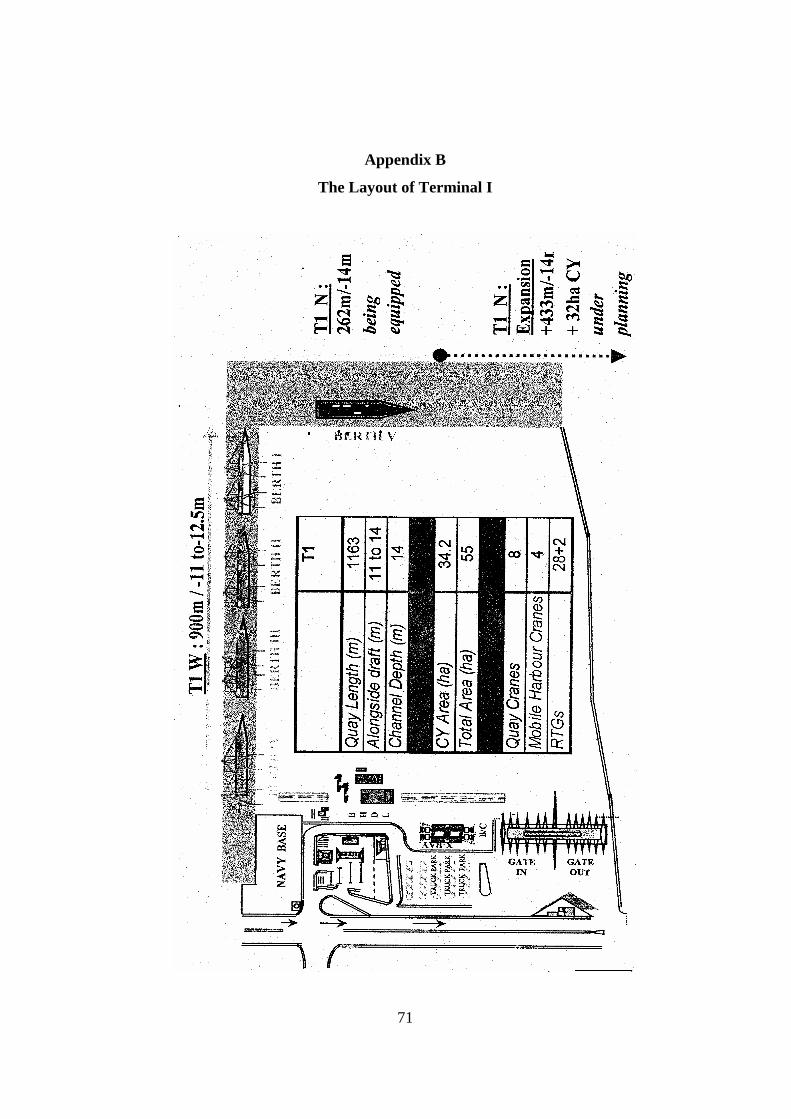
71
Appendix B
The Layout of Terminal I

72
Appendix C
The Layout of Terminal II

73
Appendix D
Fault Code List
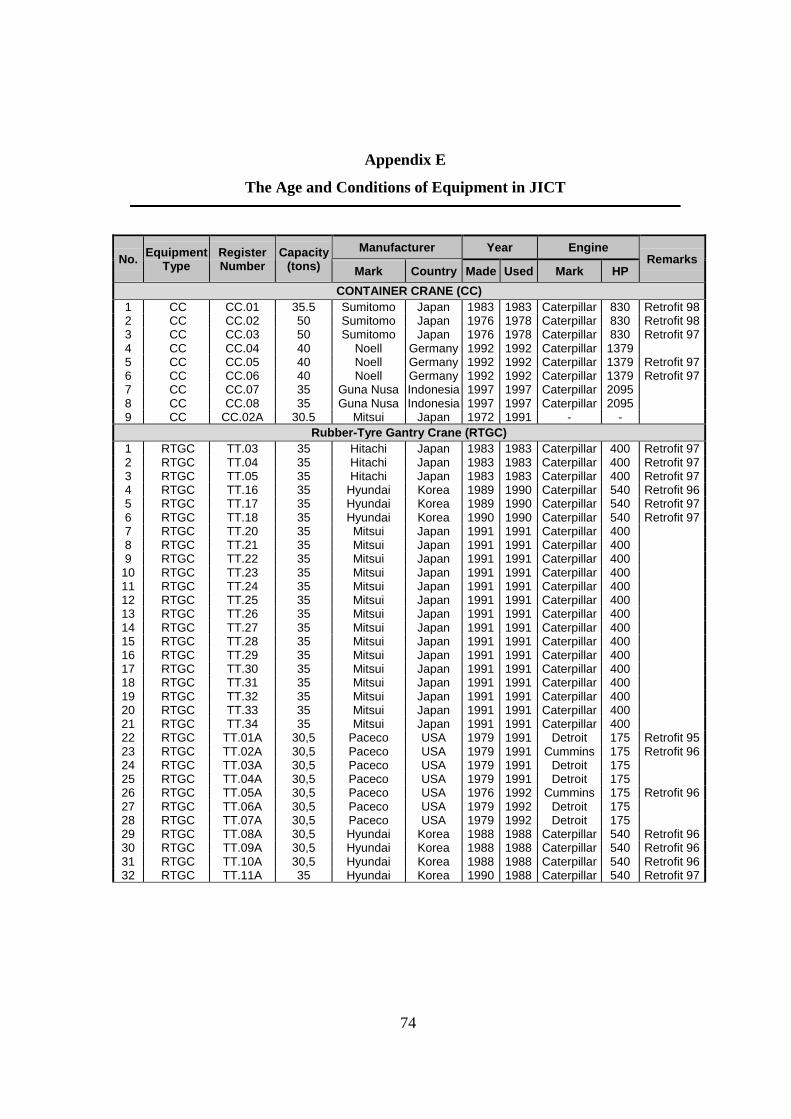
74
Appendix E
The Age and Conditions of Equipment in JICT
See: alat.xls
Manufacturer Year EngineNo. Equipment
TypeRegisterNumber
Capacity(tons) Mark Country Made Used Mark HP
Remarks
CONTAINER CRANE (CC)1 CC CC.01 35.5 Sumitomo Japan 1983 1983 Caterpillar 830 Retrofit 982 CC CC.02 50 Sumitomo Japan 1976 1978 Caterpillar 830 Retrofit 983 CC CC.03 50 Sumitomo Japan 1976 1978 Caterpillar 830 Retrofit 974 CC CC.04 40 Noell Germany 1992 1992 Caterpillar 13795 CC CC.05 40 Noell Germany 1992 1992 Caterpillar 1379 Retrofit 976 CC CC.06 40 Noell Germany 1992 1992 Caterpillar 1379 Retrofit 977 CC CC.07 35 Guna Nusa Indonesia 1997 1997 Caterpillar 20958 CC CC.08 35 Guna Nusa Indonesia 1997 1997 Caterpillar 20959 CC CC.02A 30.5 Mitsui Japan 1972 1991 - -
Rubber-Tyre Gantry Crane (RTGC)1 RTGC TT.03 35 Hitachi Japan 1983 1983 Caterpillar 400 Retrofit 972 RTGC TT.04 35 Hitachi Japan 1983 1983 Caterpillar 400 Retrofit 973 RTGC TT.05 35 Hitachi Japan 1983 1983 Caterpillar 400 Retrofit 974 RTGC TT.16 35 Hyundai Korea 1989 1990 Caterpillar 540 Retrofit 965 RTGC TT.17 35 Hyundai Korea 1989 1990 Caterpillar 540 Retrofit 976 RTGC TT.18 35 Hyundai Korea 1990 1990 Caterpillar 540 Retrofit 977 RTGC TT.20 35 Mitsui Japan 1991 1991 Caterpillar 4008 RTGC TT.21 35 Mitsui Japan 1991 1991 Caterpillar 4009 RTGC TT.22 35 Mitsui Japan 1991 1991 Caterpillar 400
10 RTGC TT.23 35 Mitsui Japan 1991 1991 Caterpillar 40011 RTGC TT.24 35 Mitsui Japan 1991 1991 Caterpillar 40012 RTGC TT.25 35 Mitsui Japan 1991 1991 Caterpillar 40013 RTGC TT.26 35 Mitsui Japan 1991 1991 Caterpillar 40014 RTGC TT.27 35 Mitsui Japan 1991 1991 Caterpillar 40015 RTGC TT.28 35 Mitsui Japan 1991 1991 Caterpillar 40016 RTGC TT.29 35 Mitsui Japan 1991 1991 Caterpillar 40017 RTGC TT.30 35 Mitsui Japan 1991 1991 Caterpillar 40018 RTGC TT.31 35 Mitsui Japan 1991 1991 Caterpillar 40019 RTGC TT.32 35 Mitsui Japan 1991 1991 Caterpillar 40020 RTGC TT.33 35 Mitsui Japan 1991 1991 Caterpillar 40021 RTGC TT.34 35 Mitsui Japan 1991 1991 Caterpillar 40022 RTGC TT.01A 30,5 Paceco USA 1979 1991 Detroit 175 Retrofit 9523 RTGC TT.02A 30,5 Paceco USA 1979 1991 Cummins 175 Retrofit 9624 RTGC TT.03A 30,5 Paceco USA 1979 1991 Detroit 17525 RTGC TT.04A 30,5 Paceco USA 1979 1991 Detroit 17526 RTGC TT.05A 30,5 Paceco USA 1976 1992 Cummins 175 Retrofit 9627 RTGC TT.06A 30,5 Paceco USA 1979 1992 Detroit 17528 RTGC TT.07A 30,5 Paceco USA 1979 1992 Detroit 17529 RTGC TT.08A 30,5 Hyundai Korea 1988 1988 Caterpillar 540 Retrofit 9630 RTGC TT.09A 30,5 Hyundai Korea 1988 1988 Caterpillar 540 Retrofit 9631 RTGC TT.10A 30,5 Hyundai Korea 1988 1988 Caterpillar 540 Retrofit 9632 RTGC TT.11A 35 Hyundai Korea 1990 1988 Caterpillar 540 Retrofit 97

Appendix E (Cont’d)
The Age and Conditions of Equipment in JICT
75
Manufacturer Year EngineNo. Equipment
TypeRegisterNumber
Capacity(tons) Mark Country Made Used Mark HP
Remarks
FORKLIFT-DIESEL (FD)1 FD FD.01 42 Fantuzzi Italy 1996 1997 Volvo2 FD FD. 02 36 TCM Japan 1983 1985 Isuzu -3 FD FD. 04 25 Mitsubishi Japan 1979 1979 Mitsubishi -4 FD FD.08 15 Fantuzzi Italy 1996 1997 Volvo -5 FD FD.09 15 Fantuzzi Italy 1996 1997 Volvo -6 FD FD. 16 2 Datsun Japan 1983 1984 Datsun -7 FD FD. 18 2 Datsun Japan 1983 1984 Datsun -8 FD FD. 19 2 Datsun Japan 1983 1984 Datsun -9 FD FD 20 3,5 Komatsu Japan 1996 1997 Komatsu 64
10 FD FD. 29 2 Nissan Japan 1991 1991 Nissan -11 FD FD. 03A 2 Nissan Japan 1991 1991 Nissan -12 FD FD. 04A 42 Fantuzzi Italy 1996 1996 Volvo -13 FD FD. 05A 15 Fantuzzi Italy 1996 1996 Volvo -14 FD FD.08A 2 Nissan Japan 1991 1991 Nissan -15 FD FD.09A 2 Datsun Japan 1983 1984 Datsun -16 FD FD. 11A 10 TCM Japan 1983 1983 Isuzu -17 FD FD.16A 36 TCM Japan 1983 1983 Isuzu -
HEAD TRUCK (HT)1 HT HT. 23 40 Ottawa Canada 1988 1988 Caterpillar 1752 HT HT. 25 40 Ottawa Canada 1988 1988 Caterpillar 1753 HT HT. 26 40 Ottawa Canada 1988 1988 Caterpillar 1754 HT HT. 28 40 Ottawa Canada 1988 1988 Caterpillar 1755 HT HT. 29 40 Ottawa Canada 1988 1988 Caterpillar 1756 HT HT. 30 40 Ottawa Canada 1988 1988 Caterpillar 1757 HT HT. 31 40 Ottawa Canada 1988 1988 Caterpillar 1758 HT HT. 32 40 Ottawa Canada 1988 1988 Caterpillar 1759 HT HT. 33 40 Ottawa Canada 1988 1988 Caterpillar 175
10 HT HT. 34 40 Ottawa Canada 1988 1988 Caterpillar 17511 HT HT. 35 40 Ottawa Canada 1988 1988 Caterpillar 17512 HT HT. 36 40 Ottawa Canada 1988 1988 Caterpillar 17513 HT HT. 37 40 Ottawa Canada 1988 1988 Caterpillar 17514 HT HT. 38 40 Ottawa Canada 1991 1991 Caterpillar 17515 HT HT. 40 40 Ottawa Canada 1991 1991 Caterpillar 17516 HT HT. 41 40 Ottawa Canada 1991 1991 Caterpillar 17517 HT HT. 42 40 Ottawa Canada 1991 1991 Caterpillar 17518 HT HT. 43 40 Ottawa Canada 1991 1991 Caterpillar 17519 HT HT. 44 40 Ottawa Canada 1991 1991 Caterpillar 17520 HT HT. 45 40 Ottawa Canada 1991 1991 Caterpillar 17521 HT HT. 46 40 Ottawa Canada 1991 1991 Caterpillar 17522 HT HT. 47 40 Ottawa Canada 1991 1991 Caterpillar 17523 HT HT. 48 40 Ottawa Canada 1991 1991 Caterpillar 17524 HT HT. 49 40 Ottawa Canada 1991 1991 Caterpillar 17525 HT HT. 50 40 Ottawa Canada 1991 1991 Caterpillar 17526 HT HT. 51 40 Ottawa Canada 1991 1991 Caterpillar 17527 HT HT. 52 40 Ottawa Canada 1991 1991 Caterpillar 17528 HT HT. 53 40 Ottawa Canada 1991 1991 Caterpillar 17529 HT HT. 55 40 Ottawa Canada 1991 1991 Caterpillar 17530 HT HT. 56 40 Ottawa Canada 1991 1991 Caterpillar 17531 HT HT. 57 40 Ottawa Canada 1991 1991 Caterpillar 17532 HT HT. 58 40 Capacity USA 1995 1995 Caterpillar 21033 HT HT. 59 40 Capacity USA 1995 1995 Caterpillar 21034 HT HT. 60 40 Capacity USA 1995 1995 Caterpillar 21035 HT HT. 61 40 Capacity USA 1995 1995 Caterpillar 21036 HT HT. 62 40 Capacity USA 1995 1995 Caterpillar 21037 HT HT. 63 40 Capacity USA 1995 1995 Caterpillar 210

Appendix E (Cont’d)
The Age and Conditions of Equipment in JICT
76
Manufacturer Year EngineNo. Equipment
TypeRegisterNumber
Capacity(tons) Mark Country Made Used Mark HP
Remarks
HEAD TRUCK (Cont’d)38 HT HT. 64 40 Capacity USA 1995 1995 Caterpillar 21039 HT HT. 65 40 Capacity USA 1995 1995 Caterpillar 21040 HT HT. 66 40 Capacity USA 1995 1995 Caterpillar 21041 HT HT. 67 40 Capacity USA 1995 1995 Caterpillar 21042 HT HT. 68 40 Capacity USA 1995 1995 Caterpillar 21043 HT HT. 69 40 Capacity USA 1995 1995 Caterpillar 21044 HT HT. 70 40 Capacity USA 1995 1995 Caterpillar 21045 HT HT. 71 40 Capacity USA 1995 1995 Caterpillar 21046 HT HT. 72 40 Capacity USA 1995 1995 Caterpillar 21047 HT HT. 73 40 Capacity USA 1995 1995 Caterpillar 21048 HT HT. 74 40 Capacity USA 1995 1995 Caterpillar 21049 HT HT. 75 40 Capacity USA 1995 1995 Caterpillar 21050 HT HT. 76 40 Capacity USA 1995 1995 Caterpillar 21051 HT HT. 77 40 Capacity USA 1995 1995 Caterpillar 21052 HT HT. 78 40 Ottawa Canada 1996 1996 Caterpillar 21053 HT HT. 79 40 Ottawa Canada 1996 1996 Caterpillar 21054 HT HT. 80 40 Ottawa Canada 1996 1996 Caterpillar 21055 HT HT. 81 40 Ottawa Canada 1996 1996 Caterpillar 21056 HT HT. 82 40 Ottawa Canada 1996 1996 Caterpillar 21057 HT HT.01A. 40 Ottawa Canada 1991 1991 Caterpillar 17558 HT HT.02A. 40 Ottawa Canada 1991 1991 Caterpillar 17559 HT HT.03A. 40 Ottawa Canada 1991 1991 Caterpillar 17560 HT HT.04A. 40 Ottawa Canada 1991 1991 Caterpillar 17561 HT HT.05A. 40 Ottawa Canada 1991 1991 Caterpillar 17562 HT HT.06A. 40 Ottawa Canada 1991 1991 Caterpillar 17563 HT HT.07A. 40 Ottawa Canada 1991 1991 Caterpillar 17564 HT HT.08A. 40 Ottawa Canada 1991 1991 Caterpillar 17565 HT HT.09A. 40 Ottawa Canada 1991 1991 Caterpillar 17566 HT HT.010A. 40 Ottawa Canada 1991 1991 Caterpillar 17567 HT HT.011A. 40 Ottawa Canada 1996 1996 Caterpillar 21068 HT HT.012A. 40 Ottawa Canada 1996 1996 Caterpillar 21069 HT HT.013A. 40 Ottawa Canada 1996 1996 Caterpillar 21070 HT HT.014A. 40 Ottawa Canada 1996 1996 Caterpillar 21071 HT HT.015A. 40 Ottawa Canada 1996 1996 Caterpillar 210
C H A S S I S (CHS)1 CHS CHS. 01 40 Hargill-Co Canada 1978 1978 - -2 CHS CHS. 03 40 Hargill-Co Canada 1978 1978 - -3 CHS CHS. 04 40 Hargill-Co Canada 1978 1978 - -4 CHS CHS. 05 40 Hargill-Co Canada 1978 1978 - -5 CHS CHS. 06 40 Hargill-Co Canada 1978 1978 - -6 CHS CHS. 07 40 Hargill-Co Canada 1978 1978 - -7 CHS CHS. 10 40 Hargill-Co Canada 1978 1978 - -8 CHS CHS. 11 40 Hargill-Co Canada 1978 1978 - -9 CHS CHS. 12 40 Hargill-Co Canada 1978 1978 - -
10 CHS CHS. 13 40 Hargill-Co Canada 1978 1978 - -11 CHS CHS. 14 40 Hargill-Co Canada 1978 1978 - -12 CHS CHS. 15 40 Hargill-Co Canada 1978 1978 - -15 CHS CHS. 17 40 PT. Bukaka Indonesia 1983 1983 - -13 CHS CHS. 24 40 Hargill-Co Canada 1978 1978 - -14 CHS CHS. 29 40 Hargill-Co Canada 1978 1978 - -16 CHS CHS. 25 40 PT. Bukaka Indonesia 1983 1983 - -17 CHS CHS. 27 40 PT. Bukaka Indonesia 1983 1983 - -18 CHS CHS. 30 40 PT. Bukaka Indonesia 1983 1983 - -19 CHS CHS. 34 40 PT. Bukaka Indonesia 1983 1983 - -

Appendix E (Cont’d)
The Age and Conditions of Equipment in JICT
77
Manufacturer Year EngineNo. Equipment
TypeRegisterNumber
Capacity(tons) Mark Country Made Used Mark HP
Remarks
C H A S S I S (Cont’d)20 CHS CHS. 48 40 Mandiri Indonesia 1988 1988 - -21 CHS CHS. 49 40 Mandiri Indonesia 1988 1988 - -22 CHS CHS. 50 40 Mandiri Indonesia 1988 1988 - -23 CHS CHS. 51 40 Mandiri Indonesia 1988 1988 - -24 CHS CHS. 52 40 Mandiri Indonesia 1988 1988 - -25 CHS CHS. 54 40 Mandiri Indonesia 1988 1988 - -26 CHS CHS. 55 40 Mandiri Indonesia 1988 1988 - -27 CHS CHS. 56 40 Mandiri Indonesia 1988 1988 - -28 CHS CHS. 57 40 Mandiri Indonesia 1988 1988 - -29 CHS CHS. 58 40 Mandiri Indonesia 1988 1988 - -30 CHS CHS. 59 40 Mandiri Indonesia 1988 1988 - -31 CHS CHS. 61 40 Mandiri Indonesia 1988 1988 - -32 CHS CHS. 62 40 Mandiri Indonesia 1988 1988 - -33 CHS CHS. 64 40 PT. Gemala Indonesia 1991 1991 - -34 CHS CHS. 65 40 PT. Gemala Indonesia 1991 1991 - -35 CHS CHS. 66 40 PT. Gemala Indonesia 1991 1991 - -36 CHS CHS. 67 40 PT. Gemala Indonesia 1991 1991 - -37 CHS CHS. 68 40 PT. Gemala Indonesia 1991 1991 - -38 CHS CHS. 69 40 PT. Gemala Indonesia 1991 1991 - -39 CHS CHS. 70 40 PT. Gemala Indonesia 1991 1991 - -40 CHS CHS. 72 40 PT. Gemala Indonesia 1991 1991 - -41 CHS CHS. 73 40 PT. Gemala Indonesia 1991 1991 - -42 CHS CHS. 74 40 PT. Gemala Indonesia 1991 1991 - -43 CHS CHS. 76 40 PT. Gemala Indonesia 1991 1991 - -44 CHS CHS. 77 40 PT. Gemala Indonesia 1991 1991 - -45 CHS CHS. 78 40 PT. Gemala Indonesia 1991 1991 - -46 CHS CHS. 79 40 PT. Gemala Indonesia 1991 1991 - -47 CHS CHS. 80 40 PT. Gemala Indonesia 1991 1991 - -48 CHS CHS. 81 40 PT. Gemala Indonesia 1991 1991 - -49 CHS CHS. 82 40 PT. Gemala Indonesia 1991 1991 - -50 CHS CHS. 83 40 PT. Gemala Indonesia 1991 1991 - -51 CHS CHS. 84 40 PT. Gemala Indonesia 1991 1991 - -52 CHS CHS. 85 40 PT. Gemala Indonesia 1991 1991 - -53 CHS CHS. 86 40 PT. Gemala Indonesia 1991 1991 - -54 CHS CHS. 87 40 PT. Gemala Indonesia 1991 1991 - -55 CHS CHS. 88 40 PT. Gemala Indonesia 1991 1991 - -56 CHS CHS. 89 40 PT. Gemala Indonesia 1991 1991 - -57 CHS CHS. 90 40 PT. Gemala Indonesia 1991 1991 - -58 CHS CHS. 91 40 PT. Gemala Indonesia 1991 1991 - -59 CHS CHS. 92 40 PT. Gemala Indonesia 1991 1991 - -60 CHS CHS. 93 40 PT. Gemala Indonesia 1991 1991 - -61 CHS CHS. 01A 40 PT. Gemala Indonesia 1991 1991 - -62 CHS CHS. 02A 40 PT. Gemala Indonesia 1991 1991 - -63 CHS CHS. 03A 40 PT. Gemala Indonesia 1991 1991 - -64 CHS CHS. 04A 40 PT. Gemala Indonesia 1991 1991 - -65 CHS CHS. 04A 40 PT. Gemala Indonesia 1991 1991 - -66 CHS CHS. 05A 40 PT. Gemala Indonesia 1991 1991 - -67 CHS CHS. 06A 40 PT. Gemala Indonesia 1991 1991 - -68 CHS CHS. 07A 40 PT. Gemala Indonesia 1991 1991 - -69 CHS CHS. 08A 40 PT. Gemala Indonesia 1991 1991 - -70 CHS CHS. 09A 40 PT. Gemala Indonesia 1991 1991 - -71 CHS CHS. 10A 40 PT. Gemala Indonesia 1991 1991 - -72 CHS CHS. 11A 40 PT. Gemala Indonesia 1991 1991 - -73 CHS CHS. 11A 40 PT. Gemala Indonesia 1991 1991 - -74 CHS CHS. 12A 40 PT. Gemala Indonesia 1991 1991 - -

Appendix E (Cont’d)
The Age and Conditions of Equipment in JICT
78
Manufacturer Year EngineNo. Equipment
TypeRegisterNumber
Capacity(tons) Mark Country Made Used Mark HP
Remarks
C H A S S I S (Cont’d)75 CHS CHS. 13A 40 PT. Gemala Indonesia 1991 1991 - -76 CHS CHS. 13A 40 PT. Gemala Indonesia 1991 1991 - -77 CHS CHS. 14A 40 PT. Gemala Indonesia 1991 1991 - -78 CHS CHS. 15A 40 PT. Gemala Indonesia 1991 1991 - -79 CHS CHS. 16A 40 PT. Gemala Indonesia 1991 1991 - -80 CHS CHS. 17A 40 PT. Gemala Indonesia 1991 1991 - -81 CHS CHS. 18A 40 PT. Gemala Indonesia 1991 1991 - -82 CHS CHS. 19A 40 PT. Gemala Indonesia 1991 1991 - -83 CHS CHS. 20A 40 Mandiri Indonesia 1997 1997 - -84 CHS CHS. 21A 40 Mandiri Indonesia 1997 1997 - -85 CHS CHS. 22A 40 Mandiri Indonesia 1997 1997 - -86 CHS CHS. 23A 40 Mandiri Indonesia 1997 1997 - -87 CHS CHS. 24A 40 Mandiri Indonesia 1997 1997 - -88 CHS CHS. 25A 40 Mandiri Indonesia 1997 1997 - -89 CHS CHS. 26A 40 Mandiri Indonesia 1997 1997 - -90 CHS CHS. 27A 40 Mandiri Indonesia 1997 1997 - -91 CHS CHS. 28A 40 Mandiri Indonesia 1997 1997 - -92 CHS CHS. 29A 40 Mandiri Indonesia 1997 1997 - -
Source: Company record.