
ANALYSIS AND DESIGN OF CONFORMAL FREQUENCY …etd.lib.metu.edu.tr/upload/12617344/index.pdf ·...
132
ANALYSIS AND DESIGN OF CONFORMAL FREQUENCY SELECTIVE SURFACES A THESIS SUBMITTED TO THE GRADUATE SCHOOL OF NATURAL AND APPLIED SCIENCES OF MIDDLE EAST TECHNICAL UNIVERSITY BY AKIN DALKILIÇ IN PARTIAL FULFILLMENT OF THE REQUIREMENTS FOR THE DEGREE OF MASTER OF SCIENCE IN ELECTRICAL AND ELECTRONICS ENGINEERING JUNE 2014
Transcript of ANALYSIS AND DESIGN OF CONFORMAL FREQUENCY …etd.lib.metu.edu.tr/upload/12617344/index.pdf ·...

ANALYSIS AND DESIGN OF CONFORMAL FREQUENCY SELECTIVE
SURFACES
A THESIS SUBMITTED TO
THE GRADUATE SCHOOL OF NATURAL AND APPLIED SCIENCES
OF
MIDDLE EAST TECHNICAL UNIVERSITY
BY
AKIN DALKILIÇ
IN PARTIAL FULFILLMENT OF THE REQUIREMENTS
FOR
THE DEGREE OF MASTER OF SCIENCE
IN
ELECTRICAL AND ELECTRONICS ENGINEERING
JUNE 2014


Approval of the thesis:
ANALYSIS AND DESIGN OF CONFORMAL FREQUENCY SELECTIVE
SURFACES
submitted by AKIN DALKILIÇ in partial fulfillment of the requirements for the
degree of Master of Science in Electrical and Electronics Engineering
Department, Middle East Technical University by,
Prof. Dr. Canan Özgen
Dean, Graduate School of Natural and Applied Sciences _________________
Prof. Dr. Gönül Turhan Sayan
Head of Department, Electrical and Electronics Eng. _________________
Assoc. Prof. Dr. Lale Alatan
Supervisor, Electrical and Electronics Eng. Dept.,METU _________________
Examining Committee Members:
Prof. Dr. Nilgün Günalp
Electrical and Electronics Eng. Dept.,METU _________________
Assoc. Prof. Dr. Lale Alatan
Electrical and Electronics Eng. Dept.,METU _________________
Prof. Dr. Gönül Turhan Sayan
Electrical and Electronics Eng. Dept.,METU _________________
Prof. Dr. Gülbin Dural
Electrical and Electronics Eng. Dept.,METU _________________
Can Barış Top, Ph.D.
ASELSAN _________________
Date: 11.06.2014

iv
I hereby declare that all information in this document has been obtained and
presented in accordance with academic rules and ethical conduct. I also
declare that, as required by these rules and conduct, I have fully cited and
referenced all material and results that are not original to this work.
Name, Last name: Akın DALKILIÇ
Signature:

v
ABSTRACT
ANALYSIS AND DESIGN OF CONFORMAL FREQUENCY
SELECTIVE SURFACES
Dalkılıç, Akın
M. Sc., Department of Electrical and Electronics Engineering
Supervisor: Assoc. Prof. Dr. Lale Alatan
June 2014, 112 pages
An efficient analysis and design approach for conformal frequency selective
surface (FSS) structures is developed. The design methodology involves the
analysis of both the planar and curved FSS structures. First, planar unit cell
analysis of conformal FSS models are accomplished for normal and oblique
incidence cases. To prove conformal applicability of planar designs, a semi-finite
analysis method is utilized. This method is based on solution of a singly periodic
curved FSS structure of semi-cylinder shape possessing periodicity, curved element
arrangement and finite model conditions together. The model is finite in curved
direction and infinite along the axis of the cylinder. Semi-finite model analysis is a
powerful solution tool to determine both transmission and reflection responses of
conformal FSS structures. With the introduced design methodology for conformal
FSS implementations, a narrow band FSS radome operating in Ku-band and a wide
band FSS model serving as a band-pass spatial filter for X-band (8.2-12.4 GHz)
signals are designed. FSS performances are verified with both planar single
element unit cell solutions and semi-finite analyses of curved and planar structures.
Planar prototypes of narrowband FSS model are fabricated and measured. Reasons
for discrepancies between simulated and measured filtering characteristics are
investigated and explained.
KEYWORDS: Frequency Selective Surface (FSS), Conformal FSS, RCS
reduction, Coupled Aperture FSS, Wide band FSS

vi
ÖZ
KONFORMAL FREKANS SEÇİCİ YÜZEYLERİN ANALİZ VE
TASARIMI
Dalkılıç, Akın
Yüksek Lisans, Elektrik ve Elektronik Mühendisliği Bölümü
Tez Yöneticisi: Doç. Dr. Lale Alatan
Haziran 2014, 112 sayfa
Konformal frekans seçici yüzey (FSY) yapıları için etkin bir analiz ve tasarım
yaklaşımı geliştirilmiştir. Tasarım yöntemi hem düzlemsel hem de eğimli FSY
elemanlarının analizini içermektedir. İlk aşamada konformal FSY modellerinin
düzlemsel birim hücre analizleri dik ve farklı açılarda yayın geldiği durumlar için
gerçekleştirilmektedir. Düzlemsel modellerin konformal yüzeylerde
uygulanabilirliğini kanıtlamak için yarı-sonlu analiz yöntemi kullanılmıştır. Temel
olarak bu yöntem tek yönde periyodik, bükümlü, yarım silindir şeklindeki FSY
yapısının periyodiklik, konformal eleman ve sonlu model koşullarının etkilerini
içerecek şekilde çözümünü ifade etmektedir. Kullanılan model kavisli olduğu
yönde sonlu, boylamsal yönde ise sonsuz uzunluktadır. Yarı-sonlu model analizi,
konformal FSY yapılarının geçirgenlik ve yansıma performanslarının tespit
edilebileceği güçlü bir çözüm aracıdır. Konformal FSY uygulamaları için bildirilen
tasarım yöntemi ile Ku-bantta çalışan dar bantlı FSY radom ile X-bant (8.2-12.4
GHz) frekanslarının tamamını kapsayan geniş bantlı bant-geçiren bir FSY yapısı
tasarlanmıştır. FSY performansları hem düzlemsel tek eleman birim hücre
çözümüyle hem de yarı-sonlu analiz yöntemi ile düzlemsel ve eğimli modeller için
doğrulanmıştır. Dar bantlı FSY modelinin düzlemsel prototiplerinin üretimi ve
ölçümleri alt yapı koşullarının el verdiği ölçüde gerçekleştirilmiştir. Benzetim
sonucu beklenen filtreleme performansı ile ölçümler arasındaki uyumsuzlukların
sebepleri incelenmiş ve açıklanmıştır.
ANAHTAR KELİMELER: Frekans Seçici Yüzey (FSY), Konformal FSY, RKA
azaltımı, Bağlaşık Açıklıklı FSY, Geniş Bantlı FSY

vii
To Nazlım,

viii
ACKNOWLEDGEMENTS
I would like to express my sincere gratitude to my advisor, Assoc. Prof. Dr. Lale
Alatan, for her guidance, support and technical suggestions throughout the study.
I would like to express my gratitude to Dr. Can Barış Top providing invaluable
support for both theoretical and practical topics throughout the study.
I am grateful to ASELSAN A.Ş. for the financial and technical opportunities
provided for the completion of this thesis.
I would also like to express my sincere appreciation for Erdinç Erçil, Doğanay
Doğan, Egemen Yıldırım, Mehmet Emre Demir and Onur Cem Erdoğan for their
valuable friendship, motivation and help.
I would like to thank TÜBİTAK for providing financial support during the study.
For their understanding my spending lots of time on this work, I sincerely thank to
my family.

ix
TABLE OF CONTENTS
ABSTRACT .............................................................................................................. v
ÖZ............................................................................................................................. vi
ACKNOWLEDGEMENTS ................................................................................... viii
TABLE OF CONTENTS ......................................................................................... ix
LIST OF TABLES ................................................................................................... xi
LIST OF FIGURES ................................................................................................. xii
CHAPTERS
1. INTRODUCTION ................................................................................................. 1
1.1 Preface ........................................................................................................ 1
1.1.1. Type of Elements: Patches and Slots (Apertures).................................. 3
1.1.2. Shape of Elements................................................................................... 4
1.2 Organization of the Thesis ........................................................................ 18
2. ANALYSIS METHODS FOR FSS STRUCTURES .......................................... 21
2.1 Overview of Analysis Methods ................................................................ 21
2.2 Design Approaches for Curved FSS Structures ....................................... 34
2.3 Design Methodology for Conformal Frequency Selective Surfaces ........ 35
3. DESIGN AND ANALYSIS OF A HYBRID CONFORMAL FREQUENCY
SELECTIVE SURFACE......................................................................................... 39
3.1 Design Requirements ................................................................................ 39
3.2 Hybrid Conformal Frequency Selective Surface Design ......................... 40

x
4. DESIGN AND ANALYSIS OF A WIDEBAND CONFORMAL FREQUENCY
SELECTIVE SURFACE ......................................................................................... 73
4.1 Design Requirements ................................................................................ 73
4.2 Wideband Conformal Frequency Selective Surface Design .................... 74
5. FABRICATION AND MEASUREMENTS OF FREQUENCY SELECTIVE
SURFACE STRUCTURES .................................................................................... 93
5.1 Fabrication of the Hybrid Coupled Aperture FSS .................................... 93
5.2 Measurements of Fabricated FSS Structures ............................................ 94
6. CONCLUSIONS ............................................................................................... 105
REFERENCES ...................................................................................................... 109

xi
LIST OF TABLES
TABLES
Table 3- 1 Parameter sweep results for disk radius (r1) .......................................... 47
Table 3- 2 Parameter sweep results for aperture radius (r0) ................................... 47
Table 3- 3 Parameter sweep results for dielectric thickness (h) .............................. 48
Table 3- 4 Parameter sweep results for FSS period (p)........................................... 48

xii
LIST OF FIGURES
FIGURES
Figure 1- 1 Transmission characteristics and models of FSS with respect to
electrical properties: (a) Capacitive (b) Inductive [10] ............................................ 3
Figure 1- 2 Classification of FSS elements [1] ......................................................... 5
Figure 1- 3 Dipole elements a) Regular half wavelength dipoles b) Loaded dipoles
[11] ............................................................................................................................ 6
Figure 1- 4 Reflection curves of standard dipoles for different angles of incidence
[11] ............................................................................................................................ 6
Figure 1- 5 Array of three-legged loaded FSS elements [1] ..................................... 8
Figure 1-6 Wideband FSS structure a) Three dimensional unit cell model
b) Prototype of fabricated FSS [12] .......................................................................... 9
Figure 1- 7 Double square loop FSS model [13]..................................................... 10
Figure 1-8 Dual-band FSS model [9] ...................................................................... 10
Figure 1-9 Tri-band FSS model [14] ....................................................................... 11
Figure 1-10 Iterations of the Sierpinski FSS [17] ................................................... 12
Figure 1- 11 Crossed dipole aperture FSS model: a) Single layer b) Double layer 12
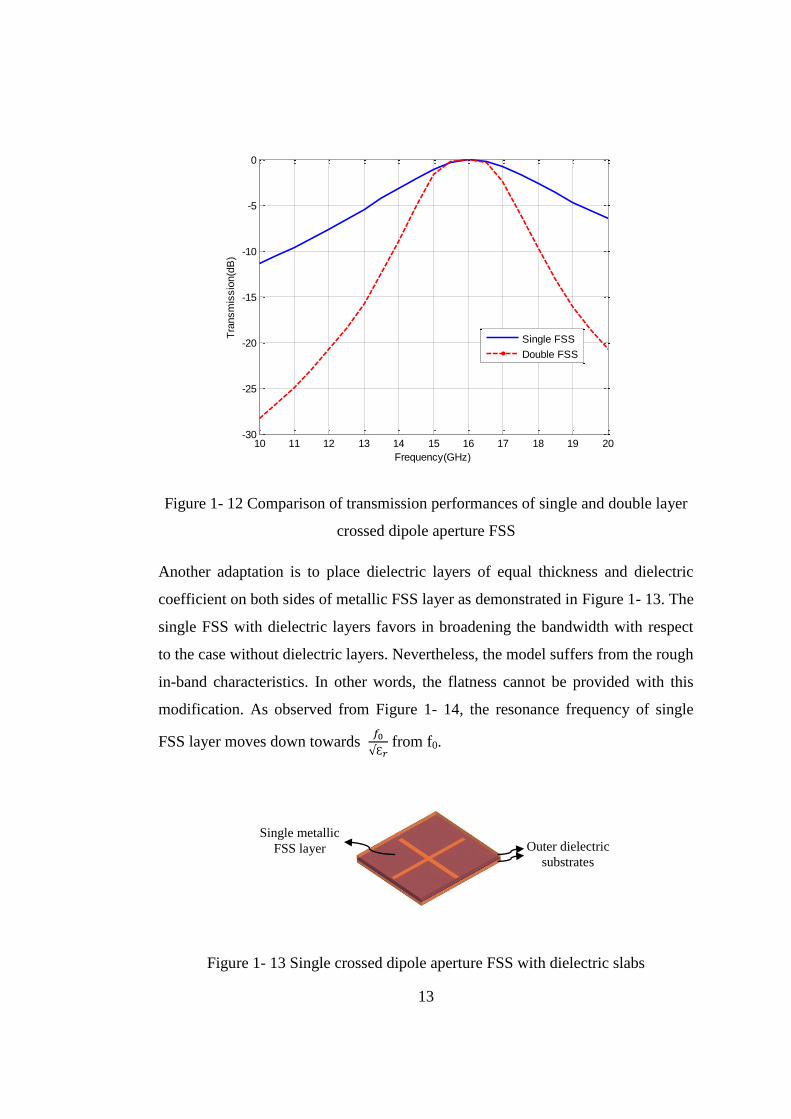
Figure 1- 12 Comparison of transmission performances of single and double layer
crossed dipole aperture FSS .................................................................................... 13
Figure 1- 13 Single crossed dipole aperture FSS with dielectric slabs ................... 13
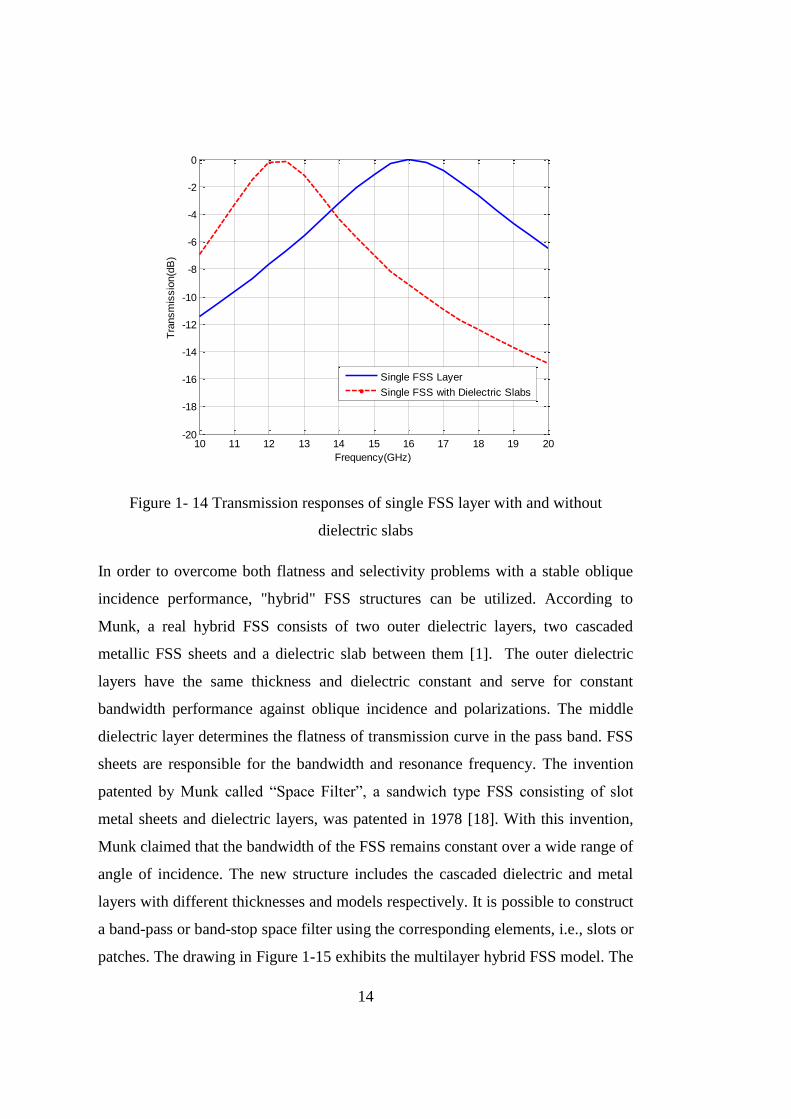
Figure 1- 14 Transmission responses of single FSS layer with and without
dielectric slabs ......................................................................................................... 14
Figure 1-15 The schematic of a multilayer “Space Filter” [18] .............................. 15
Figure 1- 16 Hybrid FSS configuration of crossed dipole aperture element........... 15
Figure 1- 17 Transmission responses of single layer and hybrid crossed dipole
aperture FSS ............................................................................................................ 16
Figure 1- 18 Utilization of conformal FSS in a dual band reflector system [19] .... 17

xiii
Figure 2- 1 Unit cell (on the left) and finite planar array (on the right) of a disk FSS
................................................................................................................................. 24
Figure 2- 2 Various unit cell arrangements: (a) Triangular (b) Hexagonal (c)
Parallelogram .......................................................................................................... 25
Figure 2- 3 Arrangements of FSS elements on spherical surface: (a) Hexagonal (b)
Pentagonal [19] ....................................................................................................... 25
Figure 2- 4 Illustration of element arrangement on sphere with shifted unit cell
approach: a) Single sequence placement b) Multiplication of elements on single
sequence c) Covered quarter sphere d) Full sphere view ...................................... 26
Figure 2- 5 Different unit cell arrangements for the determination of the shifted unit
cell performance ...................................................................................................... 27
Figure 2- 6 Assignment of "Master" and "Slave" boundary conditions on the walls
of vacuum box ......................................................................................................... 28
Figure 2- 7 Floquet port assignments for a unit cell FSS model in HFSS .............. 29
Figure 2- 8 Modes Calculator (on the left) and de-embedding (on the right)
properties of HFSS Floquet port setup .................................................................... 30
Figure 2- 9 Quarter FSS model: (a) The arrangement of FSS elements (b)
Symmetry boundaries .............................................................................................. 31
Figure 2- 10 Planar semi-finite FSS model unit cell ............................................... 32
Figure 2- 11 Curved semi-finite FSS model unit cell ............................................. 32
Figure 2- 12 Faces used for PML boundary identification on the curved semi-finite
model ....................................................................................................................... 33
Figure 2- 13 Coupled-aperture disk hybrid FSS unit cell model ............................ 36
Figure 2- 14 Flowchart representation of conformal FSS design procedure .......... 37
Figure 3- 1 Circular FSS element models ............................................................... 40
Figure 3- 2 Top (a) and cross-sectional (b) views of the rectangular aperture
coupled FSS [35] ..................................................................................................... 41
Figure 3- 3 Layers of the hybrid FSS model ........................................................... 42
Figure 3- 4 A quarter of the filter-antenna model simulated with HFSS [36] ........ 43

xiv
Figure 3- 5 Sweep parameters of the FSS unit cell; (a) Top view (b) Side view (c)
Circular aperture metallic layer ............................................................................... 44
Figure 3- 6 Transmission responses of the hybrid FSS for disk radius parameter
(r1) sweep ................................................................................................................ 44
Figure 3- 7 Transmission responses of the hybrid FSS for circular aperture radius
parameter (r0) sweep ............................................................................................... 45
Figure 3- 8 Transmission responses of the hybrid FSS for dielectric slab thickness
parameter (h) sweep ................................................................................................ 45
Figure 3- 9 Transmission responses of the hybrid FSS for period parameter (p)
sweep ....................................................................................................................... 46
Figure 3- 10Transmission and reflection characteristics of the optimized FSS unit
cell ........................................................................................................................... 49
Figure 3- 11 Transmission performance of the unit cell for different angles of
incidence (TE modes) .............................................................................................. 50
Figure 3- 12 Reflection characteristics of the unit cell for different angles of
incidence (TE modes) .............................................................................................. 50
Figure 3- 13 Transmission performance of the unit cell for different angles of
incidence (TM modes)............................................................................................. 51
Figure 3- 14 Reflection characteristics of the unit cell for different angles of
incidence (TM modes)............................................................................................. 51
Figure 3- 15 Transmission responses of triangular array unit cell for different angle
of incidences (TE modes) ........................................................................................ 52
Figure 3- 16 Reflection responses of triangular array unit cell for different angle of
incidences (TE modes) ............................................................................................ 53
Figure 3- 17 Transmission responses of triangular array unit cell for different angle
of incidences (TM modes) ....................................................................................... 53
Figure 3- 18 Reflection responses of triangular array unit cell for different angle of
incidences (TM modes) ........................................................................................... 54
Figure 3- 19 Transmission responses of hexagonal array unit cell for different angle
of incidences (TE modes) ........................................................................................ 54

xv
Figure 3- 20 Reflection responses of hexagonal array unit cell for different angle of
incidences (TE modes) ............................................................................................ 55
Figure 3- 21 Transmission responses of hexagonal array unit cell for different angle
of incidences (TM modes)....................................................................................... 55
Figure 3- 22 Reflection responses of hexagonal array unit cell for different angle of
incidences (TM modes) ........................................................................................... 56
Figure 3- 23 Modified triangular array unit cells (different shifts) ......................... 57
Figure 3- 24 Transmission responses of the modified triangular array unit cells ... 57
Figure 3- 25 Reflection responses of the modified triangular array unit cells ........ 58
Figure 3- 26 Far field E-total patterns of 31-element source antenna array without
FSS radome and with conformal FSS at 0.964*f0 ................................................... 59
Figure 3- 27 Far field E-total patterns of 31-element source antenna array without
FSS radome and with conformal FSS at 0.988*f0 ................................................... 59
Figure 3- 28 Far field E-total patterns of 31-element source antenna array without
FSS radome and with conformal FSS at f0 .............................................................. 60
Figure 3- 29 Far field E-total patterns of 31-element source antenna array without
FSS radome and with conformal FSS at 1.012*f0 ................................................... 60
Figure 3- 30 Far field E-total patterns of 31-element source antenna array without
FSS radome and with conformal FSS at 1.048*f0 ................................................... 61
Figure 3- 31 Far field E-total patterns with and without FSS radome at 0.964*f0 -
Planar semi-finite model ......................................................................................... 62
Figure 3- 32 Far field E-total patterns with and without FSS radome at f0 - Planar
semi-finite model..................................................................................................... 62
Figure 3- 33 Far field E-total patterns with and without FSS radome at 1.048*f0 -
Planar semi-finite model ......................................................................................... 63
Figure 3- 34 Far field E-total patterns of 2-element source antenna array without
FSS radome and with planar and conformal FSS at 0.964*f0 ................................. 64
Figure 3- 35 Far field E-total patterns of 2-element source antenna array without
FSS radome and with planar and conformal FSS at f0 ............................................ 64

xvi
Figure 3- 36 Far field E-total patterns of 2-element source antenna array without
FSS radome and with planar and conformal FSS at 1.048*f0 ................................. 65
Figure 3- 37 Comparison of transmission characteristics of unit cell and semi-finite
conformal and planar models .................................................................................. 66
Figure 3- 38 The schematic of the RCS comparison method using PEC Cylinder. 67
Figure 3- 39 Monostatic RCS results of FSS and PEC semi-cylinders using semi-
finite analysis method .............................................................................................. 67
Figure 3- 40 RCS analysis using semi-finite model: Dielectric radome and PEC
sheet ......................................................................................................................... 68
Figure 3- 41 The schematic of the RCS analysis method using dielectric cylinder
and PEC planar sheet ............................................................................................... 68
Figure 3- 42 Monostatic RCS results of FSS and dielectric semi-cylinders using
semi-finite analysis method ..................................................................................... 69
Figure 3- 43 Finite spherical FSS radome: (a) Top view (b) Side view ................. 70
Figure 3- 44 Symmetry planes of the quarter model ............................................... 70
Figure 3- 45 Total E-field patterns with and without doubly curved finite FSS
radome at far zone (0.94*f0) .................................................................................... 71
Figure 3- 46 Total E-field patterns with and without doubly curved finite FSS
radome at far zone (f0) ............................................................................................. 71
Figure 3- 47 Total E-field patterns with and without doubly curved finite FSS
radome at far zone (1.04*f0) .................................................................................... 72
Figure 4- 1 Reference ultra-wideband FSS unit cell model: (a) Unit cell (b)
Prototype of fabricated FSS [12] ............................................................................. 74
Figure 4- 2 Wideband FSS layers: (a) Original (from [12]) (b) Modified .............. 75
Figure 4- 3 Transmission responses for the sweep values of period parameter (p) 76
Figure 4- 4 Transmission responses for the sweep values of dielectric thickness (h)
................................................................................................................................. 77
Figure 4- 5 Transmission responses for the sweep values of disk radius (r)........... 78
Figure 4- 6 Transmission responses for the sweep values of grid width (s) ........... 78

xvii
Figure 4- 7 Transmission and reflection characteristics of the optimized FSS design
for the normal incidence .......................................................................................... 79
Figure 4- 8 Transmission responses of the optimized FSS design for oblique
incidences (TE mode).............................................................................................. 80
Figure 4- 9 Reflection responses of the optimized FSS design for oblique
incidences (TE mode).............................................................................................. 80
Figure 4- 10 Transmission responses of the optimized FSS design for oblique
incidences (TM mode) ............................................................................................ 81
Figure 4- 11 Reflection responses of the optimized FSS design for oblique
incidences (TM mode) ............................................................................................ 81
Figure 4- 12 Triangular array configuration of WB FSS model ............................. 82
Figure 4- 13 Transmission responses of the triangular array unit cell model for
oblique incidences (TE mode)................................................................................. 82
Figure 4- 14 Reflection responses of the triangular array unit cell model for oblique
incidences (TE mode).............................................................................................. 83
Figure 4- 15 Transmission responses of the triangular array unit cell model for
oblique incidences (TM mode) ............................................................................... 83
Figure 4- 16 Reflection responses of the triangular array unit cell model for oblique
incidences (TM mode) ............................................................................................ 84
Figure 4- 17 Far field E-total patterns of 31-element source antenna array with and
without wide band FSS radome at 2 GHz ............................................................... 85
Figure 4- 18 Far field E-total patterns of 31-element source antenna array with and
without wide band FSS radome at 8 GHz ............................................................... 85
Figure 4- 19 Far field E-total patterns of 31-element source antenna array with and
without wide band FSS radome at 10 GHz ............................................................. 86
Figure 4- 20 Far field E-total patterns of 31-element source antenna array with and
without wide band FSS radome at 12.5 GHz .......................................................... 86
Figure 4- 21 Far field E-total patterns of 31-element source antenna array with and
without wide band FSS radome at 18 GHz ............................................................. 87

xviii
Figure 4- 22 Far field E-total patterns of 31-element source antenna array with and
without planar wide band FSS radome at 2 GHz .................................................... 88
Figure 4- 23 Far field E-total patterns of 31-element source antenna array with and
without planar wide band FSS radome at 10 GHz .................................................. 88
Figure 4- 24 Far field E-total patterns of 31-element source antenna array with and
without planar wide band FSS radome at 18 GHz .................................................. 89
Figure 4- 25 Comparison of transmission characteristics of unit cell and semi-finite
conformal and planar models .................................................................................. 90
Figure 4- 26 Monostatic RCSs of WB FSS and PEC semi-cylinder using semi-
finite analysis method .............................................................................................. 91
Figure 4- 27 Monostatic RCS results of FSS and dielectric semi-cylinders using
semi-finite analysis method ..................................................................................... 92
Figure 5- 1 Separate layers of the fabricated FSS Prototypes ................................. 94
Figure 5- 2 Free Space Microwave Measurement Setup ........................................ 95
Figure 5- 3 Placement of FSS prototype on the Free Space Measurement Setup ... 96
Figure 5- 4 Free Space Measurement and HFSS Unit cell results for hybrid coupled
FSS prototype No.1 and No.2 ................................................................................. 96
Figure 5- 5 Modification apparatus (front view on the left, side view on the right)
for FSS measurements using Arc Measurement Setup ........................................... 97
Figure 5- 6 Modified horn antenna measurement setup .......................................... 98
Figure 5- 7 Horn Antenna Measurement and HFSS Unit cell analysis results for
hybrid coupled FSS prototype No.1 and No.2 ........................................................ 99
Figure 5- 8 The comparison of unit cell model analysis and measurements with
Free Space Microwave and Horn Antenna setups (Prototype No.1) .................... 100
Figure 5- 9 The comparison of unit cell model analysis and measurements with
Free Space Microwave and Horn Antenna setups (Prototype No.2) .................... 100
Figure 5- 10 Comparison of normal and 40um-vacuum layered unit cell analysis
results with Free Space Microwave Measurements .............................................. 101
Figure 5- 11 Comparison of normal and 40um-vacuum layered unit cell analysis
results with Horn Antenna Measurements ............................................................ 102

xix
Figure 5- 12 Misalignment configuration of unit cell model a) Unit cell b) Bottom
and middle FSS layer c) Upper FSS layer ............................................................ 103
Figure 5- 13 Transmission responses for different shifts in FSS layers................ 103
Figure 5- 14 Complementary FSS model with single dielectric substrate ............ 104
Figure 5- 15 Comparison of transmission responses of coupled aperture hybrid FSS
and single layer complementary FSS with single dielectric substrate .................. 104

xx

1
CHAPTER 1
INTRODUCTION
1.1 Preface
With advancing techniques in radar technologies, the invisibility of radar systems
has become one of the major challenging topics over the years beginning with the
spectacular progress after World War II [1]. To have almost invisible radar
systems, RCS is the key parameter which has to be kept at minimum. RCS defines
the scattering characteristics of a target. In other words, it is a measure of the
reflected signals in the direction of receiving antenna. There are two cases for
scattering: monostatic and bistatic. Monostatic scattering refers to backscattering,
which means the transmitter and receiver antennas are at the same position. In
bistatic cases, the transmitter and receiver are at different locations. RCS of a target
is determined by different factors like polarization, angle of incidence, angle of
observation, target geometry, electrical properties of target and frequency of
operation [2]. Different methods are developed in order to have low observable
targets. The major two methods to reduce the RCS of a target are "modifying the
shape" and "using materials". The adjustment of the reflecting surface is
implemented in order to reflect the incoming signal to other directions avoiding
back scattering. Thus, the RCS of the target can be reduced significantly. However,
the modification of the target surface is generally limited by other fundamental
requirements of the operating systems like aerodynamic qualifications for flying air
platforms. The materials are used to absorb the incoming wave and weaken the
power of the reflecting signal resulting to low RCS. Generally, the shaped surfaces

2
and absorbing materials are treated together to maximize the effect in reducing the
target RCS. Nevertheless, the absorber materials cannot be used over the radiating
apertures. Thus, the use of FSS is required in order to lessen the RCS of the
radiating structures. Frequency selective surfaces can be defined as any periodic
structure, generally in two dimensions, which is modeled as metallic patches over
dielectrics or apertures in metals and exhibits band-stop or band-pass
characteristics, respectively. Frequency selective surfaces have a very wide range
for many applications from the optic region to microwave frequencies. FSS are
generally used in radar or telecommunication systems in order to reduce radar cross
section (RCS) or to provide a dual-band operation for reflector antennas.
Furthermore, FSS are also used in various applications like circuit analog
absorbers, filters, polarizers and some recent applications such as RFID tags [3],
robotic guided paths, photonic bandgap structures [4], collision avoidance, EMI
protection [5] and secure building applications [6]. An interesting use of FSS on
fabrics for wearable applications is mentioned in [7]. The first conceptual work
about “periodic surfaces” was patented by Marconi and Franklin in 1919 [8]. FSS
studies starting with Marconi and Franklin's invention have been continued by
many researchers up to now. There has been a great interest in these structures
especially since 1960's. However, the name “Frequency Selective Surface” was
patented for the first time by Yee in 1993 [9]. The definitions and discussions
about FSS phenomena are clearly declared by Munk, guru of FSS, in [1]. The first
concept which should be understood is "Periodic Surface" since it constitutes the
nature of FSS structures. A periodic surface consists of identical elements of
infinite arrays in one or two dimensions. The factors affecting the performance of
FSS structures can be listed as:
Type of elements (patches vs. slots),
Shape of elements,
Dimensions of elements,
Inter element spacing,
Array configuration (i.e. rectangular, triangular, hexagonal etc.),

3
Alignment of elements in multi-layer structures.
Moreover, the electrical properties of the substrate material also determine the
performance of FSS. Therefore, there are numerous combinations of various
parameters in order to reach an optimum solution for a specific problem.
Informative technical details about type and shape of FSS elements will be
presented in the following sections.
1.1.1. Type of Elements: Patches and Slots (Apertures)
FSS structures are constructed with any of two types of elements: metallic patches
on dielectric slabs or slots in metals. The metallic patches exhibit a capacitive
behavior and low pass filtering characteristics (see Figure 1- 1.a). If the patches and
apertures are replaced as shown in Figure 1- 1.b, the structure can be made
inductive, which results in high-pass filtering properties [10]. In order to govern
desired filtering characteristics, capacitive and inductive models can be arranged
together.
Figure 1- 1 Transmission characteristics and models of FSS with respect to
electrical properties: (a) Capacitive (b) Inductive [10]
By modification and utilization of different element types together, different
filtering characteristics like low-pass, high-pass, band-pass and band-stop, can be

4
obtained. As mentioned above, if the elements are pure capacitive, corresponding is
a low-pass filter. Reversely, if the elements are pure inductive, a high-pass
characteristics comes up. The size of patches in Figure 1- 1.a is greater than the
size of the apertures, which results a high capacitance and a negligible inductance
with respect to the capacitance. In Figure 1- 1.b, the same situation is present for
the apertures against small patches which creates an almost pure inductive medium.
These characteristics are modified by making the inter-element apertures between
the patches comparable and vice versa. In this way, FSS elements can be arranged
in order to include both capacitive and inductive properties together. If patches are
modified in this manner a band-stop filtering effect is observed. Similarly, due to
the duality principle, apertures can be utilized in order to achieve band-pass
performance.
1.1.2. Shape of Elements
Munk groups FSS elements according to their shapes in four main categories (see
Figure 1- 2), which are namely;
1. The center connected or N-poles
2. The loop types
3. Solid interior or plate types
4. Combinations
The center connected or N-poles types include single dipole, three-legged, anchor,
the Jerusalem cross and square spiral elements. Single dipole is the basic form for
the other types of elements. Simple dipoles are arrayed in two dimensionally
periodic sense which demonstrate a band-stop characteristics when illuminated.

5
Figure 1- 2 Classification of FSS elements [1]
A patent for FSS was granted in 1974 to Munk for his work about the stabilization
of FSS performance against oblique incidence [11]. Munk determined that the
spacings between the unit cell elements must be smaller than 0.4*λ so as to
preserve the FSS characteristics for different scan angles. Furthermore, in order to
provide small inter-element spacing, he claimed that the elements should be
miniaturized. The most commonly used method to miniaturize a resonance
structure is to load it either capacitively or inductively. As shown in Figure 1- 3,
the dipole elements (Figure 1- 3.a) are loaded by a shorted two wire segment
(Figure 1- 3.b) which supplies the required inductance to obtain the resonance
frequency of half wavelength dipole elements in smaller sizes. The characteristics
of the unloaded dipole elements are very sensitive to the angle of impinging waves
as seen in Figure 1- 4. When the shorted loading segment is inserted between
smaller dipole elements, the stabilization is observed to increase significantly.

6
According to Munk, the reason is the impedance of the shorted dipole elements
which is much higher compared to the mutual impedance. Thus, the effect of the
mutual impedance, which normally changes with the scan angle and modifies the
behavior, is diminished. The loaded model has narrow-band characteristics since
the impedance of the shorted dipoles varies dramatically with frequency. Therefore,
Munk suggests that kind of FSS elements for applications where wide scanning and
minimum bore-sight error are desired.
Figure 1- 3 Dipole elements a) Regular half wavelength dipoles b) Loaded dipoles
[11]
Figure 1- 4 Reflection curves of standard dipoles for different angles of incidence
[11]

7
The band reject performance of the single dipoles is poor since secondary
resonance frequencies occur in oblique incidence cases for parallel polarization.
This situation may cause transmission of undesired signal of stop-frequency for
parallel polarization cases. The unloaded tripole element improves the bandwidth
performance with respect to single dipoles. The smaller inter-element spacing is
another advantage of the unloaded tripoles. However, the second harmonic excited
by parallel polarization still occurs for these elements. The anchor elements are
constructed by tuning the tripole element with an end capacitance. The
modification results in a broader bandwidth and smaller spacing. Nevertheless, the
null due to the parallel polarization incidence cannot be terminated. The Jerusalem
cross consists of crossed dipoles loaded at the ends similar to anchor elements. The
capacitive loading decreases the fundamental resonance frequency. The second
harmonic null shifts upward in frequency. For Jerusalem cross, another null also
takes place in upper band, which is defined as "free space grating lobe" by Munk
[1]. The last member of "center connected" elements is the square spiral. The
interesting feature of the square spiral element is its dual filtering characteristics. In
other words, the element can be used as either band-pass or band-stop filter due to
the higher null position in frequency.
The second group of elements called “loop types” consists of three or four-legged,
circular, square and hexagonal loops. The invention of the four legged loaded
element by Munk in [11], aims to decrease the inter-element spacing in order to
strengthen the stability against oblique incidence and to increase the bandwidth of
operation. Since the model is symmetric in two orthogonal axes, both vertical and
horizontal polarizations are filtered equally. As a natural consequence, the same
equivalent circuit model parameters apply for both polarizations
The three-legged loaded element is modeled as a consequence of the four-legged
element. The bandwidth and stability performance is more powerful with respect to
unloaded model. The three legged loaded element has a wider broadband than the
four legged elements since the inter-element spacing is significantly smaller which
can be observed from Figure 1- 5.

8
Figure 1- 5 Array of three-legged loaded FSS elements [1]
The hexagonal loop element is better than the other members of loop family in
terms of the location of the first null which occurs at a higher frequency like the
square spiral of the first group. Solid interior FSS elements contain the circular,
triangular, square, hexagonal plates or the apertures of the corresponding shapes for
the reflecting or transmitting characteristics, respectively. According to Munk, the
main disadvantage of this group is the size of elements, which should be around λ/2
and results in a higher inter-element spacing. Thus, these elements are more
sensitive to the angle of incidence. However, the weaknesses of plate family can be
overcome with either different array models like triangular arrangement or the
dielectric loading, which will be explained later in this chapter in details.
The last group of elements is constructed combining the elements of the three
groups above. The number of possible combinations is countless. As an example,
the modification of four-legged loop element with a Jerusalem type loading can be
shown. As a consequence of the capacitive effect of loading, the element sizes and
inter-element spacing decrease. Thus, the oblique incidence performance of the
four-legged loaded element enhances. Any combination of the elements can be
applied in order to benefit the major advantages of different types.
The performance parameters for FSS structures can be listed as follows:
Bandwidth
Sensitivity to angle of incidence
Pass-band flatness
Selectivity

9
Bandwidth definition for FSS model can be made with respect to either
transmission or reflection performances. In terms of transmission properties, the
frequency points where the transmitted signal is 3dB below of maximum
transmission value can be defined as a bandwidth criterion. It is also possible to
define bandwidth of operation using reflection characteristics of FSS model. In this
case, a pre-determined value for reflected signals, i.e. -10 dB, can be regarded as
the limits for bandwidth determination. These definitions are valid for band-pass
cases. However, for band-stop FSS, duals of the definitions are applicable. For
example, 3dB below of resonance reflection of a band-reject FSS can be chosen as
bandwidth measure.
In aspects of bandwidth characteristics, FSS can be constructed for narrow or wide
band operations. Single element dipoles create a narrow-band filtering behavior.
For the applications where a wide spectrum of frequency is required, wideband
FSS structures can be employed. When the literature is studied, numerous articles
about wideband FSS can be found. For example, Zhou et. al. designed an ultra-
wideband FSS consisting of three metallic layers and two very thin dielectric layers
[12]. The upper and bottom layers of the model are rectangular patches while the
middle layer is a square grid as demonstrated in Figure 1-6.a. The prototype
fabrication of the FSS seen in Figure 1-6.b consists of an array of 67x67 unit cells.
Figure 1-6 Wideband FSS structure a) Three dimensional unit cell model
b) Prototype of fabricated FSS [12]

10
Rather than single band of operation, it is also possible to achieve dual-band
filtering responses with FSS structures. Figure 1- 7 demonstrates a dual-band reject
FSS which consists of two nested rectangular loops placed on the same surface.
The model can be further modified such that a band-pass filtering occurs between
two nulls of rejection frequencies.
Figure 1- 7 Double square loop FSS model [13]
Another dual-band FSS model described by Yee in [9] consists of three metal layers
and two dielectric layers between them. The outer metallic sheets have arrays of
apertures while the inner sheet has patches. Yee also suggests the implementation of
both low and high frequency FSS arrays on the same metallic sheet as in Figure 1-8.
With this configuration, a dual-band frequency selective surface is obtained. When
the crossed dipole elements are used, FSS rejects the signals of two predetermined
frequencies. If the elements are crossed apertures, FSS transmits the impinging
waves of two different wavelengths. The sheets are kept apart from each other using
the dielectric substrates.
Figure 1-8 Dual-band FSS model [9]

11
An extension to dual-band FSS could be the concept of "multi-band filtering". The
multi-band pass or reject FSS can be designed by applying the different sized
elements together or fractal elements. As an example of the recent work about this
concept, a tri-band stop FSS developed by Kim and Choi can be shown [14]. In this
model, three distinct resonance frequencies are created using the ternary tree shaped
loop loaded with a tripole element (see Figure 1-9). Two of the resonance
frequencies originate from the loop and the other one from the tripole placed inside
the loop.
Figure 1-9 Tri-band FSS model [14]
As the design and fabrication technologies improved, new types and applications of
FSS structures have arised enormously. Another interesting implementation for FSS
structures is the introduction of the fractal elements for multiband operations [15].
Fractal elements have unique properties like small element size due to the confined
geometry which creates a long curve in a low space [16]. Thus, the spacings
between the fractal elements become closer than the non-fractal ones. The major
point about the fractal elements is the self-similarity property which provides
multiband behavior [17]. Self-similarity is the replication of the major element at a
different scale with iterations (see Figure 1-10). The multiband frequencies change
with respect to the replication scale.

12
Figure 1-10 Iterations of the Sierpinski FSS [17]
Sensitivity to angle of incidence, top flatness and selectivity properties of FSS
structures are directly related with the constructional aspects. Instead of single
metal sheet, FSS structures can consist of double metallic layers with dielectric
substrates between the FSS layers or superstrates on them, which results "hybrid"
structures. The main targets for such modifications to FSS structures are to create a
flat-top pass-band and to increase the selectivity with a fast roll-off. First of all,
using two cascaded FSS layers as shown in Figure 1- 11 enhances the
aforementioned properties (see Figure 1- 12). However, the structure is still weak
for the illuminations at different angles of incidences.
Figure 1- 11 Crossed dipole aperture FSS model: a) Single layer b) Double layer
13
Figure 1- 12 Comparison of transmission performances of single and double layer
crossed dipole aperture FSS
Another adaptation is to place dielectric layers of equal thickness and dielectric
coefficient on both sides of metallic FSS layer as demonstrated in Figure 1- 13. The
single FSS with dielectric layers favors in broadening the bandwidth with respect
to the case without dielectric layers. Nevertheless, the model suffers from the rough
in-band characteristics. In other words, the flatness cannot be provided with this
modification. As observed from Figure 1- 14, the resonance frequency of single
FSS layer moves down towards
from f0.
Figure 1- 13 Single crossed dipole aperture FSS with dielectric slabs
10 11 12 13 14 15 16 17 18 19 20-30
-25
-20
-15
-10
-5
0
Frequency(GHz)
Tra
nsm
issio
n(d
B)
Single FSS
Double FSS
Outer dielectric
substrates
Single metallic
FSS layer
14
Figure 1- 14 Transmission responses of single FSS layer with and without
dielectric slabs
In order to overcome both flatness and selectivity problems with a stable oblique
incidence performance, "hybrid" FSS structures can be utilized. According to
Munk, a real hybrid FSS consists of two outer dielectric layers, two cascaded
metallic FSS sheets and a dielectric slab between them [1]. The outer dielectric
layers have the same thickness and dielectric constant and serve for constant
bandwidth performance against oblique incidence and polarizations. The middle
dielectric layer determines the flatness of transmission curve in the pass band. FSS
sheets are responsible for the bandwidth and resonance frequency. The invention
patented by Munk called “Space Filter”, a sandwich type FSS consisting of slot
metal sheets and dielectric layers, was patented in 1978 [18]. With this invention,
Munk claimed that the bandwidth of the FSS remains constant over a wide range of
angle of incidence. The new structure includes the cascaded dielectric and metal
layers with different thicknesses and models respectively. It is possible to construct
a band-pass or band-stop space filter using the corresponding elements, i.e., slots or
patches. The drawing in Figure 1-15 exhibits the multilayer hybrid FSS model. The
10 11 12 13 14 15 16 17 18 19 20-20
-18
-16
-14
-12
-10
-8
-6
-4
-2
0
Frequency(GHz)
Tra
nsm
issio
n(d
B)
Single FSS Layer
Single FSS with Dielectric Slabs

15
outermost dielectric layers are used to provide the necessary conductance yielding
to constant bandwidth for varying angles of incidence. The intermediate dielectric
layer ensures the coupling between the periodic arrays. The total thickness of the
FSS is around an odd multiple of one quarter wavelength.
Figure 1-15 The schematic of a multilayer “Space Filter” [18]
Hybrid configuration of crossed dipole aperture FSS is constructed as described
above (Figure 1- 16). The transmission response of the hybrid FSS model is
observed to be enhanced in terms of band-pass flatness and bandwidth with respect
to single metallic layer of crossed dipole aperture FSS (Figure 1- 17). Hybrid
model is also more powerful against oblique incidence cases when compared to
single layer FSS.
Figure 1- 16 Hybrid FSS configuration of crossed dipole aperture element
Outer dielectric
substrates
Double FSS
layer
Inner dielectric
substrate

16
Figure 1- 17 Transmission responses of single layer and hybrid crossed dipole
aperture FSS
So far, the characteristics of planar FSS are discussed, however; for some
applications like nose radomes on the aircrafts, the nose radome applications on the
aircrafts, the angle of incidence of the incoming wave can reach to very high values
due to the shape of the radome. Therefore, conformal FSS structures are required in
order to decrease the RCS of curved structures successively, while creating no
significant effect on the performance of the antenna. Implementation of FSS on
curved radomes decreases the out-of-band target RCS of the antenna effectively
since the incoming signal is scattered to other directions, not reflected back. Other
major application of conformal FSS is the dual band reflector antenna systems. In
the dual band reflector systems, a conformal FSS can be designed as a sub-
reflector, which reflects the signals of one of the operation frequencies to main
reflector and transmits the other (see Figure 1- 18).
10 11 12 13 14 15 16 17 18 19 20-30
-25
-20
-15
-10
-5
0
Frequency(GHz)
Tra
nsm
issio
n(d
B)
Single FSS
Hybrid FSS

17
Figure 1- 18 Utilization of conformal FSS in a dual band reflector system [19]
In [20], a multi-layer array approach using open-ended waveguide antenna array
combined with FSS structures conformed on a cylindrical surface is presented. A
novel fabrication approach for conformal FSS structures on doubly curved bodies
is explained in [21]. In this work, cross loop FSS model is implemented on a
paraboloid surface with rapid 3D prototyping. Design of a conformal FSS as a sub-
reflector in a satellite is studied in [22].
Since the shape of the application surface is limited to one or doubly curved bodies,
FSS structures are necessarily to be designed as conformal to implementation
surfaces. The researchers have thoroughly studied about FSS problems from 1960's
up to date. With the aid of new advanced CPUs, the analysis and design durations
have dramatically decreased. Different FSS structures are discovered as the
fabrication and analysis techniques are improved. However, still, there are
challenging topics about FSS to be intensively investigated and improved. One of
these challenging issues, which is also the main concentration of this thesis, is the
application of FSS structures to conformal bodies. The conformal application
brings extra difficulties different from the classical planar problems. In planar
problems, the main assumption in the analytical solutions, periodicity in two
dimensions, is almost preserved. The effect of the elements at the end of the arrays
can be neglected for large arrays of FSS. However, in curved FSS, the periodicity
cannot be kept in two dimensions. On singly curved bodies like cylinders, only the
periodicity in longitudinal dimension is conserved. Thus, after a planar unit cell

18
solution, one has to prove the design with a curved structure analysis. There are
some extra difficulties in designing conformal FSS. For example, the stable
performance against angle of incidence is a must for conformal implementations
since the incident wave can impinge on the surface of a curved FSS structure at
very large angles. Thus, FSS model has to maintain its characteristics under these
conditions. The orientation and registration of the elements on a curved surface
also play a key role in the performance of FSS. The development of a complete
methodology for the design and efficient determination of the performances of
conformal FSS structures is the main target of the thesis.
In this thesis, the design and analysis methods of the FSS structures for the
conformal bodies are explored. Starting from the planar unit cell models with
different requirements, semi-finite curved FSS models are constructed and
analyzed using HFSS® of ANSYS [23].
The fabrication and measurements of the FSS structures for planar structures are
realized in order to prove the designs and complete the study.
1.2 Organization of the Thesis
In Chapter 2, overview on FSS analysis methods is demonstrated. Different
solution approaches are investigated stating the advantages and disadvantages of
each method with respect others. The analysis methods utilized in this thesis to
obtain FSS characteristics are also explained starting from planar solutions to
conformal ones step by step.
The design and analysis of a FSS with coupled aperture disk elements are
implemented in Chapter 3. FSS parameters are determined using unit cell model.
The oblique incidence performance is also tested with that unit cell solution in
HFSS. A semi-finite model is constructed which provides both to observe the
effects of finite arraying and take advantage of unit cell solutions for a fast
analysis. Planar and curved FSS models are constructed using semi-finite analysis

19
method. The constructed curved model is finite in the curved direction of the
cylinder while it is infinite in the longitudinal direction, which is so called "semi-
finite". Filtering performance of FSS model is also verified with a finite doubly
curved model in HFSS®.
In the 4th
chapter, the design of a wide-band conformal FSS is introduced. The
design process and verification of performance using the semi-finite model
approach of Chapter 3 are also implemented for wide band FSS model.
The fabrication and measurements of planar prototypes of coupled hybrid FSS are
presented in Chapter 5. The construction of the setups for the appropriate
measurements is detailed. The results of simulations and measurements are
compared and possible reasons of discrepancies are discussed. New fabrication
approaches are also presented at the end of this chapter.
In the last chapter of the thesis, the conclusion remarks about this work are given
with the possible future studies about conformal FSS structures, which can move
the knowledge and abilities one more step away.

20

21
CHAPTER 2
ANALYSIS METHODS FOR FSS STRUCTURES
2.1 Overview of Analysis Methods
In order to efficiently analyze various FSS problems, different solution methods
may be applicable. The analysis methods used to design and improve the
performance of the FSS structures can be detailed as follows. The pioneers of the
FSS design were first applied the mode matching technique, which was normally
used for waveguides, to solve the FSS problems. After mode matching analysis, the
equivalent circuit approach is adopted to FSS structures from a perspective of
transmission lines. Due to the incapabilities of both techniques to handle the
problems for the types different from the standard models like rectangular patches
and apertures, more accurate numerical methods, such as method of moments, finite
element and finite difference methods, are developed.
To start with the mode matching technique, it is applied by calculating the
waveguide modes at the discontinuities on a basis of entire domain [24]. The
procedure includes equating the expansions of fields to the boundary conditions of
the discontinuity region [25]. When the scattered fields are desired to be calculated
from periodic structures, the expansion into Floquet modes is required. In mode
matching technique, the appropriate basis and test functions are used to find the
unknowns of the problem, i.e., amplitudes of the fields. The transmission and
reflection parameters are directly gathered in terms of field amplitudes into the S-
matrix of the layer. The multiple layer problems are also possible to be handled with
mode matching technique in a manner of cascaded networks. In [26], the numerical

22
analysis of an arbitrarily shaped FSS with a combination of mode matching and S-
matrix methods is revealed.
Another method derived for FSS analysis is the circuit equivalent method which
was firstly applied by Anderson [27]. To him, the method is best fitted for the
periodic, free standing, thin and perfectly conducting metal structures where the
dimensions are smaller than the wavelength of the impinging wave. The impedance
between the strips is described as inductive if the polarization of the wave is
parallel with respect to strip alignment. Shunt capacitive elements exist if the
polarization is perpendicular. The oblique incidence cases for the equivalent
circuits of gridded square and double square FSS are analyzed up to 45o referenced
to the normal [28]. The method is repeated with a novel attitude for the ring patch
FSS in [29]. The equivalent network parameters for ring elements under oblique
incidence are determined and the transmission characteristics of the analysis and
measurements are compared. Some differences between the results are observed by
the authors. They attribute the disagreement mainly to the test environment and the
weak accuracy of the circuit equivalent method than other full wave numerical
solutions. If the FSS model is easy to model by lumped elements, the equivalent
circuit approach can be employed to solve such kind of problems. When the FSS
model gets complicated, i.e. hybridized, multilayer or conformal designs , the
circuit equivalent method becomes inaccurate when compared to full wave
solutions. The main drawbacks of circuit equivalent method can be listed as
follows:
The cross-polarization effects are ignored, i.e., the equivalent circuit
parameters are valid for only co-pol illumination.
Method is incapable to handle FSS problems with large angle incidence.
The coupling between the adjacent FSS elements is not consulted.
Analytical solutions of FSS parameters exist for a limited number of
element types.

23
Hence, the circuit equivalent method is not adequate to solve all FSS problems.
However, if one will work with a well-known FSS model like rectangular loop or
the Jerusalem cross, whose parameters are defined analytically, circuit equivalent
approach can be a good starting point to observe the effects of any parameter
quickly.
Method of Moments (MoM) can be utilized for the solution of the operator
equations of the induced currents or fields defined on an illuminated surface [30].
The characteristics of the FSS structures, i.e., transmission and reflection properties,
can be extracted from these solutions [31]. The convergence of the solutions is
mainly determined by the basis and test functions. MoM application for FSS brings
some difficulties when the medium is multi-layered or a thickness is defined for
metal surfaces since it becomes more difficult to handle the Green’s functions for
3-D structures [25].
Finite Element Method (FEM) is normally applied for bounded domain structures.
The unbounded nature of FSS problems require some specific boundary conditions
which eliminate the reflected fields while absorbing the incident and scattered fields
appropriately. FEM is easily adapted to complex geometries and anisotropic media
[32]. However, the solutions of the FEM equations require a high calculation
capacity which is achieved by the high performance work stations.
Finite Difference Time Domain (FDTD) method is implemented in order to obtain
broadband responses since a wide band analysis can be gathered in a single
simulation. The detailed analysis of FSS with FDTD method is investigated in [33].
An important advantage of FDTD method is that there is no need for any matrix
conversion to solve the problems which makes it easier when compared to other
methods. However, in FDTD, the data load can be very excessive since storage at
any time instant is required.
The general approach to begin an FSS design is the "unit cell" solution. Due to the
periodic nature of FSS structures, infinite array approximations are applicable. Unit
cell method employs the periodic solution of an FSS model. Unit cell implies for

24
one period of the FSS. In Figure 2- 1 unit cell sample is demonstrated. In the same
figure, full array view is also given.
Using the unit cell model, the performance of an FSS structure under the infinite
array conditions can be determined with the help of an electromagnetic simulation
software like HFSS®, CST
®, etc. [34]. In unit cell analysis, it is possible to create
phase difference between the periodic boundaries, which corresponds to the
oblique incidence case. The performance of a curved FSS structure has to remain
stable under varying angles of incidence. Hence, this feature is required to be tested
with the unit cell analysis at first.
Figure 2- 1 Unit cell (on the left) and finite planar array (on the right) of a disk FSS
Concerning the conformal structures, the FSS array cannot be preserved in linear
arrangement. Different array sequencings with respect to various surface
topographies like triangular, hexagonal and parallel as shown in Figure 2- 2 are
constructed to observe the effects of the corresponding arrangements. For example,
the arrangement on a sphere surface can be performed in hexagonal or pentagonal
arrays as illustrated in Figure 2- 3.

25
Figure 2- 2 Various unit cell arrangements: (a) Triangular (b) Hexagonal (c)
Parallelogram
Figure 2- 3 Arrangements of FSS elements on spherical surface: (a) Hexagonal (b)
Pentagonal [19]
Hexagonal or pentagonal arrangements of FSS elements on doubly curved
structures like spheres cannot provide a full periodicity as in planar cases. The
inter-element spacings differ as the elements get away from the poles. Therefore,
alternative arrangements on these bodies can be examined in order to maintain the
periodic behavior of FSS elements as much as possible. For example, the surface of
a doubly curved structure can be coated with the sequences of the FSS elements as
demonstrated in Figure 2- 4. Sphere surface can be divided by circles of different
radii which are one period apart away from each other. Thus, period between
successive FSS sequences on these circles is maintained. On each circle, FSS
elements can also be placed periodically. Since the elements are at equal distance
from each other on circles with different radii, FSS elements are located as shifted
with respect to neighboring sequences. With this configuration, period between

26
FSS sequences and elements of each sequence can be preserved. However, this
method is not applicable for coating full sphere surface perfectly. It is convenient to
cover a half sphere which is generally sufficient in aspects of practical applications
of FSS radomes.
Figure 2- 4 Illustration of element arrangement on sphere with shifted unit cell
approach: a) Single sequence placement b) Multiplication of elements on single
sequence c) Covered quarter sphere d) Full sphere view
p p p p
p p p p
p p p p

27
The performance of the related FSS model for such an arrangement can be easily
observed with the unit cell solutions. The unit cell models for a sample FSS for this
approach is presented in Figure 2- 5. As seen in the figure, different unit cells are
designed to determine the corresponding filtering characteristics. Provided that all
the unit cell models exhibit filtering performances similar to single element unit
cell, this approach is applicable.
Figure 2- 5 Different unit cell arrangements for the determination of the shifted unit
cell performance
The unit cell analysis in FEM based HFSS starts with constructing one period of
FSS model. Once the model is created then a vacuum box is built covering the
edges of the unit cell model. Then, the boundary conditions are arranged. In Figure
2- 6, assignment of periodic boundary conditions, which are called "master" and
"slave" in HFSS terminology, are represented. These boundaries ensure the
construction of an infinite array either in one or two dimensions. In Figure 2- 6, the
periodicity is in two dimensions. By defining phase differences between the
master-slave pairs, the oblique incidence performances of FSS structures are
determined.

28
Figure 2- 6 Assignment of "Master" and "Slave" boundary conditions on the walls
of vacuum box
The excitation of the unit cell model is accomplished by the Floquet ports as
illustrated in Figure 2- 7. Other than the periodic side walls of the unit cell model,
at least one open boundary condition which stands for the boundary to infinite
space is required. To provide this open boundary condition, Floquet ports are used
in HFSS. These ports create Floquet modes, which are plane waves propagating in
the direction defined by the frequency, phase difference between the side walls and
the model of unit cell. With this configuration, Floquet modes exhibit waveguide
mode behaviors, i.e. they have propagation constants and cut-off frequencies. FSS
unit cell structures have two Floquet ports since both the transmission and
reflection properties of the FSS are performance criteria.
Master Boundaries
Slave Boundaries

29
Figure 2- 7 Floquet port assignments for a unit cell FSS model in HFSS
In FSS analysis, the first fundamental modes for TE and TM waves are examined.
The other modes are necessarily to be diminished. Thus, the Floquet ports are set
apart from each other at a sufficiently long distance where the other evanescent
modes disappear until reaching the FSS. In HFSS, there is an option called "Modes
Calculator" which shows the attenuation of the higher order modes at unit length
(see Figure 2- 8). Using this feature, the length of the vacuum box is arranged in
order to provide at least 40-50 dB suppression of the evanescent modes. However,
the distance between the unit cell surface and the ports creates a shift in the phase
terms of S-parameters. This shift in phase terms can be eliminated by applying the
"de-embedding" feature of HFSS. By de-embedding the Floquet ports onto the
surface of FSS structure, the exact S-parameters belonging to the analyzed structure
are gathered (see Figure 2- 8) .
Once the construction of FSS unit cell is completed, the simulation can be
performed after defining the solution setup in HFSS, i.e., frequency range, solution
frequency where the meshes are created and the convergence rate of S-parameters.
There is an important point for solution frequency that a designer must be careful.
Generally, for the analysis of finite structures, the solution frequency is taken as the
Floquet Port 1
Floquet Port 2

30
Figure 2- 8 Modes Calculator (on the left) and de-embedding (on the right)
properties of HFSS Floquet port setup
upper limit of the interested frequency sweep in order to provide sufficiently small
meshes compared to the minimum wavelength of frequency sweep points.
However, in resonant structures, the initial solution point must be chosen as the
resonance frequency because the most complex mesh arrangement is required for
the resonance point. To ensure the resonance frequency of the structure, an iterative
way is followed until the solution and observed resonance frequency become equal.
With the unit cell analysis, the parameters of the FSS model are optimized very fast
and efficiently, i.e., the solution does not create a high calculation load. Moreover,
as a scope of this thesis, the oblique incidence performance of the unit cell can be
observed easily. Furthermore, the parameter optimization can be continued in the
perspective of targeted oblique illumination behavior of the FSS model.
After the parameters of a unit cell that satisfies the design requirements are
obtained, the performance of the design needs to be evaluated with a finite model.
The infinite periodic array solution of unit cell analysis gives an idea to the
designer about the characteristics of the model, however; the results closest to the
De-embed
length

31
fabricated design measurements can be achieved by only finite analysis of the exact
structure. The effects of the edge elements can be observed with the simulation of
finite models and may create significant difference with the results of the unit cell
analysis. The solution for the finite model would create a huge computational load.
Therefore, it is sometimes unfeasible to construct and solve the finite model. In
such cases, the semi-finite solution can be chosen as the final step of the design
process. If the model has symmetry properties, it helps to reduce the size of the
problem. Then, a finite conformal solution may be applicable. In HFSS, the exact
model can be simulated by using only a half or quarter of the whole structure if the
body is symmetric in one or two orthogonal planes with respect to the center,
accordingly. The symmetry boundary conditions are assigned on the related walls.
The assignment is employed according to the direction of E-field vector of the
source. The wall whose plane is normal to E-field vector is selected as PEC
boundary. Similarly, the wall with parallel plane is assigned as PMC boundary. A
sample finite model and its symmetry boundaries are presented in Figure 2- 9.
Figure 2- 9 Quarter FSS model: (a) The arrangement of FSS elements (b)
Symmetry boundaries
Another alternative technique to lessen the heavy calculation load created by finite
simulations can be the "semi-finite analysis" approaches. In semi-finite models, a
unit cell is constructed which is finite in one dimension and infinite in other
dimension. A couple of master-slave boundary condition is required since the
structure is periodic in one dimension only. The finite dimension is modeled with
PMC
PEC
E-field
direction

32
respect to the design requirements. For example, for a planar or singly curved
cylinder FSS model, one can construct a semi-finite solution setup, i.e., periodic in
one of the principle dimensions and finite in the transverse plane as shown in
Figure 2- 10 and Figure 2- 11. With this model, both the effects of finite elements
are observed and the simulation load is reduced dramatically with respect to the
solution of a finite model. The application of semi-finite analysis is accomplished
in the following chapters for both planar and curved FSS structures.
Figure 2- 10 Planar semi-finite FSS model unit cell
Figure 2- 11 Curved semi-finite FSS model unit cell

33
The construction of unit cell for the semi-finite analysis is a little different from the
classical two dimensional, single element FSS unit cell. The semi-finite unit cell
model consists of a single slice in the periodic direction. The construction steps of
the semi-finite unit cell can be explained as follows. First of all, FSS model is built
up in HFSS. Afterwards, a vacuum box covering the FSS model and standing
tangent to FSS walls in periodic direction is created. The non-periodic faces of the
vacuum box are chosen to assign Perfectly Matched Layers (PML) which provide
open boundary conditions, i.e., they do not reflect the incoming signals (see Figure
2- 12). The PML setup user interface automatically constructs the PML objects
consisting of bi-axial anisotropic materials. In HFSS, another open boundary
condition for radiation problems exists, which is named "Radiation Boundary".
However, PMLs are advanced boundary conditions and give more accurate results
especially for radiation problems when compared to the radiation boundaries.
Hence, PMLs are more useful for the analysis of semi-finite unit cell FSS model.
Figure 2- 12 Faces used for PML boundary identification on the curved semi-finite
model
The periodicity of the semi-finite model is provided using a single master-slave
boundary pair which implies one dimensional periodicity of the model in the
longitudinal dimension. The critical point defining the master-slave pair for this
model is that master and slave boundaries are required to cover the PMLs since
they are also necessarily infinite in the periodic dimension. Therefore, two sheets

34
covering the corners of the outer PML boxes are created and defined as master-
slave pair. On the center line of the semi-cylinder, a linear array of 31 Hertzian
dipoles is used in order to illuminate the FSS radome with a Taylor distribution of
20 dB side lobe level (SLL). FSS characteristics are gathered from the knowledge
of the far field datum for different frequencies. The total and incident electrical
fields in the far zone are compared in terms of peak and SLLs for different
frequencies. The incident electrical field data stands for the case that FSS radome
does not exist.
2.2 Design Approaches for Curved FSS Structures
The conformal FSS design requires extra points to consider when compared to
planar FSS applications. The model of FSS structure is critical since the good
conformability properties are needed. The circular elements are generally preferred
by the designers due to good conforming properties. The singly curved structures
are easier compared to the doubly ones since the periodic properties can still be
maintained on a singly curved body. However, for the doubly curved cases, the
periodic nature of the FSS array is very difficult to be preserved. For example, on
the surface of a sphere, it is impossible to arrange the FSS elements in a two
dimensionally periodic sense. Thus, different approaches should be introduced to
realize the FSS performance on a doubly curved structure. One of the approaches is
to use an FSS model which is insensitive to shifts in the alignment of elements in
multilayered structures. In the single element planar unit cell design period, the
performance of the FSS model can be tested in aspects of the predefined properties.
Furthermore, a different periodicity approach can be implemented which preserves
the period between the inter-elements in one dimension and the subsequent
sequences of FSS elements in the orthogonal dimension. Another method for the
doubly curved structures can be to optimize the performance of the total structure
by arranging the positions of the elements using the finite model analysis. This

35
method would give the most reliable results, however; it is inefficient and time-
consuming compared to other approaches.
2.3 Design Methodology for Conformal Frequency Selective Surfaces
The design procedure for the conformal FSS applications starts with the
determination of the unit cell model definitions as in the planar cases. The required
characteristics like band pass/band stop filtering, levels of insertion loss or
reflection coefficients, oblique incidence performance etc., are specified. Then, the
starting points for the unit cell parameters are determined either by using circuit
equivalent approach if applicable or through simulation based fast search or by
scaling the known model parameters for a specific application. The starting point
determination brings the designer to a feasible solution region instead of searching
the final optimum sizes in the whole space. Generally, the optimum design
parameters will be within the close neighborhood of these starting values. The next
step is to analyze the FSS unit cell. The design is first verified for the normal
incidence case with 2D infinite planar array model. Using the unit cell model
shown in Figure 2- 13, FSS performance for the oblique incidence cases can also
be observed and fine tuning of unit cell parameters to satisfy the design goals for
oblique incidences is pursued. Oblique incidence conditions are created by
applying phase differences to the periodic boundaries of the unit cell as described
in this chapter.

36
Figure 2- 13 Coupled-aperture disk hybrid FSS unit cell model
The array topology is very important for the conformal FSS applications. The
placement of the elements on a doubly curved structure is not straightforward as for
the planar or singly curved applications. When the surface is planar or singly
curved, i.e. cylindrical surfaces, the periodicity between the FSS elements can be
preserved in two dimensions. However, if the surface is doubly curved, i.e.
spherical surfaces, the simple periodicity techniques are not applicable since it is
impossible to maintain the periodicity in two dimensions on these surfaces. Instead,
alternative techniques for the arrangement of the FSS elements are required as
mentioned before in this chapter of the thesis. Therefore, the designer is strongly
suggested to determine the final array parameters like inter-element spacing and
array configuration. These modifications will benefit in the realization of the
eventual FSS radome structure. FSS parameters can also be optimized for the new
array topologies.
Verifying FSS performance using the curved models is essential since the real
application surface will not be planar. The unit cell analysis of the single element is
utilized for planar and infinite conditions, which does not fit the real operation
conditions. The interaction between the conformal elements may be different from
the planar arrays. Furthermore, the edge diffractions can be taken into account with
only a finite conformal analysis. Therefore, the analysis of the FSS model with

37
singly or doubly curved models is required in order to observe the filtering
characteristics of curved FSS elements. However, the finite models usually create a
Figure 2- 14 Flowchart representation of conformal FSS design procedure
heavy calculation load which cannot be solved by even high performance work
stations. To overcome this problem, a semi-finite solution is suggested in this study
as mentioned in this chapter. With this solution, the edge diffractions and the
performance of curved elements can be observed in the finite dimension. On the
Unit Cell Definitions
•Define FSS characteristics ( Band pass/stop, Insertion loss, Oblique incidence performance)
•Determine the starting points for unit cell parameters (Circuit equivalent approach, simulation based search)
FSS Unit Cell Analysis
•Design for normal incidence
•Optimization of unit cell parameters
•Verification for oblique incidence cases
Array Design
•Array configuration
•Array verification
•Optimization
Conformal Structure Analysis
•Optimization of singly and/or doubly curved structures with finite/semi-finite structure analysis
End of first stage design
period
•Finalization of design procedure before fabrication
•Check for the realizability of the final structure

38
other hand, the periodicity in the longitudinal dimension makes the problem
convenient to analyze by reducing the calculation load.
When the finite or semi-finite curved FSS analysis is completed, the design
procedure before fabrication is finalized. Nonetheless, the designer needs to check
the final version of the FSS structure in aspects of realizability for fabrication
process. The design procedure for the conformal FSS applications is also
summarized with a flowchart in Figure 2- 14.

39
CHAPTER 3
DESIGN AND ANALYSIS OF A HYBRID CONFORMAL
FREQUENCY SELECTIVE SURFACE
3.1 Design Requirements
The design requirements for the conformal application of FSS structures are more
challenging with respect to planar applications. In this section, the design
requirements of the FSS structure to be designed are explained. To start with the
filtering behavior, FSS structure will necessarily work as a band-pass filter in Ku-
band (12.4-18 GHz), which lets the transmission of the signals of the illuminating
radar antenna inside the radome while reflecting the other signals of different
frequencies. As another design criterion, it is required that FSS will exhibit a
narrow band performance with a fast roll off in the transmission curve starting from
the ends of the pass band region. The partial bandwidth of the design is 2.4%
around the center frequency, f0. It is also required that FSS will have low insertion
loss in the pass-band while maintaining its performance for the oblique incidence
cases. Moreover, FSS is required to be circularly polarized. The polarization
requirement is determined with respect to the antenna, which will be covered by the
FSS radome. The major design goals of the FSS design can also be listed as;
High selectivity (Sharp roll-off at the edges of the boundary frequencies)
Low insertion loss in the pass-band
Narrow bandwidth
Stable performance against oblique incidence
Polarization independence

40
Applicability on curved bodies
3.2 Hybrid Conformal Frequency Selective Surface Design
In order to satisfy the design requirements, a number of alternative FSS models
have been examined. The typical FSS models like loaded square slot, dipole, ring
elements are studied in aspects of their capabilities for the design goals. It is
observed that, in general, for the doubly curved applications, disk elements are
preferred due to their good conformability properties. The indispensable needs for
conformability and dual polarization make the circular elements good candidates
for this specific FSS design. In Figure 3- 1, some types of the circular FSS
elements are shown.
Figure 3- 1 Circular FSS element models
In order to enhance the selectivity and pass-band flatness properties of the FSS
elements, the number of layers used in the design is required to be increased, which
will yield the designer to the hybrid FSS structures mentioned in Chapter 1. Hybrid
FSSs are also superior against oblique incidence of impinging waves than the
single or double layer structures. Another critical goal is the narrowband operation
of FSS. To provide a narrowband filtering performance, one can make use of the
coupling between the FSS layers. The application of the idea for narrow band FSS
structures is first introduced by Pous and Pozar with rectangular aperture coupled
elements [35]. They represented a narrowband band-pass FSS, which is also highly
selective, using the coupling between the patches. The model consists of three
metallic FSS layers. The outer layers are patches and the layer in the middle is a
rectangular slot which is responsible for the coupling between the patches. There

41
are two dielectric slabs between the patches and aperture. The top and cross-
sectional views of the FSS geometry Pous and Pozar used in their design are
presented in Figure 3- 2.
Figure 3- 2 Top (a) and cross-sectional (b) views of the rectangular aperture
coupled FSS [35]
According to Pous and Pozar, the resonance frequency is mainly determined by the
patch sizes, however; the width of the aperture is also crucial since it provides the
coupling between the patches resulting a full transmission performance in the pass-
band. If the aperture becomes very large, the level of coupling increases. When it
exceeds the critical value for maximum transmission, a second resonance occurs at
another frequency lower than the main resonance point. As the aperture size is
increased, that second resonance moves down in frequency. The bandwidth of the
structure can be controlled by the thickness and electrical properties of the substrate

42
material. When the thickness of the slabs is increased, the bandwidth of FSS
expands. The same effect can also be created by using a material with a lower
dielectric coefficient. Nevertheless, as the bandwidth is increased, the coupling
level reduces which can result an undesired FSS performance.
The application of aperture coupled FSS structures using circular elements is first
investigated by Hang Zhou et al. in [36]. They designed and fabricated a filter-
antenna consisting of a conical frequency selective surface radome and a monopole
antenna. The FSS model they proposed is composed of three metallic layers, two
outer patches and one coupling aperture between the other layers. The metallic
layers are separated from each other with two dielectric slabs as shown in Figure 3-
3.
Figure 3- 3 Layers of the hybrid FSS model
They first constructed the unit cell and optimized the FSS parameters using
HFSS®. After observing the unit cell model to be satisfactory in different aspects
like center frequency, bandwidth and oblique incidence performances, they
modeled a finite structure, a conical FSS radome with a monopole antenna (filter-
antenna), to check the FSS performance under these conditions. In the finite
solution, they used the symmetry property of the model and solved the problem
with the quarter of the actual model as shown in Figure 3- 4. Finally, they
completed their work fabricating the conical FSS and measuring its performance.
The results of the measurements are observed to be consistent with the simulations.
FSS radome does not significantly affect the radiation pattern of the monopole

43
antenna in pass-band frequencies while decreasing the RCS of the system for the
out-of-band frequencies.
Figure 3- 4 A quarter of the filter-antenna model simulated with HFSS [36]
In this study, the aperture coupled circular hybrid FSS model of Hang Zhou et al. in
[36] is utilized for a doubly-curved FSS radome design. The original model they
proposed operates around 6 GHz with a bandwidth of 0.26 GHz (5.90-6.17 GHz).
The parameters of the coupled aperture circular disk FSS model are scaled for the
Ku-band operation. Scaling shifts the pass-band of FSS, however; there exist many
discrepancies in the filtering characteristics since all the parameters have distinct
effects. Therefore, the parameters are required to be optimized until the new design
goals are fully met.
In order to observe the effects of different FSS parameters to the filtering
characteristics, sweep analyses for each of them are performed using the single
element unit cell model in HFSS®. The sweep parameters are namely, outer disk
radius (r1), circular aperture radius (r0), dielectric thickness (h) and period (p) of
the unit cell FSS element as shown in Figure 3- 5.

44
Figure 3- 5 Sweep parameters of the FSS unit cell; (a) Top view (b) Side view (c)
Circular aperture metallic layer
The transmission characteristics for different FSS parameters are presented
between Figure 3- 6 and Figure 3- 9. The design parameters shown in figures are
given as normalized to their individual optimum values.
Figure 3- 6 Transmission responses of the hybrid FSS for disk radius parameter
(r1) sweep
0.94 0.96 0.98 1 1.02 1.04 1.06-25
-20
-15
-10
-5
0
Frequency normalized to center frequency
Tra
nsm
issio
n(d
B)
r1norm
=0.988
r1norm
=0.991
r1norm
=0.994
r1norm
=0.997
r1norm
=1
r1norm
=1.003
r1norm
=1.006
r1norm
=1.009
r1norm
=1.012

45
Figure 3- 7 Transmission responses of the hybrid FSS for circular aperture radius
parameter (r0) sweep
Figure 3- 8 Transmission responses of the hybrid FSS for dielectric slab thickness
parameter (h) sweep
0.94 0.96 0.98 1 1.02 1.04 1.06 1.08-20
-18
-16
-14
-12
-10
-8
-6
-4
-2
0
Frequency normalized to center frequency
Tra
nsm
issio
n(d
B)
r0norm
=0.818
r0norm
=0.909
r0norm
=0.964
r0norm
=1
r0norm
=1.091
r0norm
=1.182
0.94 0.96 0.98 1 1.02 1.04 1.06 1.08-25
-20
-15
-10
-5
0
Frequency normalized to center frequency
Tra
nsm
issio
n(d
B)
hnorm
=0.357
hnorm
=0.714
hnorm
=1
hnorm
=1.071
hnorm
=1.429
hnorm
=1.786

46
Figure 3- 9 Transmission responses of the hybrid FSS for period parameter (p)
sweep
The results of the parameter sweep analyses are also summarized in Table 3- 1 to
Table 3- 4 with the normalized parameter sizes, center frequencies, 3 dB
frequencies and resultant fractional 3dB bandwidth values. The parameter
normalizations are done with respect to the optimum values while normalization
for the frequency is accomplished scaling to target center frequency of the design
(f0). As observed from Table 3- 1 and Figure 3- 6, increasing the radius of the outer
disks moves the center frequency down and does not considerably affect the
bandwidth of FSS.
0.94 0.96 0.98 1 1.02 1.04 1.06 1.08-25
-20
-15
-10
-5
0
Frequency normalized to center frequency
Tra
nsm
issio
n(d
B)
pnorm
=0.922
pnorm
=0.936
pnorm
=0.950
pnorm
=0.964
pnorm
=0.978
pnorm
=0.992
pnorm
=1
pnorm
=1.006
pnorm
=1.020
pnorm
=1.034
pnorm
=1.047

47
Table 3- 1 Parameter sweep results for disk radius (r1)
r1 (Normalized)
Center Freq (Normalized)
3dB points (Normalized)
Fractional 3dB BW
(%)
0,973 1,030 1,003 1,057 5,202
0,982 1,018 0,994 1,048 5,263
0,985 1,018 0,991 1,045 5,263
0,988 1,012 0,988 1,042 5,294
0,991 1,009 0,985 1,036 5,015
0,994 1,006 0,982 1,033 5,030
0,997 1,003 0,979 1,030 5,045
1,000 1,000 0,976 1,027 5,060
1,003 0,997 0,973 1,024 5,075
1,006 0,994 0,970 1,021 5,090
1,009 0,991 0,967 1,018 5,105
1,012 0,988 0,964 1,015 5,120
The transmission characteristic of the FSS model is very sensitive to the changes in
aperture radius (r0) since it has the most powerful effect on the coupling between
the outer patch disks. The changes on the aperture radius create bandwidth
variations rather than shifting the resonant frequency of the design (see Table 3- 2).
Table 3- 2 Parameter sweep results for aperture radius (r0)
r0 (Normalized)
Center Freq (Normalized)
3dB points (Normalized)
Fractional 3dB BW (%)
0,818 1,006 0,988 1,027 3,846
0,909 1,003 0,982 1,027 4,451
0,964 1,000 0,979 1,027 4,762
1,000 1,000 0,976 1,027 5,060
1,091 0,994 0,964 1,030 6,587
1,182 0,991 0,955 1,030 7,508
Parameter sweep for the thickness of the dielectric slabs reveals that the coupling
and, consequently, 3 dB bandwidth of FSS transmission response decline as the
thickness is increased. The results for the thickness sweep are presented in Table 3-

48
3. When the thickness is decreased by more than half of the optimum value, the
transmission characteristic is observed to vanish totally.
Table 3- 3 Parameter sweep results for dielectric thickness (h)
h (Normalized)
Center Freq (Normalized)
3dB points (Normalized)
Fractional 3dB BW (%)
0,357 - - - -
0,714 1,009 0,982 1,036 5,310
1,000 1,000 0,976 1,027 5,060
1,071 1,000 0,973 1,024 5,060
1,429 0,991 0,967 1,012 4,505
1,786 0,982 0,958 1,003 4,545
As the period of the FSS model is changed while other parameters are kept
constant, the main alteration is detected for the center frequency. Table 3- 4
exhibits the increase in the center frequency with enlarged periodicity.
Table 3- 4 Parameter sweep results for FSS period (p)
p (Normalized)
Center Freq (Normalized)
3dB points (Normalized)
Fractional 3dB BW (%)
0,922 0,982 0,961 1,009 4,848
0,936 0,991 0,967 1,015 4,805
0,950 0,997 0,970 1,021 5,075
0,964 0,997 0,973 1,021 4,776
0,978 1,000 0,973 1,024 5,060
0,992 1,000 0,976 1,027 5,060
1,000 1,000 0,976 1,027 5,060
1,006 1,000 0,976 1,027 5,060
1,020 1,003 0,979 1,027 4,748
1,034 1,003 0,979 1,030 5,045
1,047 1,006 0,979 1,030 5,030
Considering the different effects of various FSS parameters, a full performance
optimization of the unit cell is implemented. The design is optimized in order to

49
provide sufficient transmission features up to 450 angle of incidence. The
maximum in-band insertion loss is around 0.7 dB for both TE and TM
polarizations except for 45o TE mode incidence. Insertion loss for TE mode 45
o
incidence is about 1.5 dB. The bandwidth of FSS is observed to be maintained as
the angle of incidence changes. It is also successful in selectivity aspects such that
it results in 10dB suppression in 400 MHz away from the upper and lower limits of
pass-band region. Transmission and reflection responses of the optimized unit cell
for the normal incidence are shown in Figure 3- 10.
Figure 3- 10Transmission and reflection characteristics of the optimized FSS unit
cell
FSS unit cell is also checked for the oblique incidence cases up to 450. Between
Figure 3- 11 and Figure 3- 14, the transmission and reflection curves for different
incident angles and polarizations (TE-TM) are demonstrated. As observed from
these figures, FSS unit cell maintains the filtering performance for oblique
incidence angles.
0.8 0.85 0.9 0.95 1 1.05 1.1 1.15 1.2 1.25-40
-35
-30
-25
-20
-15
-10
-5
0
Frequency normalized to center frequency
(dB
)
Transmission
Reflection

50
Figure 3- 11 Transmission performance of the unit cell for different angles of
incidence (TE modes)
Figure 3- 12 Reflection characteristics of the unit cell for different angles of
incidence (TE modes)
0.8 0.85 0.9 0.95 1 1.05 1.1 1.15 1.2 1.25-45
-40
-35
-30
-25
-20
-15
-10
-5
0
Frequency normalized to center frequency
Tra
nsm
issio
n(d
B)
Normal Incidence
TE-150
TE-300
TE-450
0.8 0.85 0.9 0.95 1 1.05 1.1 1.15 1.2 1.25-40
-35
-30
-25
-20
-15
-10
-5
0
Frequency normalized to center frequency
Reflection(d
B)
Normal Incidence
TE-150
TE-300
TE-450

51
Figure 3- 13 Transmission performance of the unit cell for different angles of
incidence (TM modes)
Figure 3- 14 Reflection characteristics of the unit cell for different angles of
incidence (TM modes)
0.8 0.85 0.9 0.95 1 1.05 1.1 1.15 1.2 1.25-45
-40
-35
-30
-25
-20
-15
-10
-5
0
Frequency normalized to center frequency
Tra
nsm
issio
n(d
B)
Normal Incidence
TM-150
TM-300
TM-450
0.8 0.85 0.9 0.95 1 1.05 1.1 1.15 1.2 1.25-40
-35
-30
-25
-20
-15
-10
-5
0
Frequency normalized to center frequency
Tra
nsm
issio
n(d
B)
Normal Incidence
TM-150
TM-300
TM-450

52
After the optimization of the unit cell parameters, predefined design goals are
accomplished for a planar infinite-in-two-dimension array of the single FSS
element. The array topology applied for this solution is rectangular, i.e., the four
side walls of the single element are defined as periodic boundaries (master-slave
pairs in HFSS terminology). The transmission and reflection performances of the
triangular and hexagonal unit cells for different angles of incidences and
polarizations are also determined using HFSS. The corresponding results are
presented between Figure 3- 15 and Figure 3- 22. As observed from the figures, the
properties of the rectangular array configuration do not significantly change for the
different orientations of the elements. In case that an important discrepancy is
observed for the new array topology, the design parameters would be optimized for
that unit cell model which is very close to the final arrangement of the elements.
Figure 3- 15 Transmission responses of triangular array unit cell for different angle
of incidences (TE modes)
0.8 0.85 0.9 0.95 1 1.05 1.1 1.15 1.2 1.25-45
-40
-35
-30
-25
-20
-15
-10
-5
0
Frequency normalized to center frequency
Tra
nsm
issio
n(d
B)
Normal Incidence
TE-150
TE-300
TE-450

53
Figure 3- 16 Reflection responses of triangular array unit cell for different angle of
incidences (TE modes)
Figure 3- 17 Transmission responses of triangular array unit cell for different angle
of incidences (TM modes)
0.8 0.85 0.9 0.95 1 1.05 1.1 1.15 1.2 1.25-30
-25
-20
-15
-10
-5
0
Frequency normalized to center frequency
Reflection(d
B)
Normal Incidence
TE-150
TE-300
TE-450
0.8 0.85 0.9 0.95 1 1.05 1.1 1.15 1.2 1.25-45
-40
-35
-30
-25
-20
-15
-10
-5
0
Frequency normalized to center frequency
Tra
nsm
issio
n(d
B)
Normal Incidence
TM-150
TM-300
TM-450

54
Figure 3- 18 Reflection responses of triangular array unit cell for different angle of
incidences (TM modes)
Figure 3- 19 Transmission responses of hexagonal array unit cell for different angle
of incidences (TE modes)
0.8 0.85 0.9 0.95 1 1.05 1.1 1.15 1.2 1.25-30
-25
-20
-15
-10
-5
0
Frequency normalized to center frequency
Reflection(d
B)
Normal Incidence
TM-150
TM-300
TM-450
0.8 0.85 0.9 0.95 1 1.05 1.1 1.15 1.2 1.25-45
-40
-35
-30
-25
-20
-15
-10
-5
0
Frequency normalized to center frequency
Tra
nsm
issio
n(d
B)
Normal Incidence
TE-150
TE-300
TE-450

55
Figure 3- 20 Reflection responses of hexagonal array unit cell for different angle of
incidences (TE modes)
Figure 3- 21 Transmission responses of hexagonal array unit cell for different angle
of incidences (TM modes)
0.8 0.85 0.9 0.95 1 1.05 1.1 1.15 1.2 1.25-14
-12
-10
-8
-6
-4
-2
0
Frequency normalized to center frequency
Reflection(d
B)
Normal Incidence
TE-150
TE-300
TE-450
0.8 0.85 0.9 0.95 1 1.05 1.1 1.15 1.2 1.25-45
-40
-35
-30
-25
-20
-15
-10
-5
0
Frequency normalized to center frequency
Tra
nsm
issio
n(d
B)
Normal Incidence
TM-150
TM-300
TM-450

56
Figure 3- 22 Reflection responses of hexagonal array unit cell for different angle of
incidences (TM modes)
Moreover, alternative unit cell arrangements mentioned in Chapter 2 are
constructed specifically for the current problem since the placement of the elements
on the final model is planned to be built in that sense (see Figure 3- 23). The same
analysis procedure is implemented for these unit cells and the results are
demonstrated in Figure 3- 24 and Figure 3- 25, for different amounts of shifts,
which are 0, p/6, p/3 and p/2 where p is the period of the unit cell. The simulation
results show that there is still no significant change in the performance of the FSS
element for these unit cell models.
0.8 0.85 0.9 0.95 1 1.05 1.1 1.15 1.2 1.25-14
-12
-10
-8
-6
-4
-2
0
Frequency normalized to center frequency
Reflection(d
B)
Normal Incidence
TM-150
TM-300
TM-450

57
Figure 3- 23 Modified triangular array unit cells (different shifts)
Figure 3- 24 Transmission responses of the modified triangular array unit cells
0.8 0.85 0.9 0.95 1 1.05 1.1 1.15 1.2-50
-45
-40
-35
-30
-25
-20
-15
-10
-5
0
Frequency normalized to center frequency
Tra
nsm
issio
n(d
B)
dshift
=0
dshift
=p/6
dshift
=p/3
dshift
=p/2

58
Figure 3- 25 Reflection responses of the modified triangular array unit cells
After planar single element unit cell solutions, semi-finite models with conformal
and planar arrangements are constructed which are detailed in Chapter 2 (see
Figure 2- 10 and Figure 2- 11). For in-band frequencies, it is observed that there is
no significant change in far field patterns for the cases with and without FSS
radome. When the frequencies of out-of-band region are investigated, it is
observed that a total suppression of the total field occurs consistent with the
filtering characteristics of the single element FSS unit cell. The total and incident
fields at the far zone are demonstrated for various frequencies between Figure 3- 26
and Figure 3- 30.
0.8 0.85 0.9 0.95 1 1.05 1.1 1.15 1.2-40
-35
-30
-25
-20
-15
-10
-5
0
Frequency normalized to center frequency
Reflection(d
B)
dshift
=0
dshift
=p/6
dshift
=p/3
dshift
=p/2

59
Figure 3- 26 Far field E-total patterns of 31-element source antenna array without
FSS radome and with conformal FSS at 0.964*f0
Figure 3- 27 Far field E-total patterns of 31-element source antenna array without
FSS radome and with conformal FSS at 0.988*f0
-80 -60 -40 -20 0 20 40 60 8010
20
30
40
50
60
70
80
90
Theta (Degrees)
Eto
tal-fa
rfie
ld (
dB
)
No FSS
Curved FSS Semi finite
-80 -60 -40 -20 0 20 40 60 8020
30
40
50
60
70
80
90
Theta (Degrees)
Eto
tal-fa
rfie
ld (
dB
)
No FSS
Curved FSS Semi finite

60
Figure 3- 28 Far field E-total patterns of 31-element source antenna array without
FSS radome and with conformal FSS at f0
Figure 3- 29 Far field E-total patterns of 31-element source antenna array without
FSS radome and with conformal FSS at 1.012*f0
-80 -60 -40 -20 0 20 40 60 8020
30
40
50
60
70
80
90
Theta (Degrees)
Eto
tal-fa
rfie
ld (
dB
)
No FSS
Curved FSS Semi finite
-80 -60 -40 -20 0 20 40 60 8020
30
40
50
60
70
80
90
Theta (Degrees)
Eto
tal-fa
rfie
ld (
dB
)
No FSS
Curved FSS Semi finite

61
Figure 3- 30 Far field E-total patterns of 31-element source antenna array without
FSS radome and with conformal FSS at 1.048*f0
The semi-finite FSS model is also constructed for a planar FSS sequence as
described in Chapter 2 in order to compare the planar and conformal FSS structures
using the same analysis method (semi-finite analysis).
Analysis results for different frequencies are given between Figure 3- 31 and
Figure 3- 33 for the planar semi-finite model. The results of the cylindrical and
planar models are consistent with each other and single element unit cell solution in
terms of transmission characteristics. Planar model analysis clarified an important
point, the shadowing effect of FSS radome over the illumination source. As
observed from the figures, the transmission and suppression characteristics are
valid only for the region shadowed by FSSs. For the semi-cylinder case, the dipoles
are almost totally shadowed by the radome (about 160 degrees of coverage over
180 degrees). Thus, the transmission properties of FSS radome can be determined
for both main lobe and side lobe regions. The planar FSS semi-finite model
shadows only 70 degrees of the upper half region (180 degrees). Therefore, the
results are sensible up to that point for the planar solutions.
-80 -60 -40 -20 0 20 40 60 8020
30
40
50
60
70
80
90
Theta (Degrees)
Eto
tal-fa
rfie
ld (
dB
)
No FSS
Curved FSS Semi finite

62
Figure 3- 31 Far field E-total patterns with and without FSS radome at 0.964*f0 -
Planar semi-finite model
Figure 3- 32 Far field E-total patterns with and without FSS radome at f0 - Planar
semi-finite model
-80 -60 -40 -20 0 20 40 60 8010
20
30
40
50
60
70
80
90
Theta (Degrees)
Eto
tal-fa
rfie
ld (
dB
)
No FSS
Planar FSS Semi finite
-80 -60 -40 -20 0 20 40 60 8010
20
30
40
50
60
70
80
90
Theta (Degrees)
Eto
tal-fa
rfie
ld (
dB
)
No FSS
Planar FSS Semi finite

63
Figure 3- 33 Far field E-total patterns with and without FSS radome at 1.048*f0 -
Planar semi-finite model
For the above solutions, a narrow-beam pattern is preferred since the final
implementation of the FSS radome will be done for a highly directive antenna. In
addition to that, filtering characteristics of semi-finite planar and curved models are
also determined for a wide-beam illumination. Two uniformly excited Hertzian
dipoles are used for this configuration. FSS models are observed to exhibit same
behaviors as in the narrow-beam case. They transmit or suppress the incoming
waves with respect to the frequencies and coverage region limitations. The results
for the wide-beam illumination for semi-cylinder and planar models are
demonstrated between Figure 3- 34 and Figure 3- 36.
-80 -60 -40 -20 0 20 40 60 8010
20
30
40
50
60
70
80
90
Theta (Degrees)
Eto
tal-fa
rfie
ld (
dB
)
No FSS
Planar FSS Semi finite

64
Figure 3- 34 Far field E-total patterns of 2-element source antenna array without
FSS radome and with planar and conformal FSS at 0.964*f0
Figure 3- 35 Far field E-total patterns of 2-element source antenna array without
FSS radome and with planar and conformal FSS at f0
-80 -60 -40 -20 0 20 40 60 80-10
0
10
20
30
40
50
60
70
80
90
Theta (Degrees)
Eto
tal-fa
rfie
ld (
dB
)
No FSS
Curved Semi-finite FSS
Planar Semi-finite FSS
-80 -60 -40 -20 0 20 40 60 80-10
0
10
20
30
40
50
60
70
80
90
Theta (Degrees)
Eto
tal-fa
rfie
ld (
dB
)
No FSS
Curved FSS semi-finite
Planar FSS semi-finite

65
Figure 3- 36 Far field E-total patterns of 2-element source antenna array without
FSS radome and with planar and conformal FSS at 1.048*f0
Using the results obtained from the above solutions, the transmission performances
of single element unit cell, semi-finite curved and planar FSS models are
compared. The transparency characteristics of the semi-finite model can be
determined by the difference of the incident and total far field patterns at theta=00.
The comparison of the transparency performances of the single element unit cell
and semi-finite models both for the conformal and the planar FSS is shown in
Figure 3- 37, which illustrates the good agreement between different solution
techniques.
-80 -60 -40 -20 0 20 40 60 80-10
0
10
20
30
40
50
60
70
80
90
Theta (Degrees)
Eto
tal-fa
rfie
ld (
dB
)
No FSS
Curved FSS semi-finite
Planar FSS semi-finite

66
Figure 3- 37 Comparison of transmission characteristics of unit cell and semi-finite
conformal and planar models
The comparison of far field patterns with and without FSS layers proves the in-
band performance of FSS model. For the out-of-band characterization, the
reflection properties of FSS model are required to be demonstrated. To achieve this
requirement, RCS analysis can be held using the semi-finite model of the semi-
cylinder FSS radome. There are two alternative techniques to compare the RCS
performance of FSS radome: using PEC or dielectric cylinder of the same size as
FSS radome. For the PEC cylinder configuration, the out-of-band RCS
characteristics of FSS radome is expected to be similar to that of PEC cylinder. For
pass-band frequencies, there must be a dramatic decrease in RCS of FSS radome.
The solution approach for PEC cylinder is illustrated with Figure 3- 38. The back-
scattered RCS results for FSS and PEC cylinders are given in Figure 3- 39. As seen
in this figure, the RCS of the FSS radome is remarkably similar to the RCS of PEC
cylinder out of the pass-band region of FSS. Moreover, the RCS of the FSS radome
0.952 0.964 0.976 0.988 1 1.012 1.024 1.036 1.048 1.06 1.072-20
-15
-10
-5
0
5
Frequency normalized to center frequency
Tra
nspare
ncy (
dB
)
Unit cell
Curved semi-finite
Planar semi-finite

67
significantly diminishes with respect to PEC cylinder around the center frequency
in the pass-band.
Figure 3- 38 The schematic of the RCS comparison method using PEC Cylinder
Figure 3- 39 Monostatic RCS results of FSS and PEC semi-cylinders using semi-
finite analysis method
The other alternative to observe the out-of-band characteristics of FSS radome is to
use a dielectric cylinder instead of PEC material. For the dielectric radome
configuration, there also exists a PEC sheet representing the antenna surface used
0.8 0.85 0.9 0.95 1 1.05 1.1 1.15 1.2-40
-35
-30
-25
-20
-15
Frequency normalized to center frequency
(dB
sm
)
Monostatic RCS
PEC Cylinder
FSS Radome
RC
S

68
for the illumination (see Figure 3- 40). The schematic of the configuration built for
RCS comparison is given in Figure 3- 41.
Figure 3- 40 RCS analysis using semi-finite model: Dielectric radome and PEC
sheet
Figure 3- 41 The schematic of the RCS analysis method using dielectric cylinder
and PEC planar sheet
In this approach, it is expected that monostatic RCS of the FSS cylinder must
decrease dramatically for the out-of-band frequencies with respect to dielectric
cylinder with PEC sheet beneath since the FSS radome reflects the incoming waves
of these frequencies to different directions due to its curved surface. The analysis
results indicate the expected behaviors, i.e. RCS reduction of the FSS radome with
respect to dielectric radome for the band-stop regions (see Figure 3- 42).
Dielectric Cylinder
PEC Sheet

69
Figure 3- 42 Monostatic RCS results of FSS and dielectric semi-cylinders using
semi-finite analysis method
The design process for the hybrid FSS model has been completed for both planar
and conformal cases including different polarization and angle of incidence
conditions. The designer may pass to fabrication steps or prove the design with a
finite conformal FSS model if possible.
For this problem, a finite spherical FSS model shown in Figure 3- 43 is constructed
using HFSS®. However, instead of the full spherical FSS structure, a quarter of the
finite model is sufficient to analyze since there are two symmetry planes as shown
in Figure 3- 44. Utilizing this property, FSS model represented in Figure 3- 44 is
used to analyze the full model.
0.8 0.85 0.9 0.95 1 1.05 1.1 1.15 1.2-40
-35
-30
-25
-20
-15
-10
-5
0
Frequency normalized to center frequency
(dB
sm
)
Monostatic RCS
Dielectric Radome
FSS Radome
RC
S

70
Figure 3- 43 Finite spherical FSS radome: (a) Top view (b) Side view
For illumination, a 4x1 Hertzian dipole array, which is effectively 8x2 due to
symmetry planes, is used with a Taylor distribution of 20 dB side lobe level. The
currents on dipoles are directed in âx-dimension. Therefore, the symmetry boundary
in xz-plane is defined as PMC and the other one in yz-plane as PEC. Total
electrical field patterns at far zone with and without FSS radome are compared and
it is observed that FSS radome does not affect incident signals of in-band
frequencies significantly, while it reflects the signals of other frequencies. Figure 3-
45 to Figure 3- 47 demonstrate the filtering behavior of FSS model.
Figure 3- 44 Symmetry planes of the quarter model
PMC PEC

71
Figure 3- 45 Total E-field patterns with and without doubly curved finite FSS
radome at far zone (0.94*f0)
Figure 3- 46 Total E-field patterns with and without doubly curved finite FSS
radome at far zone (f0)
-80 -60 -40 -20 0 20 40 60 8020
30
40
50
60
70
80
90
100
110
Theta (Degrees)
Eto
tal-fa
rfie
ld (
dB
)
No FSS
Finite FSS
-80 -60 -40 -20 0 20 40 60 8020
30
40
50
60
70
80
90
100
110
Theta (Degrees)
Eto
tal-fa
rfie
ld (
dB
)
No FSS
Finite FSS

72
Figure 3- 47 Total E-field patterns with and without doubly curved finite FSS
radome at far zone (1.04*f0)
The model constructed for this finite solution is a reduced form of semi-sphere FSS
radome, however; it still requires a very high memory capacity. Therefore, as
explained above, if not strictly required, semi-finite solution can be accepted as the
last stage of design processes since a doubly-curved finite model solutions brings a
heavy calculation load and makes the approach inefficient in aspects of simulation
based analyses.
As in the case of planar semi-finite model, the simulation results for the finite
model imply that the FSS does not perform as expected for observation angles
greater than 600 due to the shadowing problem associated with the coverage area of
the finite structure.
-80 -60 -40 -20 0 20 40 60 8020
30
40
50
60
70
80
90
100
110
Theta (Degrees)
Eto
tal-fa
rfie
ld (
dB
)
No FSS
Finite FSS

73
CHAPTER 4
DESIGN AND ANALYSIS OF A WIDEBAND CONFORMAL
FREQUENCY SELECTIVE SURFACE
4.1 Design Requirements
The general design requirements for the curved FSS applications like good
conformability and stable performance against oblique incidence features, which
are mentioned in details in the previous chapter, are also valid for the wideband
curved FSS design. Wideband FSS structure is required to cover all X-band (8.2-
12.4 GHz) frequencies with a maximum insertion loss of 0.5 dB for normal
incidence. The pass-band flatness and reflection loss responses will be preserved up
to 450 angle of incidence for both TE and TM polarizations. The principal design
goals required for the wideband FSS construction can also be listed as;
Low insertion loss in the pass-band
Wide band operation
Stable performance against oblique incidence
Polarization independence
Applicability on curved bodies

74
4.2 Wideband Conformal Frequency Selective Surface Design
For the conformal wide band FSS application, the ultra-wide band frequency
selective surface model of H. Zhou et. al., shown in Figure 4- 1 (from [12]), is
chosen as the reference model. The most distinguishing feature of this model is its
stable performance against different angle of incidences. It is stated in [12] that the
performance of the wide band FSS is maintained up to 30o of incidence angle. The
model consists of three metallic layers and two dielectric layers. The outer metallic
patches are rectangular and the middle layer is a square grid.
Figure 4- 1 Reference ultra-wideband FSS unit cell model: (a) Unit cell (b)
Prototype of fabricated FSS [12]
The design procedure after defining the FSS model begins with the determination
of starting values of the model parameters. The starting points for the optimization
process are obtained by scaling the model in [12]. However, as mentioned in the
previous chapters, circular elements are strongly suggested for the conformal
applications due their unique properties. Therefore, the reference model is
transformed to its circular counterpart, i.e. disk patches on the outer faces and
circular grids between them instead of corresponding rectangular ones. Unit cell of
the modified FSS model is presented in Figure 4- 2 (b). This model is analyzed

75
using HFSS and it is noticed that wide-band characteristics of the original FSS
model is maintained without any critical change.
Figure 4- 2 Wideband FSS layers: (a) Original (from [12]) (b) Modified
To reach the optimum parameters ensuring the design goals, the main parameters
of the modified FSS, which are period (p), dielectric thickness (h), radius of the
outer disk patches (r) and width of the circular grids (s), are included in the sweep
analyses. The corresponding results of different parameter sweeps are presented
between Figure 4- 3 and Figure 4- 6. The values of the FSS dimensions are given
as normalized to their individual optimums in the corresponding figures.

76
Figure 4- 3 Transmission responses for the sweep values of period parameter (p)
Variation in period parameter (p) mainly affects center frequency and bandwidth of
FSS as observed from Figure 4- 3. Furthermore, a second resonance point in the
upper frequency band gets closer to the operation region as period is increased
while the other parameters are kept constant.
2 4 6 8 10 12 14 16 18-30
-25
-20
-15
-10
-5
0
Frequency (GHz)
Tra
nsm
issio
n(d
B)
pnorm
=0.929
pnorm
=1
pnorm
=1.071
pnorm
=1.143

77
Figure 4- 4 Transmission responses for the sweep values of dielectric thickness (h)
The thickness of the double layer FSS structure effectively changes the upper limit
of the pass-band region as shown in Figure 4- 4. As the thickness is increased the
upper band limit decreases while the lower pass-band limit is not altered
significantly.
Sweep analysis of outer disk radius parameter (r) reveals that it affects center
frequency, bandwidth and selectivity features of FSS structure. As observed from
Figure 4- 5, when the disk radius increases, center frequency shifts down and
bandwidth decreases. Increase in disk radius also causes to weaken the selectivity
performance of WB FSS.
2 4 6 8 10 12 14 16 18-30
-25
-20
-15
-10
-5
0
Frequency (GHz)
Tra
nsm
issio
n(d
B)
hnorm
=0.635
hnorm
=0.762
hnorm
=0.889
hnorm
=1
hnorm
=1.143
hnorm
=1.27
hnorm
=1.397

78
Figure 4- 5 Transmission responses for the sweep values of disk radius (r)
Figure 4- 6 Transmission responses for the sweep values of grid width (s)
2 4 6 8 10 12 14 16 18-25
-20
-15
-10
-5
0
Frequency (GHz)
Tra
nsm
issio
n(d
B)
rnorm
=0.867
rnorm
=0.933
rnorm
=1
rnorm
=1.067
rnorm
=1.133
2 4 6 8 10 12 14 16 18-25
-20
-15
-10
-5
0
Frequency (GHz)
Tra
nsm
issio
n(d
B)
snorm
=0.667
snorm
=1
snorm
=1.667
snorm
=2

79
Another swept parameter of WB FSS model is the width of metallic circular ring
(s) positioned between the disk patches. Width of these rings creates alterations on
the lower limit of the pass-band region mainly. Increasing ring width shifts the
center frequency upwards. As the upper limit is not affected with the modifications
on “s”, center frequency moves upwards in frequency and, consequently,
bandwidth of FSS decreases as ring width is increased as illustrated in Figure 4- 6.
Utilizing the results of the parameter sweeps, the individual effects of each
parameter are analyzed and the optimum values of the FSS dimensions are
determined. The transmission and reflection curves of the final FSS model for
normal incidence are illustrated in Figure 4- 7. The performance of the design
against different incidence angles is demonstrated between Figure 4- 8 and Figure
4- 11 in terms of transmission and reflection responses.
Figure 4- 7 Transmission and reflection characteristics of the optimized FSS design
for the normal incidence
2 4 6 8 10 12 14 16 18-45
-40
-35
-30
-25
-20
-15
-10
-5
0
(dB
)
Frequency (GHz)
Transmission
Reflection

80
Figure 4- 8 Transmission responses of the optimized FSS design for oblique
incidences (TE mode)
Figure 4- 9 Reflection responses of the optimized FSS design for oblique
incidences (TE mode)
2 4 6 8 10 12 14 16 18-25
-20
-15
-10
-5
0
Frequency (GHz)
Tra
nsm
issio
n(d
B)
NormalIncidence
TE-150
TE-300
TE-450
2 4 6 8 10 12 14 16 18-60
-50
-40
-30
-20
-10
0
Frequency (GHz)
Reflection(d
B)
Normal Incidence
TE-150
TE-300
TE-450

81
Figure 4- 10 Transmission responses of the optimized FSS design for oblique
incidences (TM mode)
Figure 4- 11 Reflection responses of the optimized FSS design for oblique
incidences (TM mode)
2 4 6 8 10 12 14 16 18-25
-20
-15
-10
-5
0
Frequency (GHz)
Tra
nsm
issio
n(d
B)
Normal Incidence
TM-150
TM-300
TM-450
2 4 6 8 10 12 14 16 18-45
-40
-35
-30
-25
-20
-15
-10
-5
0
Frequency (GHz)
Reflection(d
B)
Normal Incidence
TM-150
TM-300
TM-450

82
The wide band FSS model is optimized for the rectangular array conditions,
however; the application surface may require a different array topology like
triangular array. Therefore, the design is necessarily to be validated for the
triangular array arrangement. The unit cell model constructed for this topology is
illustrated in Figure 4- 12.
Figure 4- 12 Triangular array configuration of WB FSS model
The analysis results for the triangular array unit cell reveal the consistent
performance of FSS model with rectangular array analyses. The transmission and
reflection curves under different incidence angles for TE and TM modes are
presented between Figure 4- 13 and Figure 4- 16.
Figure 4- 13 Transmission responses of the triangular array unit cell model for
oblique incidences (TE mode)
2 4 6 8 10 12 14 16 18-30
-25
-20
-15
-10
-5
0
Frequency(GHz)
Tra
nsm
issio
n(d
B)
Normal Incidence
TE 15o
TE 30o
TE 45o

83
Figure 4- 14 Reflection responses of the triangular array unit cell model for oblique
incidences (TE mode)
Figure 4- 15 Transmission responses of the triangular array unit cell model for
oblique incidences (TM mode)
2 4 6 8 10 12 14 16 18-70
-60
-50
-40
-30
-20
-10
0
Frequency(GHz)
Reflection(d
B)
Normal Incidence
TE 15o
TE 30o
TE 45o
2 4 6 8 10 12 14 16 18-20
-18
-16
-14
-12
-10
-8
-6
-4
-2
0
Frequency(GHz)
Tra
nsm
issio
n(d
B)
Normal Incidence
TM 15o
TM 30o
TM 45o

84
Figure 4- 16 Reflection responses of the triangular array unit cell model for oblique
incidences (TM mode)
After verifying filtering performance of the FSS model with single element planar
unit cell solution, the semi-finite model analysis is applied as described in Chapter
2. Between Figure 4- 17 and Figure 4- 21, the results of the semi finite analysis are
presented. From these figures, it is obvious that the wide band pass characteristics
of the single element planar unit cell are maintained when the elements are placed
on conformal surface. Furthermore, it is observed that the edge diffractions at the
end elements of the finite curved dimension do not have a significant effect on the
performance of the model.
2 4 6 8 10 12 14 16 18-45
-40
-35
-30
-25
-20
-15
-10
-5
0
Frequency(GHz)
Reflection(d
B)
Normal Incidence
TM 15o
TM 30o
TM 45o

85
Figure 4- 17 Far field E-total patterns of 31-element source antenna array with and
without wide band FSS radome at 2 GHz
Figure 4- 18 Far field E-total patterns of 31-element source antenna array with and
without wide band FSS radome at 8 GHz
-50 -40 -30 -20 -10 0 10 20 30 40 5010
20
30
40
50
60
70
Theta (Degrees)
Eto
tal-F
arf
ield
(dB
)
No FSS
Curved FSS Semi-finite
-50 -40 -30 -20 -10 0 10 20 30 40 5020
30
40
50
60
70
80
90
Theta (Degrees)
Eto
tal-F
arf
ield
(dB
)
No FSS
Curved FSS Semi-finite

86
Figure 4- 19 Far field E-total patterns of 31-element source antenna array with and
without wide band FSS radome at 10 GHz
Figure 4- 20 Far field E-total patterns of 31-element source antenna array with and
without wide band FSS radome at 12.5 GHz
-50 -40 -30 -20 -10 0 10 20 30 40 5030
40
50
60
70
80
90
Theta (Degrees)
Eto
tal-F
arf
ield
(dB
)
No FSS
Curved FSS Semi-finite
-50 -40 -30 -20 -10 0 10 20 30 40 5030
40
50
60
70
80
90
Theta (Degrees)
Eto
tal-F
arf
ield
(dB
)
No FSS
Curved FSS Semi-finite

87
Figure 4- 21 Far field E-total patterns of 31-element source antenna array with and
without wide band FSS radome at 18 GHz
Semi-finite model analysis of WB FSS structure is also implemented for planar
sequence of FSS elements. Solution model is constructed as described for curved
structure. Results of planar FSS semi-finite analysis show good agreement with the
results of semi-cylinder FSS solution. Far field total E-field patterns with and
without planar FSS sequence are shown between Figure 4- 22 and Figure 4- 24 for
different frequencies.
-50 -40 -30 -20 -10 0 10 20 30 40 5030
40
50
60
70
80
90
Theta (Degrees)
Eto
tal-F
arf
ield
(dB
)
No FSS
Curved FSS Semi-finite

88
Figure 4- 22 Far field E-total patterns of 31-element source antenna array with and
without planar wide band FSS radome at 2 GHz
Figure 4- 23 Far field E-total patterns of 31-element source antenna array with and
without planar wide band FSS radome at 10 GHz
-60 -40 -20 0 20 40 6010
20
30
40
50
60
70
Theta (Degrees)
Eto
tal-fa
rfie
ld (
dB
)
No FSS
Planar FSS Semi finite
-60 -40 -20 0 20 40 6010
20
30
40
50
60
70
80
90
Theta (Degrees)
Eto
tal-fa
rfie
ld (
dB
)
No FSS
Planar FSS Semi finite

89
Figure 4- 24 Far field E-total patterns of 31-element source antenna array with and
without planar wide band FSS radome at 18 GHz
Comparison of the analysis methods as in Chapter 3 is done for the single element
unit cell solution and curved and planar semi-finite analyses. The transparency
characteristics for the semi-finite models are obtained by the difference of total
electric far field magnitudes of two solutions with and without FSS structure at the
direction where theta equals to zero. As demonstrated in Figure 4- 25., the results
of both methods are consistent with each other.
-60 -40 -20 0 20 40 6020
30
40
50
60
70
80
90
100
Theta (Degrees)
Eto
tal-fa
rfie
ld (
dB
)
No FSS
Planar FSS Semi finite

90
Figure 4- 25 Comparison of transmission characteristics of unit cell and semi-finite
conformal and planar models
Using the semi-finite model, RCS analysis of the wide band FSS radome is
implemented with two different configurations as in Chapter 3. In the first
configuration, RCS of a PEC cylinder having the same radius as FSS model is
compared with the RCS of the FSS radome. It is expected that RCS of the radome
for the out-of-band frequencies is close to RCS of PEC cylinder while there is a
great decline in RCS of FSS radome for the in-band frequencies. In Figure 4- 26,
this situation is realized and expected results are determined such that semi-finite
FSS radome model behaves like PEC cylinder for out-of-band frequencies.
2 4 6 8 10 12 14 16 18-20
-18
-16
-14
-12
-10
-8
-6
-4
-2
0
Frequency (GHz)
(dB
)
Unitcell
Planar Semi finite
Curved Semi Fİnite

91
Figure 4- 26 Monostatic RCSs of WB FSS and PEC semi-cylinder using semi-
finite analysis method
The other arrangement for RCS analysis includes a dielectric radome with a planar
PEC sheet representing the surface of an antenna illuminating that radome. For the
proper FSS operation, the monostatic RCS of the dielectric radome for in-band
frequencies is close to that of FSS radome, however; there exist a huge decrease in
RCS of FSS radome for out-of-band frequencies since FSS structure behaves like a
conducting cylinder and scatters the incoming signals to different directions for
those frequencies. RCSs of semi-finite WB FSS model and dielectric cylinder with
a planar PEC sheet beneath them are demonstrated in Figure 4- 27. As expected,
RCS of FSS radome is truly lower for frequencies outside of pass-band region.
2 4 6 8 10 12 14 16 18-65
-60
-55
-50
-45
-40
-35
-30
-25
-20
-15
Frequency (GHz)
dB
sm
PEC Cylinder
Wideband FSS Radome
RC
S (
)

92
Figure 4- 27 Monostatic RCS results of FSS and dielectric semi-cylinders using
semi-finite analysis method
Verification of transmission and reflection characteristics with curved semi-finite
model analyses completes design and analysis processes for this specific
application. After all, designer is required to check realizability of FSS model in
terms of fabrication techniques and material procurement before producing FSS
radome.
2 4 6 8 10 12 14 16 18-40
-35
-30
-25
-20
-15
-10
-5
Frequency (GHz)
dB
sm
Dielectric Cylinder
Wideband FSS Radome
RC
S (
)

93
CHAPTER 5
FABRICATION AND MEASUREMENTS OF FREQUENCY
SELECTIVE SURFACE STRUCTURES
5.1 Fabrication of the Hybrid Coupled Aperture FSS
To this point, the design methodology for the conformal FSS structures is detailed
and some sample FSS models are designed. In order to prove the performance of
the designed FSSs, planar prototypes are produced. The FSS model designed in
Chapter 3, hybrid coupled aperture FSS, is fabricated in the facilities of
ASELSAN. The layers of the FSS are fabricated as 40cm x 40cm planar sheets
separately since the double layer fabrication requires an advanced production
infrastructure. The material used as dielectric slab is RT/duroid®
5880 High
Frequency Laminate of Rogers Corporation [40]. For the conformal
implementation of the fabricated FSS structures, the base laminate material is
required to be bendable on the curved surfaces. Thus, 5880 laminate is chosen due
to its powerful elasticity features when compared to other PCB cards. Hybrid FSS
model is a narrow-band and highly selective structure. These features are mainly
characterized by the coupling mechanism of the model. Therefore, the orientation
of the layers and bonding processes are very crucial in order to achieve desired
filtering performances. The separate layers of the hybrid coupled aperture FSS
model are demonstrated in Figure 5- 1. As observed from the figure, disk patch and
coupling aperture patterns are scraped on the two sides of 5880 duroid laminate.
For the other dielectric layer, the scraping of the disk pattern is implemented on
one face and no metal is left on the other surface.

94
Figure 5- 1 Separate layers of the fabricated FSS Prototypes
FSS layers are bonded according to the configuration described in Chapter 3.
Loctite® 401 of Henkel is used as adhesive for bonding of the layers [41]. The
liquid adhesive (Loctite® 401) is spread over the empty surface of the FSS layer,
single side of which is scraped only. Since these processes are done manually, a
homogenous very thin layer of adhesive cannot be constructed. Instead,
homogenously spread drops of the adhesive are placed on the surface of the
bonding layer. Moreover, the FSS layers are also pressed manually after bonding
which may create some discrepancies on the performance of the double layer FSS.
5.2 Measurements of Fabricated FSS Structures
To measure the transmission and reflection responses of FSS structures, two
alternative measurement setups are prepared in order to ensure the measurement
results. The first setup used for the measurements is “MMS Free Space Microwave
Measurement Setup” of Antenna Technologies Department of ASELSAN Inc. [42].
The setup arranged for the FSS measurement is demonstrated in Figure 5- 2.

95
Figure 5- 2 Free Space Microwave Measurement Setup
The free space measurement setup consists of a network analyzer, sample holder
and focused antenna pairs for different frequency ranges, which are namely C-band
(5.6-8.2 GHz), X-band (8.2-12.4 GHz) and Ku-band (12.4-18 GHz), as shown in
Figure 5- 2 above. Since the hybrid coupled FSS operates in Ku-band, the
corresponding antenna pair is mounted on the setup. Before starting the
measurements, the setup is required to be calibrated with the help of the software of
MMS. The calibration type applied for the setup is TRL (Transmission-Reflection-
Line). After the calibration is completed, FSS prototype is placed on sample holder
as shown in Figure 5- 3.
The measurement of S-parameters is then accomplished using the user interface
software of MMS. The total thickness of hybrid FSS is normally expected to be
around 290 um, however; the measured thickness is around 330 um, which is
attributed to the fabrication incapabilities. This difference is likely to be created by
a combinational effect of air gaps and adhesive remainders which are not pressed
appropriately. The transmission response of two fabricated prototypes, which are
named as "No1" and "No2", are presented in Figure 5- 4 together with the single
element unit cell solution.

96
Figure 5- 3 Placement of FSS prototype on the Free Space Measurement Setup
Figure 5- 4 Free Space Measurement and HFSS Unit cell results for hybrid coupled
FSS prototype No.1 and No.2
0.5 0.6 0.7 0.8 0.9 1 1.1 1.2 1.3 1.4-60
-50
-40
-30
-20
-10
0
Frequency normalized to center frequency
Tra
nsm
issio
n(d
B)
HFSS-unitcell
Prototype No:1
Prototype No:2

97
The results of the free space microwave measurements are observed to be
unsatisfactory in terms of transmission levels and resonance frequencies compared
to the unit cell simulations. In order to reexamine the performance of the FSS
prototypes, a new measurement setup is constructed using the "Arc S-parameter
Measurement Setup" of Antenna Technologies Department of ASELSAN Inc. as
illustrated in Figure 5- 6. The arc measurement setup is normally used for the
oblique incidence reflection measurements so as to determine the performances of
absorbers for different angles of incidences. Nonetheless, with a small
modification, this setup becomes suitable for transmission measurements for
normal incidence cases. Two apparatus are designed and constructed using 3D
printer in ASELSAN (see Figure 5- 5). These components provide the horizontal
positioning of horn antennas with respect to the ground, which is actually not
possible with the default setup.
Figure 5- 5 Modification apparatus (front view on the left, side view on the right)
for FSS measurements using Arc Measurement Setup
The modified setup includes two Ku-band standard gain horn antennas, sample
holder, network analyzer and RF cables (see Figure 5- 6). The calibration technique
for this measurement setup is different from Free Space Microwave setup. In horn
measurement, time domain gating feature of the network analyzer is utilized such
that the place of the FSS is determined in time and by gating this region, the

98
destructive effects of measurement environment on the transmission characteristics
at other time instants are excluded from FSS surface. Transmission performance of
FSS prototypes are determined by normalizing FSS measurements to "air"
measurement. Therefore, FSS and air transmission coefficients are measured
separately. Same gating definitions are applied for air and FSS prototypes.
Figure 5- 6 Modified horn antenna measurement setup
Measurement results obtained from the horn antenna setup are presented in Figure
5- 7 together with HFSS solutions, for FSS prototypes No.1 and No.2.

99
Figure 5- 7 Horn Antenna Measurement and HFSS Unit cell analysis results for
hybrid coupled FSS prototype No.1 and No.2
The results of FSS measurements with two different setups are given in Figure 5- 8
and Figure 5- 9 for prototype No.1 and No.2 and it is observed that they show a
good agreement with respect to each other, however; the filtering characteristics are
far away from the simulation results.
0.5 0.6 0.7 0.8 0.9 1 1.1 1.2 1.3 1.4-70
-60
-50
-40
-30
-20
-10
0
Frequency normalized to center frequency
Tra
nsm
issio
n(d
B)
HFSS Unit cell
Prototype No:1
Prototype No:2

100
Figure 5- 8 The comparison of unit cell model analysis and measurements with
Free Space Microwave and Horn Antenna setups (Prototype No.1)
Figure 5- 9 The comparison of unit cell model analysis and measurements with
Free Space Microwave and Horn Antenna setups (Prototype No.2)
0.5 0.6 0.7 0.8 0.9 1 1.1 1.2 1.3 1.4-60
-50
-40
-30
-20
-10
0T
ransm
issio
n(d
B)
Frequency normalized to center frequency
HFSS-unitcell
FreeSpaceMeasurement-no1
Horn Setup - PrototypeNo:1
0.5 0.6 0.7 0.8 0.9 1 1.1 1.2 1.3 1.4-70
-60
-50
-40
-30
-20
-10
0
Tra
nsm
issio
n(d
B)
Frequency normalized to center frequency
HFSS-unitcell
FreeSpaceMeasurement-no2
Horn Setup - PrototypeNo:2

101
Discrepancies observed in the filtering responses of the prototypes are ascribed to
the lack of double layer fabrication capabilities. As mentioned before in this
chapter, the measured thicknesses of prototypes are around 330um instead of the
expected value of 290um. In order to determine the effect of this difference, a unit
cell model having a vacuum layer of 40um thickness is constructed and analyzed in
HFSS. The result of this simulation is presented in Figure 5- 10 and Figure 5- 11
together with measurement results and unit cell solution of ideal model.
Figure 5- 10 Comparison of normal and 40um-vacuum layered unit cell analysis
results with Free Space Microwave Measurements
0.5 0.6 0.7 0.8 0.9 1 1.1 1.2 1.3 1.4-60
-50
-40
-30
-20
-10
0
Frequency normalized to center frequency
Tra
nsm
issio
n(d
B)
HFSS Unit Cell - Normal Model
HFSS Unit Cell-40um vacuum
FSM - PrototypeNo:1
FSM - PrototypeNo:2

102
Figure 5- 11 Comparison of normal and 40um-vacuum layered unit cell analysis
results with Horn Antenna Measurements
The unit cell analysis taking 40um vacuum layer into account clarified the dramatic
effect of any inadequacy in fabrication processes to the realized transmission
characteristics. The measurements and new unit cell analysis results are consistent
with each other. The slight difference between the measurements and analysis can
be attributed to the non-uniformity of the actual vacuum layer of the prototypes.
To investigate the discrepancies between the results of simulations and
measurements, the effect of misalignment of FSS layers is also simulated with the
unit cell model shown in Figure 5- 12.a for various shifts which is defined by dmis
parameter referenced to period (p). As described in Figure 5- 12.b, bottom and
middle metallic layers are shifted together since they are on the same dielectric
substrate. The upper disk layer is shifted in the perpendicular direction as
demonstrated in Figure 5- 12.c. Simulation results show that misalignments of FSS
layers cause degradation in filtering performance while the center frequency is
0.5 0.6 0.7 0.8 0.9 1 1.1 1.2 1.3 1.4-70
-60
-50
-40
-30
-20
-10
0
Frequency normalized to center frequency
Tra
nsm
issio
n(d
B)
HFSS Unit cell
HFSS Unit Cell-40um vacuum
Horn Setup - PrototypeNo:1
Horn Setup - PrototypeNo:2

103
stable against these modifications (see Figure 5- 13). However, the shifts up to 7%
of period create no significant change with respect to normal unit cell model which
shows that FSS model is not sensitive to alignment errors. Therefore, the
discrepancies between simulations and measurements are not attributed to
alignment errors as the observed misalignments of fabricated prototypes are not
larger than 7% of period.
Figure 5- 12 Misalignment configuration of unit cell model a) Unit cell b) Bottom
and middle FSS layer c) Upper FSS layer
Figure 5- 13 Transmission responses for different shifts in FSS layers
As the fabrication of multi-layer coupled FSS structure is difficult in the limits of
the facilities, FSS models which require no bonding can be produced easily. For
0.92 0.94 0.96 0.98 1 1.02 1.04 1.06 1.08 1.1-30
-25
-20
-15
-10
-5
0
Frequency normalized to center frequency
Tra
nsm
issio
n(d
B)
dmis
=0
dmis
=0.07*p
dmis
=0.14*p
dmis
=0.21*p
dmis
=0.28*p

104
example, a complementary FSS model (see Figure 5- 14) on a single dielectric
substrate can be a good candidate in order to eliminate deficiencies related to
fabrication process. In this model, there are two metallic FSS layers on dielectric
substrate which are complement to each other, i.e. circular grid and aperture.
However, complementary FSS model is poor in terms of selectivity characteristics
with respect to the coupled aperture hybrid FSS model of Chapter 3 as illustrated in
Figure 5- 15. Even though the selectivity performance of this single layer design is
not satisfactory, this structure will be manufactured and measured to explore
whether the manufacturing capabilities are good enough for the production of
single layer structures.
Figure 5- 14 Complementary FSS model with single dielectric substrate
Figure 5- 15 Comparison of transmission responses of coupled aperture hybrid FSS
and single layer complementary FSS with single dielectric substrate
0.8 0.85 0.9 0.95 1 1.05 1.1 1.15 1.2-35
-30
-25
-20
-15
-10
-5
0
Tra
nsm
issio
n(d
B)
Frequency normalized to center frequency
Single Layer Complementary FSS
Hybrid Coupled Aperture FSS

105
CHAPTER 6
CONCLUSIONS
Design and analysis approaches for conformal frequency selective surface
structures are investigated in this study. A design methodology starting from linear
single element unit cell FSS model employing periodic features in two dimensions
and advancing to determination of FSS characteristics placed on a semi-cylinder
radome model which is finite in curved dimension and infinite in transverse
dimension. Normally, after unit cell optimizations are accomplished, performance
of FSS structure is required to be tested for finite and curved element conditions
since both may have significant effects on transmission and reflection
characteristics of FSS since diffractions from edge elements and interference
between curved FSS elements cannot be determined from the unit cell solution of a
single planar FSS structure. Nonetheless, implementations of finite model solutions
are usually not practical when the desired FSS radome models are electrically very
large, i.e. number of FSS elements is remarkably high, since full wave simulations
of those models create heavy calculation load which is mostly impossible to be
held even by high performance computers. Therefore, finite model solutions are
inefficient and time consuming, in general. To overcome the disadvantages of finite
model solution, a semi-finite solution approach is investigated in this study.
According to this approach, a semi-finite model of FSS structure is constructed
which is a semi-cylinder having a single sequence of FSS elements. Semi-finite
model has periodic boundaries in the longitudinal dimension which makes it
infinite in that direction. Dimension of the curved elements placed on rotational
axis of cylinder is finite. Illumination of semi-finite model is carried out by a linear

106
array of 31 Hertzian dipoles excited with a 20 dB Taylor distribution. Due to the
singly periodic nature of semi-finite model, Hertzian dipoles, in fact, constitute a
31 x infinite element array. As the solution environment for semi-finite models,
HFSS is used. Evaluations of the solutions are done by comparing the total and
incident total E-fields at far zone for different frequencies. For pass-band
frequencies, incident and total far fields are expected to be similar if FSS operates
appropriately for conformal configurations. Similarly, significant suppression of
incident fields is necessarily to be observed for out-of-band signals since FSS
model is reflective at these frequencies. Hertzian dipole configuration is capable of
representing in-band characteristics of FSS model since only insertion loss of FSS
radome is crucial for the source antenna. To prove out-of-band performance of
semi-finite FSS model, a comparative RCS analysis is demanded. For RCS
configuration, plane wave illumination is utilized. In this study, two methods to
compare RCS characteristics with FSS model are employed. First method includes
a PEC cylinder which is expected to have almost same RCS performance as semi-
finite FSS model for out-of-band frequencies. In the second method, a semi-
cylinder dielectric radome and a planar PEC sheet representing antenna surface
under both dielectric and FSS radome are constructed. Out of the pass-band region,
FSS radome is required to scatter the incoming waves to different directions due its
curved shape and RCS of FSS radome becomes dramatically lower with respect to
dielectric radome with planar PEC sheet.
Using design and analysis methodology described in this thesis, two band-pass FSS
models are constructed for conformal applications. First model is a hybrid FSS
structure consisting of two dielectric and three metallic layers. It operates in Ku-
band and covers a narrow-band region to transmit signals. The selectivity and
polarization independence properties of FSS model are favorable. Second structure
is a wide band FSS comprising all X-band frequencies (8.2-12.4 GHz) with a
maximum insertion loss of 0.5 dB. Both FSS models are tested with planar single
element unit cell solutions in terms of different aspects like oblique incidence, dual
polarization and different array topology conditions. Afterwards, aforementioned

107
semi-finite approach is utilized for these models both planar and curved shapes.
Analysis results demonstrate filtering performances of FSS structures for in-band
and out-of-band frequencies.
In order to prove the results of semi-finite solution for narrow-band FSS model of
Chapter 3, a finite, doubly curved semi-sphere FSS radome model is constructed
and analyzed using HFSS. Filtering properties of finite FSS model are also
observed to show good agreement with single element unit cell and semi-finite
solution approaches.
Fabrication and measurements of hybrid coupled FSS model are accomplished in
the facilities of ASELSAN. Bonding of two dielectric layers necessitates a highly
precise fabrication process since filtering mechanism of this FSS model is mainly
based on the coupling supplied by the circular aperture between outer disk patches.
As the bonding technique applied to fabricate double layer FSS structure is not
adequate, measurements and simulation results are not consistent with each other.
However, possible reasons are investigated and explained with related simulations
including fabrication effects on FSS structure.
For future works, fabrication techniques for multilayer FSS structures will
necessarily be improved. Moreover, new FSS types will be designed and fabricated
for different conformal applications with various requirements like bandwidth,
filtering characteristics, etc., using the design methodology presented in this thesis.
Fabrication of FSS patterns on fabrics or composite materials is another point of
interest in future plans since such kind of materials can easily be shaped into singly
or doubly curved structures. Design methodology and fabrication techniques will
be validated with related measurements. For future studies, numerical analysis
methods for singly or doubly curved structures as in [43] can be developed in order
to acquire conformal FSS characteristics of arbitrary shapes efficiently. Another
research topic can be the optimization of placement of FSS elements on spherical
structures at equal distances. This problem is very similar to that of electron
distribution on spherical surfaces based on energy minimization principle.

108

109
REFERENCES
[1] B. A. Munk, Frequency Selective Surfaces: Theory and Design, John Wiley &
Sons, Inc., 2000.
[2] C. A. Balanis, Antenna Theory - Analysis and Design, John Wiley & Sons, Third
Edition, 2005.
[3] A. Lazaro, A. Ramos,D. Girbau, and R. Villarino, A Novel UWB RFID Tag
Using Active Frequency Selective Surface, Antennas and Propagation, IEEE
Transactions, vol.61 , pp. 1155-1165, Mar. 2013.
[4] A. S. Barlevy, D. F. Sievenpiper, Y. Rahmat-Samii, Photonic Bandgap (PBG)
Structures of Multiple Metallic Periodic Screens: Efficient Electromagnetic
Characterization, Antennas and Propagation Society International Symposium,
IEEE, vol.2 , pp. 1216 – 1219, June 1998.
[5] H. Y. Chen, Y. K. Chou, An EMI Shielding FSS for Ku-band Applications,
Antennas and Propagation Society International Symposium (APSURSI), pp. 1-2,
July 2012.
[6] K.L. Ford, J. Roberts, S. Zhou, G. Fong and J. Rigelsford, Reconfigurable
Frequency Selective Surface for Use in Secure Electromagnetic Buildings,
Electronics Letters, Volume:49 , Issue: 14, pp. 861-863, July 2013.
[7] A. Chauraya, R. Seager, W. Whittow, S. Zhang, and Y. Vardaxoglou,
Embroidered Frequency Selective Surfaces on Textiles for Wearable Applications,
Antennas and Propagation Conference (LAPC), pp. 388-391, Nov. 2013.
[8] G. Marconi and C.S. Franklin, Reflector for use in wireless telegraphy and
telephony, U.S. Patent, 1,301,473 1919.
[9] James S. Yee, Frequency Selective Surface (FSS), U.S. Patent, 5,208,603 , 1993.
[10] F. Bayatpur, Metamaterial-Inspired Frequency-Selective Surfaces, Doctorate
Thesis, 2009.
[11] Benedikt A. Munk, Periodic Surface for Large Scan Angles, U.S. Patent,
3,789,404 1974.

110
[12] H. Zhou, S.-B. Qu, J.-F. Wang, B.-Q. Lin, H. Ma, Z. Xu, P. Bai and W.-D.
Peng, Ultra-wideband Frequency Selective Surface, Electronics Letters, vol. 48, no.
1, Jan. 2012.
[13] R. J. Langley and E. A. Parker, Double-Square Frequency-Selective Surfaces
and Their Equivalent Circuit, Electronic Letters, vol.19, no.17, pp. 675-677, 1983.
[14] D. H. Kim and J. I. Choi, Design of a Multiband Frequency Selective Surface,
ETRI Journal, vol. 28, no. 4, pp.506-508, Aug. 2006.
[15] Romeu, J., Rahmat-Samii, Y., Dual band FSS with fractal elements,
Electronics Letters, 35(9):702-703, April 1999.
[16] D. H. Werner and R. Mittra, Eds., Frontiers in Electromagnetics, Piscataway,
NJ: IEEE Press, ch. 1–3, 1999.
[17] Romeu, J., Rahmat-Samii, Y., Fractal Elements and Their Applications to
Frequency Selective Surfaces, Aerospace Conference Proceedings, vol. 5, pp. 77-
81, 2000.
[18] Benedikt A. Munk, Space Filters, U.S. Patent, 4,125,841 1978.
[19] Z. Sipus, M. Bosiljevac and S. Skokic, Analysis of Curved Frequency Selective
Surfaces,Final Report, May 2008.
[20] G. Gerini and L. Zappelli, Multilayer Array Antennas With Integrated
Frequency Selective Surfaces Conformal to a Circular Cylindrical Surface, IEEE
Transactions On Antennas And Propagation, vol. 53, vo. 6, June 2005.
[21] I. M. Ehrenberg, S. E. Sarma and B. Wu, Fully Conformal FSS via Rapid 3D
Prototyping Antennas and Propagation Society International Symposium
(APSURSI), July 2012.
[22] G. Sen, S. Mahato, T. Mandal, S. Mondal, S. Majumdar and P.P. Sarkar,
Design of a Wide Band Frequency Selective Surface (FSS) for Multiband Operation
of Reflector Antenna, 5th International Conference on Computers and Devices for
Communication (CODEC), Dec. 2012
[23] ANSYS HFSS®, <http://www.ansys.com/hfss>, Last visited on March 2014.
[24] A. Wexler, Solution of Waveguide Discontinuities by Modal Analysis, IEEE
Trans. Microwave Theory Tech., vol. 15, no. 9, pp. 508–517, Sept. 1967.

111
[25] H. Loui, Modal Analysis and Design of Compound Gratings and Frequency
Selective Surfaces, Doctorate Thesis, 2006.
[26] N. Don, A. Kirilenko, M. Bozzi, L. Perregrini , Numerical Simulation of
Frequency Selective Surfaces Perforated with Arbitrarily Shaped Apertures, Physics
and Engineering of Millimeter and Sub-Millimeter Waves (MSMW) Symposium
Proceedings, pp. 301-303, 2007.
[27] I. Anderson, On the theory of self-resonant grids, Bell Syst. Tech. J., vol. 54,
no. 10, pp. 1725-1731, Dec. 1975.
[28] C. K. Lee and R. J. Langley, Equivalent circuit models for frequency selective
surfaces at oblique angles of incidence, IEE Proc. H, vol. 132, no. 6, pp. 395–399,
Oct. 1985.
[29] X. Yao, M. Bai and J. Miao, Equivalent Circuit Method for Analyzing
Frequency Selective Surface With Ring Patch in Oblique Angles of Incidence,
Antennas and Wireless Propagation Letters, IEEE, vol. 10, pp. 820-823, Aug. 2011.
[30] R. F. Harrington, Field Computation by Moment Methods, New York, NY:
Macmillan, 1968.
[31] R. Mittra, C. H. Chan, and T. Cwik, Techniques for analyzing frequency
selective surfaces - a review, Proceedings of the IEEE, vol. 76, no. 12, pp. 1593–
1615, Dec. 1988.
[32] I. Bardi, R. Remski, D. Perry, and Z. Cendes, Plane Wave Scattering From
Frequency-Selective Surfaces by the Finite-Element Method, IEEE Transactions On
Magnetics, vol. 38, no. 2, pp. 641-644, Mar. 2002.
[33] D. B. Davidson, A. G. Smith, and J. J. van Tonder, The analysis, measurement
and design of frequency selective surfaces, in Proc. 10th International Conference
on Antennas and Propagation, vol. 1, pp. 156–160, Apr. 1997.
[34] CST Microwave Studio ® <https://www.cst.com/Products/CSTMWS>, Last
visited on March 2014.
[35] R. Pous and D. M. Pozar, A frequency-selective surface using coupled
microstrip patches, IEEE Trans. Antennas Propag., vol. 39, no. 12, pp. 1763–1769,
1991.

112
[36] H. Zhou, S. Qu, B. Lin, J. Wang, H. Ma, Z. Xu, W. Peng, and P. Bai, Filter-
Antenna Consisting of Conical FSS Radome and Monopole Antenna, IEEE
Transactions on Antennas and Propagation, vol. 60, no. 6, June 2012.
[37] H. Zhou, S. Qu, Z. Pei, J. Zhang, B. Lin, J. Wang, H. Ma and C. Gu,
Narrowband Frequency Selective Surface Based On Substrate Integrated
Waveguide Technology, Progress In Electromagnetics Research Letters, Vol. 22,
pp. 19-28, 2011.
[38] J. P. McKay and Y. Rahmat-Samii, Multi-Ring Planar Array Feeds for
Reducing DiffractionEffects in the Compact Range, AMTA Proceedings, pp. 7-3–7-
8, Columbus, OH, Oct. 1992.
[39] B. R. Mahafza, Radar Systems Analysis and Design Using MATLAB, Chapman
and Hall / CR, 2000.
[40] Data Sheet, RT/duroid® 5870 /5880 High Frequency Laminates, ROGERS
Corporation
[41] Technical Data Sheet, Loctite® 401™, Henkel Technologies, June 2007.
[42] MMS – Microwave Measurement Systems < http://www.mmstech.com/free-
space-systems.aspx>, Last visited on May 2014.
[43] C. Pelletti, G. Bianconi, R. Mittra and A. Monorchio, Analysis of Finite
Conformal Frequency Selective Surfaces via the Characteristic Basis Function
Method and Spectral Rotation Approaches, IEEE Antennas and Propagation Letters,
vol. 12, pp. 1403-1407, 2013.