Analysis and comparison of bio-oils obtained by ...
10
HAL Id: hal-01609104 https://hal.archives-ouvertes.fr/hal-01609104 Submitted on 8 Oct 2020 HAL is a multi-disciplinary open access archive for the deposit and dissemination of sci- entific research documents, whether they are pub- lished or not. The documents may come from teaching and research institutions in France or abroad, or from public or private research centers. L’archive ouverte pluridisciplinaire HAL, est destinée au dépôt et à la diffusion de documents scientifiques de niveau recherche, publiés ou non, émanant des établissements d’enseignement et de recherche français ou étrangers, des laboratoires publics ou privés. Analysis and comparison of bio-oils obtained by hydrothermal liquefaction and fast pyrolysis of beech wood Geert Haarlemmer, Chamseddine Guizani, Suzanne Anouti, Maxime Deniel, Anne Roubaud, Sylvie Valin To cite this version: Geert Haarlemmer, Chamseddine Guizani, Suzanne Anouti, Maxime Deniel, Anne Roubaud, et al.. Analysis and comparison of bio-oils obtained by hydrothermal liquefaction and fast pyrolysis of beech wood. Fuel, Elsevier, 2016, 174, p. 180-188. 10.1016/j.fuel.2016.01.082. hal-01609104
Transcript of Analysis and comparison of bio-oils obtained by ...

HAL Id: hal-01609104https://hal.archives-ouvertes.fr/hal-01609104
Submitted on 8 Oct 2020
HAL is a multi-disciplinary open accessarchive for the deposit and dissemination of sci-entific research documents, whether they are pub-lished or not. The documents may come fromteaching and research institutions in France orabroad, or from public or private research centers.
L’archive ouverte pluridisciplinaire HAL, estdestinée au dépôt et à la diffusion de documentsscientifiques de niveau recherche, publiés ou non,émanant des établissements d’enseignement et derecherche français ou étrangers, des laboratoirespublics ou privés.
Analysis and comparison of bio-oils obtained byhydrothermal liquefaction and fast pyrolysis of beech
woodGeert Haarlemmer, Chamseddine Guizani, Suzanne Anouti, Maxime Deniel,
Anne Roubaud, Sylvie Valin
To cite this version:Geert Haarlemmer, Chamseddine Guizani, Suzanne Anouti, Maxime Deniel, Anne Roubaud, et al..Analysis and comparison of bio-oils obtained by hydrothermal liquefaction and fast pyrolysis of beechwood. Fuel, Elsevier, 2016, 174, p. 180-188. �10.1016/j.fuel.2016.01.082�. �hal-01609104�
Analysis and comparison of bio-oils obtained by hydrothermalliquefaction and fast pyrolysis of beech wood
⇑ Corresponding author. Tel.: +33 438782495; fax: +33 438785251.E-mail address: [email protected] (G. Haarlemmer).
Geert Haarlemmer a,⇑, Chamseddine Guizani a, Suzanne Anouti a, Maxime Déniel a,b, Anne Roubaud a,Sylvie Valin a
aCEA-LITEN, Laboratoire de Thermo-Conversion des Bioressources, 17 rue des Martyrs, 38054 Grenoble, FrancebUniversité de Toulouse, Ecole des Mines d’Albi, CNRS Centre RAPSODEE, 81013 Albi, France
h i g h l i g h t s
� Bio-oils from beech wood by hydrothermal liquefaction and fast pyrolysis.� Physical and chemical properties of bio-oils are presented.� Bio-oils generally have a high acidity, iodine values and residual carbon.� Hydrothermal bio-oil has a high viscosity and low volatility.
Keywords:Beech woodHydrothermal liquefactionFast pyrolysisAnalysisFuel quality
a b s t r a c t
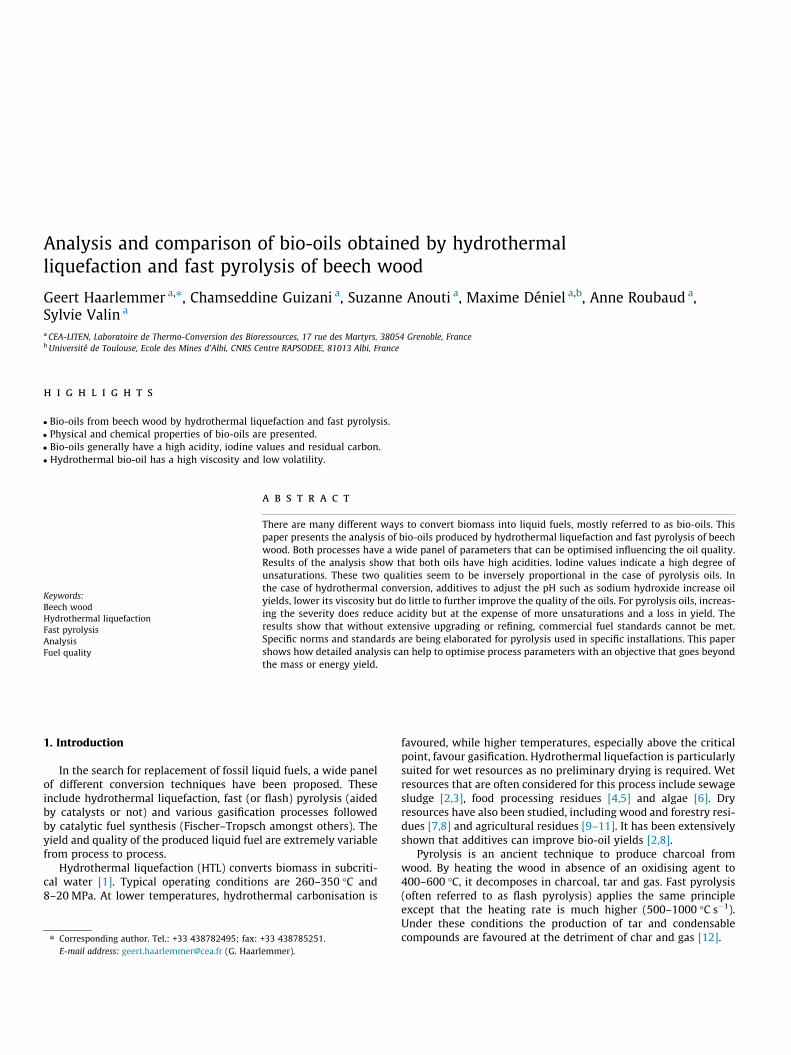
There are many different ways to convert biomass into liquid fuels, mostly referred to as bio-oils. Thispaper presents the analysis of bio-oils produced by hydrothermal liquefaction and fast pyrolysis of beechwood. Both processes have a wide panel of parameters that can be optimised influencing the oil quality.Results of the analysis show that both oils have high acidities. Iodine values indicate a high degree ofunsaturations. These two qualities seem to be inversely proportional in the case of pyrolysis oils. Inthe case of hydrothermal conversion, additives to adjust the pH such as sodium hydroxide increase oilyields, lower its viscosity but do little to further improve the quality of the oils. For pyrolysis oils, increas-ing the severity does reduce acidity but at the expense of more unsaturations and a loss in yield. Theresults show that without extensive upgrading or refining, commercial fuel standards cannot be met.Specific norms and standards are being elaborated for pyrolysis used in specific installations. This papershows how detailed analysis can help to optimise process parameters with an objective that goes beyondthe mass or energy yield.
1. Introduction
In the search for replacement of fossil liquid fuels, a wide panelof different conversion techniques have been proposed. Theseinclude hydrothermal liquefaction, fast (or flash) pyrolysis (aidedby catalysts or not) and various gasification processes followedby catalytic fuel synthesis (Fischer–Tropsch amongst others). Theyield and quality of the produced liquid fuel are extremely variablefrom process to process.
Hydrothermal liquefaction (HTL) converts biomass in subcriti-cal water [1]. Typical operating conditions are 260–350 �C and8–20 MPa. At lower temperatures, hydrothermal carbonisation is
favoured, while higher temperatures, especially above the criticalpoint, favour gasification. Hydrothermal liquefaction is particularlysuited for wet resources as no preliminary drying is required. Wetresources that are often considered for this process include sewagesludge [2,3], food processing residues [4,5] and algae [6]. Dryresources have also been studied, including wood and forestry resi-dues [7,8] and agricultural residues [9–11]. It has been extensivelyshown that additives can improve bio-oil yields [2,8].
Pyrolysis is an ancient technique to produce charcoal fromwood. By heating the wood in absence of an oxidising agent to400–600 �C, it decomposes in charcoal, tar and gas. Fast pyrolysis(often referred to as flash pyrolysis) applies the same principleexcept that the heating rate is much higher (500–1000 �C s�1).Under these conditions the production of tar and condensablecompounds are favoured at the detriment of char and gas [12].

The quality of the bio-oils produced depends on the process butalso on the resource. Typically hydrothermal oils are very viscous,strong smelling black oils with a relatively high heating value, upto 35–40 MJ/kg. Pyrolysis oils have a smoky odour, are less viscousand have a much lower heating value (similar to that of the parentbiomass). Hydrothermal oils are typically proposed as a diesel sub-stitute after catalytic upgrading [13]. Pyrolysis oils are oftenthought of as an alternative for fuel oil.
The objective of this paper is to present bio-oils produced byhydrothermal liquefaction and pyrolysis of beech wood, and tocharacterise them as much as possible. In this study, we tested var-ious analysis techniques on six different bio-oils from HTL andentrained flow pyrolysis processes. The objective is to determinevalues for some of the important properties qualifying a liquid fuel.We are interested here in determining some physical and chemicalproperties, by testing standard methods developed to characterisebiodiesel and conventional fuels.
2. Review of analysis techniques
There are many standards for commercial fuels, for heating andtransportation applications. Each application requiring fuel is typ-ically designed for a particular fuel for optimal performance. Inver-sely, most fuels target a particular application. A fuel ischaracterised with properties relevant to its application, includingmanipulation, storage and combustion. There is a very large panelof standardized tests that are applied to different fuels that arecommercially available. Some of these tests are relevant to poten-tial applications concerning bio-oils.
All commercial fuels have criteria related to storage. The iodinevalue (standard EN 14111) is determined to indicate if biodieselscontain compounds with unsaturated long chains like fatty acidsor their derivatives resulting from the conversion of lipids. Thistechnique has already been applied to pyrolysis oils [14]. The pres-ence of unsaturated compounds can produce polymerisation reac-tions during storage. Iodine value measures the amount ofunsaturation in the form of double bonds, which react with iodinecompounds. The higher the iodine number, the more C@C bondsare present in the bio-oil. The total acid number (TAN) is used asan index of fuel acidity, one of the parameters to estimate corro-sion. This is an important quality measurement to avoid corrosionrisk to machinery and storage tanks (standards EN 14104 andASTM D664). Biodiesel and pyrolysis oils are often characterisedwith this parameter [15,16].
One of the major fuel qualities is its heating value expressed byits Lower Heating Value (LHV) or Higher Heating Value (HHV)(standard NF EN 14918). Nazari et al. [17] report hydrothermalbio-oils with higher heating values in the range of 25–32 MJ kg�1.Vaporisation is the first stage in the combustion process. Someapplications require very small amounts of residual carbon aftervaporisation. This is evaluated by measuring the Conradson CarbonResidue (CCR, standards EN ISO 10370 and ASTM D4530). It isobtained after heating a fuel, and is the main indicator to identifyresidual carbon. Transportation fuels such as petrol, jet fuel anddiesel have more narrow specifications in terms of combustionproperties, for example Research Octane Number (RON, standardASTM D2699) and cetane number (standard EN ISO 5165 andASTM D613). These latter two are of little interest for bio-oils.
Ultimate analysis is not usually a criterion for fuels but doesgive interesting insights to the quality of a fuel. Typical oxygencontents for hydrothermal oils vary in the literature. Hydrothermaloils from woody biomass in batch autoclave experiments contain20–30% oxygen according to Nazari et al. [17], 34% according toDoassans-Carrère et al. [18] and Gan and Yuan report 28% oxygencontent for hydrothermal oil obtained from corn cobs [10].Continuous liquefaction reactors produce biocrudes with lower
oxygen content for similar biomasses, Elliot at al. report 12%[19,20] while Hoffman et al. report 5% for oil produced in supercrit-ical conditions. Pyrolysis oils contain more oxygen, around 50% onwater free basis according to Doassans-Carrère et al. [18] whileZhang et al. report 35–40% [21].
Few authors presenting hydrothermal oils complete theseresults in terms of functional fuel properties such as viscosity, den-sity, volatility and stability during storage. The properties of bio-oils can be easily compared with commercial standards. Thisdirects the use of bio-oils towards certain applications for exampletransport or heating.
Viscosities of HTL bio-oils are rarely mentioned in the literature,high values were found up to 1000 Pa s [7]. Furthermore, accordingto Mohan et al. [22] the viscosity of bio-oils increases due to theaging effect. It is well agreed that rheological properties of bio-oils change over time at elevated temperature by many factors likepolymerisation, oxidation and others. For pyrolysis oils much moredata is available. Studies on rheological properties and on the agingeffects of bio-oil can be performed to give an indication on howbio-oil viscosity changes upon time depending on temperatureand other storage conditions [15,23]. The fuel pumpability,assessed via the measure of viscosity (standards EN ISO 3104 andASTM D445), is another important parameter.
The characterisation of chemical species in bio-oils is often per-formed using separation techniques such as gas chromatographycoupled with mass spectrometry (GC/MS). These techniques pro-vide an indication of the chemical nature of the bio-oil but theydo not allow the quantification of all of its compounds [24,25].
Another major parameter is related to the volatility of the fuel.For storage purposes the product should be stable, vapour pressureexpressed as the Reid Vapour Pressure (standard ASTM D323)should be inferior to a certain value (seasonal parameter). The boil-ing point range and the end of the distillation (standard ASTM D86)are also important parameters to be regulated.
Characterisation by a full distillation curve (standard ASTMD86) is rarely presented for bio-oils because they are available insmall amounts at the laboratory scale. To understand the evapora-tion behaviour of bio-oils, other analysis techniques are applied,such as thermogravimetric analysis (TGA). TGA is applied to anytype of sample that will undergo a mass change over time underthe effect of temperature in a given atmosphere. The evaporationand thermal decomposition are part of the changes that will bedetected by thermogravimetry. TGA is often used to predict thethermal behaviour of the major macromolecular components ofbiomass during their thermal conversion to biofuel [26]. In otherpublished works, TGA is used to simulate distillation or to showthe volatility of products resulting from biomass conversion. Thedistillation of biodiesels produced from different vegetable oils asresources are compared in term of percentage of weight loss at dif-ferent temperatures [27]. Zhu et al. compared HTL bio-oilsobtained from different operating conditions [28]. TGA can alsobe used as an alternative method to the Conradson carbon residue(CCR) method [29].
3. Materials and methods
3.1. Biomass and chemicals characteristics
The same biomass was used to produce oils by HTL and pyrol-ysis. The biomass is beech wood supplied by SPPS company. Theraw wood is finely ground with particles having sizes ranging fromtens to a few hundreds of microns. Narrow particle distributionswere obtained by sieving. The wood water content was determinedafter drying at 105 �C according to the standard NF-EN-14774. Ashcontent was determined by burning the sample in air at 550 �C
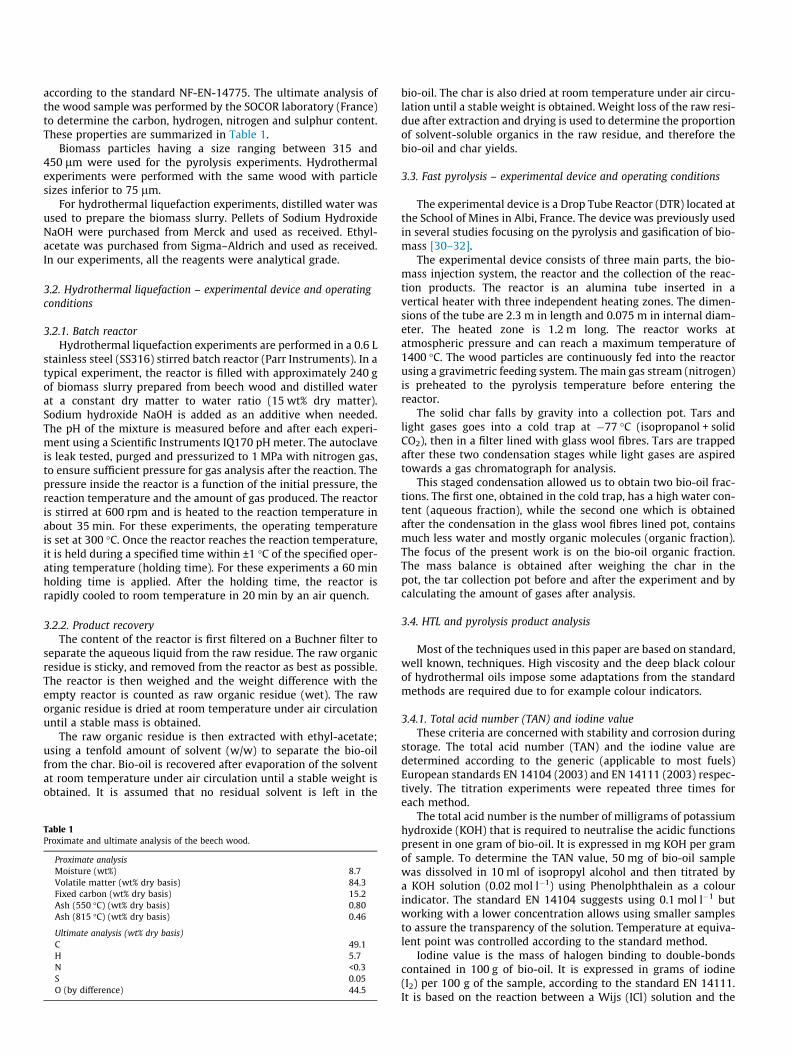
according to the standard NF-EN-14775. The ultimate analysis ofthe wood sample was performed by the SOCOR laboratory (France)to determine the carbon, hydrogen, nitrogen and sulphur content.These properties are summarized in Table 1.
Biomass particles having a size ranging between 315 and450 lm were used for the pyrolysis experiments. Hydrothermalexperiments were performed with the same wood with particlesizes inferior to 75 lm.
For hydrothermal liquefaction experiments, distilled water wasused to prepare the biomass slurry. Pellets of Sodium HydroxideNaOH were purchased from Merck and used as received. Ethyl-acetate was purchased from Sigma–Aldrich and used as received.In our experiments, all the reagents were analytical grade.
3.2. Hydrothermal liquefaction – experimental device and operatingconditions
3.2.1. Batch reactorHydrothermal liquefaction experiments are performed in a 0.6 L
stainless steel (SS316) stirred batch reactor (Parr Instruments). In atypical experiment, the reactor is filled with approximately 240 gof biomass slurry prepared from beech wood and distilled waterat a constant dry matter to water ratio (15 wt% dry matter).Sodium hydroxide NaOH is added as an additive when needed.The pH of the mixture is measured before and after each experi-ment using a Scientific Instruments IQ170 pH meter. The autoclaveis leak tested, purged and pressurized to 1 MPa with nitrogen gas,to ensure sufficient pressure for gas analysis after the reaction. Thepressure inside the reactor is a function of the initial pressure, thereaction temperature and the amount of gas produced. The reactoris stirred at 600 rpm and is heated to the reaction temperature inabout 35 min. For these experiments, the operating temperatureis set at 300 �C. Once the reactor reaches the reaction temperature,it is held during a specified time within ±1 �C of the specified oper-ating temperature (holding time). For these experiments a 60 minholding time is applied. After the holding time, the reactor israpidly cooled to room temperature in 20 min by an air quench.
3.2.2. Product recoveryThe content of the reactor is first filtered on a Buchner filter to
separate the aqueous liquid from the raw residue. The raw organicresidue is sticky, and removed from the reactor as best as possible.The reactor is then weighed and the weight difference with theempty reactor is counted as raw organic residue (wet). The raworganic residue is dried at room temperature under air circulationuntil a stable mass is obtained.
The raw organic residue is then extracted with ethyl-acetate;using a tenfold amount of solvent (w/w) to separate the bio-oilfrom the char. Bio-oil is recovered after evaporation of the solventat room temperature under air circulation until a stable weight isobtained. It is assumed that no residual solvent is left in the
Table 1Proximate and ultimate analysis of the beech wood.
Proximate analysisMoisture (wt%) 8.7Volatile matter (wt% dry basis) 84.3Fixed carbon (wt% dry basis) 15.2Ash (550 �C) (wt% dry basis) 0.80Ash (815 �C) (wt% dry basis) 0.46
Ultimate analysis (wt% dry basis)C 49.1H 5.7N <0.3S 0.05O (by difference) 44.5
bio-oil. The char is also dried at room temperature under air circu-lation until a stable weight is obtained. Weight loss of the raw resi-due after extraction and drying is used to determine the proportionof solvent-soluble organics in the raw residue, and therefore thebio-oil and char yields.
3.3. Fast pyrolysis – experimental device and operating conditions
The experimental device is a Drop Tube Reactor (DTR) located atthe School of Mines in Albi, France. The device was previously usedin several studies focusing on the pyrolysis and gasification of bio-mass [30–32].
The experimental device consists of three main parts, the bio-mass injection system, the reactor and the collection of the reac-tion products. The reactor is an alumina tube inserted in avertical heater with three independent heating zones. The dimen-sions of the tube are 2.3 m in length and 0.075 m in internal diam-eter. The heated zone is 1.2 m long. The reactor works atatmospheric pressure and can reach a maximum temperature of1400 �C. The wood particles are continuously fed into the reactorusing a gravimetric feeding system. The main gas stream (nitrogen)is preheated to the pyrolysis temperature before entering thereactor.
The solid char falls by gravity into a collection pot. Tars andlight gases goes into a cold trap at �77 �C (isopropanol + solidCO2), then in a filter lined with glass wool fibres. Tars are trappedafter these two condensation stages while light gases are aspiredtowards a gas chromatograph for analysis.
This staged condensation allowed us to obtain two bio-oil frac-tions. The first one, obtained in the cold trap, has a high water con-tent (aqueous fraction), while the second one which is obtainedafter the condensation in the glass wool fibres lined pot, containsmuch less water and mostly organic molecules (organic fraction).The focus of the present work is on the bio-oil organic fraction.The mass balance is obtained after weighing the char in thepot, the tar collection pot before and after the experiment and bycalculating the amount of gases after analysis.
3.4. HTL and pyrolysis product analysis
Most of the techniques used in this paper are based on standard,well known, techniques. High viscosity and the deep black colourof hydrothermal oils impose some adaptations from the standardmethods are required due to for example colour indicators.
3.4.1. Total acid number (TAN) and iodine valueThese criteria are concerned with stability and corrosion during
storage. The total acid number (TAN) and the iodine value aredetermined according to the generic (applicable to most fuels)European standards EN 14104 (2003) and EN 14111 (2003) respec-tively. The titration experiments were repeated three times foreach method.
The total acid number is the number of milligrams of potassiumhydroxide (KOH) that is required to neutralise the acidic functionspresent in one gram of bio-oil. It is expressed in mg KOH per gramof sample. To determine the TAN value, 50 mg of bio-oil samplewas dissolved in 10 ml of isopropyl alcohol and then titrated bya KOH solution (0.02 mol l�1) using Phenolphthalein as a colourindicator. The standard EN 14104 suggests using 0.1 mol l�1 butworking with a lower concentration allows using smaller samplesto assure the transparency of the solution. Temperature at equiva-lent point was controlled according to the standard method.
Iodine value is the mass of halogen binding to double-bondscontained in 100 g of bio-oil. It is expressed in grams of iodine(I2) per 100 g of the sample, according to the standard EN 14111.It is based on the reaction between a Wijs (ICl) solution and the

double-bonds contained in constituents of the bio-oil. Excess of theWijs reagent becomes I2 by adding potassium iodide (KI). The con-centration of formed iodine I2 is then determined by titration withsodium thiosulfate. Bio-oil samples of 90–100 mg were used foriodine value measurements.
3.4.2. GC/MS analysisGC/MS (gas chromatography/mass spectroscopy) analysis of
bio-oil was performed in Clarus 500/600S Perkin Elmer apparatus.The column used is a DB-1701 capillary column 60 m � 0.25 mm,0.25 lm film thickness. The injection of 1 ll of bio-oil samples isperformed on Split mode 10:1 with Helium as carrier gas. Theinjector temperature is maintained at 250 �C. The GC oven temper-ature is programmed from 45 �C (10 min) to 230 �C at a rate of6 �C min�1, and held at 230 �C during 9.17 min. It is then raisedto 250 �C at a rate of 10 �C min�1, held at 250 �C during 20 min.The transfer interface and the ion source in the mass spectrometerare maintained at 230 �C. Bio-oil samples dissolved in ethyl acetateare filtered with a 0.45 lm PTFE filter before analysis. The NationalInstitute of Standards and Technology (NIST) mass spectral libraryis used to identify the compounds.
3.4.3. Thermogravimetric analysisThe thermogravimetric (TG) analysis (referred to as TGA) was
conducted on a SETSYS SETARAM device using a platinum pan atatmospheric pressure. The oil is heated at 10 �C min�1 from 60 �Cto 900 �C under nitrogen flow (50 ml min�1). The final temperatureis maintained for 10 min and air is introduced (50 ml min�1) toperform the combustion stage. Sample mass of the analysed bio-oil are typically 5–6 mg. The TG curve shows weight loss as func-tion of the temperature. This gives precious information on thevolatility of the bio-oil and allows the evaluation of the carbonresidue.
3.4.4. Higher heating valueThe higher heating value HHV of bio-oils (typically samples of
0.3–0.5 g) is measured using a Parr 6200 bomb calorimeter (ParrInstruments Company).
3.4.5. Viscosity measurementsDynamic viscosity of the bio-oils is measured using a rotational
viscometer with a temperature controlled sample chamber. Theviscometer was supplied by the Sheen society; it is composed ofa sample cell placed in a thermostat adapter, and a range of differ-ent geometric spindles. A sample volume between 8 and 11 ml isrequired for each measurement depending on the spindle. The tor-que required to rotate the spindle at the required frequency ismeasured. The viscosity is calculated from torque measurementand the geometry of the spindle. In practice the measurement isreliable between 15% and 85% of the maximum torque, resultingin a limited operating window for each configuration.
Table 2Results of hydrothermal liquefaction experiments.
L1 without additives L2 with NaOH
Initial/final pH 5.4/5.5 10.2/5.6Raw residue yield (dry) 44 (±1)% 48 (±2)%Char yield 30 (±2)% 19 (±1)%Bio-oil yield 14 (±2)% 28 (±2)%Gas yield 20 (±2)% 17 (±1)%Aqueous phase by difference 36 (±3)% 35 (±2)%
3.4.6. DensityDensity is measured by two different methods. For pyrolysis
oils with a sufficiently low viscosity a known volume is filled withthe oil and weighed. Hydrothermal oils are too viscous for theprevious method to be accurate, due to presence of air bubbles per-turbing the measurement. A special density module was used on ahigh precision balance that allows the density measurement of anobject with an arbitrary shape. The method consists of weighingthe sample directly followed by a weighing under water. Thedifference in weight is created by buoyancy and represents thesample volume.
4. Results
4.1. Conversion results
4.1.1. Hydrothermal liquefactionBio-oils have been produced by hydrothermal liquefaction at
300 �C, 60 min holding time. Two different operating conditionsare presented here. In the first case (L1), HTL of beech wood wasperformed in water without any additive. In the second case (L2),0.06 g of sodium hydroxide per gram of beech wood was added.In both cases the amount of raw residue (after drying) as well asthe char and oil yields are presented (Table 2). As seen earlier inSection 3.2.2, the oil yield is the solvent soluble fraction. All yieldsare given relative to the initial mass of dry biomass used in theconversion. Each experiment was performed three times. The aver-aged value of the results is reported, the reported uncertainty is thespan in the data rather than a standard deviation.
The presence of sodium hydroxide clearly does not have anyinfluence on the final pH and on the gas production. The presenceof a strong base favours the production of oil and appears to inhibitthe formation of char. The produced gas mainly consists of carbondioxide with traces of ethane, ethylene and propane. The totalamount of organic molecules in the aqueous phase cannot beassessed directly. Due to oxygen transfers (hydration and dehydra-tion reactions) between water and the biomass and the productionof CO2, the mass balance can only be closed when the water pre-sent in the reactor is taken into account. The reported yield ofthe aqueous phase is calculated by difference as is common prac-tice in this type of study. In practice, about 35% of the initialorganic material is dissolved in the water phase.
4.1.2. Fast pyrolysisFour pyrolysis oils were produced at different temperatures
ranging between 450 �C and 600 �C. The particle size and gas resi-dence time were maintained constant at 315–450 lm and 16.6 srespectively. The biomass feeding rate was set at 1 g min�1. Thepyrolysis tests durations were between 60 and 90 min at temper-atures from 450 to 600 �C.
The results of fast pyrolysis tests are given in Table 3. The yieldof the organic fraction (analysed in the present study) is alwayslower than that of the aqueous fraction. However, this organic frac-tion is of higher interest as it contains less water and a higher con-centration of organics. The mass balances are relatively well closed.No duplicate runs were made. An assessment of all experimentaluncertainties evaluated the experimental uncertainty at 10%.
When considering the effect of the temperature on the pyrolysisproducts distribution, one can see that the lowest temperature of450 �C corresponds to the highest solid yield (40.6%) and the low-est gas yield (6.1%). At the highest temperature of 600 �C the gasproduction is maximised (51.5%), while the solid char yield is thelowest (8.2%). The production of bio-oil reaches a maximum at500 �C (62.4%) and decreases at higher temperatures. These obser-vations can be explained by the fact that the reaction kinetics ofthe wood pyrolysis reaction is relatively low at 450 �C andincreases with the temperature. The characteristic pyrolysis time

Table 3Product yields and mass balances for the different pyrolysis tests (uncertainty resultsestimated at 10%).
Yields (%) Closure(%)
Char Aqueousfraction ofthe oil
Organicfraction ofthe oil
Gas Non-condensedwater
450 �C 40.6 29.6 17.9 6.1 6.3 100.5500 �C 13.6 45.2 17.2 15.0 6.0 97.1550 �C 10.3 33.6 14.8 25.6 8.6 92.9600 �C 8.2 30.1 9.5 51.5 4.9 104.3
is about 2 s at 450 �C and decreases to 0.15 s at 600 �C leaning onthe results of [33]. The cracking kinetics of the condensable speciesincreases with temperature leading to a higher gas and lower bio-oil yields with increasing temperature.
Fig. 1. Evolution of the viscosity of hydrothermal bio-oil L1 with temperature.
Fig. 2. Evolution of the viscosity of pyrolysis oils with temperature.
4.2. Physical properties of bio-oils
Physical properties are important parameters as they relate totransport and storage. In this study we present density and viscos-ity measurements. Key values are given in Table 4. For 450 �C theresults are presented for the totally condensed phase with waterincluded, and denoted with the –Liq extension. The –Org extensionindicates the condensed organic phase. Each experiment was per-formed three times except for the viscosity that was measured onlyon one sample. The averaged value of the results is reported, thereported uncertainty is the span in the data rather than a standarddeviation.
Fig. 1 presents the evolution of the viscosity of hydrothermaloils L1 and L2 with the temperature and the frequency of the vis-cometer. The rotating viscometer can operate with a range of fre-quencies. The actual frequencies depend on the minimum andmaximum torque measurement on the motor. The viscosity ofhydrothermal oil L1 was found to be very high at room tempera-ture: at 30 �C the value was 700 Pa s and only the lowest frequencywas possible to avoid excessive torque on the motor. At highertemperatures the viscosity decreases rapidly to 520 mPa s at80 �C. For higher temperatures the full range of allowed frequen-cies was used. Hydrothermal oil L2 has a much lower viscositybut its evolution with the temperature is less pronounced. It wasobserved that the measured viscosity decreases with the frequencyand therefore the shear rate. Towards higher frequencies the vis-cosity approaches an asymptotic value. The fluid is not perfectlyNewtonian, something that is to be expected from this type ofcomplex fluids. This means that the measured value of the viscos-ity measured is not a precise data but depends on the measuringdevice. It should be taken as an order of magnitude value. The fluidbecomes more Newtonian with higher temperatures and thevalues are more precise.
The viscosities of pyrolysis oils (see Fig. 2) are much lower thanthose obtained after hydrothermal liquefaction. The viscositydecreases with increasing temperatures. As noted earlier, bio-oilP1 is the totally condensed phase from the fast pyrolysis
Table 4Physical properties of bio-oils (uncertainty is globally estimated at 10%, except when deta
Oil Density (22 �C) (kg m�3)
L1 1.14 (±0.02)L2 1.14 (±0.02)450 �C-Liq 1.1500 �C-Org 1.1550 �C-Org 1.1600 �C-Org 1.1
experiments. Its viscosity is much lower than that of the othersamples, due to the presence of a non-negligible amount of water.The presence of water is not desirable for energy recovery applica-tion; yet it decreases the oil viscosity and therefore enhances itspumpability. Bio-oils P2 to P4 are exclusively the organic fractionof the oil; the water phase is condensed independently. Thereappears to be no clear correlation between operating conditionsand the viscosities of oil P2, P3 and P4. Of the three organic frac-tions P4 appears to have the lowest viscosity. An obvious explana-tion can be found in the fact that higher pyrolysis temperatureproduces lower molecular weight molecules. At 70–80 �C the vis-cosities converge to 20 mPa s.
The evaporation behaviour is evaluated by thermogravimetricanalysis. Thermogravimetric analyses of bio-oils produced byhydrothermal conversion are presented in Fig. 3. To compare bio-oils with classic refinery streams, the thermogravimetric analyses
iled).
Viscosity @ 40 �C (mPa s) Viscosity @ 80 �C (mPa s)
67,000 (±5000) 520 (±40)2200 (±200) 210 (±10)13 770 1943 2056 40

Fig. 3. Thermogravimetric analysis of hydrothermal bio-oils.
Fig. 4. Thermogravimetric analysis of pyrolysis bio-oils.
of Iraqi heavy crude [34], diesel oil [35] as well as a light cycle oiland a heavy gas oil from Brazilian crudes [36] are presented in thesame graph. Pyrolysis bio-oils are presented in Fig. 4. Pyrolysis oilsinitially follow the diesel curve but after evaporating 50% of theirmass the evaporation slows down significantly. This indicates thatpyrolysis oils contain more high boiling point (high molecularweight) compounds. In all cases, especially for hydrothermal oils,the residual carbon after evaporation is much higher than for mostrefinery streams ranging between 11% to 13% for pyrolysis oils and17% to 24% for hydrothermal oils.
The evaporation behaviour of the bio-oils is presented in a morequantitative way in Table 5. For pyrolysis oils, the volatilitybetween 35 and 100 �C or 35 and 250 �C increases with increasingpyrolysis severity. Hydrothermal and pyrolysis oils have a compa-rable volatility below 100 �C, but hydrothermal oils appear to con-tain more high boiling compounds. Nazari et al. [17] performed asimilar experiment for hydrothermal oil produced under similar
Table 5Fractions evaporated at different temperature ranges (uncertainty estimated at 1%).
Oil 35–100 �C 35–250 �C 250–900 �C
L1 17 50 31L2 12 44 33P1-Org 17 67 22P2-Org 17 69 18P3-Org 20 70 17P4-Org 26 71 16
conditions with birch wood. Oil was obtained from solvent extrac-tion and solvent evaporation under reduced pressure. They foundmuch higher evaporation temperatures; little activity was shownunder 180 �C with a peak in the evaporation around 380 �C. At400 �C 46% was evaporated while in our oils this degree of evapo-ration is achieved at 250 �C. It is difficult to comment on the reasonfor this difference, probably due to more severe solvent evapora-tion conditions.
4.3. Chemical properties of bio-oils
All oils have been analysed for a wide spectrum of propertiessuch as total acid number (TAN), iodine value, heating value andresidual carbon after evaporation. The results are presented inTable 6. The first major observation is that the heating value ofhydrothermal oils is higher than that of pyrolysis oils and that theycontain less water. Hydrothermal oils have a higher molecularweight than pyrolysis oils; this is confirmed by their higher viscos-ity and their tendency to produce residual carbon during heatingand evaporation. Acidity of the oils depends much on the conver-sion process. The addition of a strong base in the HTL process sig-nificantly reduces the acidity of the oil (L2 compared to L1). Theash content of the bio-oils is negligible as the parent biomass con-tains very little ashes. Sodium added for the production ofhydrothermal oil L2 is mainly found in the water phase.
Higher temperatures reduce the acidity of the pyrolysis oils.This may be due to dehydration and decarboxylation reactions ofcarboxylic acids, which are thermally favoured above 450 �C[37,38]. Acetic acid can dehydrate to form water and acetic anhy-dride (reaction (1)). Moreover, thermal decomposition of aceticacid can yield formaldehyde along with carbon monoxide andethylene (reaction (2)). Finally, acetic acid is able to undergo decar-boxylation to form methane and carbon dioxide (reaction (3)). Weobserved in our experiments an increase of the formaldehyde yield,as well as of CO, CO2, CH4 and C2H4 (results not shown).
2CH3CO2H ! H2Oþ ðCH3COÞ2O ð1Þ2CH3CO2H ! 2CH2Oþ 2COþ C2H4 ð2ÞCH3CO2H ! CO2 þ CH4 ð3Þ
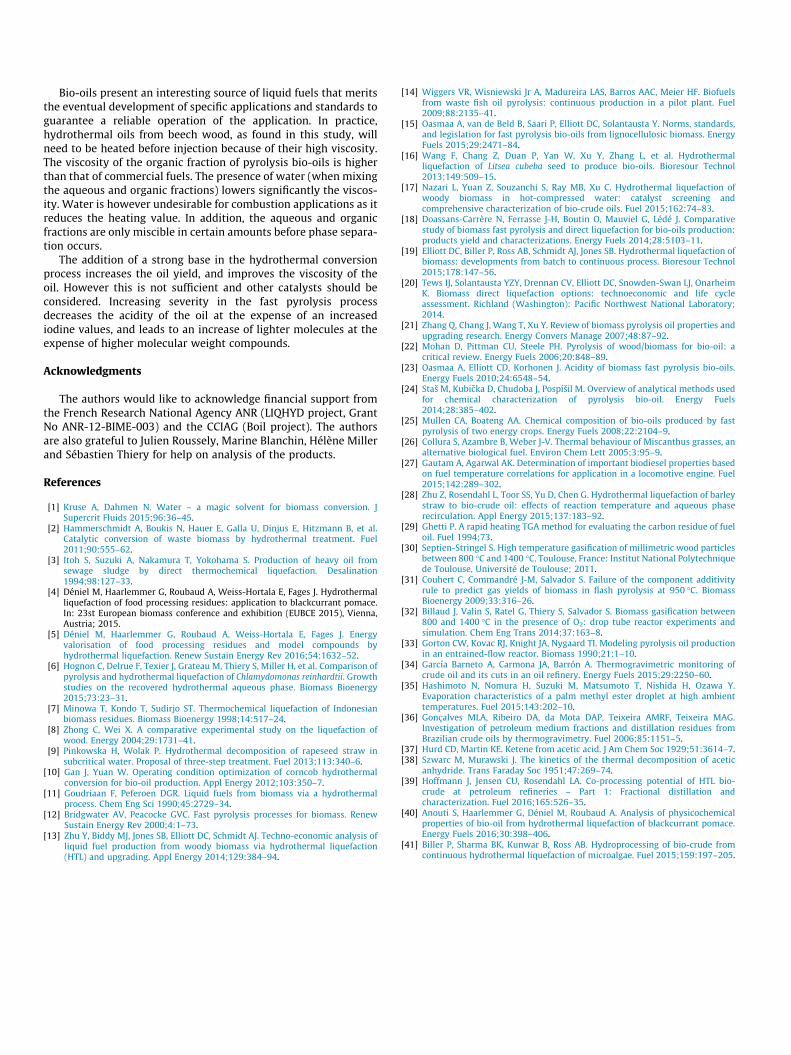
This same phenomenon can be observed when comparing theresults presented in this paper with the results from Hoffmanet al. [39]. These authors show that for hydrothermal oils producedfrom hardwood at 400 �C have a lower acidity, 37 mg KOH pergram bio-oil. Higher temperatures increase the iodine value ofpyrolysis oils, corresponding to an increase of monomeric ligninderivatives with unsaturated side-chains (see also Fig. 6).
Fig. 5 shows the GC/MS analysis of the hydrothermal oils. Thepeaks in Fig. 5 are partially identified in Table 7. In practice thereare many peaks, sometimes overlaying, which makes positive iden-tification difficult. Only compounds with a positive identificationare presented. The peaks of phenolic compounds (phenol, guaiacoland syringol) are less important, relative to the other compounds,in the oil produced in presence of sodium hydroxide. This is prob-ably due to a solubilisation of these compounds in the water phasein the presence of a strong base. However, the presence of sodiumhydroxide in the conversion process only moderately influencesthe chemical composition.
The thermogravimetric analysis shows that about 50% of thehydrothermal oil is evaporated at 250 �C, the maximum furnacetemperature of the GC/MS. This means that only half of the oil isactually evaporated in the GC/MS and therefore analysed. Manyhigh molecular weight compounds cannot be analysed. In the caseof pyrolysis oil only 30% of the oil cannot be analysed.
The GC/MS analyses of pyrolysis oils are presented in Fig. 6. Thepeaks in Fig. 6 are partially identified in Table 7. We observe that
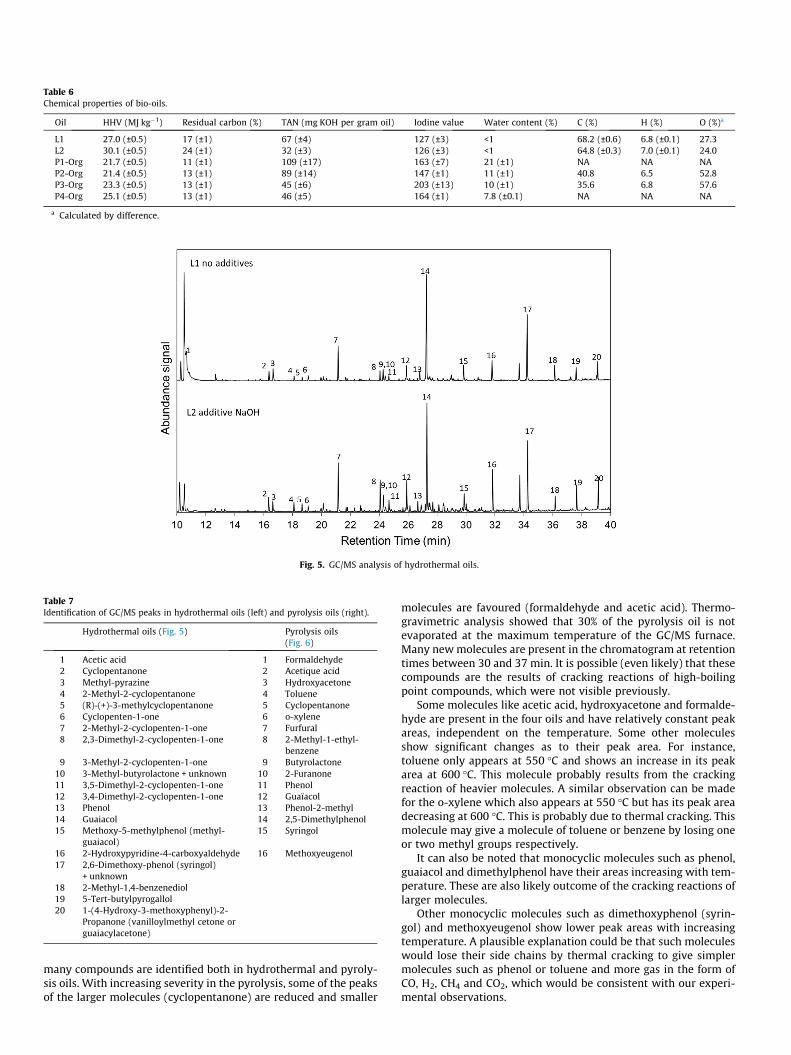
Table 6Chemical properties of bio-oils.
Oil HHV (MJ kg�1) Residual carbon (%) TAN (mg KOH per gram oil) Iodine value Water content (%) C (%) H (%) O (%)a
L1 27.0 (±0.5) 17 (±1) 67 (±4) 127 (±3) <1 68.2 (±0.6) 6.8 (±0.1) 27.3L2 30.1 (±0.5) 24 (±1) 32 (±3) 126 (±3) <1 64.8 (±0.3) 7.0 (±0.1) 24.0P1-Org 21.7 (±0.5) 11 (±1) 109 (±17) 163 (±7) 21 (±1) NA NA NAP2-Org 21.4 (±0.5) 13 (±1) 89 (±14) 147 (±1) 11 (±1) 40.8 6.5 52.8P3-Org 23.3 (±0.5) 13 (±1) 45 (±6) 203 (±13) 10 (±1) 35.6 6.8 57.6P4-Org 25.1 (±0.5) 13 (±1) 46 (±5) 164 (±1) 7.8 (±0.1) NA NA NA
a Calculated by difference.
Fig. 5. GC/MS analysis of hydrothermal oils.
Table 7Identification of GC/MS peaks in hydrothermal oils (left) and pyrolysis oils (right).
Hydrothermal oils (Fig. 5) Pyrolysis oils(Fig. 6)
1 Acetic acid 1 Formaldehyde2 Cyclopentanone 2 Acetique acid3 Methyl-pyrazine 3 Hydroxyacetone4 2-Methyl-2-cyclopentanone 4 Toluene5 (R)-(+)-3-methylcyclopentanone 5 Cyclopentanone6 Cyclopenten-1-one 6 o-xylene7 2-Methyl-2-cyclopenten-1-one 7 Furfural8 2,3-Dimethyl-2-cyclopenten-1-one 8 2-Methyl-1-ethyl-
benzene9 3-Methyl-2-cyclopenten-1-one 9 Butyrolactone
10 3-Methyl-butyrolactone + unknown 10 2-Furanone11 3,5-Dimethyl-2-cyclopenten-1-one 11 Phenol12 3,4-Dimethyl-2-cyclopenten-1-one 12 Guaïacol13 Phenol 13 Phenol-2-methyl14 Guaiacol 14 2,5-Dimethylphenol15 Methoxy-5-methylphenol (methyl-
guaiacol)15 Syringol
16 2-Hydroxypyridine-4-carboxyaldehyde 16 Methoxyeugenol17 2,6-Dimethoxy-phenol (syringol)
+ unknown18 2-Methyl-1,4-benzenediol19 5-Tert-butylpyrogallol20 1-(4-Hydroxy-3-methoxyphenyl)-2-
Propanone (vanilloylmethyl cetone orguaiacylacetone)
many compounds are identified both in hydrothermal and pyroly-sis oils. With increasing severity in the pyrolysis, some of the peaksof the larger molecules (cyclopentanone) are reduced and smaller
molecules are favoured (formaldehyde and acetic acid). Thermo-gravimetric analysis showed that 30% of the pyrolysis oil is notevaporated at the maximum temperature of the GC/MS furnace.Many newmolecules are present in the chromatogram at retentiontimes between 30 and 37 min. It is possible (even likely) that thesecompounds are the results of cracking reactions of high-boilingpoint compounds, which were not visible previously.
Some molecules like acetic acid, hydroxyacetone and formalde-hyde are present in the four oils and have relatively constant peakareas, independent on the temperature. Some other moleculesshow significant changes as to their peak area. For instance,toluene only appears at 550 �C and shows an increase in its peakarea at 600 �C. This molecule probably results from the crackingreaction of heavier molecules. A similar observation can be madefor the o-xylene which also appears at 550 �C but has its peak areadecreasing at 600 �C. This is probably due to thermal cracking. Thismolecule may give a molecule of toluene or benzene by losing oneor two methyl groups respectively.
It can also be noted that monocyclic molecules such as phenol,guaiacol and dimethylphenol have their areas increasing with tem-perature. These are also likely outcome of the cracking reactions oflarger molecules.
Other monocyclic molecules such as dimethoxyphenol (syrin-gol) and methoxyeugenol show lower peak areas with increasingtemperature. A plausible explanation could be that such moleculeswould lose their side chains by thermal cracking to give simplermolecules such as phenol or toluene and more gas in the form ofCO, H2, CH4 and CO2, which would be consistent with our experi-mental observations.

0 5 10 15 20 25 30 35 40 45
Abu
ndan
ce s
igna
l
Retention time (min)
+2E08
1
1
1
2
3,4
5
7
8
5
2
1
2
3
5
3,45,6
14
15
16
8
8
7
138
9
12
13
7
10
12
7
6
11
16
3
15
14
14
141311
P1-Org-450°C
P2-Org-500°C
P3-Org-550°C
P4-Org-600°C
Fig. 6. GC/MS analysis of pyrolysis bio-oils.
Table 8Standards for several commercial fuels and typical values found for hydrothermal and pyrolysis oils.
Diesel Biodiesel Marine heavy fuel oil Hydrothermal oil Pyrolysis oil
Standard NF EN 228 NF EN 14214 NF ISO 8217 In progressDensity at 15 �C (kg m�3) 820–845 860–900 920–1010 1.14 1.1Carbon residue (%) <0.3 <0.3 <2.5–20 17–24 11–13Total acid number (mg KOH per gram of fuel) <0.5 <0.5 <0.5 32–67 45–109Iodine value (gI2/100 g of fuel) NA <120 NA 126–127 147–203Higher heating value (MJ kg�1) 45 P35 NA 27–30 21–25Water content (%) <0.02 <0.05 <0.033 <1 8–20Viscosity at 40 �C (mPa s) 3–4 <4 8.5–690 67,000 13–70
5. Discussion
As mentioned in the introduction, commercial fuels are not gen-eric and each responds to a specific need. Norms and standards aredesigned to make sure that the application operates correctly forany commercial fuel for that particular application. Table 8 pre-sents the requirements for some commercial fuels and typical val-ues for bio-oils found in this study. From the presented results it isclear that both hydrothermal and pyrolysis oils are far from a drop-in commercial use.
In the case of hydrothermal oils, industrial applications are stillfar. The viscosity is very high and this may not be acceptable formost applications. Viscosity for hydrothermal oils produced fromblackcurrant pomace as presented by Anouti et al. [40] is muchlower. Acidity is also very high, even when the oils are producedunder basic conditions. In practice hydrothermal oils will need tobe upgraded to respond to commercial applications [41]. Theresults presented in this paper are valid for beech wood convertedin batch reactors. Other reactor technologies may and will yieldslightly different products. Projections towards other technologiesand resources are risky.
Pyrolysis oils are also far from commercial fuels. The growinginterest in pyrolysis oils and the (slow) start of commercial produc-tion has sparked off discussions to create standards for pyrolysisoils [15]. In practice due to the acidity and stability specific appli-cations will be developed. Drop in applications seem far awaywithout extensive upgrading.
The oxygen content as found in this study for both pyrolysis oilsas hydrothermal oils are comparable to those found in previous
studies as presented in Section 2. From the literature it appearsthat hydrothermal oil produced in batch reactors [17,18] containmore oxygen than oil produced in continuous reactors [19,20]. Apossible explanation may be found in the longer heating times,leading to some carbonisation before liquefaction takes place.Globally the hydrogen content of hydrothermal oils and pyrolysisoils are quite similar. The differences are in the ratio between oxy-gen and carbon, this being higher for pyrolysis oils. Hydrothermaloils may be better suited for catalytic hydro-deoxygenation. It isclear however that information on CHO alone is far from sufficientto evaluate bio-oils.
It is interesting to note that many of the same degradationproducts from lignin are found in both pyrolysis oils andhydrothermal oils. These products generate high iodine values.The limitation on the iodine value in biodiesel is due to unsatura-tions in the fatty acids leading to wax forming by polymerisation. Itappears that the test is not specific, and sterically hindered doublebonds are also indicated by this test.
6. Conclusions
This paper clearly shows that bio-oils are far from being com-mercial drop-in fuels. Both hydrothermal and pyrolysis oils sufferfrom a very high acidity. This means that storage and transfer facil-ities need to be adjusted. High iodine values also indicate potentialstorage problems. Upgrading to reduce the oxygen content (acid-ity), saturate double bonds (iodine value) and depolymerise highmolecular weight compounds (viscosity) will be unavoidable fordrop-in applications.
Bio-oils present an interesting source of liquid fuels that meritsthe eventual development of specific applications and standards toguarantee a reliable operation of the application. In practice,hydrothermal oils from beech wood, as found in this study, willneed to be heated before injection because of their high viscosity.The viscosity of the organic fraction of pyrolysis bio-oils is higherthan that of commercial fuels. The presence of water (when mixingthe aqueous and organic fractions) lowers significantly the viscos-ity. Water is however undesirable for combustion applications as itreduces the heating value. In addition, the aqueous and organicfractions are only miscible in certain amounts before phase separa-tion occurs.
The addition of a strong base in the hydrothermal conversionprocess increases the oil yield, and improves the viscosity of theoil. However this is not sufficient and other catalysts should beconsidered. Increasing severity in the fast pyrolysis processdecreases the acidity of the oil at the expense of an increasediodine values, and leads to an increase of lighter molecules at theexpense of higher molecular weight compounds.
Acknowledgments
The authors would like to acknowledge financial support fromthe French Research National Agency ANR (LIQHYD project, GrantNo ANR-12-BIME-003) and the CCIAG (Boil project). The authorsare also grateful to Julien Roussely, Marine Blanchin, Hélène Millerand Sébastien Thiery for help on analysis of the products.
References
[1] Kruse A, Dahmen N. Water – a magic solvent for biomass conversion. JSupercrit Fluids 2015;96:36–45.
[2] Hammerschmidt A, Boukis N, Hauer E, Galla U, Dinjus E, Hitzmann B, et al.Catalytic conversion of waste biomass by hydrothermal treatment. Fuel2011;90:555–62.
[3] Itoh S, Suzuki A, Nakamura T, Yokohama S. Production of heavy oil fromsewage sludge by direct thermochemical liquefaction. Desalination1994;98:127–33.
[4] Déniel M, Haarlemmer G, Roubaud A, Weiss-Hortala E, Fages J. Hydrothermalliquefaction of food processing residues: application to blackcurrant pomace.In: 23st European biomass conference and exhibition (EUBCE 2015), Vienna,Austria; 2015.
[5] Déniel M, Haarlemmer G, Roubaud A, Weiss-Hortala E, Fages J. Energyvalorisation of food processing residues and model compounds byhydrothermal liquefaction. Renew Sustain Energy Rev 2016;54:1632–52.
[6] Hognon C, Delrue F, Texier J, Grateau M, Thiery S, Miller H, et al. Comparison ofpyrolysis and hydrothermal liquefaction of Chlamydomonas reinhardtii. Growthstudies on the recovered hydrothermal aqueous phase. Biomass Bioenergy2015;73:23–31.
[7] Minowa T, Kondo T, Sudirjo ST. Thermochemical liquefaction of Indonesianbiomass residues. Biomass Bioenergy 1998;14:517–24.
[8] Zhong C, Wei X. A comparative experimental study on the liquefaction ofwood. Energy 2004;29:1731–41.
[9] Pinkowska H, Wolak P. Hydrothermal decomposition of rapeseed straw insubcritical water. Proposal of three-step treatment. Fuel 2013;113:340–6.
[10] Gan J, Yuan W. Operating condition optimization of corncob hydrothermalconversion for bio-oil production. Appl Energy 2012;103:350–7.
[11] Goudriaan F, Peferoen DGR. Liquid fuels from biomass via a hydrothermalprocess. Chem Eng Sci 1990;45:2729–34.
[12] Bridgwater AV, Peacocke GVC. Fast pyrolysis processes for biomass. RenewSustain Energy Rev 2000;4:1–73.
[13] Zhu Y, Biddy MJ, Jones SB, Elliott DC, Schmidt AJ. Techno-economic analysis ofliquid fuel production from woody biomass via hydrothermal liquefaction(HTL) and upgrading. Appl Energy 2014;129:384–94.
[14] Wiggers VR, Wisniewski Jr A, Madureira LAS, Barros AAC, Meier HF. Biofuelsfrom waste fish oil pyrolysis: continuous production in a pilot plant. Fuel2009;88:2135–41.
[15] Oasmaa A, van de Beld B, Saari P, Elliott DC, Solantausta Y. Norms, standards,and legislation for fast pyrolysis bio-oils from lignocellulosic biomass. EnergyFuels 2015;29:2471–84.
[16] Wang F, Chang Z, Duan P, Yan W, Xu Y, Zhang L, et al. Hydrothermalliquefaction of Litsea cubeba seed to produce bio-oils. Bioresour Technol2013;149:509–15.
[17] Nazari L, Yuan Z, Souzanchi S, Ray MB, Xu C. Hydrothermal liquefaction ofwoody biomass in hot-compressed water: catalyst screening andcomprehensive characterization of bio-crude oils. Fuel 2015;162:74–83.
[18] Doassans-Carrère N, Ferrasse J-H, Boutin O, Mauviel G, Lédé J. Comparativestudy of biomass fast pyrolysis and direct liquefaction for bio-oils production:products yield and characterizations. Energy Fuels 2014;28:5103–11.
[19] Elliott DC, Biller P, Ross AB, Schmidt AJ, Jones SB. Hydrothermal liquefaction ofbiomass: developments from batch to continuous process. Bioresour Technol2015;178:147–56.
[20] Tews IJ, Solantausta YZY, Drennan CV, Elliott DC, Snowden-Swan LJ, OnarheimK. Biomass direct liquefaction options: technoeconomic and life cycleassessment. Richland (Washington): Pacific Northwest National Laboratory;2014.
[21] Zhang Q, Chang J, Wang T, Xu Y. Review of biomass pyrolysis oil properties andupgrading research. Energy Convers Manage 2007;48:87–92.
[22] Mohan D, Pittman CU, Steele PH. Pyrolysis of wood/biomass for bio-oil: acritical review. Energy Fuels 2006;20:848–89.
[23] Oasmaa A, Elliott CD, Korhonen J. Acidity of biomass fast pyrolysis bio-oils.Energy Fuels 2010;24:6548–54.
[24] Staš M, Kubicka D, Chudoba J, Pospíšil M. Overview of analytical methods usedfor chemical characterization of pyrolysis bio-oil. Energy Fuels2014;28:385–402.
[25] Mullen CA, Boateng AA. Chemical composition of bio-oils produced by fastpyrolysis of two energy crops. Energy Fuels 2008;22:2104–9.
[26] Collura S, Azambre B, Weber J-V. Thermal behaviour of Miscanthus grasses, analternative biological fuel. Environ Chem Lett 2005;3:95–9.
[27] Gautam A, Agarwal AK. Determination of important biodiesel properties basedon fuel temperature correlations for application in a locomotive engine. Fuel2015;142:289–302.
[28] Zhu Z, Rosendahl L, Toor SS, Yu D, Chen G. Hydrothermal liquefaction of barleystraw to bio-crude oil: effects of reaction temperature and aqueous phaserecirculation. Appl Energy 2015;137:183–92.
[29] Ghetti P. A rapid heating TGA method for evaluating the carbon residue of fueloil. Fuel 1994;73.
[30] Septien-Stringel S. High temperature gasification of millimetric wood particlesbetween 800 �C and 1400 �C. Toulouse, France: Institut National Polytechniquede Toulouse, Université de Toulouse; 2011.
[31] Couhert C, Commandré J-M, Salvador S. Failure of the component additivityrule to predict gas yields of biomass in flash pyrolysis at 950 �C. BiomassBioenergy 2009;33:316–26.
[32] Billaud J, Valin S, Ratel G, Thiery S, Salvador S. Biomass gasification between800 and 1400 �C in the presence of O2: drop tube reactor experiments andsimulation. Chem Eng Trans 2014;37:163–8.
[33] Gorton CW, Kovac RJ, Knight JA, Nygaard TI. Modeling pyrolysis oil productionin an entrained-flow reactor. Biomass 1990;21:1–10.
[34] García Barneto A, Carmona JA, Barrón A. Thermogravimetric monitoring ofcrude oil and its cuts in an oil refinery. Energy Fuels 2015;29:2250–60.
[35] Hashimoto N, Nomura H, Suzuki M, Matsumoto T, Nishida H, Ozawa Y.Evaporation characteristics of a palm methyl ester droplet at high ambienttemperatures. Fuel 2015;143:202–10.
[36] Gonçalves MLA, Ribeiro DA, da Mota DAP, Teixeira AMRF, Teixeira MAG.Investigation of petroleum medium fractions and distillation residues fromBrazilian crude oils by thermogravimetry. Fuel 2006;85:1151–5.
[37] Hurd CD, Martin KE. Ketene from acetic acid. J Am Chem Soc 1929;51:3614–7.[38] Szwarc M, Murawski J. The kinetics of the thermal decomposition of acetic
anhydride. Trans Faraday Soc 1951;47:269–74.[39] Hoffmann J, Jensen CU, Rosendahl LA. Co-processing potential of HTL bio-
crude at petroleum refineries – Part 1: Fractional distillation andcharacterization. Fuel 2016;165:526–35.
[40] Anouti S, Haarlemmer G, Déniel M, Roubaud A. Analysis of physicochemicalproperties of bio-oil from hydrothermal liquefaction of blackcurrant pomace.Energy Fuels 2016;30:398–406.
[41] Biller P, Sharma BK, Kunwar B, Ross AB. Hydroprocessing of bio-crude fromcontinuous hydrothermal liquefaction of microalgae. Fuel 2015;159:197–205.