Analysing the link between CEO remuneration and performance
59
1 The University of Nottingham Analysing the link between CEO remuneration and performance: A stochastic frontier approach Ahmed Mir Finance and Investment MSc
Transcript of Analysing the link between CEO remuneration and performance

1
The University of Nottingham
Analysing the link between CEO remuneration and performance: A
stochastic frontier approach
Ahmed Mir
Finance and Investment MSc

2
Abstract1:
This study utilises an unbalanced panel data set of 41 U.K building societies from 1998 to
2011, examining the relationship between cost efficiency and CEO salary. Using maximum-
likelihood I estimate the parameters of a stochastic cost frontier under a transcendental
logarithmic functional form. The stochastic frontier analysis finds that on average building
societies in the sample operate with a mean cost inefficiency of 18%. The latter stages of
the investigation involve a regression analysis, which estimates the correlation between
the cost efficiency of a smaller sample of building societies and CEO salary. Ultimately, the
evidence presented in this paper finds that efficiency does not have a statistically
significant impact on CEO remuneration but firm size has a substantial influence on
executive pay levels.
1 I would like to thank Dev Vencappa, my supervisor for this project, for his support and
guidance; especially regarding the econometric analysis. In addition, I would like to thank
the University of Nottingham for providing the opportunity to complete the degree of
Finance and Investment MSc

3
Contents Page
1. Introduction .................................................................................................................................. 4
2. Review of the Literature ............................................................................................................... 6
2.1 Data Envelopment Analysis and Stochastic Frontier Analysis .................................................... 6
2.2 Executive Compensation ............................................................................................................. 8
2.3 Previous Studies Exploring Efficiency: Building Societies .......................................................... 11
2.4 Other Mutual Organisations ..................................................................................................... 17
2.5 Banks ......................................................................................................................................... 18
2.6 Determinants of Executive Compensation ................................................................................ 19
2.7 Remarks Regarding the Previous Litreature ............................................................................. 22
3. Methodology and Data ............................................................................................................... 23
3.1 Stochastic Frontier Modelling ................................................................................................... 24
3.2 The Cost Function ...................................................................................................................... 25
3.3 Maximum-Likelihood Estimation and the Half Normal Model ................................................. 26
3.4 The Stochastic Cost Frontier ...................................................................................................... 30
3.5 Input and Output Choice ........................................................................................................... 31
3.6 Cost Function Formulation ........................................................................................................ 34
3.7 CEO Compensation and Efficiency ............................................................................................ 35
4. Empirical Results ......................................................................................................................... 39
4.1 Efficiency and CEO Remuneration ............................................................................................. 44
4.2 Discussion .................................................................................................................................. 46
5. Concluding Remarks .................................................................................................................... 47
7. Appendix ......................................................................................................................................... 50
8. Bibliography ................................................................................................................................ 54

4
1. Introduction
For decades economists have queried the implications of inefficiency on profitability.
Competitive pressure across the financial services industry hand in hand with new and
more stringent economic regulation has reinforced the strategic requirement of efficiency.
Early on, Demsetz (1973) defined the relationship between efficiency and performance,
describing that more productively efficient firms hold a competitive advantage over their
rivals, often resulting in a higher level of profitability. More recently, academia has applied
various models to estimate efficiency on both a firm and industry level. However, the
majority of this research has still failed to analyse mutual firms such as building societies.
Conversely, the diverse level of research examining the compensation top level executives
has publicised the sometimes absurdly high pay packets of executive management. The
debate has been further amplified by economic crises such as the financial crisis of the last
decade and the now long running Eurozone crisis; spotlighting inflated director pay. For
years policymakers, practitioners and academics alike have questioned if the increasing
disparity between executive remuneration and the average wage are in line with owner
interests. Over the years theorists have attempted to explain the phenomenon of
executive remuneration, where classical economists favour the theory of profit
maximisation and on the other hand managerialists support the theory of corporate
growth (Ciscel & Carrol, 1980). Given that chief executive posts on average require high
levels of experience, and with many chief executive officers (CEOs) holding a professional
qualification to supplement their experience it is understandable that they are
compensated beyond the level of an average employee. However, current evidence
suggests that a CEOs in the FTSE 100 index (UK) can expect on average to receive a

5
remuneration package of in excess £4 million in 2010; a growth of over 400 % since 1998
(The Economist, 2012). The implications of such exorbitant pay packages are not merely a
moral issue but can be considered an economic problem, with high levels of compensation
becoming common place it is important to examine if pay is at all linked to firm
performance. Although, the debate regarding the pay to performance relationship was
popularised over two decades ago, research tackling the relationship between efficiency
and executive compensation is relatively limited to banks and other large public limited
companies.
This paper seeks to add to the current literature by providing an in depth focus on the
relationship between cost efficiency and CEO compensation in the UK building society
sector. By using stochastic frontier analysis this paper will evaluate the cost efficiency of UK
building societies; employing a pooled unbalanced panel data set of up to 13 years on a
sample of 41 building societies; originating from bankscope data. Panel data will provide in
depth evidence in regards to performance, permitting for the tracking of efficiency across
different firms in different years; unlike cross sectional data which only provides a
snapshot (Kumbhakar and Lovell, 2000).
This paper is structured as follows. The next section reviews relevant literature, followed
by a section explaining the methodology used in this paper and discussing data
requirements. Thereafter the paper discusses the estimated cost efficiency scores found
by the econometric analysis and ultimately discussing relationship between cost efficiency
and CEO salary.

6
2. Review of the Literature
Modern microeconomic theory treats producers as successful optimisers, producing the
maximum level of outputs from a given set of inputs. However, it is important to note that
many producers may attempt to minimise input to output ratios, but most do not succeed
in being completely efficient (Kumbhakar and Lovell, 2000). To understand inefficiency
and the theory of production there has been an inflow of methods analysing the
relationship between the inputs and outputs of a firm.
Academia has analysed the subject of executive compensation since the early 1990s with
Jensen and Murphy (1990a) providing one of the most influential studies at the time in
regard to CEO pay. Much of this work has focused on how total CEO compensation is
correlated to firm performance. There are various different proxies for performance,
financial ratios for example; such as return on assets, return on equity and net interest
margin. On the other hand, empirical applications to frontier techniques analysing the
efficiency of firms can also be considered as performance measurement (Baten and Kamil,
2010).
2.1 Data Envelopment Analysis and Stochastic Frontier Analysis
The most popular methods used in efficiency analysis today are extensions of the work
carried out by Farrell (1957), where his ground-breaking research employed linear
programming methods generating a measure for productive efficiency, in addition to
providing a definition for a production frontier. The work by Farrell (1957) was the
foundation upon which Charnes et al (1978) formed the non-parametric technique, Data
Envelopment Analysis (DEA). This technique uses the ratio of inputs to outputs to plot an

7
efficient frontier, which illustrates the most efficient allocation of x inputs to produce y
outputs; where the closer an observation is to the frontier the more efficient it is.
However, DEA fails to observe random events which can impact on the efficiency of a firm,
for example insufficient rain in the right season can reduce a paddy farmers harvest; this is
out of the producers control and not as a result of inefficiency. However, DEA does not
recognise the difference between random noise and inefficiency as it is a deterministic
frontier method and as such any deviation from the efficient frontier is considered as
inefficiency.
Aigner et al, 1977; Meeusen et al 1977 proposed an alternative technique, Stochastic
Frontier Analysis (SFA). This method has the ability to differentiate random errors from
inefficiency is now widely accepted as the benchmarked econometric alternative. It
consists of the estimation of a stochastic frontier, where output is bound by a function of
known inputs, inefficiency and a random error; this is usually in order to plot a cost or
production function (Battese & Coelli, 1995). Similarly to DEA the objective is for firms to
reside as close to or on the given frontier as possible. Although, whilst SFA can separate
genuine inefficiency from random noise DEA has the advantage of requiring no functional
form to estimate the frontier, mitigating the possibility that a functional form may be
unwarranted or too simple. However, the deterministic nature of DEA consequently results
in the failure to allow for statistical inference. Nonetheless, DEA is still a popular method
of efficiency measurement in management science (Kumbhakar and Lovell, 2000).
Frontier functions estimate the maximum possible output given a set of inputs, or the
minimum cost of a set out outputs; usually to estimate production or cost functions. From
the perspective of producers this is crucial to estimate how much output can be produced

8
given an amount of inputs; where production functions mathematically define this
relationship in order to specify the various technical possibilities which are open to
producers (Heathfield & Wibe, 1987). It is recognised that efficiency measures which
employ frontier techniques have advantages over the alternative of accounting ratios
(Beccalli et al, 2006). For example, financial ratios do not consider inputs and the
combination of outputs (Berger & Humphrey, 1992). In addition, a frontier method
provides a concise and clear numerical score complete with ranking (Berger & Humphrey,
1997). Nonetheless, these topics will be discussed in further detail in the methodology
section of this paper.
2.2 Executive Compensation
Academia has attempted to explain the concepts behind CEO remuneration by proposing
different theories and hypothesising various assumptions. This sub-section reviews some
of the many theories documented in the wider literature. These include neo-classical
theory of the firm, the principal agent model, managerial power theory, human capital
theory, tournament theory, social comparison models and information processing theory.
Although, in respect to performance the majority of research focuses on the pioneering
work of Jensen and Meckling (1976) which aggregated the issues identified by previous
researchers to suggest their theory of the firm by defining agency theory; also known as
the principal agent model.
According to neo-classical economic theory the primary objective of a firm is to profit
maximise, consequently maximising the return for the owners. However, due to
constraints in corporate governance often managers maximise their own utility rather than
that of owners (Williamson, 1986). In contrast, work by Festinger (1954) describes a

9
theory of social comparison to explain the determination of executive pay. Where pay for
top level management is benchmarked to compensation levels for comparable positions at
other firms. This prospective utilises consistent peer group comparisons to ensure that pay
is kept in line with competitors. O'Rielly III et al (1988) argue that such relative comparison
is possible as some members of remuneration committees for one company may be
corporate executives of other companies. Their results are consistent with social
comparison theory as their research concludes that CEO compensation is positively related
to the pay of the members of the remuneration committee.
Another hypothesis is the corporate growth theory, which suggests that the size of the
company has a larger impact on executive salary than the profitability of that company.
Cosh (1975) supports this suggestion, documenting that size has a larger impact than
profitability for determining pay. In contrast, Meek and Whittington (1975) argue that
profitability and growth are equal determinants of executive remuneration. Conversely,
the human capital model (Becker, 1975) suggests that executive compensation is
determined by personal factors such as qualifications, age, experience and training. Under
this theory any differentials in pay between executives is down to observed differences in
their personal attributes which impact upon their ability (Shiwakoti et al, 2004).
Tournament theory proposed by Lazear and Rosen in 1981, suggests that the pay structure
of a CEO is not based not upon firm or individual performance but by the position of the
executive in the firms’ hierarchy. Suggesting that the compensation a CEO receives may
surpass the pay his marginal product warrants but still be considered economically
efficient (Main et al, 1993). Such a theory works on the premise that those lower down the
ladder command a lower wage than their marginal product of labour, this disparity in

10
salary provides incentives for employees to compete for promotion to positions of higher
responsibility such as chief executive; which are seen as prizes for long term commitment
(Lazear and Rosen, 1981).
The last but probably most researched theory is the agency problem. The foundations of
agency theory are defined by a simple relationship between two parties, where one party
(the principal) delegates tasks to another party (the agent), who then carries out these
tasks. The principal agent model attempts to resolve conflicts of interest between these
two parties in terms of employment contracts (Jensen and Meckling, 1976). It seeks to
understand how to create a partnership between the two parties to ensure that the
objectives set by the principal are met by offering the agent incentives to ensure that the
agents personal objectives do not hinder the goals of the principal. For example, in public
limited companies it is a common problem that managerial objectives may vary from
shareholder objectives, creating a conflict of interest. The influential paper by Jensen and
Meckling (1976) discusses how ownership and control are separated; an issue which
underpins the classical agency model. In the words of Shleifer and Vishny (1997) managers
may use their power in order to personally benefit themselves, for example managers may
wish to build their own empire (a common topic in M&A) or follow entrenchment
strategies which do not maximise shareholder wealth. In order to ensure this is not the
case, the principal is required to set incentives which ensure the agent does not divert to
peruse goals which maximise his own utility rather than that of the owners. This is in the
form of a contract, designed to optimally maximise the combined utility of both the agent
and principal; this is by ensuring that the maximisation of shareholder objectives coincide
with incentives that will maximise the agents’ utility. Whatever the case, it is a

11
requirement that the agent is monitored beyond simply reviewing performance targets,
but by setting restrictions on executable actions by the agent (Jensen and Meckling, 1976).
2.3 Previous Studies Exploring Efficiency: Building Societies
As mentioned earlier, the concept of efficiency measurement can be attributed to Farrell
(1957) where his non parametric approach defined the estimation of productive efficiency
as the calculation of the maximum amount of outputs a firm can produce from the least
amount of inputs (technical efficiency), and by using inputs in optimal proportions; in other
words producing to where the marginal benefit of a good equals the marginal cost of
production (allocative efficiency). Since Farrell (1957) a large variety of studies have
explored the efficiency of firms and industries, ranging from scale efficiency to economic
efficiency2. However, examples of studies exploring the mutual organisations sector,
especially building societies are relatively limited. Nonetheless, table 1 provides a summary
of studies within this sector.
2 A firm is said to be economically efficient if it is both technically and allocatively efficient
(Kumbhakar and Lovell, 2000)

12
Author(s) Research Title Sample Technique Type of Efficiency Measured
Inputs and Outputs Specified Research Conclusions
Field (1990) Production efficiency of British building societies.
71 U.K building societies, cross sectional data – 1981.
DEA Technical and scale
Full-time labour, equipment value and the number of offices. value of deposits and newly or previously advanced mortgages
Significant negative relationship between size and technical efficiency. Estimated 14 percent of firms in the sample productively efficient and 61 percent of the sample operating inefficiently as a result of scale inefficiency.
Drake and Weyman-Jones (1992)
Technical and scale efficiency in UK building societies.
76 U.K building societies, cross sectional data – 1988.
DEA Technical and scale
Average employee wage and capital input price (expenditure of equipment and buildings divided by mean asset value), and the price of leverage (interest paid divided by the total leverage value). Total assets (consumer and commercial loans, mortgage sales, mortgages and mortgage servicing) and operating income
41 percent of firms scale efficient, whereas 61 percent of sample technically efficient.
Mckillop and Glass (1994)
A cost model of Building Societies, Producers of Mortgage and Non-Mortgage Products.
89 U.K building societies, cross sectional data – 1991.
SFA Cost Capital input price (expenditure on premises and equipment divided by mean value of assets), Labour input price (average employee wage) and the price of borrowed funds (interest expenses divided by value of borrowed funds). Outstanding mortgages and other commercial assets.
Evidence of significant augmented economies of scale for local and national building societies. Whereas constant returns to scale for building societies operating regionally. Overall, varying deviations in cost efficiency across mortgage and non-mortgage products in local, regional and national building societies.
Table 1: A Summary of Studies Analysing the Efficiency of Building Societies

13
Author(s) Research Title Sample Technique Type of Efficiency Measured
Inputs and outputs Research Conclusions
Piesse and Townsend (1995)
The Measurement of Productive efficiency in UK building societies.
57 U.K building societies, cross sectional data – 1992.
DEA Productive Tangible fixed assets, management expenses, number of branches, number of full time equivalent staff, interest paid on non-retail capital and interest paid on retail capital Number of depositors, number of borrowers, profit, interest earned from liquid assets and interest earned from mortgages
Diseconomies of scale present in larger firms, with only six building societies on the efficient frontier. 77 percent of sample operating with diseconomies of scale.
Drake and Weyman-Jones (1996)
Productive and allocative inefficiencies in U.K. building societies: A comparison of non-parametric and stochastic frontier techniques.
48 U.K building societies, cross sectional data – 1988.
DEA and SFA
Productive and allocative
The price of labour, the value of retail funds and deposits, the value of non - retail funds and deposits, the price of funds (interest payments divided by the book value of the sum of retail and wholesale funds) and the price of capital (administration and office expenses divided by total assets). Value of mortgage loans, commercial assets and liquid asset holdings beyond capital requirements.
DEA estimated overall mean inefficiency score of between 12 and 13 percent, where most of this inefficiency consisted of allocative inefficiencies. SFA score supplemented the DEA score and ultimately indicated that there was a negative relationship between size and technical and scale efficiency.

14
Author(s) Research Title Sample Technique Type of Efficiency Measured
Inputs and outputs Research Conclusions
Esho and Sharpe (1996)
X-efficiency of Australian permanent building socities.
20 Australian building societies, panel data from 1974 to 1990.
SFA X-Inefficiency
Cost of funds and a wage index (similar to the price of labour). Average house loans, average deposits, total government and other securities, other loans and fixed assets.
High levels of estimated X – inefficiency across the sample and larger organisations exhibit cost savings from economies of scale.
Ashton (1997)
Cost efficiency and UK building societies. An econometric panel-data study employing a flexible Fourier functional form.
99 U.K building societies, panel data from 1990 to 1995.
SFA Cost Price of labour (total wage divided by the number of full time employees), price of capital (aggregation of property and equipment rentals and depreciation divided by the quantity of physical capital), price of deposits (total interest payable divided by the quantity of deposits including retain and non-retail costs). Mortgage loans and non-mortgage advances.
Mean efficiency estimated at 76 percent using flexible Flourier form, whereas 72.2 percent using translog form.

15
Author(s) Research Title Sample Technique Type of Efficiency Measured
Inputs and outputs Research Conclusions
Worthington (1998)
Efficiency in Australian building societies: An econometric cost function approach using panel data.
22 Australian building societies, panel data from 1992 to 1995.
SFA Cost Price of physical capital (sum of physical capital expenditures divided by the book value of net total office premises and equipment). Price of deposits (total interest expense divided by total deposits and other borrowings). Price of labour (total expenditures on employees divided by the number of full-time employees). Personal loans, property loans, commercial loans and other securities.
Mean inefficiency score of 21 percent. Branch or agency networks have a large impact on overall efficiency; where an extensive branch network diminishes the ability of the head office to ensure cost efficiency.

16
Table one outlined studies which analyse the efficiency of building societies and although
each study focused on the same industry there was a variety of approaches taken to input
and output specification. Given the large variety of literature on the subject of efficiency it
is puzzling that there is no widely accepted consensus on input and output choice.
Previously, the majority of studies which focus on building society efficiency have adopted
the intermediation approach (Hardwick, 1990; Drake & Weyman-Jones, 1996; Ashton,
1997). The intermedation approach (Sealey & Lindley, 1976) views financial institutions as
the intermediatory in between the supply and demand of funds (Casu & Molyneux, 2003).
Here, inputs are usually labour and capital costs, interest expenses on total funds
(including customer accounts) and output is measured by loans and assets.
Although not as popular as the intermediation method, other approaches also exist. For
example, the production approach (Piesse and Townsend, 1995), where deposit taking
institutions are assumed to keep customer deposits, issue mortgages and other loans, in
addition to managing other financial assets and overseeing customer transactions (Berg et
al, 1993). Less empirically tested specifications, include the asset approach (Drake and
Weyman-Jones, 1992) and the value added approach. The asset approach is similar to the
intermediation approach but outputs are specified in terms of loan assets, the latter
identifies inputs and outputs in terms of their value added to the firm.
Ultimately, the intermediation approach dominates the non-bank financial institution
literature. This is usually the result of problems collecting accurate (sensitive) data, which
are associated with the other approaches (Worthington, 1999). Although in terms of
mutual organisations it is important to note that building societies which operate as a
mutual service provider the behavioural assumption of profit maximisation (which is

17
associated with the intermediation approach) may no longer apply, as the objective of a
mutual can be recognised as maximising the services provided to its members (Fried et al,
1993)
2.4 Other Mutual Organisations
Other mutually run firms such as mutual credit unions and savings and loans associations
(S&Ls) have also been investigated for inefficiencies; although in this section we only
provide a limited summary (for a review of the current literature see Worthington, 2011).
For example, Mester (1993) applied SFA to analyse the efficiency of a large sample set of
over 1,000 S&Ls. This large study used the wage rate (labour expenses divided by number
of full time employees), price of deposits (interest expense divided by the total value of
deposits) and price of physical capital (office occupancy and equipment expense divided by
total office assets) as inputs. Output parameters were specified as mortgages, securities
and other investments, commercial and consumer loans. The study concluded that publicly
owned S&Ls are less efficient than mutually operated S&Ls. Additionally, Mester (1993)
notes that there is a correlation between a higher capital asset ratio and greater efficiency.
Similarly, Worthington (1999) utilised a stochastic frontier approach to analyse the
efficiency of 150 Australian credit unions. In this study inputs were defined as the price of
physical capital (total outlay on office and equipment divided by the book value of office
premises and equipment), and the price of labour (total outlay on employees divided by
the number of full time employees). Output was measured by deposit securities and other
investments, personal, property and commercial loans. His research indicated that a large,
financially stable credit union with a small number of branches is more efficient than
smaller credit unions. This result provides a stark contrast from previous research by

18
Cebenoyan et al (1993) in which the coefficient for the number of branches was found to
be insignificant on efficiency.
2.5 Banks
Banks have received widespread criticism in regard to their recent handling of the financial
crisis and the high level of bonuses which are associated with the banking industry,
especially investment banks. As banks operate in the same market as building societies
but simply undertake more risky activity it is essential to provide some of the current
literature around the topic.
Since the single market initiative the European banking industry has undergone major
changes in an effort to conform to a more efficient benchmark (Altunbas et al, 2001).
Altunbas et al (2001) used a stochastic frontier model to investigate the efficiency of the
European banking industry, their research focused on estimating scale economies, X-
inefficiencies and technical change from 1989 to 1997 for a large sample of European
banks. This study used the price of labour, price of funds and the price of physical capital as
banking inputs. As is the usual method with other similar studies which use Bankscope for
data collection this research used a proxy for the number of employees as total assets,
where the cost of labour was measured as total personnel expenses divided by total assets.
Their analysis concluded that typically, scale economies are between the 5% to 7% mark,
whereas X-inefficiencies are much larger, between the 20% and 25% mark. Although, X-
inefficiencies appear to vary with the size and market of the bank; suggesting that banks of
all sizes can achieve a more efficient standard through reducing the reported inefficiencies.

19
The evaluation of efficiency has also proved popular among academics in the United
States. For example, Berger & Mester (1997) analysed the differences in the efficiencies
across the US banking industry, examining three concepts in efficiency; cost, alternative
profit and standard profit efficiency. Their research indicated that there are scale
economies for banks with a much larger size than indicated in the previous literature.
This section has only provided a limited summary in respect to banking efficiency, for a
further in depth analysis on banking efficiency see Berger et al, 1993, 2000; Resti, 1997 and
Vander Vennet, 2002.
2.6 Determinants of Executive Compensation
“There is a strong prima facie case that inappropriate incentive structures played a role in
encouraging behaviour which contributed to the financial crisis” (Turner, 2010, p. 80).
The issue of executive compensation is a controversial and a highly documented topic in
previous academic literature; with a variety of research based upon companies in the UK
(Cosh, 1975; Conyon, 1995, 1997, Ingham and Thompson, 1993; 1995 and McKnight,
1996). Across the wider literature there is a large focus on the sensitivity to firm
performance (for example Shiwakoti et al 2004;Gregg et al 2005; Ozkan, 2007; Nourayi and
Mintz, 2008). Even still, research examining the pay to performance relationship across
mutual organisations has been far from rigorous. Notably, two studies by Ingham and
Thompson (1993) and (1995) examined the determinants of CEO compensation in the UK
building society sector. The earlier paper employed a sample of 52 building societies across
two years, concluding that firm size (proxied by total assets) is the most influential
component determining CEO salary. Their more recent paper found evidence of only a

20
weak positive relationship between performance and executive remuneration, suggesting
that age has a larger impact on pay. In addition, their work indicated a negative
relationship between the size of the mutual and performance; Ingham and Roberts (1995)
put this down to deregulation within the industry. Their research concluded that as a
mutual company who do not issue shares they face weaker market controls, which causes
a misalignment of owner and CEO interests.
Understanding the empirical relationship between pay to performance can be accredited
to research by Jensen and Murphy (1990a), their influential paper used a sample of over
2500 CEOs across a fourteen year time period; documented that the pay to performance
sensitivity3 (PPS) had weakened over the last sixty years or so. Jensen and Murphy (1990b)
argued that “in most publicly held companies, the compensation of top executives is
virtually independent of performance” (Jensen & Murphy, 1990b, p. 138). Their work
suggested that companies which exhibit a higher sensitivity of pay to performance perform
better overall than those with a lower elasticity of pay to performance (Jensen & Murphy,
1990b). More recent UK studies by Gregg et al (1993) and Conyon (1995) have reinforced
earlier findings by Jensen and Murphy (1990a). With Gregg et al (1993) concluding that
there is a weak positive link between executive remuneration and corporate performance.
In contrast, a UK study by McKnight (1996) suggested that the relationship between
executive compensation and firm performance is a positive one that is stronger than
implied by previous work.
3 The impact of a one dollar change in shareholder wealth on the wealth of the chief
executive officer (Jensen & Murphy, 1990a)

21
This is now the wider consensus across academia, as evidence indicates that the
association between performance and executive pay is a weak one, where factors other
than performance are more highly correlated to pay. For example, Gomez-Mejia et al
(1987) document that after controlling for size, researchers have found the relationship
between CEO pay and performance to be weaker and less consistent than predicted by
economic theory. Nourayi and Mintz (2008) indicate that firm performance is a significant
determinant of executive cash compensation for the first three years as CEO, but when
tenure is longer than fifteen years than performance is not a significant determinant of
salary.
Stathopoulos et al (2005) provides an interesting summary of the issue:
“The overall impression one gains from this vast body of work is that a link between
executive pay (including stock option payoffs) and corporate performance does exist.
However, the link is quite weak, statistically significant, but far from compelling”
(Stathopoulos et al, 2005, p.91).
Researchers have noted that industry can enforce differentials in executive pay across top
level management (O'Rielly III et al , 1988). Possibly, because of the variations in the level
of strategic compeition and consequently the need for innovative dominance flunctuates
across industires; where employees in more competitive and innovative sectors could
demand higher salaries.
Various scholars have attempted to explain the relationship between firm size and
executive pay (Simon, 1957; Lydall, 1968, Rosen, 1990, Boyd, 1994 and Schaefer, 1998).
Simon (1957) finds that executive pay and size are positively correlated, finding that the

22
pay of senior managers such as CEOs can be written as a function of the number of
employees they supervise, either directly or indirectly (Kubo, 2000). Research by Boyd
(1994) found a weak relationship between CEO pay and firm size4, although some studies
have documeted a strong relationship between executive pay and firm size5 (Deckop,
1998; Jones & Kato, 1996). Rossen (1990) disputed that in equilibrium, the most capable
executives occupy top positions in the largest firms, where their marginal productivity is
amplified across the people below the CEO. Schaefer (1998) discussed how the marginal
marginal productivity of executives flunctuates with firm size, with larger firms paying
more with an expectation of more effort . More recently, Chalmers et al (2006) concluded
that firm size, when measured by total assets is the strongest determinant of CEO
compensation; arguing that CEOs in larger firms usually have a higher skill set and
qualifications realitive to their counterparts in smaller organisations. Lastly, Nourayi and
Mintz (2008) argued that firm size is a signifcant indactor of salary regardless of the tenure
of a CEO.
2.7 Remarks Regarding the Previous Litreature
Given the variety of previous studies it is clear that there is no definitive approach to
efficiency measurement or the evaluation of executive compensation. Surprisingly, even
forty years since its inception, there is still no widely accepted consensus in regard to the
input and output specification required for frontier analysis. Nonetheless, the succession
4 Log of net sales served as a proxy for size.
5 Number of sales is used as a proxy for size.

23
of innovative research around the topic of efficiency over the last 30 years has ensured the
development of the paradigm beyond its original framework.
3. Methodology and Data
In this section we discuss cost efficiency and the stochastic frontier model. Defining how
the model employed in this paper measures inefficiency, originating from the firms cost
function and how the model distinguishes between random noise and inefficiency.
Consequently, we compute a maximum likelihood model which is used to estimate the
parameters of the stochastic frontier. Where the data used for this section of the paper
originates from the Bankscope database, which contains the balance sheets and income
statements of all the building societies in the sample.
In order to analyse the performance of CEOs in the UK building society sector we use
annual reports published by the firms in the sample, containing the total remuneration
package of its current chief executive. We use data covering 2010 to 2011 for a sample of
33 CEOs (66 observations) in combination with a scoring for efficiency obtained using
stochastic frontier analysis. As such we hypothesise an econometric function which will
provide the basis for understanding the relationship between efficiency and executive pay.
As discussed by Varian (1990) the principles of economic theory are bound by optimising
behaviour. This rests on the assumption that firms minimise costs, whereas consumers
maximise utility. Varian (1984) documents the Weak Axiom of Cost Minimisation (WACM),
where the cost of planned production must be less than or equal to any other production
plan which yields the same amount of output. Similarly, cost efficient firms minimise costs,
where relative cost efficiency can be defined as “the ratio between the minimum cost at

24
which it is possible to attain a given volume of production and the cost actually incurred.”
(Maudos et al, 2002, p.7).
3.1 Stochastic Frontier Modelling
The stochastic frontier model uses a hypothesised function to estimate the relative
efficiencies of decision making units (DMUs), where a DMU can be anything in which
output is measurable (for example a person, firm or industry). It estimates the maxima or
minima of a dependent variable given explanatory variables, usually to estimate
production (maxima) or cost (minima) functions. Such a methodology assumes that the
production of a firm is limited by the sum of a parametric function of known inputs, and a
random error; which is associated with uncontrollable factors or model misspecification
(Worthington, 1998). Providing the necessary tools for a two component error structure,
where one measures random6 factors which affect output and the second measures
individual firm deviation from the efficient frontier which is within the organisations
control (Worthington, 1998). The relative efficiency of a DMU within the SFA framework is
defined as the ratio of multiple weighted inputs to multiple weighted outputs, where the
weight is chosen such that it maximises the efficiency for a DMU. These relative ratios
combine to create a production (cost) frontier, outlining the most efficient possibilities and
the closer a DMU is to this curve the more efficient it is. In the case of productive
efficiency all observations are found inside or on the stochastic production frontier, in
respect to cost efficiency, all observations lie outside or on the stochastic cost frontier.
6 Random shocks which are beyond the control of a firm can impact output, for example
weather (Kumbhakar and Lovell, 2000)

25
Where any deviation from the frontier has two potential sources: input allocative
inefficiency and input-orientated technical inefficiency (Kumbhakar and Lovell, 2000).
3.2 The Cost Function
A review7 of the optimisation problem stochastic frontier analysis tackles in its most basic
form presents the following cost function:
(2.1)
Where describes the scalar total cost of firm I at time t and represents the
cost function for firm i at time t. Where is a vector of explanatory variables which
include input prices and measures of output for firm i at time t, whereas represents a
vector of unknown parameters yet to be estimated.
Now if we assume that firms are not completely efficient we have the following equation:
(2.2)
Where Describes the efficiency of firm i at time t, where must be between 0 and 1.
If then the firm is fully efficient and is producing the optimal amount of outputs
from the given inputs, whereas when firm i is said to be inefficient to some degree.
Under this specification the cost function contains is split into two: a deterministic element
which is common among all producers [ and an element for producer specific
random shocks which can impact the output of a firm [ ; such that
7 This section is provided using the detailed analysis carried out in Kumbhakar and Lovell
(2000)

26
(2.3)
In order to interpret the inefficiency as a percentage deviation from the efficient frontier
we take the natural log of both sides:
{ } { } (2.4)
For simplicity we further assume that the cost function takes the log linear Cobb-Douglas
form and that there are k inputs, generating:
∑ ( ) (2.5)
For a detailed derivation see Kumbhakar and Lovell (2000).
3.3 Maximum-Likelihood Estimation and the Half Normal Model
Maximum-likelihood is a statistical technique of deriving estimates for the parameters of a
model given an observed set of data. Maximum-likelihood uses mathematical iteration to
estimate a maximised function where using some values of the parameters to be
maximised MLE adjusts the estimates iteratively until it estimates values of the parameters
which are considered to be the most likely maximum for a given set of data. Kumbhakar
and Lovell (2000) comment that if we can make distributional assumptions about and
MLE techniques should provide a more efficient prediction of the models parameters
than other estimation methods8. This is supported by Greene (2011) who notes that in
respect to stochastic frontier estimation, least square estimation is unbiased and
consistent, however the maximum likelihood estimator is non-linear and is more efficient
than least squares.
8 GLS or LSDV for more see Kumbhakar and Lovell (2000)

27
The results obtained from equation (1.1) are highly dependent on the assumed variables
and assumptions underlying the model. The majority of studies exploring the stochastic
frontier model have made various distributional assumptions of the error term following
either a half normal, exponential or gamma distribution. In the following section we
discuss one of the most commonly assumed (and the one assumed in this paper)
distributions (half-normal).
If we assume that is half normal we have the following assumptions:
)
(ii)
(iii) and are distributed independent of each other and the regressors.
Assume we wanted to estimate +
Given the independence of the error terms and as follows a half normal
distribution then the density function of is given by:
√ exp
(1.2)
Whereas the density function of is given by:
√ exp -
(1.3)
Given assumption (iii) the joint density function of and is given by the product of (1.2)
and (1.3) such that:

28
√ exp -
-
(1.4)
Given that obtain:
exp -
-
(1.5)
In order to obtain the marginal density function of we must integrate out of
generating:
∫
=
. [ (
)].exp -
=
. ϕ (
). (
)
For a stochastic cost frontier
. ϕ (
). (
) (1.6)
Where:
√
, ⁄ , standard normal cumulative distribution
function and standard normal density function.
Using equation (1.6) the log likelihood function for I producers is:
∑ (
)
∑ (1.7)

29
Equation (1.7) can be maximised with respect to the parameters to be estimated in order
to obtain maximum likelihood estimates for all parameters; where the estimates are
consistent as long as I tends to +
Now we have the estimated joint residuals , in order to derive the value of we use the
Jondrow et al (1982) estimator of individual technical efficiency, where:
Given that ⁄ ) is distributed as the mean or the mode can be used as a
point estimator for which is given by the following:
⁄ + [
⁄
⁄
]
= [
(
)] (2.0)
and
⁄ =
(2.1)
Where
= ⁄ and
⁄
Once the estimates in (2) or (2.1) are obtained individual producer technical efficiency is
calculated by:
(2.2)
Where: is ⁄ or ⁄
Estimations of individual firm specific efficiency as per the Jondrow et al (1982) method
take a value between 0 and 1, where the closer to 1 the firm is the more efficient it is.

30
Although, it is important to note that although the Jondrow et al (1982) point estimator is
unbiased but it does not consistently measure technical efficiency as
- (Coelli, 1995).
3.4 The Stochastic Cost Frontier
We express the frontier as a single equation cost function such that:
∑ i =1….N and t=1….N (3.1)
i =1….N and t=1….N (3.2)
Where ln denotes the natural logarithm of total cost for firm i at time t. is a (K x 1)
vector of input price ratios (P) and outputs (Q) for firm i at time t. The disturbance term
consists of two variables, where we assume the half normal assumptions outlined earlier in
the paper (assumption i to iii).
Following the conditional distribution approach outlined by Jondrow et al (1982) we
decompose the error term for a half normal distribution, providing an unbiased estimation
of cost inefficiency. As discussed in the previous section, we argued that using MLE was
more efficient than alternative methods. In order to obtain the estimates for equation (2)
we must first use MLE to obtain estimates of (3.1) for the stochastic cost frontier.
However, prior to obtaining estimates for (2) and (3.1) we need identify the vector of input
prices and outputs, in addition to specifying a cost function, these are the steps outlined in
the next two sections.

31
3.5 Input and Output Choice
Apart from adopting a parametric or non-parametric approach researchers have previously
employed differing choices to input and output specification. We follow the production
approach as previously outlined earlier in the paper. Where we use input price ratios
consisting of the cost of physical capital9 measured by total non-interest expenses divided
by fixed assets and cost of labour10, measured by personnel expenses divided by total
assets respectively. Outputs are measured by residential mortgage loans, total deposits
and other earning assets. A summary of the statistics in regard to variables used and a
description of the variables are provided in tables 2 and 3.
The input and output choice is illustrated below:
9 As per the specification used by Maudos et al (2002)
10 Ideally, we would like to measure the cost of labour by total personnel expenses divided
by the number of employees. However, due to the lack of data in bankscope for the
number of employees of a firm we follow a method employed by other researchers using
Bankscope and use total assets as a proxy for the number of employees (Molyneux et al,
1994; Bikker and Groeneveld, 2000)
Building Society
OEA
RML
Cost of Capital
Cost of Labour
Total Deposits
Cost of Funds
INPUTS OUTPUTS
32
Where RML = Residential mortgage loans, Total Deposits = all deposits including customer,
retail and non-retail deposits. OEA = Other earning assets (assets which earn a return apart
from deposits and loans),
Whilst there is no widely accepted consensus on input and output specification we have
decided to peruse the production approach as it provides a method commonly overlooked
in the literature and as such exploring this approach may provide a different outlook on
the efficiency of mutual organisations (Worthington, 1998)

33
Table 3: Descriptive Statistics
Variable Mean Std. Dev. Minimum Maximum
Total Cost (000’s) £246,000 £1,053,000 £1,000 £9,744,000
Cost of Capital (ratio) £2.1 £2 £0.52 £24.5
Cost of Labour (ratio) £0.0053 £0.0024 £0.0003 £0.0221
Cost of Funds (ratio) £0.0127 £0.0130 £0.0043 £0.1597
Total Deposits (000’s) £4,575,000 £20,052,000 £14,400 £169,866,000
Residential Mortgage Loans (000’s)
£4,033,000 £19,324,000 £15,400 £155,939,000
Other Earning Assets (000’s) £4,367,000 £4,596,000 £5,600 £155,469,000
Variable Variable Name Description (for firm i at time t)
C Total Cost Total non-interest expense + total interest expenses
Cost of Labour Total personnel expenses divided by total assets
Cost of Capital Total non-interest expenses divided by fixed assets
Cost of Funds Total interest expense divided by total deposits
Total Deposits Total customer, retail and other deposits
Residential Mortgages
Total residential mortgages
Other Earning Assets
Other assets which are not loans which earn a return
Table 2: Dependent Variable, Inputs and Outputs

34
3.6 Cost Function Formulation
In the previous literature there are two dominating cost functions, these are the Cobb-
Douglas and the translog (transcendental logarithmic) functional form. The Cobb-Douglas
is a linear in logs model, which is easy to estimate and requires few parameters. However
being a simplistic functional form it assumes that each firm has the same production
elasticity and an elasticity of substitution equal to 1. In contrast, translog is quadratic in
logs, providing a much more flexible functional form, applying firstly no a priori restrictions
on substitution or production elasticities, and secondly, permitting economies of scale to
vary across firms (Worthington, 1998).
Consequently, in this paper we adopt the translog specification, where the error term
is composed of two components, and . We assume this error term follows a normal-
half normal distribution where ),
, in addition and
are distributed independent of each other and the regressors. In order to estimate
equation (3.1) we specify the following multi output translog cost equation:
(
) (
) (
) +
(
) + (
) + + +
+ + +
+ + + (4.1)
35
In order to ensure linear homogeneity in input prices we follow Worthington (1998) and
Fiorentino et al (2006) by normalising total costs and all input prices by one selected input
price (in this case the cost of capital), as such the cost of capital disappears as the cost of
capital divided by the cost of capital equals zero.
In respect to equation (4.1): lnTC denotes the natural logarithm of total cost11 (total non-
interest expense + total interest expenses + personnel expenses) divided by the cost of
capital. refers to the natural logarithm of outputs (total deposits, residential
mortgage loans and other earning assets). is the natural logarithm of input prices
normalised by dividing against the cost of labour (the cost of capital divided by the cost of
labour and the cost of funds divided by the cost of labour).Furthermore as described
earlier following the execution of the translog cost frontier (4.1) we estimate the
conditional expectation of given as per the Jondrow et al (1982) firm specific
efficiency specification (2.1).
3.7 CEO Compensation and Efficiency
As the aim of this paper is not to solely examine efficiency but to understand the impact of
changes in CEO salary in tandem with efficiency scoring we must regress the efficiency
scores provided by the translog cost frontier in the previous section to the CEO salary for
each executive; providing us with a hypothesised function, which will serve to predict the
relationship between CEO salary and firm efficiency. This is by regressing firm level CEO
compensation levels for a smaller sample set of 33 building societies across two years
(2010 and 2011) against the efficiency score found by the frontier analysis. In addition, we
11
We follow the same definition of total costs as Casu & Molyneux (2010)

36
carry out two separate cross sectional regressions (for the years 2010 and 2011) to
understand any yearly changes in cost efficiency and the impact of this on yearly CEO
salary. We will use the following pooled model12 for the regressions:
(5.1)
Where:
= Total compensation by CEO of firm i in year t
= Total assets13 of firm i at time t
, Coefficients yet to be estimated
= SFA score of CEO of firm i in year t
= error term
We hypothesise that more efficient CEOs gain a higher level of compensation as such we
expect > 0 (positive relationship). Moreover, we suspect that CEOs who are more
efficient are rewarded with a higher total compensation (ceteris paribus), consequently we
expect as we expect compensation to be positively related to the size of the firm.
Lastly, as we suspect that that increases in compensation and firm size are non-linear
(compensation does not increase proportional to firm size) we include a square term of
12We use a similar model to Chen et al (2009) except we use SFA instead of DEA for the
efficiency analysis and the cross sectional regressions are simply without the label for time.
13 We use total assets as a proxy for size as used in previous empirical research (Chalmers
et al, 2006)

37
total costs in the regression. Lastly, we hypothesise that there are decreasing returns to
scale in respect to compensation with firm size (ceteris paribus), thus we expect .
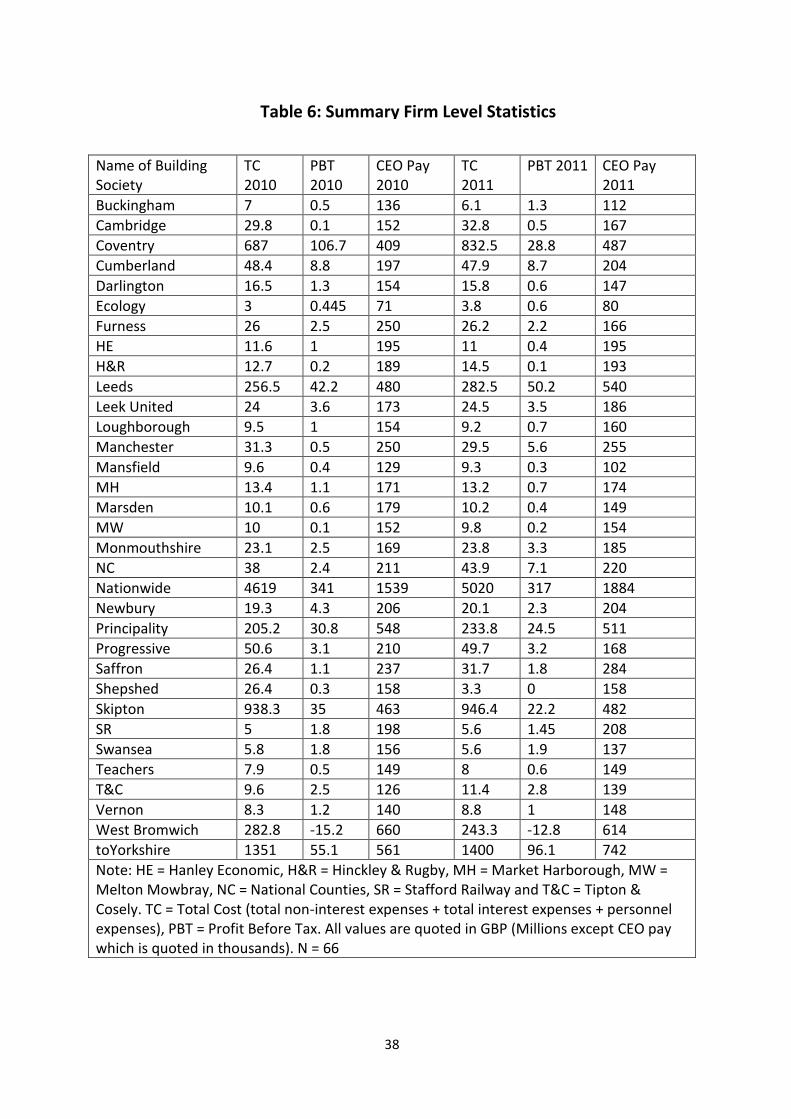
Table 5 provides a summary of statistics from the data concerning CEO salary, we note that
the standard deviation is higher than the mean for the year 2010 indicting that the data is
highly skewed, this is complimented by the fact the maximum value is much higher than
the mean.
Variable CEO Pay 2010 CEO Pay 2011
Mean 294 278
Standard Deviation 329 269
Min 80 71
Max 1884 1539
N = 66
Table 5: Summary CEO Salary Descriptive Statistics
38
Name of Building Society
TC 2010
PBT 2010
CEO Pay 2010
TC 2011
PBT 2011 CEO Pay 2011
Buckingham 7 0.5 136 6.1 1.3 112
Cambridge 29.8 0.1 152 32.8 0.5 167
Coventry 687 106.7 409 832.5 28.8 487
Cumberland 48.4 8.8 197 47.9 8.7 204
Darlington 16.5 1.3 154 15.8 0.6 147
Ecology 3 0.445 71 3.8 0.6 80
Furness 26 2.5 250 26.2 2.2 166
HE 11.6 1 195 11 0.4 195
H&R 12.7 0.2 189 14.5 0.1 193
Leeds 256.5 42.2 480 282.5 50.2 540
Leek United 24 3.6 173 24.5 3.5 186
Loughborough 9.5 1 154 9.2 0.7 160
Manchester 31.3 0.5 250 29.5 5.6 255
Mansfield 9.6 0.4 129 9.3 0.3 102
MH 13.4 1.1 171 13.2 0.7 174
Marsden 10.1 0.6 179 10.2 0.4 149
MW 10 0.1 152 9.8 0.2 154
Monmouthshire 23.1 2.5 169 23.8 3.3 185
NC 38 2.4 211 43.9 7.1 220
Nationwide 4619 341 1539 5020 317 1884
Newbury 19.3 4.3 206 20.1 2.3 204
Principality 205.2 30.8 548 233.8 24.5 511
Progressive 50.6 3.1 210 49.7 3.2 168
Saffron 26.4 1.1 237 31.7 1.8 284
Shepshed 26.4 0.3 158 3.3 0 158
Skipton 938.3 35 463 946.4 22.2 482
SR 5 1.8 198 5.6 1.45 208
Swansea 5.8 1.8 156 5.6 1.9 137
Teachers 7.9 0.5 149 8 0.6 149
T&C 9.6 2.5 126 11.4 2.8 139
Vernon 8.3 1.2 140 8.8 1 148
West Bromwich 282.8 -15.2 660 243.3 -12.8 614
toYorkshire 1351 55.1 561 1400 96.1 742
Note: HE = Hanley Economic, H&R = Hinckley & Rugby, MH = Market Harborough, MW = Melton Mowbray, NC = National Counties, SR = Stafford Railway and T&C = Tipton & Cosely. TC = Total Cost (total non-interest expenses + total interest expenses + personnel expenses), PBT = Profit Before Tax. All values are quoted in GBP (Millions except CEO pay which is quoted in thousands). N = 66
Table 6: Summary Firm Level Statistics

39
4. Empirical Results
In this section, we discuss the results obtained from the stochastic frontier analysis in
addition to the results from the regressions outlined in the previous section; analysing the
relationship between cost efficiency and CEO salary. The appendix provides individual
efficiency scores obtained for all years from the frontier analysis, however summary
efficiency statistics and a description of the regression coefficients are provided where
required.
Table 7 presents the maximum-likelihood estimates for the parameters of the normalised
translog cost frontier as described in equation (4.1). We reject the null hypothesis of joint
insignificance for the coefficients of the cost function ( = = 0) by using the
log-likelihood ratio test statistic with chi-square distribution. In addition we reject the null
hypothesis of no technical inefficiency ( = 0) as it is true that
. We find that
both error terms are statistically significant, with the inefficiency component significant at
the 99% confidence level and the random noise component significant at the 99.9%
confidence level.

40
Parameter Variable Coefficient Std.Error Parameter Variable Coefficient Std.Error
4.183
(1.91)
2.189 -0.109
(-0.24)
0.454
1.618
(1.05)
1.548 0.544
(0.44)
1.224
-0.298
(-0.19)
1.586 0.527
(-0.93)
1.526
-0.919
(0.45)
2.059 -0.992
(-0.65)
1.494
-0.198
(-0.19)
1.041 -0.582
(-0.39)
0.674
-0.198
(-0.07)
2.661 -0.759
(-1.13)
1.912
0.274
(0.84)
0.325 1.137
(0.59)
0.637
-0.085
(-0.13)
0.673 -0.832
(-1.31)
0.637
2.272
(1.06)
2.144 -1.443
(-0.55)
2.631
0.337
(1.08)
0.311 0.467
(0.59)
0.769
0.989
(0.30)
3.252
-2.743***
(-7.86)
0.349
-2.818**
(-2.69)
1.048
t statistics in parentheses: *p < 0.05, **p < 0.01, ***p < 0.001 : Log-likelihood = -56.31 N = 294
Where: Ln = Natural Logarithm, P1 = Cost of labour, P2 = Cost of funds, P3 = cost of capital, Y1= Residential
mortgage loans, Y2 = Other earning assets, Y3 = Total deposits, P1* = P1/P3, P2* = P2/P3, Variance of two
sided stochastic frontier, = Variance of inefficiency and Total error variance in the model
.
Table 7 – Translog Cost Function

41
Table 8 provides a summary of mean cost efficiency scores on a yearly basis for the whole
sample period. The scores outlined in table 8 each describe how far above the respective
efficient cost frontier each building society is estimated to be. The overall mean efficiency
score was estimated at roughly 0.82, indicating a mean cost inefficiency of 18% across the
sample. We find that the proportion of efficient CEOs has declined from 2003 to 2008 year
on year, interestingly the lowest mean inefficiency (year) score is in 2008, coinciding with
the worldwide financial crisis. The estimated cost efficiencies found in this paper are
consistent with the earlier findings of Worthington (1998), although his study focused on
Australian building societies. It is interesting to see that although we follow a production
approach the mean cost inefficiency score is close to that found by Worthington (1998)
(21%) who employed an intermediation approach.

42
Table 9 summarises the mean firm specific cost efficiency scores estimated by the translog
cost frontier along with a value for average total assets for each mutual, we find that there
is no definitive given relationship between firm size and efficiency.
Year Observations Mean Std. Dev. Minimum Maximum
1998 2 0.8184736 0.0297145 0.7974623 0.8394849
1999 2 0.8451663 0.0080369 0.8394833 0.8394849
2000 3 0.8352573 0.0147830 0.8228537 0.8516154
2001 3 0.8498542 0.0075276 0.8419057 0.8568749
2002 3 0.8186927 0.0414188 0.7742882 0.8562799
2003 6 0.8565482 0.0170381 0.8304076 0.8836235
2004 25 0.8325011 0.0170381 0.8304076 0.8836235
2005 31 0.8051640 0.0511372 0.6971726 0.9164624
2006 31 0.7949433 0.0461719 0.6967176 0.8746896
2007 32 0.7722448 0.0584345 0.6440333 0.8750280
2008 39 0.7565842 0.0650992 0.5897666 0.8827966
2009 39 0.8487659 0.0466377 0.7238307 0.9229753
2010 39 0.8670900 0.0338448 0.7686022 0.9198319
2011 36 0.8710819 0.0303110 0.7943464 0.9176146
1998 - 2011 294 0.8200372 0.0615920 0.5897666 0.9229753
Note: For a detailed description of the efficiency scores associated with the translog cost
frontier (4.1) see Table 10 (appendix).
Table 8: Stochastic Cost Frontier Efficiency Summary

43
Average Total Assets Building Society Average Cost Efficiency
187.1875 Bath Investment 0.863373
145.3125 Beverley 0.750649
149.95 Buckinghamshire 0.830156
926.26 Cambridge 0.864610
32.7125 City of Derry 0.787271
22081.8 Coventry 0.832846
1406.2 Cumberland 0.808606
593.125 Darlington 0.859215
261.7625 Dudley 0.837476
79.976 Ecology 0.852636
814.0875 Furness 0.833676
335.0714 Hanley Economic 0.821982
163.4571 Harpenden 0.817177
647.8125 Hinckley & Rugby 0.850801
415.95 Ipswich 0.851334
20572.25 Leeds 0.777264
732.325 Leek United 0.833798
252.4375 Loughborough 0.816680
892.15 Manchester 0.830574
242.9429 Mansfield 0.836889
404.5875 Market Harborough 0.851513
343.5857 Marsden 0.888486
400.2875 Melton Mowbray 0.815333
569.0875 Monmouthshire 0.755527
1140.85 National Counties 0.750097
169936.5 Nationwide 0.821621
606.3375 Newbury 0.800095
1620.213 Nottingham 0.848758
5770.914 Principality 0.703823
1483.525 Progressive 0.722298
792.9375 Saffron 0.824975
233.2 Scottish 0.872923
86.975 Shepshed 0.860166
13204.28 Skipton 0.907365
154.4668 Stafford Railway 0.776839
136.3875 Swansea 0.799076
251.4625 Teachers 0.797602
304.225 Tipton & Cosely 0.835730
214.3714 Vernon 0.840646
8368.2 West Bromwich 0.789831
25069.87 Yorkshire 0.814842
Table 9: Average Size and Average Cost Efficiency

44
Note: Average total assets (ATA) are used as a proxy for size, similar to table 9. ATA are
measured in millions of GBP (£) and cost efficiency scores can range between 0 and 1.
4.1 Efficiency and CEO Remuneration
We analysed the link between CEO salary and firm efficiency across two years, for
comparison we have provided three different sets of results, with one providing estimates
of a pooled OLS approach on regression analysis for the two year sample of 33 building
societies. Secondly, we split the regression into a cross sectional basis and analyse the
results from 2010 and 2011 separately in order to detect any changes to the relationship
between SFA score and CEO salary, in addition to being able to discuss and evaluate any
skewness in the results. Note that we have multiplied the estimated SFA scores by 100 in
order to be able to analyse a one unit change in efficiency against CEO salary (thus SFA
score in the regressions below is between 0 and 100 instead of 0 and 1).
Examining the relationship between Cost Efficiency and CEO Salary
Variable Pooled 2010 - 2011 2011 Cross Section 2010 Cross Section
Constant 441
(1.45)
594.1
(1.40)
114.9608
(0.17)
SFA Score -2.9
(-0.83)
-4.712
(-0.96)
0.997
(0.13)
Total Assets 0.467***
(7.74)
0.0159**
(5.73)
0.00688**
(2.78)
-0.00000258
(-1.76)
-4.74e-08
(-3.25)
8.79e-09
(0.62)
Adjusted 0.8869 0.8634 0.8280
N 66 33 33
t statistics in parentheses: *p < 0.05, **p < 0.01, ***p < 0.001
Table 10: Efficiency and CEO Salary Regressions

45
The regression analysis summarised in table 10 indicates that overall SFA score is
negatively correlated to CEO salary, the skewness of the results is visible when comparing
the pooled results to the result from the 2010 cross sectional regression. Nonetheless, it is
puzzling as to why the estimated SFA score decreases (on average) with increases to
executive pay; it seems that it is probably a simple issue of a requiring more data to
provide a more accurate description of the relationship between pay and efficiency. In
addition, the magnitude of an increase in efficiency on CEO salary varies across years, with
2011 indicating that the SFA score and CEO pay exhibit a strong negative relationship, on
the other hand the 2010 regression indicates a weak positive relationship between
efficiency and pay, where if we assume efficiency serves as a proxy for performance we
find a weak positive link between pay and performance, in line with previous research by
Jensen and Murphy (1990a) and Gregg et al (2003).
Interestingly, total assets is significant in each estimated regression, varying from being
statistically significant at the 99% confidence level in the cross sectional regressions and at
the 99.9% confidence level in the pooled regression. In all the regressions an increase in
size when measured by total assets has a statistically significant increase in CEO salary;
corresponding with the earlier findings of Chalmers et al (2006).
Earlier we hypothesised that the coefficient for SFA score > 0 as we suspected that more
efficient executives receive a higher level of compensation, given our results we fail to
reject the null hypothesis as we have two out of three regressions in which SFA score is less
than zero. We also suspected the coefficient for total assets would be > 0 as we expected
that CEO salary is positively correlated to firm size. Given the results in table 9 we fail to
reject the null hypothesis as the estimates provided by the regressions indicate that size

46
and salary exhibit a significant positive relationship. Lastly we expected the coefficient of
total-assets² < 0 as we suspected that there are decreasing returns to scale for CEO salary
with respect to firm size, once again we fail to reject the null hypothesis of decreasing
returns to scale; as the regression for the year 2010 has a positive coefficient for total-
assets². Although, overall (pooled regression) there is evidence of decreasing returns to
scale.
4.2 Discussion
Overall we find that firm size is powerful determinant of CEO salary, especially when
compared to the efficiency score. Adjusted R² for all three regressions indicates that we
have explained over 80% of the variation in CEO compensation with the given variables.
The investigation of building society efficiency has yielded results which are in line with
previous empirical research, with a mean building society cost efficiency of 82% the firms
in the sample would have to increase outputs by 18% to be considered completely cost
efficient (ceteris paribus). The efficiency scores provide the basis for which improvements
can be made in order to not only be more cost efficient but as a result more profitable. As
noted earlier in the paper, the lowest mean year efficiency score is estimated for 2008,
around the time of the global financial crisis. We know that building societies given their
conservative attitude to risk were in many ways sheltered from the brunt of the financial
crisis; brought on by mortgage lending and later derivative trading gone into over drive.
However, the results indicate that whatever the reason for the inefficiencies in our sample
the timing of the lowest mean score indicates the financial crisis may have had an impact
on the efficiency of building societies. This is especially important when you consider that
this paper takes a production approach, which depends on deposits as outputs. If we make

47
the assumption that the financial crisis reduced total bank deposits, this would lower
overall cost efficiency as output would decrease relative to previous years (ceteris paribus).
In the last section of the analysis the regressions indicate that there is clear evidence that
CEO salary is correlated to efficiency; however, that said the evidence presented indicates
it is not a statistically significant determinant of CEO salary.
5. Concluding Remarks
Corporate governance and the associated theories have met a recent media backlash as
financial institutions, primarily consisting of banks attempt to explain why executives are
paid such a high salary. This high level of public exposure has not only exposed in many
cases a weak pay to performance relationship but a relationship which by many empirical
accounts has been analysed as statistically non-significant. By utilising an approach usually
overlooked in previous literature the empirical analysis in this paper indicates that the
relationship between efficiency and CEO salary is not as strong as thought in theory and as
indicated in previous research. However, we do find similarities to previous empirical
research in respect of size being a strong determinant of CEO salary; but it would be
interesting to see an analysis of how size determines executive pay when a different proxy
is used other than total assets in combination with a stochastic cost frontier score.
We have established that a statistically significant positive relationship exists between size
and executive salary in the U.K building society sector. But the evidence concerning the
relationship between efficiency and CEO salary is not so clear, as the regressions provide

48
conflicting results. As this paper is the first of its kind14 in respect to examining a stochastic
frontier score in tandem with executive salaries in the mutual organisation sector there are
various ways to extend the analysis in this paper. There is a distinct possibility that a larger
sample set could provide a better overview of the relationship between efficiency and
executive pay, in addition, using different proxies could possible yield differing results.
Moreover, applying a comparatively advanced frontier technique in addition to analysing
more variables in respect to the estimation of the determinants of CEO salary may provide
a different outlook on the subject of efficient CEOs. Lastly, using more consistent and
accurate data which incorporates sensitive data which is currently difficult to obtain such
as the number of employees year on year and the number of employees off sick in a year
may provide an alternative approach which has yet to be fully utilised.
In order to reduce the unexplained variation within the dependent variable a regression
analysis which employs an increased number of independent variables may provide a more
accurate and consistent indication of the correlation between CEO pay and efficiency. For
example, this could be by including variables which account for variations in CEO age,
degree level and if the executive has a family to support.
Ultimately, this study finds that the cost efficiency of U.K building societies is more of less
in line with previous research and that size is a more important determinant of CEO salary
than firm cost efficiency. Consequently, the evidence presented in this paper finds
similarities with Ingham and Thompson (1995), where size has a significant influence on
executive salary. In addition, there are similarities between this study and other that
carried out by Worthington (1998) in respect to cost efficiency estimates. However, the
14 To the knowledge of the author.

49
results obtained from the regressions provide estimates for a relationship (in respect to
using an SFA score) yet to be empirically tackled in the literature. It is evident that a more
detailed evaluation of the subject is required in order to provide evidence which yields a
more accurate description of the correlation between efficiency and CEO salary.

50
Name 1998 1999 2000 2001 2002 2003 2004
Bath Investment - - - - - 0.8836235 0.8982414
Beverley - - - - - - 0.8221018
Buckinghamshire - - - - - 0.8564557 0.8304076
Cambridge - - - - - - -
City of Derry - - - - - 0.82551 0.7426277
Coventry - - - - - - -
Cumberland - - - - - - -
Darlington - - - - - - -
Dudley - - - - - - 0.8815243
Ecology - - - - - - 0.8732530
Furness - - - - - - 0.8287350
Hanley Economic
Harpenden - - - - - - 0.8149030
Hinckley & Rugby - - - - - - 0.8248304
Ipswich - - - - - 0.857098 0.8530745
Leeds - - - - - - -
Leek United - - - - - - 0.8455605
Loughborough - - - - - - 0.8334979
Manchester - - - - - - -
Mansfield - - 0.8516154 0.8507820 0.7742882 - -
Market Harborough - - - - - - 0.8482306
Table 11: Firm Level Cost Efficiency Estimates – Page 1
7. Appendix

51
Table 7: Firm Level Cost Efficiency Estimates – Page 2
Name 1998 1999 2000 2001 2002 2003 2004
Marsden - - - - - - -
Melton Mowbray - - - - - - 0.8425618
Monmouthshire - - - - - - 0.7819394
National Counties - - - - - - 0.7399479
Nationwide - - - - - - -
Newbury - - - - - - 0.8372208
Nottingham 0.8394849 0.8394833 0.8313028 0.8419057 0.8562799 0.8599628 0.8728861
Principality - - - - - - -
Progressive - - - - - - 0.8259498
Saffron - - - - - - 0.8809341
Scottish - - - - - - 0.8376894
Shepshed - - - - - - 0.8680426
Skipton - - - - - - -
Stafford Railway - - - - - - 0.8261181
Swansea - - - - - - 0.7980310
Teachers - - - - - - 0.8111342
Tipton & Cosely - - - - 0.8568749 0.8517414 0.8234922
Vernon 0.7974623 0.8508492 0.8228537 - - - -
West Bromwich - - - - - - -
Yorkshire - - - - - - -

52
Table 7: Firm Level Cost Efficiency Estimates – Page 3
Name 2005 2006 2007 2008 2009 2010 2011
Bath Investment 0.8667410 0.8667410 0.8139203 0.8108151 0.8809630 0.8859408 -
Beverley 0.7167667 0.7189929 0.6767557 0.6148926 0.8203415 0.8145660 0.8207749
Buckinghamshire - - - 0.7618173 0.8397014 0.8405151 0.8520367
Cambridge - - 0.7961823 0.8196906 0.8925495 0.9079986 0.9066307
City of Derry 0.7245798 0.7458854 0.7288348 0.8121586 0.8681682 0.8504001 -
Coventry - - 0.7726473 0.7426958 0.8695649 0.8929797 0.8863412
Cumberland 0.8195255 0.7996645 0.7847130 0.7460710 0.7703928 0.8713537 0.8685234
Darlington - - - 0.7663189 0.8769686 0.8969964 0.8965743
Dudley 0.8311687 0.8183044 0.8400872 0.7920085 0.8011460 0.8634995 0.8720708
Ecology 0.8426586 0.8345351 0.8055229 0.8023472 0.8837481 0.8896208 0.8893999
Furness 0.8067530 0.8144346 0.7905039 0.7542178 0.8799670 0.8994167 0.8953773
Hanley Economic 0.8214800 0.8249950 0.7894791 0.7621910 0.8262282 0.8582134 0.8712896
Harpenden 0.7978712 0.7876044 - 0.7522774 0.8744740 0.8759328 -
Hinckley & Rugby 0.8196460 0.8317524 0.8005231 0.7929830 0.9079029 0.9198319 0.9089411
Ipswich 0.8611186 0.8147252 0.7885508 0.8734338 0.8767588 0.8859094 -
Leeds 0.7861845 0.7587747 0.6984255 0.6870337 0.8318505 0.8516674 0.8269145
Leek United 0.8374750 0.8262975 0.7998410 0.7343041 0.8730767 0.8754288 0.8784016
Loughborough 0.7900537 0.7969614 0.7863944 0.7553984 0.8398829 0.8620259 0.8692240
Manchester - - - 0.7665920 0.8408349 0.8504365 0.8644326
Mansfield - - - 0.7675892 0.8454738 0.8777777 0.8906985
Market Harborough 0.8177945 0.8251199 0.8110328 0.8099087 0.8981553 0.9028037 0.8990598
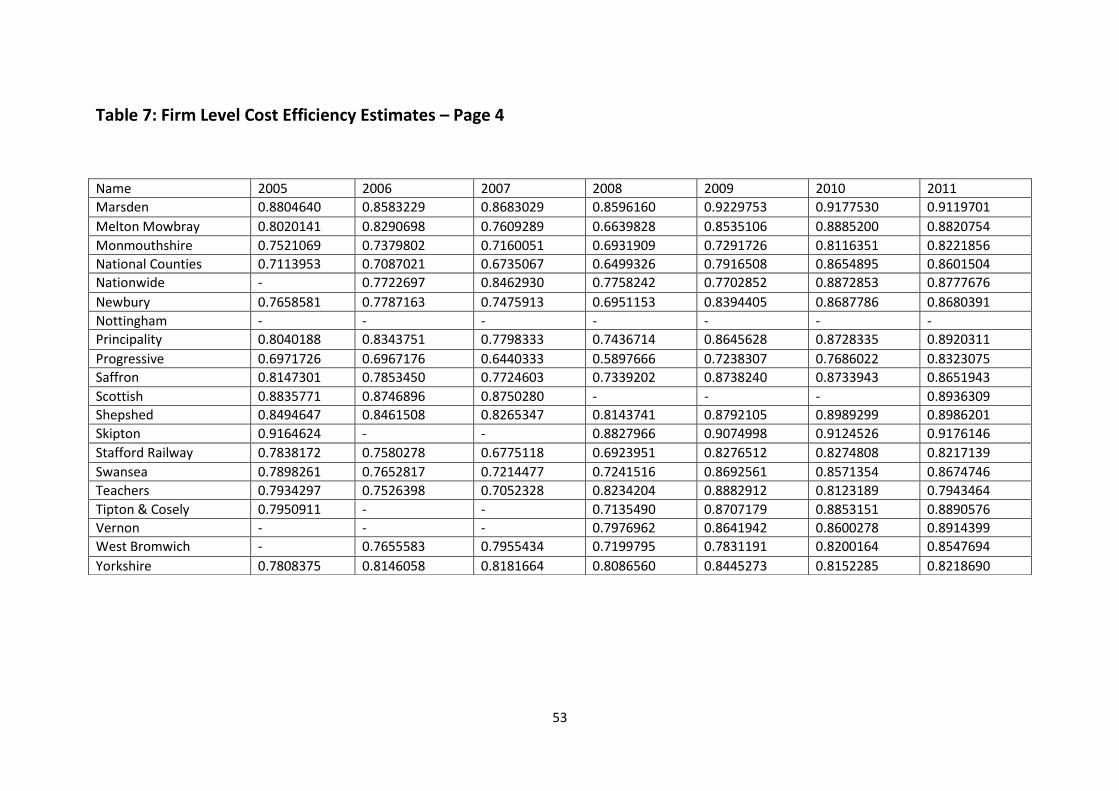
53
Table 7: Firm Level Cost Efficiency Estimates – Page 4
Name 2005 2006 2007 2008 2009 2010 2011
Marsden 0.8804640 0.8583229 0.8683029 0.8596160 0.9229753 0.9177530 0.9119701
Melton Mowbray 0.8020141 0.8290698 0.7609289 0.6639828 0.8535106 0.8885200 0.8820754
Monmouthshire 0.7521069 0.7379802 0.7160051 0.6931909 0.7291726 0.8116351 0.8221856
National Counties 0.7113953 0.7087021 0.6735067 0.6499326 0.7916508 0.8654895 0.8601504
Nationwide - 0.7722697 0.8462930 0.7758242 0.7702852 0.8872853 0.8777676
Newbury 0.7658581 0.7787163 0.7475913 0.6951153 0.8394405 0.8687786 0.8680391
Nottingham - - - - - - -
Principality 0.8040188 0.8343751 0.7798333 0.7436714 0.8645628 0.8728335 0.8920311
Progressive 0.6971726 0.6967176 0.6440333 0.5897666 0.7238307 0.7686022 0.8323075
Saffron 0.8147301 0.7853450 0.7724603 0.7339202 0.8738240 0.8733943 0.8651943
Scottish 0.8835771 0.8746896 0.8750280 - - - 0.8936309
Shepshed 0.8494647 0.8461508 0.8265347 0.8143741 0.8792105 0.8989299 0.8986201
Skipton 0.9164624 - - 0.8827966 0.9074998 0.9124526 0.9176146
Stafford Railway 0.7838172 0.7580278 0.6775118 0.6923951 0.8276512 0.8274808 0.8217139
Swansea 0.7898261 0.7652817 0.7214477 0.7241516 0.8692561 0.8571354 0.8674746
Teachers 0.7934297 0.7526398 0.7052328 0.8234204 0.8882912 0.8123189 0.7943464
Tipton & Cosely 0.7950911 - - 0.7135490 0.8707179 0.8853151 0.8890576
Vernon - - - 0.7976962 0.8641942 0.8600278 0.8914399
West Bromwich - 0.7655583 0.7955434 0.7199795 0.7831191 0.8200164 0.8547694
Yorkshire 0.7808375 0.8146058 0.8181664 0.8086560 0.8445273 0.8152285 0.8218690

54
8. Bibliography
Aigner, D., & Chu, S. (1968). On Estimating the Industry Production Function. American Economic
Review. Vol. 58, 826 - 839.
Altunbas, Y., Gardener, E. P., Molyneux, P., & Moore, B. (2001). Efficiency in European banking.
European Economic Review, Vol. 45, 1931 - 1955.
Ashton, J. (1997). Total factor productivity growth and technical change in UK building societies:
1990-95. Bournemouth University, School of Finance & Law, Working Paper No.6.
Ashton, J. (1998). Cost efficiency and UK building societies. An econometric panel-data study
employing a flexible Fourier functional form. School of Finance & Law, Working Paper
Series No. 8.
Battese, G. E., & Coelli, T. J. (1992). Frontier Production Functions, Technical Efficiency and Panel
Data: With Application to Paddy Farmers in India. Journal of Productivity Analaysis, Vol. 3,
153 - 169.
Battese, G. E., & Coelli, T. J. (1995). A model for technical inefficiency effects in a stochastic frontier
production function for panel data. Empirical Economics, Vol. 20, 325 - 332.
Beccalli, E., Casu, B., & Girardone, C. (2006). Efficiency and Stock Performance in European Banking.
Journal of Business Finance & Accounting, Vol. 33, Issue 1-2, 245 - 262.
Benston, G. J., & Smith Jr, C. W. (1976). A Transactions Cost Approach To The Theory of Financial
Intermediation. Journal of Finance, Vol, 31, No.2, 215 - 231.
Berger, A. N., & Humphrey, D. B. (1992). Megamergers in Banking and the Use of Cost Efficiency as
an Antitrust Defence. Antitrust Bulletin, 541 - 600.
Berger, A. N., Hunter, W. C., & Timme, S. G. (1993). The efficiency of financial institutions: A review
and preview of research past, present and future. Journal of Banking & Finance, Vol. 17,
221 - 249.
Berger, A., De Young, R., Genay, H., & Udell, G. (2000). Globalization of Financial Institutions:
Evidence from Cross-Border Banking Perfomance. Brookings-Wharton Papers on Financial
Services, 23 - 125.
Bikker, J. A., & Groeneveld, J. M. (2000). Competition and concentration in the EU banking industry.
Kredit und Kapital, Vol. 33, 62 - 98.
Casu, B., & Molyneux, P. (2003). A comparative study of efficiency in European banking. Applied
Economics, 35:17, 1865 - 1876.
Cebenoyan, A., Cooperman, E., Register, C., & Hudgins, S. (1993). The Realtive Efficiency of Stock
versus Mutual S&Ls: A Stochastic Cost Frontier Approach. Journal of Financial Services
Research, 151 - 170.

55
Chalmers, K., Koh, P., & Stapledon, G. (2006). The determinants of CEO compensation. Rent
exraction or labour demand? The British Accounting Review, 38, 259 - 275.
Charnes, A., Cooper, W. W., & Rhodes, E. (1978). Measuring the efficiency of decision making units.
European Journal of Operational Research, Vol. 2, Issue 6, 429 - 444.
Chen, Y., Gregoriou, G. N., & Rouah, F. D. (2009). Efficiency persistence of bank and thrift CEOs
using data envelopment analysis. Computers & Operations Research, Vol. 36, 1554 - 1561.
Ciscel, D. H., & Carrol, T. M. (1980). Determinants of Executive Salaries: An Econometric Survey. The
Review of Economics and Statistics, Vol. 62, No. 1, 7 - 13.
Coelli, T. J. (1995). Estimators and hypothesis tests for a stochastic frontier function: A Monte Carlo
analysis. Journal of Productivity Analysis, 247 - 268.
Coelli, T., Rao, P. D., & Battese, G. E. (1998). An Introduction to Efficiency and Productivity Analysis.
Kluwer Academic Publishers.
Conyon, M. (1995). Directors’ Pay in the Privatized Utilities. British Journal of Industrial Relations,
Vol 33, No. 2.
Conyon, M. (1997). Corporate governance and executive compensation. Corporate governance and
executive compensationchen, vol 15, 493 - 509.
Crawford, A., Ezzell, J. R., & Miles, J. A. (1995). Bank CEO Pay-Performance Relations and the Effects
of Deregulation. Journal of Buisness.
Deckop, J. (1988). Determinants of Chief Executive Officer Compensation. Industrial and Labor
Relations Review, Vol. 41, 215 - 226.
Demsetz, H. (1973). Industry Structure, Market Rivalry, and Public Policy. Journal of Law and
Economics, Vol. 16, No. 1, 1-9.
Drake, L., & Weyman-Jones, T. (1992). Technical and scale efficiency in UK building societies.
Applied Financial Economics 2, 1–9.
Drake, L., & Weyman-Jones, T. G. (1996). Productive and allocative inefficiencies in U.K. building
societies: A comparison of non-parametric and stochastic frontier techniques. The
Manchester School, Vol. 64, 22 - 37.
Esho, N., & Sharpe, I. (1996). X-efficiency of Australian permanent building socities, 1974 - 1990.
The Economic Record, 246 - 259.
Farrell, M. J. (1957). The Measurement of Productive Efficiency. Journal of the Royal Statistical
Society, 253-290.
Festinger, L. (1954). A Theory of Social Comparison Process. Human Relations, 117 - 140.
Field, K. (1990). Production efficiency of British building societies. Applied Economics, 415 - 425.

56
Fiorentino, E., Karmann, A., & Koetter, M. (2006). The cost efficiency of German banks: a
comparison of SFA and DEA. Deutsche Bundesbank: Series 2 discussion paper.
Fiorentino, E., Karmann, A., & Koetter, M. (2006). The cost efficiency of German banks: a
comparison of SFA and DEA. Duetsche Bundesbank Discussion Paper, Series 2: Banking and
Financial Studies No 10/2006.
Fried, H. O., Lovell, C., & Vanden Eekaut, P. (1993). Evaluating the performance of US credit unions.
Journal of Banking and Finance, 17, 251 - 265.
Gomez-Mejia, L. R., Tosi, H., & Hinkin, T. (1987). Managerial Control, Performance, and Executive
Compensation. The Academy of Management Journal, Vol 30, No.1, 51 - 70.
Greene, W. H. (2011). Econometric Analysis. Pearson Education.
Gregg, P., Jewell, S., & Tonks, I. (2005). Executive Pay and Performance in the UK 1994 - 2002.
Working Paper. University of Exeter.
Gregg, P., Machin, S., & Szymanski, S. (1993). The Disappearing Relationship Between Directors' Pay
and Corporate Performance. British Journal of industrial Relations, Vol 31, No 1.
Hardwick, P. (1990). Multi-Product Cost Attributes: A Study Of U.K Building Societies. Oxford
Economic Papers, New Series, Vol. 42, No. 2, 446 - 461.
Heathfield, D. F., & Wibe, S. (1987). An Introduction to Cost and Production Functions. Macmillan
Education .
Hutcheson, T., & Sharpe, I. G. (1997). Ownership Structure and Building Society Efficiency.
University of Technology Sydney, Working Paper no. 78.
Ingham, H., & Thompson, S. (1993). Executive Compensation and Deregulation in UK Building
Societies. Accounting & Business Research, Vol. 23, 373 - 383.
Ingham, H., & Thomson, S. (1995). Mutuality, Performance and Executive Compensation. Oxford
Bulletin of Economics and Statistics, 295-307.
Jensen, M. C., & Meckling, W. H. (1976). Theory of the firm: Managerial behavior, agency costs and
ownership structure. Journal of Financial Economics, 305-350.
Jensen, M., & Murphy, K. (1990a). Performance pay and top-management incentives. Journal of
Political Economy, 225-264.
Jensen, M., & Murphy, K. (1990b). CEO Incentives - It's Not How Much You Pay, But How. Harvard
Business Review, 138 - 153.
Jondrow, J., Lovell, C. K., Materov, I. S., & Schmidt, P. (1982). On the Estimation of Technical
Inefficiency in the Stochastic Frontier Production Function Model. Journal of Econometrics,
Vol. 19, Issue 2-3, 233 - 238.

57
Jones, D., & Kato, T. (1996). The determinants of chief executive compensation in transitional
economies. Labour Economics, 319 - 336.
Kerr, J., & Bettis, R. (1987). Boards of Directors, Top Management Compensation, and Shareholder
Returns. Academy of Management Journal, Vol 30, No.4, 645 - 664.
Kubo, K. (2000). The Determinants of Executive Compensation and its Effect on Company
Performance in Japan and in the UK. London: LSE PhD Thesis .
Kumbhakar, S. C., & Lovell, C. K. (2000). Stochastic Frontier Analysis. Cambridge University Press.
Kwan, S., & Eisenbeis, R. (1996). An Analysis of Inefficiencies in Banking: A Stochastic Cost Frontier
Approach. FRBSF Economic Review.
Lazear, E., & Rosen, S. (1981). Rank Order Tournaments as Optimum Labour Contracts. Journal of
Political Economy, 561 - 580.
Lindley, J. T., & Sealey Jr, C. W. (1977). Inputs, Outputs and a theory of production and cost at
depository financial institutions. Journal of Finance, Vol.4, 1251 - 1266.
Lydall, H. (1968). The Structure of Earnings. Oxford at the Clarendon Press.
Main, B., O'Reilly III, C., & Wade, J. (1993). Top Executive Pay: Torunament or Teamwork? Journal of
Labour Economics, 606 - 628.
Mastromarco, C. (2008, September 10). Stochastic Frontier Models. Retrieved 07 12, 2012, from
http://www.camillamastromarco.it/CIDE/STFR.pdf
Maudos, J., Pastor, J. M., Perez, F., & Quesada, J. (2002). Cost and profit efficiency in European
banks. Journal of International Financial Market, 33 - 58.
Mckillop, D., & Glass, J. (1994). A cost model of Building Societies, producers of Mortgage and Non-
mortgage Products. Journal of Business Finance and Accounting, Vol. 21, Issue 7, 1031 -
1046.
McKnight, P. (1996). An explanation of top executive pay: A UK study. Journal of Industrial
Relations.
Meek, G., & Whittington, G. (1975). Directors’ Pay, Growth, and Profitability. Journal of Industrial
Economics, Vol. 24, 1 - 14.
Meeusen, W., & van den Broeck, J. (1977). Efficiency Estimation from Cobb-Douglas Production
Functions With Composed Error". International Economic Review, Vol. 18, 435 - 444.
Mester, L. J. (1993). A multiproduct cost study of savings and loans. Journal of Finance, Vol. 42, 423
- 445.
Molyneux, P., Thornton, J., & Lloyd-Williams, D. M. (1996). Competition and market contestability
in the Japanese commercial banking market’’,. Journal of Economics and Business, Vol. 48,
33 - 45.

58
Murphy, K. (1999). Executive compensation. Marshall School of Buisness .
Nourayi, M., & Mintz, S. (2008). Tenure, firm's performance, and CEO's compensation. Managerial
Finance, Vol. 34, Issue. 8, 524 - 536.
O'Rielly III, C., Main, B., & Crystal, G. S. (1988). CEO compensation as tournament and social
comparison: a tale of two theories. Administrative Science Quaterly, Vol. 33, No.2, 257 -
274.
Ozkan, N. (2011). CEO Compensation and Firm Performance: An Empirical Investigation of UK Panel
Data. European Financial Management, Vol. 17, Issue 2, 260 - 285.
Piesse, J., & Townsend, R. (1995). The measurement of productive efficiency in UK building
societies. Applied Financial Economics, Vol. 5, Issue. 6, 397 - 407.
Pitt, M., & Lee, L. (1981). The Measurement and Sources of Technical Inefficiency in Indonesian
Weaving Industry. Journal of Development Economics, Vol 9, 43 - 64.
Resti, A. (1997). Evaluating Cost-Efficiency of the Italian Banking System, What Can Be Learned
from the Joint Application of Parametric and Non-Parametric Techniques. Journal of
Banking and Finance, Vol.21, 221 - 250.
Rosen, S. (1990). Contracts and the Market for Executives. NBER working paper.
Schaefer, S. (1998). The Dependence of Pay-Performance Sensitivity on the Size of the Firm. Review
of Economics and Statistics, Vol. 80, No. 3, 436 - 443.
Schmidt, P., & Sickles, R. C. (1984). Production frontiers and panel data. Journal of Business &
Economic Statistics, Vol. 2, No. 4, 367 - 374.
Shiwakoti, R. K., Ashton, J. K., & Keasey, K. (2004). Conversion, Perfomance and Executive
Compensation in UK Building Societies. Corporate Governance: An International Review,
361 - 370.
Shleifer, A., & Vishny, R. (1997). A survey of corporate governance. Journal of Finance, 52, 737 -
783.
Simon, H. (1957). The Compensation of Executives. Sociometry, Vol. 20, 32 - 35.
Stathopoulos, K., Espenlaub, S., & Walker, M. (2005). The compensation of UK executive directors:
lots of carrots but are there any sticks? Competition & Change Vol 9:1, 89-105.
The Economist. (Janurary 14th - 20th, 2012). The Economist - Americas Next CEO. Economist.com.
Turner, A. (2010). A Regulatory Response to the Global Banking Crisis, (Financial Services
Authority).
University of Petoria. (2005). Retrieved June 23rd, 2012, from Production Efficiency: Concepts,
Approaches to Measurement, And Empirical Applications:
http://upetd.up.ac.za/thesis/available/etd-10122007-115628/unrestricted/03chapter3.pdf
59
Vander Vennet, R. (2002). Cost and Profit Efficiency of Financial Conglomerates and Universal
Banks in Europe. Journal of Money, Credit and Banking, Vol. 34, 254 - 282.
Varian, H. R. (1984). Nonparametric Approach to Production Analysis. Econometrica, Vol. 52, 579 -
597.
Varian, H. R. (1990). Goodness-of-Fit In Optimizing Models. Journal of Econometrics, Vol. 46, 125 -
140.
Williamson, O. (1986). Economic Organization. New York University Press.
Worthington, A. (1998). Efficiency in Australian building societies: An econometric cost function
approach using panel data. Applied Financial Economics, 459 - 467.
Worthington, A. (2000). Technical Efficiency and Technological Change in Australian Building
Societies. Abacus.
Worthington, A. (2011). Frontier Efficiency Measurement in Deposit-taking Financial Mutuals: A
Review of Techniques, Application, and Future Research Directions. Griffith Business School
Discussion Papers Finance.
Worthinton, A. C. (1999). Measuring technical efficiency in Australian credit unions. The
Manchester School, Vol 67, Issue 2, 231 - 248.