Analysing Amazonian forest productivity using a new ... Fyllas et al 2014.pdf · 3Instituto...
19
Geosci. Model Dev., 7, 1251–1269, 2014 www.geosci-model-dev.net/7/1251/2014/ doi:10.5194/gmd-7-1251-2014 © Author(s) 2014. CC Attribution 3.0 License. Analysing Amazonian forest productivity using a new individual and trait-based model (TFS v.1) N. M. Fyllas 1,* , E. Gloor 1 , L. M. Mercado 2 , S. Sitch 2 , C. A. Quesada 3 , T. F. Domingues 4 , D. R. Galbraith 1 , A. Torre-Lezama 5 , E. Vilanova 5 , H. Ramírez-Angulo 5 , N. Higuchi 3 , D. A. Neill 6 , M. Silveira 7 , L. Ferreira 8 , G. A. Aymard C. 12 , Y. Malhi 9 , O. L. Phillips 1 , and J. Lloyd 10,11 1 Ecology and Global Change, School of Geography, University of Leeds, UK 2 School of Geography, University of Exeter, Exeter, UK 3 Instituto Nacional de Pesquisas da Amazônia, Manaus, Brazil 4 School of GeoSciences, University of Edinburgh, Edinburgh, Scotland, UK 5 Instituto de Investigaciones para el Desarrollo, Forestal Facultad de Ciencias Forestales y Ambientales, Universidad de Los Andes, Merida, Venezuela 6 Department of Wildlife Conservation and Management, Universidad Estatal Amazónica, Puyo, Pastaza, Ecuador 7 Universidade Federal do Acre, Rio Branco, Brazil 8 Museu Paraense Emílio Goeldi, Belém, Brazil 9 Environmental Change Institute, School of Geography and the Environment, University of Oxford, Oxford, UK 10 Centre for Tropical Environmental and Sustainability Science (TESS) and School of Marine and Tropical Biology, James Cook University, Cairns, Australia 11 Department of Life Sciences, Imperial College London, Silwood Park Campus, Ascot, UK 12 UNELLEZ-Guanare, Programa de Ciencias del Agro y el Mar, Herbario Universitario (PORT), estado Portuguesa, Venezuela * currently at: Department of Ecology & Systematics, Faculty of Biology, University of Athens, Athens, Greece Correspondence to: N. M. Fyllas ([email protected]) Received: 24 January 2014 – Published in Geosci. Model Dev. Discuss.: 20 February 2014 Revised: 19 May 2014 – Accepted: 21 May 2014 – Published: 3 July 2014 Abstract. Repeated long-term censuses have revealed large- scale spatial patterns in Amazon basin forest structure and dynamism, with some forests in the west of the basin having up to a twice as high rate of aboveground biomass production and tree recruitment as forests in the east. Possible causes for this variation could be the climatic and edaphic gradients across the basin and/or the spatial distribution of tree species composition. To help understand causes of this variation a new individual-based model of tropical forest growth, de- signed to take full advantage of the forest census data avail- able from the Amazonian Forest Inventory Network (RAIN- FOR), has been developed. The model allows for within- stand variations in tree size distribution and key functional traits and between-stand differences in climate and soil phys- ical and chemical properties. It runs at the stand level with four functional traits – leaf dry mass per area (M a ), leaf nitrogen (N L ) and phosphorus (P L ) content and wood den- sity (D W ) varying from tree to tree – in a way that repli- cates the observed continua found within each stand. We first applied the model to validate canopy-level water fluxes at three eddy covariance flux measurement sites. For all three sites the canopy-level water fluxes were adequately simu- lated. We then applied the model at seven plots, where inten- sive measurements of carbon allocation are available. Tree- by-tree multi-annual growth rates generally agreed well with observations for small trees, but with deviations identified for larger trees. At the stand level, simulations at 40 plots were used to explore the influence of climate and soil nu- trient availability on the gross ( G ) and net ( N ) primary production rates as well as the carbon use efficiency (C U ). Simulated G , N and C U were not associated with tem- perature. On the other hand, all three measures of stand level Published by Copernicus Publications on behalf of the European Geosciences Union.
Transcript of Analysing Amazonian forest productivity using a new ... Fyllas et al 2014.pdf · 3Instituto...

Geosci. Model Dev., 7, 1251–1269, 2014www.geosci-model-dev.net/7/1251/2014/doi:10.5194/gmd-7-1251-2014© Author(s) 2014. CC Attribution 3.0 License.
Analysing Amazonian forest productivity using a new individualand trait-based model (TFS v.1)N. M. Fyllas1,*, E. Gloor1, L. M. Mercado2, S. Sitch2, C. A. Quesada3, T. F. Domingues4, D. R. Galbraith1,A. Torre-Lezama5, E. Vilanova5, H. Ramírez-Angulo5, N. Higuchi3, D. A. Neill6, M. Silveira7, L. Ferreira 8,G. A. Aymard C.12, Y. Malhi 9, O. L. Phillips1, and J. Lloyd10,11
1Ecology and Global Change, School of Geography, University of Leeds, UK2School of Geography, University of Exeter, Exeter, UK3Instituto Nacional de Pesquisas da Amazônia, Manaus, Brazil4School of GeoSciences, University of Edinburgh, Edinburgh, Scotland, UK5Instituto de Investigaciones para el Desarrollo, Forestal Facultad de Ciencias Forestales y Ambientales,Universidad de Los Andes, Merida, Venezuela6Department of Wildlife Conservation and Management, Universidad Estatal Amazónica, Puyo, Pastaza, Ecuador7Universidade Federal do Acre, Rio Branco, Brazil8Museu Paraense Emílio Goeldi, Belém, Brazil9Environmental Change Institute, School of Geography and the Environment, University of Oxford, Oxford, UK10Centre for Tropical Environmental and Sustainability Science (TESS) and School of Marine and Tropical Biology,James Cook University, Cairns, Australia11Department of Life Sciences, Imperial College London, Silwood Park Campus, Ascot, UK12UNELLEZ-Guanare, Programa de Ciencias del Agro y el Mar, Herbario Universitario (PORT),estado Portuguesa, Venezuela* currently at: Department of Ecology & Systematics, Faculty of Biology, University of Athens, Athens, Greece
Correspondence to:N. M. Fyllas ([email protected])
Received: 24 January 2014 – Published in Geosci. Model Dev. Discuss.: 20 February 2014Revised: 19 May 2014 – Accepted: 21 May 2014 – Published: 3 July 2014
Abstract. Repeated long-term censuses have revealed large-scale spatial patterns in Amazon basin forest structure anddynamism, with some forests in the west of the basin havingup to a twice as high rate of aboveground biomass productionand tree recruitment as forests in the east. Possible causesfor this variation could be the climatic and edaphic gradientsacross the basin and/or the spatial distribution of tree speciescomposition. To help understand causes of this variation anew individual-based model of tropical forest growth, de-signed to take full advantage of the forest census data avail-able from the Amazonian Forest Inventory Network (RAIN-FOR), has been developed. The model allows for within-stand variations in tree size distribution and key functionaltraits and between-stand differences in climate and soil phys-ical and chemical properties. It runs at the stand level withfour functional traits – leaf dry mass per area (Ma), leaf
nitrogen (NL) and phosphorus (PL) content and wood den-sity (DW) varying from tree to tree – in a way that repli-cates the observed continua found within each stand. We firstapplied the model to validate canopy-level water fluxes atthree eddy covariance flux measurement sites. For all threesites the canopy-level water fluxes were adequately simu-lated. We then applied the model at seven plots, where inten-sive measurements of carbon allocation are available. Tree-by-tree multi-annual growth rates generally agreed well withobservations for small trees, but with deviations identifiedfor larger trees. At the stand level, simulations at 40 plotswere used to explore the influence of climate and soil nu-trient availability on the gross (5G) and net (5N) primaryproduction rates as well as the carbon use efficiency (CU).Simulated5G,5N and CU were not associated with tem-perature. On the other hand, all three measures of stand level
Published by Copernicus Publications on behalf of the European Geosciences Union.
1252 N. M. Fyllas et al.: Analysing Amazonian forest productivity using a new individual and trait-based model
productivity were positively related to both mean annual pre-cipitation and soil nutrient status. Sensitivity studies showeda clear importance of an accurate parameterisation of within-and between-stand trait variability on the fidelity of modelpredictions. For example, when functional tree diversity wasnot included in the model (i.e. with just a single plant func-tional type with mean basin-wide trait values) the predictiveability of the model was reduced. This was also the casewhen basin-wide (as opposed to site-specific) trait distribu-tions were applied within each stand. We conclude that mod-els of tropical forest carbon, energy and water cycling shouldstrive to accurately represent observed variations in function-ally important traits across the range of relevant scales.
1 Introduction
The Amazon basin, encompassing one of the planet’s largestforest areas and hosting one quarter of the Earth’s biodiver-sity, constitutes a large reservoir of living biomass (Malhi andPhillips, 2005). Amazon forests also have a substantial influ-ence on regional and global climates (Shukla et al., 1990;Spracklen et al., 2012). These forests are, however, understrong human pressure through logging and forest-to-pastureconversion, and face at present a warming and more variableclimate and changing atmospheric composition (Lewis et al.,2004; Gloor et al., 2013). Due to the enormous area of for-est within the Amazon basin, these factors have the potentialto modify global atmospheric greenhouse concentrations, re-gional and global climate, and the overall biodiversity of theplanet (Cramer et al., 2004).
Traditionally, two approaches have been followed to un-derstand current and future state of the Amazon forests. First,dynamic global vegetation models (DGVMs) have been usedto simulate vegetation patterns and carbon fluxes acrossAmazonia (Moorcroft et al., 2001; Galbraith et al., 2010)with some predicting substantial carbon losses under scenar-ios of global change (White et al., 1999; Cox et al., 2004)but with others less so (Cramer et al., 2004), or even gains(Huntingford et al., 2013). A second approach to understandAmazonian forests dynamics is through the analysis of long-term field observations of patterns of tree growth and mortal-ity as they relate to climatic and edaphic variations across thebasin (e.g. Phillips et al., 2004; Quesada et al., 2012).
Analyses of Amazon forest inventory data, and particu-larly those of the Amazon Forest Inventory Network (RAIN-FOR) (Malhi et al., 2002), have revealed large-scale temporaltrends in biomass and species composition as well as intrigu-ing spatial patterns in many stand properties (Phillips et al.,1998; Baker et al., 2004; Phillips et al., 2009). Specifically,there is systematic spatial variation in species composition,biomass, growth and turnover rates, with western forests ex-hibiting higher wood productivity, faster turnover time andlower stand wood density compared to eastern forests (Baker
et al., 2004; Malhi et al., 2006). This macroecological vari-ation may possibly be explained by the basin-wide observedclimate and soil nutrient availability gradients (Ter Steege etal., 2006; Quesada et al., 2012). The climatic gradient com-prises a southeast to northwest increase in annual precipita-tion and decrease in dry season length (Sombroek, 2001),with aboveground wood productivity positively related toprecipitation (Malhi and Wright, 2004). On the other hand,a soil age/nutritional axis spans from the northeastern part ofthe basin to southwestern Amazonia, with generally youngerand richer soils in the west and highly weathered nutrientpoor soils in the east (Sombroek, 2000; Quesada et al., 2011),although at regional and local scales the patterns are of-ten more complicated than this macro-gradient might imply(Higgins et al., 2011). Soil physical properties (such as root-ing depth, drainage and water holding capacity and soil struc-ture) are similarly related to soil age and parental material(Quesada et al., 2010). Poor physical (for example soil depth)conditions (less weathered soils) are often associated withhigher soil nutrient availability (Walker and Syers, 1976; Vi-tousek and Farrington, 1997), leading to increased nutrientconcentrations at the leaf level (Fyllas et al., 2009) and thusa potential for higher photosynthetic rates (Reich et al., 1994;Raaimakers et al., 1995). In addition, increased disturbance-associated mortality rates in soils of poor physical proper-ties lend towards more dynamic stands where faster growingspecies dominate (Chao et al., 2009; Quesada et al., 2012).This positive feedback mechanism could explain the higheraboveground productivity and turnover rates observed forwestern forests (Quesada et al., 2012).
The simplistic ways by which plant functional diversityis currently reflected in DGVMs is an important shortcom-ing in predicting ecosystem response to environmental gradi-ents and their vulnerability to global change (Lavorel et al.,2007). Some of the widely applied DGVMs represent Ama-zonian plant diversity with only few plant functional types(PFTs), for example the LPJ model uses only two tropical-oriented PFTs (Sitch et al., 2003) and the JULES model onlyone (Clark et al., 2011). The mean values of key model pa-rameters like photosynthetic capacity, wood density and leafturnover times are selected to describe an a priori PFT defini-tion (Fyllas et al., 2012). This means that many processes arecontrolled by a set of fixed parameters that describe viableplant strategies within very limited boundaries. Such PFTimplementation has important drawbacks. It is usually basedon the average value of a plant trait recorded from differentfield studies and different species. But recent studies haveshown that key traits present a wide variation, dependentupon species identity and site growing conditions (Sultan,2000; Fyllas et al., 2009; Baraloto et al., 2010a). Thus anygiven species has the potential to exhibit site-dependent shiftsin its trait value; this being in addition to the inter-specifictrait variability expected at any given site. Ignoring this plas-ticity could potentially bias modelling through an underes-timation of the PFT’s resilience by projecting dramatic but
Geosci. Model Dev., 7, 1251–1269, 2014 www.geosci-model-dev.net/7/1251/2014/
N. M. Fyllas et al.: Analysing Amazonian forest productivity using a new individual and trait-based model 1253
artificial switches in vegetation state caused by the limitedand discrete (step-wise) nature of PFT descriptions.
Such unaccounted variability could be particularly im-portant when modelling Amazonian forest dynamics, whereenvironmental heterogeneity and plant functional diversitycomprise key components of the ecosystem (Townsend etal., 2008). For example, the variation in leaf mass per area(Ma) recorded within Amazon forests covers an approxi-mately similar range to the one identified in global data sets,ranging from 30 to 300 g m−2 (Fyllas et al., 2009). Similarly,there are large contrasts in soil physical and chemical con-ditions (Quesada et al., 2010). These important ecosystemflux drivers have now been better quantified, with Amazon-wide climate (Malhi and Wright, 2004), soil (Quesada et al.,2011) and functional trait data sets also having been obtained(Baker et al., 2009; Fyllas et al., 2009; Patiño et al., 2009;Patiño et al., 2012). This is in addition to continually expand-ing long-term forest inventory data in which tree growth,mortality and species composition data are regularly beingrecorded (Keeling et al., 2008; Chao et al., 2009).
We here introduce a vegetation dynamics model devel-oped as a tool to better analyse these observed Amazonianlarge-scale productivity patterns. This is achieved throughspecific incorporations of observed environmental and the bi-otic variations into the model formulation. Specifically wefocus (a) on the architectural variability, expressed throughthe size-class distribution of a stand, and (b) on the functionalvariability, expressed through simulated distributions of fourimportant functional traits which are allowed to vary fromtree to tree within individual plots. Following a continuumapproach, we replace the use of a discrete number of PFTs,with distributions of a functional trait “quartet”, the within-stand distributions of which also vary from plot to plot inaccordance with observation.
Two axes of functional variation/strategy are representedin the model: the leaf economic and the tree architecturespectra. The four functional traits include leaf mass per area(Ma), leaf nitrogen and phosphorous dry mass concentra-tion (NLm and PLm respectively) and wood density (DW).The first three traits express one component of the leaf eco-nomic spectrum (Reich et al., 1997; Wright et al., 2004),i.e. a global photosynthetic tissue trade-off between inex-pensive, short-lived and fast payback leaves vs. costly, long-lived and slow payback leaves, although we emphasise thatother factors such as leaf cation concentrations may be im-portant in this respect (Fyllas et al., 2012; Patiño et al., 2012).Low Ma and high nutrient content leaves are associated withcomparably short longevity and usually have high (mass-based) gas exchange rates (Reich et al., 1994; Raaimakerset al., 1995). Lately the role of PLm has been highlighted,as it expresses alternative limitations of the photosyntheticefficiency of tropical tree species (Domingues et al., 2010).The fourth trait,DW, is used to represent a tree architecturalaxis with denser wood species supporting an overall higheraboveground biomass and thus having a higher maintenance
respiration (Chave et al., 2005; Mori et al., 2010, althoughsee Larjavaara and Muller-Landau, 2012). These two di-mensions capture essentially a growth vs. survival trade-off.There is mixed evidence for a coordination between leaf andstem traits, i.e. a correlation between slow return related leaftraits and denser wood (Chave et al., 2009), with Baralotoet al. (2010b) suggesting that these two axes are indepen-dent, but with Patiño et al. (2012) showing some importantcorrelations with foliar traits such as PLm. For the purposeof this study we consider leaf and stem dimensions as inde-pendent axes of tree functional variation, with no predefinedinterrelationship between the representative traits. However,the observed among-stand variability of these four charac-ters is used to express how growing conditions control plantprocesses, while the within-stand trait variation represents arange of ecological strategies found under the same growingconditions.
The model is initialised with site-specific tree diameter andfunctional traits data, and forced with daily climate data. Wefirst test the ability of the model to estimate stand-level waterfluxes at three eddy-flux tower sites. For a subset of sevenRAINFOR plots where site-specific carbon allocation coeffi-cients are known, a tree-level test of stem growth rates is ap-plied. We further validate the ability of the model to simulatethe spatial patterns of aboveground biomass productivity at40 RAINFOR plots, and subsequently explore the variationof Gross Primary Productivity (5G), Net Primary Productiv-ity (5N) and Carbon Use Efficiency (CU) along establishedAmazonian climatic and edaphic gradients.
2 Materials and methods
2.1 Model description
“Traits-based Forest Simulator” (TFS) is an individual-basedforest model, i.e. it simulates water and carbon fluxes foreach tree in a stand. In the current version of the model,stand structure is prescribed in terms of the number of treesand their diameter at breast height (d). This is thus a “snap-shot” version of the model, which does not take into accounttree recruitment and mortality. In this version of TFS, eachindividual is fully described throughd, with allometric equa-tions used to estimate other attributes of interest like treeheight (H), crown area (Ca), total leaf area (La) and tree-level leaf area index (L). Whole tree biomass is then parti-tioned to leaf (BL), stem (BS), coarse root (BCR) and fine root(BFR) biomass using established allometric equations. Allo-cation of assimilated carbon to different plant componentsis static, i.e. it does not change with size or resource avail-ability, but rather implements field-derived allocation coeffi-cients (Aragão et al., 2009). The general architecture of themodel is presented in Fig. 1.
www.geosci-model-dev.net/7/1251/2014/ Geosci. Model Dev., 7, 1251–1269, 2014
1254 N. M. Fyllas et al.: Analysing Amazonian forest productivity using a new individual and trait-based model
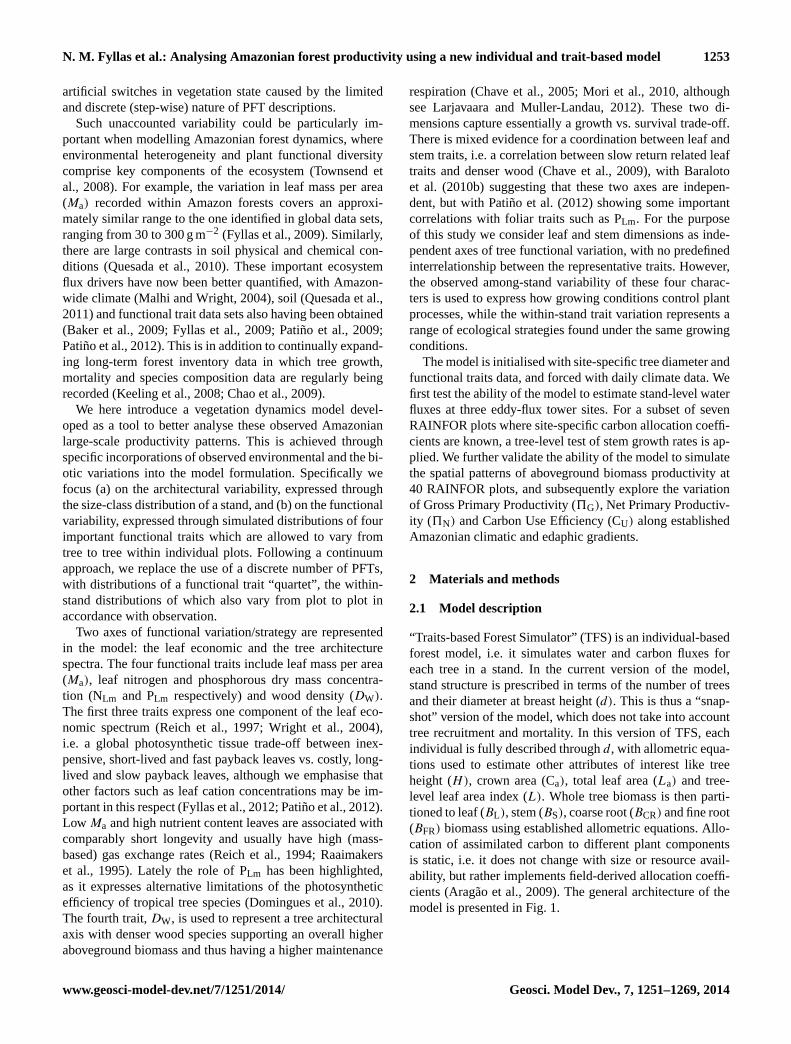
Figure 1. The five basic components of the model and information flow among them. Tree by tree traits and size initialisation takes place atthe beginning of each simulation. Carbon and water fluxes, as well as gross and net primary productivity are estimated daily.
Tree functional diversity is expressed through four traits(Ma, NLm, PLm, DW), which are randomly assigned to eachtree: these pseudo-data being generated from local observa-tions using a random vector generation algorithm. Leaf pho-tosynthesis is calculated using a modified version of the Far-quhar biochemical model (Farquhar et al., 1980), that incor-porates leaf chemical and soil moisture effects. The maxi-mum photosynthetic rate is regulated by NL or PL throughthe co-limitation model of Domingues et al. (2010). In con-trast to most ecosystem fluxes models, where photosyntheticrates are directly regulated by water availability (Scheiter andHiggins, 2009; Clark et al., 2011), we couple water “stress”to reduction of canopy conductance by estimating a dailyfractional available soil water content for each tree in thestand. Carbon fluxes are simulated on an hourly and waterfluxes on a daily time step.
Light competition is based on the assumption of a perfectcanopy tessellation. The flat-top version of the perfect plas-ticity model (Purves et al., 2007) has been used in the currentversion of TFS to characterise canopy and sub-canopy trees,by assuming that all of a tree’s foliage is found at the topof its stem (S1, Canopy Architecture and Radiation Environ-ment). A canopy heightZ* is estimated for each forest stand,defining canopy and sub-canopy trees. By summing up thecrown area (Ca) of all trees in the stand,Z* is estimated asthe height of the last tree that enters to the sum before thecumulative crown area is equal to the plot area. Canopy treesare absorbing a mean daily amount of short-wave solar radi-ation equal to the sum of mean beam, diffuse and scattered
daily radiation in correspondence to the sun–shade model ofde Pury and Farquhar (1997). The direct and diffuse fractionof solar radiation is estimated using the Spitters et al. (1986)approximation. The functional configuration of a tree (i.e. thevalues of the quartet of traits) does not affect its light com-petitive status, as tree height and crown area are not directlyassociated with any of the four traits. Future versions of themodel will incorporate such effects.
Soil water balance is approximated through a simplebucket model, with soil water content affecting leaf conduc-tance and thus photosynthetic rates. Competition for soil wa-ter is approximated through a size hierarchy, i.e. bigger trees,with a more extensive root system are assumed to have ac-cess to deeper water (S1, Water Balance Algorithm). By as-suming that a tree with a higher leaf biomass (BL) requiresa higher fine root biomass (BFR), we indirectly implementa Ma effect on water competition (S1, Definition, Allometryand Stoichiometry of Individual Trees in TFS). In particular,between two trees of the same size, the higherMa tree willbe more competitive in terms of acquiring soil water.
TFS is coded in Java and it is fully described in S1. Themain effects of including functional diversity are realisedthrough trait-driven effects on photosynthesis and respiration(Reich et al., 2008, 2009). Model components that are linkedwith any of the four base traits are described in the follow-ing paragraphs. All statistical analyses and graphs were madewith R (R Development Core Team, 2013).
Geosci. Model Dev., 7, 1251–1269, 2014 www.geosci-model-dev.net/7/1251/2014/

N. M. Fyllas et al.: Analysing Amazonian forest productivity using a new individual and trait-based model 1255
2.1.1 Within-stand functional diversity
As noted above, TFS employs neither species nor PFT de-scriptions, but rather a different discrete combination of eachthe four key functional traitsMa, NLm, PLm andDW is as-signed to each individual tree along with a diameter-basedallometry. To achieve this, the four functional characters as-signed are generated using a procedure based on the ac-tual values recorded within each plot. This is achieved usinga random vector generation algorithm (Taylor and Thomp-son, 1986). This algorithm, appropriate for generating non-repeated pseudo-observations from a relatively small sam-ple of observations, was originally developed to provide fora realistic probabilistic representation of shrapnel projectiledistributions in military battlefield simulations in the face ofonly a limited amount of available data (due to the cost anddifficulty of undertaking the appropriate experiments). This“ballistic method” is notable in that it was specifically de-signed to short-circuit the usual step of multivariate densityin the generation a pseudorandom population with approxi-mately the same moments as the original sample. The bal-listic method is readily programmable as follows (with theunderlying rationale as discussed in Taylor and Thompson,1986 and Thompson, 1989) and with the following descrip-tion based on Visual Numerics (2014).
First take a vectorX with n multivariate observations(x1, . . . ,xN). To generate a pseudo data set fromx, oneobservation (xj ) is first chosen at random and its near-estm neighbours,xj1, xj2, xjm are then determined and withthe meanxj of those nearest neighbours subsequently cal-culated. Next, a random sampleu1,u2, . . . ,um is generated
from a uniform distribution with lower bound1m
−
√3(m−1)
m2 ,
and upper bound1m
+
√3(m−1)
m2 . The random variate is then
estimated asm∑
l=1u1(xj l − xj ) + xj and the process then re-
peated as required. Somewhat subjective here is the selectionof the appropriate value of the number of nearest neighbours(m) although the nature of the simulations is not strongly de-pendent upon that value (Taylor and Thompson, 1986). Thus,following their recommendation and as in the Visual Numer-ics (2014) default, we have taken herem = 5.
In our case, applying this procedure resulted in a coordi-nated trait quartet for each tree in a stand being generated onthe basis on the smaller observational trait quartets sampledfrom trees in the same stand (Baker et al., 2009; Fyllas etal., 2009; Patiño et al., 2012) and without any assumptionshaving to be made about their underlying statistical distribu-tions. Thus no single functional trait “average stand” value isused (or even required). Further, between-stand differencesin the trait distributions and their covariances are also in-trinsically taken into account. This is because each stand ischaracterised by its own multivariate trait sample and sizedistribution. More fertile plots have an overall lowerMa and
higher NLm and PLm compared to infertile plots (Fyllas et al.,2009), with this being reflected in the photosynthetic capac-ity of individual trees, as described in the next paragraph.
2.1.2 Photosynthesis
A tree-level leaf area index (L), estimated as the ratio ofLa to Ca, is used to compute the energy, carbon and waterfluxes for each tree in a stand. The net photosynthetic rate(µmol m−2 s−1) is given by
AN = gS(Cα − Cc) (1)
with Cα the atmospheric CO2 mixing ratio (µmol mol−1), Ccthe CO2 mixing ratio inside the chloroplast andgS the CO2stomatal conductance (mol m−2 s−1) calculated from Med-lyn et al. (2011) and modulated by a soil moisture term. Theleaf-level photosynthetic rateAN is scaled up to the tree-levelby multiplying with the Ca of the tree.
The co-limitation equation suggested by Domingues etal. (2010), whereby the leaf level photosynthetic capacity(area basis) is potentially limited by either nitrogen or phos-phorus, is used in TFS to estimate the leaf maximum car-boxylation and electron transport rates:
Vmax = Ma(min{aNV + vNVNLm,aPV + vPVPLm}) (2)
Jmax = Ma(min{aNJ+ vNJNLm,aPJ+ vPJPLm}) (3)
(both in µmol m−2 s−1), with aNV , aNJ, aPV, aPJ (inµmol g−1 s−1) and νNV , νNJ,νPV, νPJ (in µmol mg−1 s−1)
empirical coefficients (see Table of symbols in Sup-plement S1). The canopy-level photosynthetic capacityVCmax(µmol m−2 s−1) is estimated using the tree-level leafarea indexL, taking into account within-canopy gradientsin light and photosynthetic capacity based on Lloyd etal. (2010). Nutrient optimisation is approximated using equa-tions in Lloyd et al. (2010), withMa also dependent on theheight of each tree (Hi) and the mean canopy height (HS):
M∗a = Ma · exp
[aH · (Hi − HS)
], (4)
with aH an empirical coefficient.
2.1.3 Respiration
Tree respiration includes a growth and a maintenance compo-nent, both computed daily. Growth respiration is consideredas a constant fraction (0.25) of daily photosynthesis (Cannelland Thornley, 2000). Three different maintenance respirationformulations are allowed in TFS (S1, Respiration), but in thisstudy we use the one described below. Leaf maintenance res-pirationRmL is estimated as a fraction ofVCmax(Scheiter andHiggins, 2009):
RmL = 0.015VCmax. (5)
Stem maintenance respiration is estimated from the sap-wood volume (VS) of a tree:
RmS = δVS (6)
www.geosci-model-dev.net/7/1251/2014/ Geosci. Model Dev., 7, 1251–1269, 2014

1256 N. M. Fyllas et al.: Analysing Amazonian forest productivity using a new individual and trait-based model
with δ = 39.6 (µmol m−3 s−1) as reported in Ryan etal. (1994) for tropical trees.
Sapwood volume is estimated by inversion of the pipemodel and assuming that the ratio of leaf area to sapwoodarea (8LS) increases with the height and the wood densityfor tropical trees (following Calvo-Alvarado et al., 2008;Meinzer et al., 2008):
8LS = 0.5× (λ1 + λ2 · H + δ1 + δ2DW), (7)
with λ1 = 0.066 m2 cm−2, λ2 = 0.017 m cm−2, δ1 =
−0.18 m2 cm−2 andδ2 = 1.6 cm3 g−1.Sapwood area (m2) and volume (m3) are then calculated
from
SA = LA/8LS (8)
with La the total leaf area of the tree (m2) and
SV = SA · (H − CD) (9)
with CD the crown depth (m).Coarse-root maintenance respirationRmCR is estimated as
in Scheiter and Higgins (2009):
RmCR = 0.218βRBCR
8CN, (10)
where8CN is the root C: N ratio estimated on the basis ofthe simulated NR assuming a dry weight carbon fraction of0.5.
Fine-root maintenance respirationRmFR is assumed to beequal to leaf respiration.
All respiratory components are corrected with the temper-ature dependence function of Tjoelker et al. (2001). The totalmaintenance respirationRm is then
Rm = RmL + RmS+ RmCR+ RmFR. (11)
2.1.4 Stomatal conductance
Initially, a maximum (no water stress) stomatal conductance,gs,max is calculated following Medlyn et al. (2011, 2012):
gs,max= g0 + 1.6 · (1+g1
√DC
) ×An
Ca(12)
with g0 (mol m−2 s−1) the minimum stomatal conductance,g1(−) an empirical coefficient that represents the water useefficiency of the plant, andDC the leaf-to-atmosphere vapourpressure difference. Values ofg0 andg1 that lead to the bestmodel performance were different between sites, as indicatedby the model calibration procedure. For the basin-wide sim-ulations constant values ofg0 = 0.020 (mol m−2 s−1) andg1 = 5.0 (−) were used, close to the estimates of Domingueset al. (2014). In future versions of the model, we anticipatethatg0 andg1 will be related to other functional traits. The
maximum stomatal conductance is subsequently reduced tothe actualgS by multiplying the second term of Eq. (8) witha water stress coefficient.
In contrast to most ecosystem flux models, where pho-tosynthetic rates are directly regulated by water availability(Scheiter and Higgins, 2009; Clark et al., 2011), we couplesoil water deficit to canopy conductance by estimating a dailyfractional available soil water contentϑi for eachi tree in thestand (S1, Water Balance and Soil Water Stress). This termis then used to estimate the water stressγi that has a directeffect on stomatal conductance, as also described in Keenanet al. (2010).
2.2 Study sites and simulations setup
Three sets of site data were used to explore the behaviour ofthe model. These include a set of three eddy flux measure-ment (EFM) sites, seven plots with intensive carbon balanceand allocation measurements (IMs), and 40 permanent mea-surement (PM) plots.
2.2.1 Eddy flux sites
Daily climate and energy flux data from three EFM sites(Caxiuanã [1.72◦ S, 51.46◦ W], Manaus [2.61◦ S, 60.21◦ W]and Tapajós [2.86◦ S, 54.96◦ W]) were used to assessthe ability of the model to estimate canopy-level wa-ter fluxes. Data were obtained from the Large ScaleBiosphere-Atmosphere Experiment in Amazonia (LBA)project (http://daac.ornl.gov/LBA/lba.shtml). In particularmean daily climate parameters including incoming radiation,temperature, precipitation, relative humidity and wind speedwere used to force the model. Latent heat flux (λE in W m−2)
was used to estimate a daily mean canopy conductance de-fined asGC =
λEDC
. The EFM data cover a period from 2001to 2008 for Caxiuanã, from 2000 to 2005 for Manaus andfrom 2002 to 2004 for Tapajós.GC was only estimated fordays with a complete diurnal record ofλE. At each one of theEFM sites the mean dailyGC (mol m−2 s−1) was comparedbetween observations and simulations. The model was ini-tialised with size-class distribution and functional traits datafrom RAINFOR permanent plots located near the eddy fluxtowers. Specifically, CAX-06 inventory data were used forCaxiuanã, BNT-04 for Manaus, and TAP-55 for Tapajós. Wenote that the EFM sites are mainly found at the eastern partof Amazonia (Fig. 2) growing on low nutrient status soils.
The model was initially calibrated to the site-specific val-ues forg0 andg1 of Eq. (8) that gave the best performance.A standardised major axis (SMA) regression, forced throughzero, was used to verify the ability of the model to simulateGC, with a regression slope close to one indicating a goodmodel performance.
Geosci. Model Dev., 7, 1251–1269, 2014 www.geosci-model-dev.net/7/1251/2014/

N. M. Fyllas et al.: Analysing Amazonian forest productivity using a new individual and trait-based model 1257
Figure 2.Geographic distribution of study sites. Dark grey trianglesindicate the three eddy flux tower sites (with local names), light greycircles indicate the seven intensive measurement plots (with plotcodes), and crosses indicate the coordinates of the 40 RAINFORpermanent measurement plots.
2.2.2 Intensive measurement (IM) sites
The ability of the model to realistically simulate carbonfluxes at the tree level is evaluated using data from the sevenintensive measurement plots (Aragão et al., 2009; Malhi etal., 2009). These sites are amongst the intensively surveyedplots within the RAINFOR network (Fig. 2), where measure-ments of all major components of the C cycle are recorded(Malhi et al., 2009). At these plots, a detailed assessment ofthe carbon stocks is applied, and5N allocation coefficientsto different plant components are estimated (Aragão et al.,2009; Malhi et al., 2011; Doughty et al., 2014). These site-specific coefficients are used to calculate the amount of sim-ulated5N that is allocated to stems5N,s (kg C yr−1).
The IM sites of interest include two plots at Agua Pudrein Colombia (AGP-01 and AGP-02), one (ALP-30) at All-pahuayo/Peru, one (BNT-04) at Manaus/Brazil, one in Cax-iuanã/Brazil (CAX-06), one in Tambopata/Peru (TAM-05)and one in (TAP-55) Tapajós/Brazil. Based on data fromQuesada et al. (2011), AGP-01, AGP-02, TAM-05 can beconsidered to be located on fertile soils, with the other fourplots on infertile ones. Available soil depth data (Quesada etal., 2011) and functional traits data (Fyllas et al., 2009) wereused for site-specific simulations. For all seven sites we esti-mated the observed average multi-annual growth rate (2000–2006) of each tree from forest census data, in order to com-pare it with the simulated5N,s.
The daily climate was extracted from the Princeton GlobalMeteorological Forcing Data Set (Sheffield et al., 2006).These simulations are used to validate the ability of themodel to accurately estimate tree-level stem growth, under
a given stand structure, a given climatic and soil profile andfunctional traits configuration of the established trees. Aver-age observed stem growth rate (per 10 cmd bins), expressedin carbon units (i.e. kg C yr−1), is compared with simulated5N,s using the York method of best straight line, which holdswhen bothx andy observations are subject to correlated er-rors that vary from point to point (York et al., 2004).
2.2.3 Permanent measurement (PM) sites
Inventory data from 40 RAINFOR permanent measurementplots (Fig. 2), including tree diameter and multi-annualgrowth for all trees greater than 10 cm curated/managed inForestPlots.net (Lopez-Gonzalez et al., 2011), are used to(a) validate the ability of the model to accurately simulatestand-level carbon fluxes and (b) explore patterns of5G, 5Nand CU along the Amazonian climatic and soil nutrient avail-ability gradient. The size-class distribution within each PMsite is used to initialise the stand structure of the model andsimulate patterns of productivity for the 2000–2006 period.Climate data for the same period were used here with the firstyear again used as a spin-up period (Sheffield et al., 2006).For those 40 PM plots, sample distributions of the traits quar-tet are available (Fyllas et al., 2009) as well as a descrip-tion of soil chemical and physical properties (Quesada et al.,2011).
At the PM sites the simulated stand-level aboveground5Nwas compared with observed rates of aboveground growth1BABG [kg C m−2 yr−1
] for trees that survived during the2000–2006 time period using a SMA regression. A secondstep was to explore the way that5G, 5N and CU vary acrossan Amazon climatic and soil nutrient availability gradient(Quesada et al., 2010). The site scores of a principal com-ponents analysis (PCA) on the soil properties of the 40 PMplots (see Fyllas et al., 2009) are used to categorise plotsalong a nutrient availability gradient (81), while the key cli-matic variables used were the annual mean temperatureTaand annual total precipitation Pa. A Kendall correlation coef-ficient (τ) was used to identify potential relationships of5G,5N and CU with Ta, Pa and81, as in most cases non-linearassociations were observed.
2.2.4 Randomisation exercise
In order to explore (a) the importance of including trait vari-ability and thus functional diversity in our simulations and(b) the importance of including constraints that are known tocontrol the large-scale patterns of Amazonian forest dynam-ics, we conducted a randomisation exercise with the modelbeing run under four alternative setups at the 40 perma-nent RAINFOR plots. The first setup denoted asvar-tr isthe variable-trait simulation with trait initialisation based onthe observed stand-level trait distribution as described in theprevious paragraphs (default setup). The second setup, de-noted asfix-tr, is a fixed-trait simulation with all trees having
www.geosci-model-dev.net/7/1251/2014/ Geosci. Model Dev., 7, 1251–1269, 2014
1258 N. M. Fyllas et al.: Analysing Amazonian forest productivity using a new individual and trait-based model
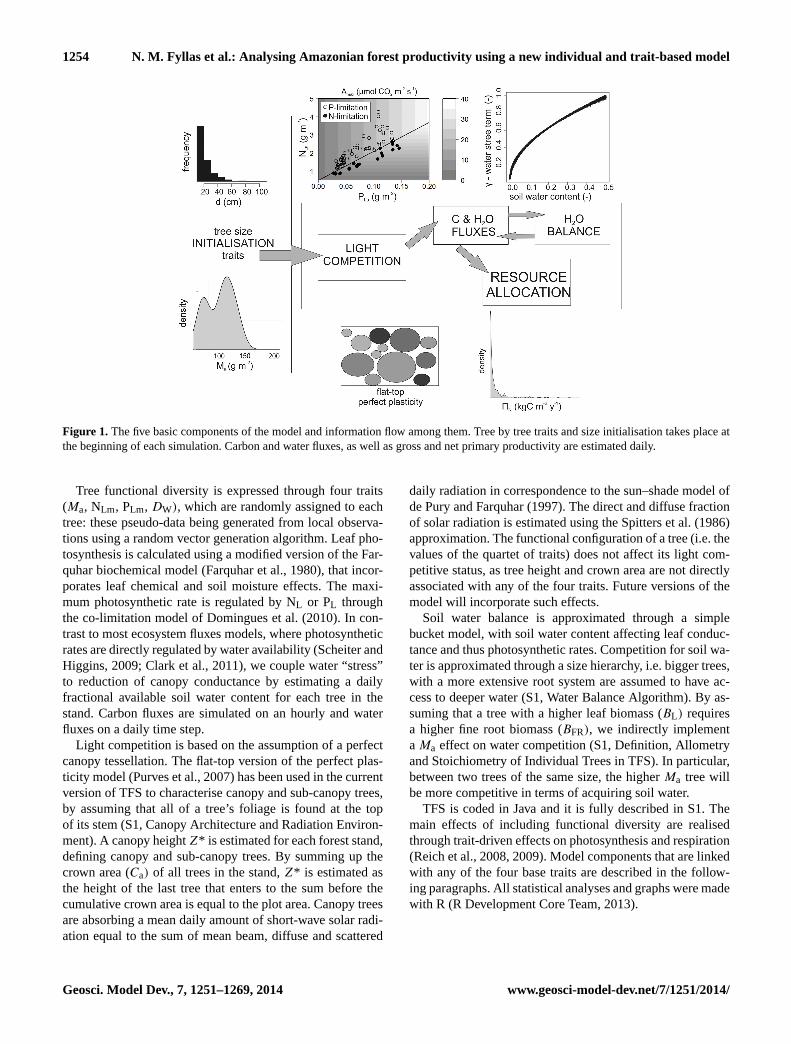
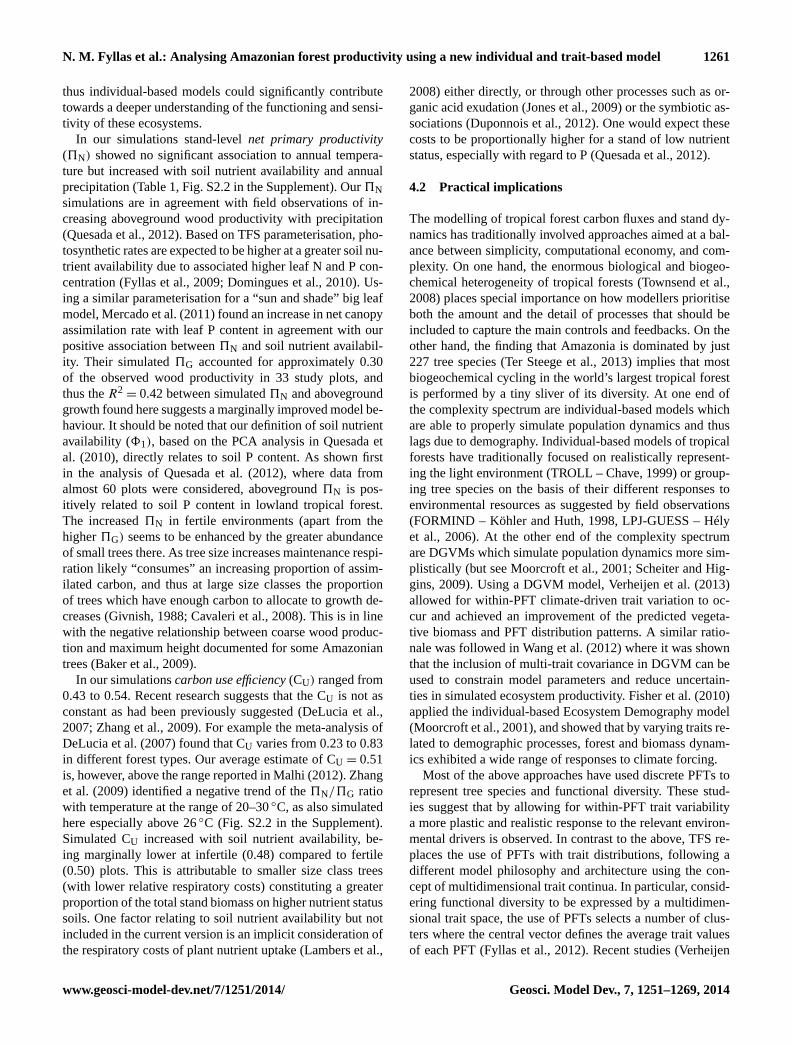
Figure 3. Simulated against observed mean daily canopy conductanceGC for the three sites with eddy flux data. The broken line representsa 1: 1 relationship and the continuous line illustrates a standardised major axis (SMA) regression.
the same (data set mean) values for each trait: this thus rep-resenting a single PFT case. The third setup (rand-tr) is avariable-trait simulation with trait initialisation based on ran-dom values of the trait quartet as recorded in any individualalong the 40 permanent plots. This setup thus ignores any po-tential patterns of functional trait biogeography, i.e. traits arenot related to the environmental or edaphic conditions underwhich a tree is growing. The fourth setup(rand-tr-N) is avariable-trait simulation in which the photosynthetic capac-ity of an individual is only defined by its leaf N content andthus the NP co-limitation constraint is removed. These alter-native setups were compared by considering both the slopeand theR2 of SMA regressions between the predicted andthe observed5N,S.
3 Results
3.1 Canopy conductance simulations at the EFM sites
Values of best model performance forg0 andg1 were differ-ent between sites, withg0 = 0.035 (mol m−2 s−1) andg1 =
7.5 at Caxiuanã,g0 = 0.035 andg1 = 7.0 at Manaus withg0 = 0.01 andg1 = 2.5 these being somewhat lower than theestimates of Domingues et al. (2013) at Tapajós. SimulatedGC was underestimated for Caxiuana (α = 0.85± 0.05) andManaus (α = 0.90 ± 0.02), with the model overestimatingGC in Tapajós (α = 1.28± 0.04), but exhibiting an overalladequate performance (Fig. 3). For simulations at the IM andthe PM sites, constant values ofg0 = 0.02 (mol m−2 s−1) andg1 = 5(−) were used, which are found within the range ofvalues in the EFM sites and reported estimates (Medlyn etal., 2012; Domingues et al., 2013).
3.2 Stem growth rate simulations at the IM sites
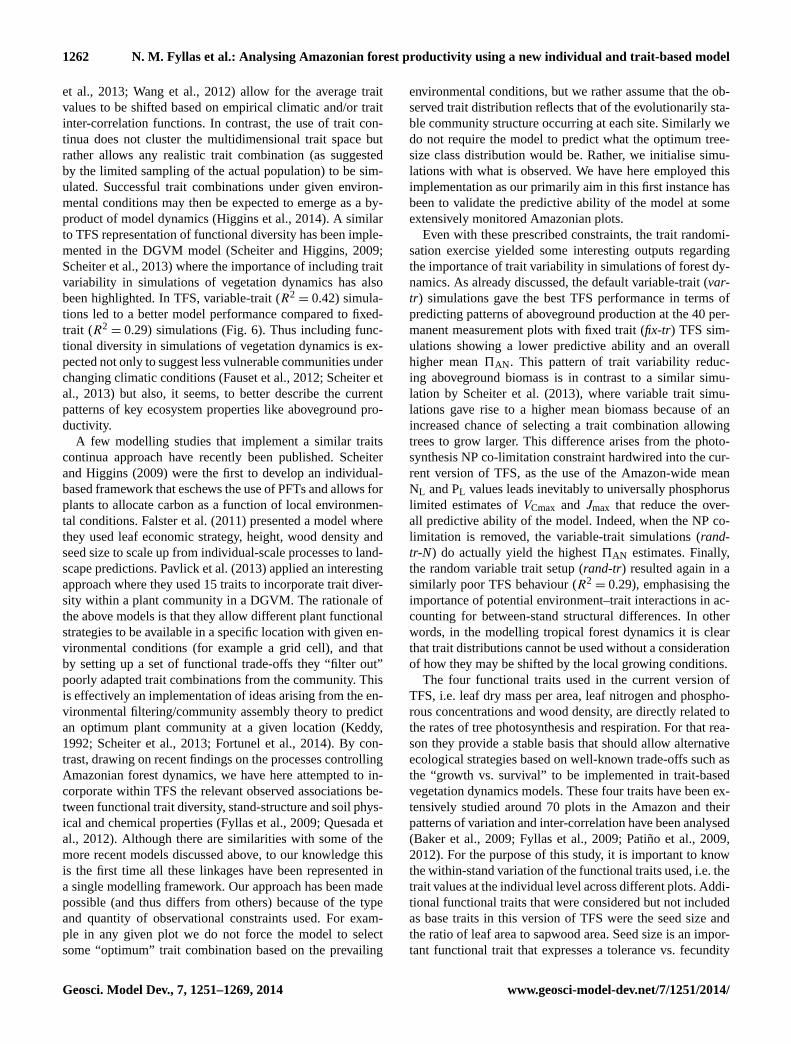
The mean simulated stem growth rate5N,s of each tree inthe seven IM plots was compared with the observed above-ground biomass gains (1BABG) for the 2000–2006 period.An accurate simulation of5N,s can be seen for small sizeclasses, but with greater differences between the observedand the simulated multi-annual growth found for bigger trees(Fig. 4). At infertile ALP-30, the estimate slope of the Yorkmodel indicated an overestimation of aboveground produc-tion (α = 1.18±0.06), driven mainly by an overestimation ofthe mid-size classes. At BNT-04 the model underestimatedthe overall growth (α = 0.82± 0.03). Aboveground growthwas overestimated in CAX-06 (1.11±0.07). At TAP-55 (α =
1.44±0.15) the model underestimated aboveground produc-tion (0.90± 0.06). At fertile AGP-01 (α = 1.36± 0.08) andAGP-02 (α = 1.25±0.05) an overestimation of abovegroundproductivity was observed although with simulations of mostsize classes falling within the observed ranges. At TAM-05(α = 0.79±0.07) though, the simulated aboveground growthwas underestimated with the overall slope driven by diver-gences in smaller size classes. The range and distribution of5N allocation to stem growth is adequately captured by TFSas summarised in Fig. S2.1 in the Supplement.
3.3 5G, 5N and CU simulations at the PM sites
Simulated stand-level aboveground net primary productiv-ity 5N,A was positively associated with observed changes inaboveground biomass of trees that survived in the PM plotsover the 2000–2006 period1BABG, with anR2
= 0.42, sug-gesting an adequate model behaviour (Fig. 5). A summaryof simulated stand-level5G, 5N and CU relationship to keyenvironmental drivers is given in Table 1 (see also Fig. S2.2in the Supplement).5G and5N and CU were not associated
Geosci. Model Dev., 7, 1251–1269, 2014 www.geosci-model-dev.net/7/1251/2014/

N. M. Fyllas et al.: Analysing Amazonian forest productivity using a new individual and trait-based model 1259
Figure 4. Simulated stem growth rate5N,s against observed aboveground biomass change1BABG for different size classes for the 2000–2006 period. Upper panel: infertile plots. Lower panel: fertile plots. The broken line represents a 1: 1 relationship. The continuous lineillustrates the straight line fit using the York method (see text for details).
with temperature. However, all three measures of stand-levelproductivity were positively related to annual precipitationand soil nutrient availability.
3.4 Randomisation exercise simulations
Results from the randomisation exercise (Fig. 6) found thefully constrained default setup (var-tr) to have the best pre-dictive performance (R2
= 0.42 with a SMA slopea = 0.92).This is as compared to the fixed-trait simulation (fix-tr) sin-gle PFT parameterisation with a decreased predictive abilityof TFS (R2
= 0.29, a = 0.82) and an overall higher meanpredicted aboveground productivity. Not accounting for thesite-specific distribution of the trait quartet, i.e. bypassing po-tential biogeographic patterns of functional diversity and/orenvironmental trait interactions (rand-tr), also reduced thepredictive ability of the model (R2
= 0.29, a = 0.74). Fi-nally, the random trait no-NP co-limitation setup (rand-tr-N)similarly led to an inferior model performance (R2
= 0.33,a = 0.88) and with the highest mean simulated abovegroundproductivity.
4 Discussion
We report here on the core components of an individual-based model that has been developed in order to help betterunderstand the patterns revealed by recent integrated mea-surements of climate, soils, functional diversity and stand dy-namics for a wide range of forests across the Amazon basin.
Figure 5. Simulated stand-level aboveground net primary produc-tivity (5AN) against observed stand-level aboveground biomassgrowth (1BABG) of surviving trees, at the 40 PM plots. The lineillustrates a SMA regression ofα = 0.92(0.72, . . . ,1.18) andR2
=
0.42. Red dots indicate high nutrient availability and blue dots indi-cate low nutrient availability plots.
www.geosci-model-dev.net/7/1251/2014/ Geosci. Model Dev., 7, 1251–1269, 2014

1260 N. M. Fyllas et al.: Analysing Amazonian forest productivity using a new individual and trait-based model
Table 1.Kendall correlation coefficients (τ) and associated significance levels (p) between simulated gross primary productivity (5G), netprimary productivity (5N), carbon use efficiency (CU) and key environmental factors. Significant associations are indicated with bold.
5G 5N CU(kg C m−2 yr−1) (kg C m−2 yr−1) (–)
Mean Annual Temperature –Ta (◦C) τ = −0.17p = 0.131
τ = −0.21p = 0.065
τ = −0.11p = 0.33
Annual Precipitation Pa (mm) τ = 0.54p < 0.001
τ = 0.60p < 0.001
τ = 0.36p = 0.002
Soil nutrient availability81 (PCA Axis 1) τ = 0.48p < 0.001
τ = 0.50p < 0.001
τ = 0.39p < 0.001
Figure 6. Summary of the randomisation exercise simulations.(a) Simulated stand-level aboveground net primary productivity (5AN)
against observed stand-level aboveground biomass growth (1BABG) for the four different setups. The slope of the SMA (a) and the adjustedR2 are given in parentheses for each setup. Different colours indicate different setups.(b) Simulated Amazon-wide aboveground net primaryproductivity (5AN) for the four different setups.
In its current setup the model does not explicitly simulateregeneration and mortality dynamics but rather uses the ob-served size distribution of trees at the study sites, thus takinginto account stand structure and functional trait variabilityas observed along the main climatic and edaphic axes of theAmazon basin. With the current setup we were able to re-produce the tree- and stand-level5N patterns found acrossAmazonia and to explore for potential environmental con-trols over stand-level5G, 5N and CU.
4.1 Scientific outcomes
Our simulations found no association of stand-levelgrossprimary productivity(5G) with temperature, probably due tothe relatively small range of variation of temperature acrossour plots.5G decreased until an annual temperature of ap-proximately 26◦C but remained relative constant above thispoint (Table 1, Fig. S2.2 in the Supplement). However, oursimulations suggest that a strong association of5G with theannual precipitation and soil nutrient availability of the plots.5G was positively related to annual precipitation over the
entire range observed in the 40 PM plots. The association of5G with the nutrient availability axis is in agreement withfertilisation experiments showing an increase with nutrientsupply (Giardina et al., 2003). In our basin-wide examinationof 5G the soil nutrient availability and stand structure gradi-ents are not, however, independent (Quesada et al., 2012), asin the RAINFOR network permanent plots it has been ob-served that bigger/older trees are more abundant on easterninfertile forests, where soil physical conditions can supporta bigger tree size (Baker et al., 2009) with a lower risk oftrees being uprooted (Chao et al., 2009). Bigger trees gen-erally support a greater foliage area and thus could signif-icantly contribute to the overall carbon assimilation of thestand. However, bigger trees on infertile plots are generallycharacterised by lower leaf nutrient concentrations (Fyllas etal., 2009) and thus slower assimilation rates (Reich et al.,1994; Domingues et al., 2010). On the other hand a higherabundance of smaller trees with higher gas exchange ratesis observed on more dynamic, fertile plots. Ultimately thisindicates that stand structure should be specifically takeninto account when simulating5G in tropical forests, and
Geosci. Model Dev., 7, 1251–1269, 2014 www.geosci-model-dev.net/7/1251/2014/
N. M. Fyllas et al.: Analysing Amazonian forest productivity using a new individual and trait-based model 1261
thus individual-based models could significantly contributetowards a deeper understanding of the functioning and sensi-tivity of these ecosystems.
In our simulations stand-levelnet primary productivity(5N) showed no significant association to annual tempera-ture but increased with soil nutrient availability and annualprecipitation (Table 1, Fig. S2.2 in the Supplement). Our5Nsimulations are in agreement with field observations of in-creasing aboveground wood productivity with precipitation(Quesada et al., 2012). Based on TFS parameterisation, pho-tosynthetic rates are expected to be higher at a greater soil nu-trient availability due to associated higher leaf N and P con-centration (Fyllas et al., 2009; Domingues et al., 2010). Us-ing a similar parameterisation for a “sun and shade” big leafmodel, Mercado et al. (2011) found an increase in net canopyassimilation rate with leaf P content in agreement with ourpositive association between5N and soil nutrient availabil-ity. Their simulated5G accounted for approximately 0.30of the observed wood productivity in 33 study plots, andthus theR2
= 0.42 between simulated5N and abovegroundgrowth found here suggests a marginally improved model be-haviour. It should be noted that our definition of soil nutrientavailability (81), based on the PCA analysis in Quesada etal. (2010), directly relates to soil P content. As shown firstin the analysis of Quesada et al. (2012), where data fromalmost 60 plots were considered, aboveground5N is pos-itively related to soil P content in lowland tropical forest.The increased5N in fertile environments (apart from thehigher5G) seems to be enhanced by the greater abundanceof small trees there. As tree size increases maintenance respi-ration likely “consumes” an increasing proportion of assim-ilated carbon, and thus at large size classes the proportionof trees which have enough carbon to allocate to growth de-creases (Givnish, 1988; Cavaleri et al., 2008). This is in linewith the negative relationship between coarse wood produc-tion and maximum height documented for some Amazoniantrees (Baker et al., 2009).
In our simulationscarbon use efficiency(CU) ranged from0.43 to 0.54. Recent research suggests that the CU is not asconstant as had been previously suggested (DeLucia et al.,2007; Zhang et al., 2009). For example the meta-analysis ofDeLucia et al. (2007) found that CU varies from 0.23 to 0.83in different forest types. Our average estimate of CU = 0.51is, however, above the range reported in Malhi (2012). Zhanget al. (2009) identified a negative trend of the5N/5G ratiowith temperature at the range of 20–30◦C, as also simulatedhere especially above 26◦C (Fig. S2.2 in the Supplement).Simulated CU increased with soil nutrient availability, be-ing marginally lower at infertile (0.48) compared to fertile(0.50) plots. This is attributable to smaller size class trees(with lower relative respiratory costs) constituting a greaterproportion of the total stand biomass on higher nutrient statussoils. One factor relating to soil nutrient availability but notincluded in the current version is an implicit consideration ofthe respiratory costs of plant nutrient uptake (Lambers et al.,
2008) either directly, or through other processes such as or-ganic acid exudation (Jones et al., 2009) or the symbiotic as-sociations (Duponnois et al., 2012). One would expect thesecosts to be proportionally higher for a stand of low nutrientstatus, especially with regard to P (Quesada et al., 2012).
4.2 Practical implications
The modelling of tropical forest carbon fluxes and stand dy-namics has traditionally involved approaches aimed at a bal-ance between simplicity, computational economy, and com-plexity. On one hand, the enormous biological and biogeo-chemical heterogeneity of tropical forests (Townsend et al.,2008) places special importance on how modellers prioritiseboth the amount and the detail of processes that should beincluded to capture the main controls and feedbacks. On theother hand, the finding that Amazonia is dominated by just227 tree species (Ter Steege et al., 2013) implies that mostbiogeochemical cycling in the world’s largest tropical forestis performed by a tiny sliver of its diversity. At one end ofthe complexity spectrum are individual-based models whichare able to properly simulate population dynamics and thuslags due to demography. Individual-based models of tropicalforests have traditionally focused on realistically represent-ing the light environment (TROLL – Chave, 1999) or group-ing tree species on the basis of their different responses toenvironmental resources as suggested by field observations(FORMIND – Köhler and Huth, 1998, LPJ-GUESS – Hélyet al., 2006). At the other end of the complexity spectrumare DGVMs which simulate population dynamics more sim-plistically (but see Moorcroft et al., 2001; Scheiter and Hig-gins, 2009). Using a DGVM model, Verheijen et al. (2013)allowed for within-PFT climate-driven trait variation to oc-cur and achieved an improvement of the predicted vegeta-tive biomass and PFT distribution patterns. A similar ratio-nale was followed in Wang et al. (2012) where it was shownthat the inclusion of multi-trait covariance in DGVM can beused to constrain model parameters and reduce uncertain-ties in simulated ecosystem productivity. Fisher et al. (2010)applied the individual-based Ecosystem Demography model(Moorcroft et al., 2001), and showed that by varying traits re-lated to demographic processes, forest and biomass dynam-ics exhibited a wide range of responses to climate forcing.
Most of the above approaches have used discrete PFTs torepresent tree species and functional diversity. These stud-ies suggest that by allowing for within-PFT trait variabilitya more plastic and realistic response to the relevant environ-mental drivers is observed. In contrast to the above, TFS re-places the use of PFTs with trait distributions, following adifferent model philosophy and architecture using the con-cept of multidimensional trait continua. In particular, consid-ering functional diversity to be expressed by a multidimen-sional trait space, the use of PFTs selects a number of clus-ters where the central vector defines the average trait valuesof each PFT (Fyllas et al., 2012). Recent studies (Verheijen
www.geosci-model-dev.net/7/1251/2014/ Geosci. Model Dev., 7, 1251–1269, 2014
1262 N. M. Fyllas et al.: Analysing Amazonian forest productivity using a new individual and trait-based model
et al., 2013; Wang et al., 2012) allow for the average traitvalues to be shifted based on empirical climatic and/or traitinter-correlation functions. In contrast, the use of trait con-tinua does not cluster the multidimensional trait space butrather allows any realistic trait combination (as suggestedby the limited sampling of the actual population) to be sim-ulated. Successful trait combinations under given environ-mental conditions may then be expected to emerge as a by-product of model dynamics (Higgins et al., 2014). A similarto TFS representation of functional diversity has been imple-mented in the DGVM model (Scheiter and Higgins, 2009;Scheiter et al., 2013) where the importance of including traitvariability in simulations of vegetation dynamics has alsobeen highlighted. In TFS, variable-trait (R2
= 0.42) simula-tions led to a better model performance compared to fixed-trait (R2
= 0.29) simulations (Fig. 6). Thus including func-tional diversity in simulations of vegetation dynamics is ex-pected not only to suggest less vulnerable communities underchanging climatic conditions (Fauset et al., 2012; Scheiter etal., 2013) but also, it seems, to better describe the currentpatterns of key ecosystem properties like aboveground pro-ductivity.
A few modelling studies that implement a similar traitscontinua approach have recently been published. Scheiterand Higgins (2009) were the first to develop an individual-based framework that eschews the use of PFTs and allows forplants to allocate carbon as a function of local environmen-tal conditions. Falster et al. (2011) presented a model wherethey used leaf economic strategy, height, wood density andseed size to scale up from individual-scale processes to land-scape predictions. Pavlick et al. (2013) applied an interestingapproach where they used 15 traits to incorporate trait diver-sity within a plant community in a DGVM. The rationale ofthe above models is that they allow different plant functionalstrategies to be available in a specific location with given en-vironmental conditions (for example a grid cell), and thatby setting up a set of functional trade-offs they “filter out”poorly adapted trait combinations from the community. Thisis effectively an implementation of ideas arising from the en-vironmental filtering/community assembly theory to predictan optimum plant community at a given location (Keddy,1992; Scheiter et al., 2013; Fortunel et al., 2014). By con-trast, drawing on recent findings on the processes controllingAmazonian forest dynamics, we have here attempted to in-corporate within TFS the relevant observed associations be-tween functional trait diversity, stand-structure and soil phys-ical and chemical properties (Fyllas et al., 2009; Quesada etal., 2012). Although there are similarities with some of themore recent models discussed above, to our knowledge thisis the first time all these linkages have been represented ina single modelling framework. Our approach has been madepossible (and thus differs from others) because of the typeand quantity of observational constraints used. For exam-ple in any given plot we do not force the model to selectsome “optimum” trait combination based on the prevailing
environmental conditions, but we rather assume that the ob-served trait distribution reflects that of the evolutionarily sta-ble community structure occurring at each site. Similarly wedo not require the model to predict what the optimum tree-size class distribution would be. Rather, we initialise simu-lations with what is observed. We have here employed thisimplementation as our primarily aim in this first instance hasbeen to validate the predictive ability of the model at someextensively monitored Amazonian plots.
Even with these prescribed constraints, the trait randomi-sation exercise yielded some interesting outputs regardingthe importance of trait variability in simulations of forest dy-namics. As already discussed, the default variable-trait (var-tr) simulations gave the best TFS performance in terms ofpredicting patterns of aboveground production at the 40 per-manent measurement plots with fixed trait (fix-tr) TFS sim-ulations showing a lower predictive ability and an overallhigher mean5AN . This pattern of trait variability reduc-ing aboveground biomass is in contrast to a similar simu-lation by Scheiter et al. (2013), where variable trait simu-lations gave rise to a higher mean biomass because of anincreased chance of selecting a trait combination allowingtrees to grow larger. This difference arises from the photo-synthesis NP co-limitation constraint hardwired into the cur-rent version of TFS, as the use of the Amazon-wide meanNL and PL values leads inevitably to universally phosphoruslimited estimates ofVCmax and Jmax that reduce the over-all predictive ability of the model. Indeed, when the NP co-limitation is removed, the variable-trait simulations (rand-tr-N) do actually yield the highest5AN estimates. Finally,the random variable trait setup (rand-tr) resulted again in asimilarly poor TFS behaviour (R2
= 0.29), emphasising theimportance of potential environment–trait interactions in ac-counting for between-stand structural differences. In otherwords, in the modelling tropical forest dynamics it is clearthat trait distributions cannot be used without a considerationof how they may be shifted by the local growing conditions.
The four functional traits used in the current version ofTFS, i.e. leaf dry mass per area, leaf nitrogen and phospho-rous concentrations and wood density, are directly related tothe rates of tree photosynthesis and respiration. For that rea-son they provide a stable basis that should allow alternativeecological strategies based on well-known trade-offs such asthe “growth vs. survival” to be implemented in trait-basedvegetation dynamics models. These four traits have been ex-tensively studied around 70 plots in the Amazon and theirpatterns of variation and inter-correlation have been analysed(Baker et al., 2009; Fyllas et al., 2009; Patiño et al., 2009,2012). For the purpose of this study, it is important to knowthe within-stand variation of the functional traits used, i.e. thetrait values at the individual level across different plots. Addi-tional functional traits that were considered but not includedas base traits in this version of TFS were the seed size andthe ratio of leaf area to sapwood area. Seed size is an impor-tant functional trait that expresses a tolerance vs. fecundity
Geosci. Model Dev., 7, 1251–1269, 2014 www.geosci-model-dev.net/7/1251/2014/

N. M. Fyllas et al.: Analysing Amazonian forest productivity using a new individual and trait-based model 1263
trade-off, with seed size trading-off with seed number andwith larger seed species being more tolerant at more stressfulplaces (Muller-Landau, 2010). However, data on seed sizeare usually available at the species level, i.e. intraspecificvariation is not usually recorded, and thus this kind of datacannot be included in the current version of TFS. The ratioof leaf area to sapwood area,8LS, is an important trait thatcan be used to constrain the hydraulic architecture of trees(Meinzer et al., 2008). Here8LS is expressed as a functionof DW andH (Eq. 7) and it is not used as an independent(base) trait. Future versions of TFS will include this aspect offunctional variability, but for this first study we have selectedjust a small set of key traits in order to maintain a relativelysimple model structure.
Like most modelling efforts, TFS represents work inprogress. We identify three particularly promising avenuesfor future improvements. Firstly, discrepancies between theobserved and simulated stem level growth rates, particularlyin larger size classes, could result from the allometric equa-tions used to estimate aboveground biomass and growth notbeing species or size specific. The allometric equations usedhere express a generic height (H vs.d relationship for Ama-zonia, without taking into account habitat and species dif-ferences, so a more accurate representation of tree architec-ture would probably result in better biomass growth estima-tion. Indeed,H −d relationships do vary significantly amongspecies (King, 1996; Poorter et al., 2006) and across regions(Nogueira et al., 2008; Feldpausch et al., 2011; Goodmanet al., 2014). An additional source of bias when estimat-ing stem-level growth rates could be related to the uniform(static) allocation coefficient used in this study. For example,Litton et al. (2007) showed that allocation to abovegroundtree biomass components increases with age and the avail-ability of resources. Furthermore, Castanho et al. (2013) im-proved the predictions of a DGVM by adjusting allocationcoefficients based on soil texture. Such ontogenetic and/orresource-based shifts in patterns of carbon allocation couldbe potentially modelled through the use of dynamic allo-cation schemes (Friedlingstein et al., 1999; Franklin et al.,2012).
The importance of realistically representing autotrophicrespiration processes in models of vegetation dynamics isalso highlighted here. Modelling respiration has proven tobe a difficult task (Cannell and Thornley, 2000), and ac-curate representation of this component is of great impor-tance for understanding the global C cycle (Valentini et al.,2000). For example, the way that respiration is representedin DGVMs could have a substantial influence over the waythat the dynamics of Amazonian forest under scenarios ofclimatic change are simulated (Huntingford et al., 2004; Gal-braith et al., 2010). Nitrogen content of plant tissue has beenproven a good predictor of respiration rates (Reich et al.,2008). However, Mori et al. (2010) suggested a mixed-powerequation in which the exponent varies from 1 to 3/4 as sizeincreases. Both the Reich and Mori models are implemented
in TFS, but we found that a third method, combining the sizeand nitrogen control, performed better. Thus we suggest thatan amalgamation of those two approaches could provide abetter way to estimate respiration fluxes in the new genera-tion of dynamic vegetation models. In addition, leaf phos-phorous content seems to constrain respiration rates morestrongly than nitrogen content in some tropical forests (Meiret al., 2001; Meir and Grace, 2002), and thus inclusion of aphosphorus constraint in future equations of leaf respirationcould increase their realism.
Finally, discrepancies in the observed versus the simu-lated canopy conductanceGC could result from the param-eterisation of the stomata conductance model of Medlyn etal. (2011). The estimates forg0 andg1 used in the 40 PMplots simulations were taken as constant. However, Med-lyn et al. (2011) suggested thatg0 andg1 could vary withfunctional group. Thus the Amazon-wide parameterisationused here should be replaced with local-level estimates whenappropriate gas exchange data are available, and ultimatelywith estimates based on linked functional traits as evidencedthrough recently documented associations between structuralcharacteristics such as wood density and leaf area to sap-wood ratio with leaf physiological traits such asMa and leaf13C/13C ratio (Patiño et al., 2012), although we also notethat the extent of such structural/physiological linkages re-mains the subject of debate (Baraloto et al., 2010b). Alter-native stomatal closure equations as a function of soil wateravailability (Harris et al., 2004) should also be tested alongwith the conductance model in future versions of the model.
5 Conclusions
We set out to develop a modelling framework for tropicalforests that is relatively simple yet adequately complex tocapture the main ecological gradients in the world’s mostextensive tropical forest. Our study places special emphasison processes highlighted by recent field studies to stronglyinfluence Amazonian forest dynamics, especially functionaltrait diversity and its association with multiple soil proper-ties (Fyllas et al., 2009). In summary, TFS is characterisedby a relatively simple setup, which is capable of reproducingwater and carbon fluxes as observed at both daily and multi-annual timescales. TFS represents an important link betweeninventory data and large-scale models with the incorporationof the continuum of plant strategies, through the inclusion oftrait distributions providing a step towards better represent-ing diversity in vegetation modelling (Lavorel et al., 2007),representing important processes and trait variation that can-not be adequately accounted for by a DGVM approach tovegetation modelling. Since TFS is based heavily on mea-sured data, the model is well suited to testing hypotheses re-lated to the present-day Amazon biogeography and biogeo-chemical fluxes.
www.geosci-model-dev.net/7/1251/2014/ Geosci. Model Dev., 7, 1251–1269, 2014
1264 N. M. Fyllas et al.: Analysing Amazonian forest productivity using a new individual and trait-based model
Code availability
The JAVA source code can be obtained upon request. Con-tact: [email protected]
The Supplement related to this article is available onlineat doi:10.5194/gmd-7-1251-2014-supplement.
Acknowledgements.This research was supported by a Marie CurieIntra-European Fellowship within the 7th European CommunityFramework Programme to N. M. Fyllas. Manuel Gloor and LinaMercado were funded by the AMAZONICA NERC consortiumgrant. Oliver L. Phillips is supported by an ERC Advanced Grantand (as for Jon Lloyd) a Royal Society Wolfson Research MeritAward. The work of RAINFOR between 2000 and 2006 wassupported primarily by the UK Natural Environment ResearchCouncil and the European Community Framework Programmethrough grants to Oliver L. Phillips, Y. Malhi and Jon Lloyd.Natalia Restrepo Coupe provided the gap filled eddy flux towerdata. Gabriela Lopez-Gonzalez and Sophie Fauset helped with datapreparation. The Missouri Botanical Garden, Rodolfo Vasquez,Abel Monteagudo, Nigel Pitman, Adriana Prieto, Agustin Rudas,Natalino Silva, Chiqui Arroyo and Alejandro Araujo Murakamicontributed permanent plot data to the RAINFOR network.
Edited by: C. Sierra
References
Aragão, L. E. O. C., Malhi, Y., Metcalfe, D. B., Silva-Espejo, J. E.,Jiménez, E., Navarrete, D., Almeida, S., Costa, A. C. L., Salinas,N., Phillips, O. L., Anderson, L. O., Alvarez, E., Baker, T. R.,Goncalvez, P. H., Huamán-Ovalle, J., Mamani-Solórzano, M.,Meir, P., Monteagudo, A., Patiño, S., Peñuela, M. C., Prieto, A.,Quesada, C. A., Rozas-Dávila, A., Rudas, A., Silva Jr., J. A., andVásquez, R.: Above- and below-ground net primary productiv-ity across ten Amazonian forests on contrasting soils, Biogeo-sciences, 6, 2759–2778, doi:10.5194/bg-6-2759-2009, 2009.
Baker, T. R., Phillips, O. L., Malhi, Y., Almeida, S., Arroyo, L.,Fiore, A. D., Erwin, T., Higuchi, N., Killeen, T. J., Laurance, S.G., Laurance, W. F., Lewis, S. L., Monteagudo, A., Neill, D. A.,Vargas, P. N., Pitman, N. C. A., Silva, J. N. M., and Martínez, R.V.: Increasing biomass in Amazonian forest plots, Phil. Trans. R.Soc. Lond. B, 359, 353–365, doi:10.1098/rstb.2003.1422, 2004.
Baker, T. R., Phillips, O. L., Laurance, W. F., Pitman, N. C. A.,Almeida, S., Arroyo, L., DiFiore, A., Erwin, T., Higuchi, N.,Killeen, T. J., Laurance, S. G., Nascimento, H., Monteagudo,A., Neill, D. A., Silva, J. N. M., Malhi, Y., López Gonzalez,G., Peacock, J., Quesada, C. A., Lewis, S. L., and Lloyd, J.:Do species traits determine patterns of wood production in Ama-zonian forests?, Biogeosciences, 6, 297–307, doi:10.5194/bg-6-297-2009, 2009.
Baraloto, C., Timothy Paine, C. E., Patino, S., Bonal, D., Her-ault, B., and Chave, J.: Functional trait variation and samplingstrategies in species-rich plant communities, Functional Ecol.,24, 208–216, 2010a.
Baraloto, C., Timothy Paine, C. E., Poorter, L., Beauchene, J.,Bonal, D., Domenach, A. M., Hérault, B., Patiño, S., Roggy, J.-C., and Chave, J.: Decoupled leaf and stem economics in rainforest trees, Ecol. Lett., 13, 1338–1347, 2010b.
Calvo-Alvarado, J. C., McDowell, N. G., and Waring, R. H.: Allo-metric relationships predicting foliar biomass and leaf area: sap-wood area ratio from tree height in five Costa Rican rain forestspecies, Tree Physiol., 28, 1601–1608, 2008.
Cannell, M. G. R. and Thornley, J. H. M.: Modelling the compo-nents of plant respiration: some guiding principles, Ann. Botany,85, 45–54, 2000.
Castanho, A. D. A., Coe, M. T., Costa, M. H., Malhi, Y., Gal-braith, D., and Quesada, C. A.: Improving simulated Ama-zon forest biomass and productivity by including spatial varia-tion in biophysical parameters, Biogeosciences, 10, 2255–2272,doi:10.5194/bg-10-2255-2013, 2013.
Cavaleri, M. A., Oberbauer, S. F., and Ryan, M. G.: Foliar andecosystem respiration in an old-growth tropical rain forest, Plant,Cell Environ., 31, 473–483, 2008.
Chao, K.-J., Phillips, O. L., Monteagudo, A., Torres-Lezama, A.,and Vásquez Martínez, R.: How do trees die? Mode of death innorthern Amazonia, J. Vegetation Sci., 20, 260–268, 2009.
Chave, J.: Study of structural, successional and spatial patternsin tropical rain forests using TROLL, a spatially explicit forestmodel, Ecol. Model., 124, 233–254, 1999.
Chave, J., Andalo, C., Brown, S., Cairns, M. A., Chambers, J. Q.,Eamus, D., Fölster, H., Fromard, F., Higuchi, N., Kira, T., Les-cure, J.-P., Nelson, B. W., Ogawa, H., Puig, H., Riéra, B., andYamakura, T.: Tree allometry and improved estimation of carbonstocks and balance in tropical forests, Oecologia, 145, 87–99,2005.
Chave, J., Coomes, D., Jansen, S., Lewis, S. L., Swenson, N. G., andZanne, A. E.: Towards a worldwide wood economics spectrum,Ecol. Lett., 12, 351–366, 2009.
Clark, D. B., Mercado, L. M., Sitch, S., Jones, C. D., Gedney, N.,Best, M. J., Pryor, M., Rooney, G. G., Essery, R. L. H., Blyth, E.,Boucher, O., Harding, R. J., Huntingford, C., and Cox, P. M.: TheJoint UK Land Environment Simulator (JULES), model descrip-tion – Part 2: Carbon fluxes and vegetation dynamics, Geosci.Model Dev., 4, 701–722, doi:10.5194/gmd-4-701-2011, 2011.
Cox, P. M., Betts, R. A., Collins, M., Harris, P. P., Huntingford,C., and Jones, C. D.: Amazonian forest dieback under climate-carbon cycle projections for the 21st century, Theor. Appl. Cli-matol., 78, 137–156, 2004.
Cramer, W., Bondeau, A., Schaphoff, S., Lucht, W., Smith, B., andSitch, S.: Tropical forests and the global carbon cycle: impactsof atmospheric carbon dioxide, climate change and rate of defor-estation, Philos. Trans. Roy. Soc. London Ser. B, 359, 331–343,2004.
DeLucia, E., Drake, J. E., Thomas, R. B., and Gonzalez-Meller, M.:Forest carbon use efficiency: is respiration a constant fraction ofgross primary production?, Global Change Biol., 13, 1157–1167,2007.
Domingues, T. F., Meir, P., Feldpausch, T. R., Saiz, G., Veenendaal,E. M., Schrodt, F., Bird, M., Djagbletey, G., Hien, F., Compaore,H., Diallo, A., Grace, J., and Lloyd, J.: Co-limitation of photo-synthetic capacity by nitrogen and phosphorus in West Africawoodlands, Plant, Cell Environ., 33, 959–980, 2010.
Geosci. Model Dev., 7, 1251–1269, 2014 www.geosci-model-dev.net/7/1251/2014/

N. M. Fyllas et al.: Analysing Amazonian forest productivity using a new individual and trait-based model 1265
Domingues, T. F., Martinelli, L. A., and Ehleringer, J. R.: Seasonalpatterns of leaf-level photosynthetic gas exchange in an easternAmazonian rain forest, Plant Ecol. Diversity, 7, 189–203, 2014.
Doughty, C. E., Metcalfe, D. B., da Costa, M. C., de Oliveira, A.A. R., Neto, G. F. C., Silva, J. A., Aragão, L. E. O. C., Almeida,S. S., Quesada, C. A., Girardin, C. A. J., Halladay, K., da Costa,A. C. L., and Malhi, Y.: The production, allocation and cyclingof carbon in a forest on fertile terra preta soil in eastern Amazo-nia compared with a forest on adjacent infertile soil, Plant Ecol.Diversity, 7, 41–53, 2014.
Duponnois, R., Baudoin, E., Thioulouse, J., Hafidi, M., Galiana,A., Lebrun, M., and Prin, Y.: The Impact of MycorrhizosphereBacterial Communities on Soil Biofunctioning in Tropical andMediterranean Forest Ecosystems, in: Bacteria in Agrobiology:Plant Probiotics, edited by: Maheshwari, D. K., 79–95, SpringerBerlin Heidelberg, 2012.
Falster, D. S., Brännström, A., Dieckmann, U., and Westoby, M.:Influence of four major plant traits on average height, leaf-areacover, net primary productivity, and biomass density in single-species forests: a theoretical investigation, J. Ecol., 99, 148–164,2011.
Farquhar, G. D., von Caemmerer, S., and Berry, J. A.: A biochem-ical model of photosynthetic CO2 assimilation in leaves of C3species, Planta, 149, 78–90, 1980.
Fauset, S., Baker, T. R., Lewis, S. L., Feldpausch, T. R., Affum-Baffoe, K., Foli, E. G., Hamer, K. C., and Swaine, M. D.:Drought-induced shifts in the floristic and functional composi-tion of tropical forests in Ghana, Ecol. Lett., 15, 1120–1129,2012.
Feldpausch, T. R., Banin, L., Phillips, O. L., Baker, T. R., Lewis,S. L., Quesada, C. A., Affum-Baffoe, K., Arets, E. J. M. M.,Berry, N. J., Bird, M., Brondizio, E. S., de Camargo, P., Chave,J., Djagbletey, G., Domingues, T. F., Drescher, M., Fearnside, P.M., França, M. B., Fyllas, N. M., Lopez-Gonzalez, G., Hladik,A., Higuchi, N., Hunter, M. O., Iida, Y., Salim, K. A., Kassim,A. R., Keller, M., Kemp, J., King, D. A., Lovett, J. C., Mari-mon, B. S., Marimon-Junior, B. H., Lenza, E., Marshall, A. R.,Metcalfe, D. J., Mitchard, E. T. A., Moran, E. F., Nelson, B. W.,Nilus, R., Nogueira, E. M., Palace, M., Patiño, S., Peh, K. S.-H., Raventos, M. T., Reitsma, J. M., Saiz, G., Schrodt, F., Sonké,B., Taedoumg, H. E., Tan, S., White, L., Wöll, H., and Lloyd,J.: Height-diameter allometry of tropical forest trees, Biogeo-sciences, 8, 1081–1106, doi:10.5194/bg-8-1081-2011, 2011.
Fisher, R., McDowell, N., Purves, D., Moorcroft, P., Sitch, S., Cox,P., Huntingford, C., Meir, P., and Ian Woodward, F.: Assessinguncertainties in a second-generation dynamic vegetation modelcaused by ecological scale limitations, New Phytol., 187, 666–681, 2010.
Fortunel, C., Paine, C. E., Fine, P. V., Kraft, N. J., and Baraloto,C.: Environmental factors predict community functional compo-sition in Amazonian forests, J. Ecol., 102, 145–155, 2014.
Franklin, O., Johansson, J., Dewar, R. C., Dieckmann, U., McMur-trie, R. E., Brännström, A., and Dybzinski, R.: Modeling carbonallocation in trees: a search for principles, Tree Physiol., 32, 648–666, 2012.
Friedlingstein, P., Joel, G., Field, C. B., and Fung, I. Y.: Towardan allocation scheme for global terrestrial carbon models, GlobalChange Biol., 5, 755–770, 1999.
Fyllas, N. M., Patiño, S., Baker, T. R., Bielefeld Nardoto, G., Mar-tinelli, L. A., Quesada, C. A., Paiva, R., Schwarz, M., Horna, V.,Mercado, L. M., Santos, A., Arroyo, L., Jiménez, E. M., Luizão,F. J., Neill, D. A., Silva, N., Prieto, A., Rudas, A., Silviera, M.,Vieira, I. C. G., Lopez-Gonzalez, G., Malhi, Y., Phillips, O. L.,and Lloyd, J.: Basin-wide variations in foliar properties of Ama-zonian forest: phylogeny, soils and climate, Biogeosciences, 6,2677–2708, doi:10.5194/bg-6-2677-2009, 2009.
Fyllas, N. M., Quesada, C. A., and Lloyd, J.: Deriving plant func-tional types for Amazonian forests for use in vegetation dynam-ics models, Perspectives in Plant Ecology, Evolution System., 14,97–110, 2012.
Galbraith, D., Levy, P. E., Sitch, S., Huntingford, C., Cox, P.,Williams, M., and Meir, P.: Multiple mechanisms of Amazonianforest biomass losses in three dynamic global vegetation modelsunder climate change, New Phytologist, 187, 647–665, 2010.
Giardina, C. P., Ryan, M. G., Binkley, D., and Fownes, J. H.: Pri-mary production and carbon allocation in relation to nutrient sup-ply in a tropical experimental forest, Global Change Biol., 9,1438–1450, 2003.
Givnish, T. J.: Adaptation to sun and shade: a whole-plant perspec-tive, Functional Plant Biol., 15, 63–92, 1988.
Gloor, M., Brienen, R. J. W., Galbraith, D., Feldpausch, T. R.,Schöngart, J., Guyot, J.-L., Espinoza, J. C., Lloyd, J., andPhillips, O. L.: Intensification of the Amazon hydrological cy-cle over the last two decades, Geophys. Res. Lett., 1729–1733,2013.
Goodman, R. C., Phillips, O. L., and Baker, T. R.: The importanceof crown dimensions to improve tropical tree biomass estimates,Ecological Appl., 24, 680–698, doi:10.1890/13-0070.1, 2014.
Harris, P. P., Huntingford, C., Cox, P. M., Gash, J. H., and Malhi,Y.: Effect of soil moisture on canopy conductance of Amazonianrainforest, Agr. Forest Meteorol., 122, 215–227, 2004.
Hély, C., Bremond, L., Alleaume, S., Smith, B., Sykes, M. T., andGuiot, J.: Sensitivity of African biomes to changes in the precip-itation regime, Global Ecol. Biogeogr., 15, 258–270, 2006.
Higgins, M. A., Ruokolainen, K., Tuomisto, H., Llerena, N., Car-denas, G., Phillips, O. L., Vásquez, R., and Räsänen, M.: Geo-logical control of floristic composition in Amazonian forests, J.Biogeogr., 38, 2136–2149, 2011.
Higgins, S. I., Langan, L., and Scheiter, S.: Progress in DGVMs: acomment on “Impacts of trait variation through observed trait–climate relationships on performance of an Earth system model:a conceptual analysis” by Verheijen et al. (2013), BiogeosciencesDiscuss., 11, 4483–4492, 2014,http://www.biogeosciences-discuss.net/11/4483/2014/.
Huntingford, C., Harris, P. P., Gedney, N., Cox, P. M., Betts, R.A., Marengo, J. A., and Gash, J. H. C.: Using a GCM analoguemodel to investigate the potential for Amazonian forest dieback,Theor. Appl. Climatol., 78, 177–185, 2004.
Huntingford, C., Zelazowski, P., Galbraith, D., Mercado, L. M.,Sitch, S., Fisher, R., Lomas, M., Walker, A. P., Jones, C. D.,Booth, B. B. B., Malhi, Y., Hemming, D., Kay, G., Good, P.,Lewis, S. L., Phillips, O. L., Atkin, O. K., Lloyd, J., Gloor, E.,Zaragoza-Castells, J., Meir, P., Betts, R., Harris, P. P., Nobre,C., Marengo, J., and Cox, P. M.: Simulated resilience of tropi-cal rainforests to CO2-induced climate change, Nat. Geosci., 6,268–273, 2013.
www.geosci-model-dev.net/7/1251/2014/ Geosci. Model Dev., 7, 1251–1269, 2014

1266 N. M. Fyllas et al.: Analysing Amazonian forest productivity using a new individual and trait-based model
Jones, D. L., Nguyen, C., and Finlay, R. D.: Carbon flow in therhizosphere: carbon trading at the soil–root interface, Plant Soil,321, 5–33, 2009.
Keddy, P. A.: Assembly and response rules: two goals for predictivecommunity ecology, J. Vegetat. Sci., 3, 157–164, 1992.
Keeling, H. C., Baker, T. R., Martinez, R. V., Monteagudo, A., andPhillips, O. L.: Contrasting patterns of diameter and biomass in-crement across tree functional groups in Amazonian forests, Oe-cologia, 158, 521–534, 2008.
Keenan, T., Sabate, S., and Gracia, C.: Soil water stress and coupledphotosynthesis–conductance models: Bridging the gap betweenconflicting reports on the relative roles of stomatal, mesophyllconductance and biochemical limitations to photosynthesis, Agr.Forest Meteorol., 150, 443–453, 2010.
King, D. A.: Allometry and life history of tropical trees, J. TropicalEcol., 12, 25–44, 1996.
Köhler, P. and Huth, A.: The effects of tree species grouping in trop-ical rainforest modelling: Simulations with the individual-basedmodel FORMIND, Ecol. Modell., 109, 301–321, 1998.
Lambers, H., Raven, J. A., Shaver, G. R., and Smith, S. E.: Plantnutrient-acquisition strategies change with soil age, Trends Ecol.Evolution, 23, 95–103, 2008.
Larjavaara, M. and Muller-Landau, H. C.: Still rethinking the valueof high wood density, Am. J. Botany, 99, 165–168, 2012.
Lavorel, S., Díaz, S., Cornelissen, J. H. C., Garnier, E., Harrison, S.P., McIntyre, S., Pausas, J. G., Pérez-Harguindeguy, N., Roumet,C., and Urcelay, C.: Plant functional types: are we getting anycloser to the Holy Grail?, in: Terrestrial ecosystems in a changingworld, 149–164, Springer, 2007.
Lewis, S. L., Phillips, O. L., Baker, T. R., Lloyd, J., Malhi, Y.,Almeida, S., Higuchi, N., Laurance, W. F., Neill, D. A., Silva,J. N. M., Terborgh, J., Lezama, A. T., Martinez, R. V., Brown, S.,Chave, J., Kuebler, C., Vargas, P. N., and Vinceti, B.: Concertedchanges in tropical forest structure and dynamics: evidence from50 South American long-term plots, Phil. Trans. R. Soc. Lond.B, 359, 421–436, 2004.
Litton, C. M., Raich, J. W., and Ryan, M. G.: Carbon allocation inforest ecosystems, Global Change Biol., 13, 2089–2109, 2007.
Lloyd, J., Patiño, S., Paiva, R. Q., Nardoto, G. B., Quesada, C.A., Santos, A. J. B., Baker, T. R., Brand, W. A., Hilke, I., Giel-mann, H., Raessler, M., Luizão, F. J., Martinelli, L. A., and Mer-cado, L. M.: Optimisation of photosynthetic carbon gain andwithin-canopy gradients of associated foliar traits for Amazonforest trees, Biogeosciences, 7, 1833–1859, doi:10.5194/bg-7-1833-2010, 2010.
Lopez-Gonzalez, G., Lewis, S. L., Burkitt, M., and Phillips, O. L.:ForestPlots. net: a web application and research tool to manageand analyse tropical forest plot data, J. Vegetation Sci., 22, 610–613, 2011.
Lopez-Gonzalez, G., Lewis, S. L., Burkitt, M., Baker, T. R., andPhillips, O. L.: available at:ForestPlots.net, Database.www.forestplots.net, 10 September 2013.
Malhi, Y.: The productivity, metabolism and carbon cycle of tropi-cal forest vegetation, J. Ecol., 100, 65–75, 2012.
Malhi, Y. and Phillips, O.: Tropical forests & global atmosphericchange, Cambridge Univ. Press, 2005.
Malhi, Y. and Wright, J.: Spatial patterns and recent trends in theclimate of tropical rainforest regions, Philos. Trans. Roy. Soc.London Ser. B, 359, 311–329, 2004.
Malhi, Y., Phillips, O. l., Lloyd, J., Baker, T., Wright, J., Almeida,S., Arroyo, L., Frederiksen, T., Grace, J., Higuchi, N., Killeen, T.,Laurance, W. f., Leaño, C., Lewis, S., Meir, P., Monteagudo, A.,Neill, D., Núñez Vargas, P., Panfil, S. n., Patiño, S., Pitman, N.,Quesada, C. a., Rudas-Ll., A., Salomão, R., Saleska, S., Silva, N.,Silveira, M., Sombroek, W. g., Valencia, R., Vásquez Martínez,R., Vieira, I. C. G., and Vinceti, B.: An international network tomonitor the structure, composition and dynamics of Amazonianforests (RAINFOR), J. Vegetation Sci., 13, 439–450, 2002.
Malhi, Y., Wood, D., Baker, T. R., Wright, J., Phillips, O. L.,Cochrane, T., Meir, P., Chave, J., Almeida, S., Arroyo, L.,Higuchi, N., Killeen, T. J., Laurance, S. G., Laurance, W. F.,Lewis, S. L., Monteagudo, A., Neill, D. A., Vargas, P. N., Pit-man, N. C. A., Quesada, C. A., Salomão, R., Silva, J. N. M.,Lezama, A. T., Terborgh, J., Martínez, R. V., and Vinceti, B.:The regional variation of aboveground live biomass in old-growth Amazonian forests, Global Change Biol., 12, 1107–1138,doi:10.1111/j.1365-2486.2006.01120.x, 2006.
Malhi, Y., Aragão, L. E. O. C., Metcalfe, D. B., Paiva, R., Quesada,C. A., Almeida, S., Anderson, L., Brando, P., Chambers, J. Q.,Da COSTA, A. C. L., Hutyra, L. R., Oliveira, P., Patiño, S., Pyle,E. H., Robertson, A. L., and Teixeira, L. M.: Comprehensive as-sessment of carbon productivity, allocation and storage in threeAmazonian forests, Global Change Biol., 15, 1255–1274, 2009.
Malhi, Y., Doughty, C., and Galbraith, D.: The allocation of ecosys-tem net primary productivity in tropical forests, Philos. Trans.Roy. Soc. Ser. B, 366, 3225–3245, 2011.
Medlyn, B. E., Duursma, R. A., Eamus, D., Ellsworth, D. S., Pren-tice, I. C., Barton, C. V., Crous, K. Y., de Angelis, P., Free-man, M., and Wingate, L.: Reconciling the optimal and empiricalapproaches to modelling stomatal conductance, Global ChangeBiol., 17, 2134–2144, 2011.
Medlyn, B. E., Duursma, R. A., Eamus, D., Ellsworth, D. S., ColinPrentice, I., Barton, C. V., Crous, K. Y., Angelis, P., Freeman,M., and Wingate, L.: Corrigendum for: “Reconciling the optimaland empirical approaches to modelling stomatal conductance”,Global Change Biol., 18, 3476–3476, 2012.
Meinzer, F. C., Campanello, P. I., Domec, J.-C., Gatti, M. G., Gold-stein, G., Villalobos-Vega, R., and Woodruff, D. R.: Constraintson physiological function associated with branch architectureand wood density in tropical forest trees, Tree Physiol., 28, 1609–1617, 2008.
Meir, P. and Grace, J.: Scaling relationships for woody tissue respi-ration in two tropical rain forests, Plant, Cell Environ., 25, 963–973, 2002.
Meir, P., Grace, J., and Miranda, A. C.: Leaf respiration in two trop-ical rainforests: constraints on physiology by phosphorus, nitro-gen and temperature, Functional Ecol., 15, 378–387, 2001.
Mercado, L. M., Patiño, S., Domingues, T. F., Fyllas, N. M., Wee-don, G. P., Sitch, S., Quesada, C. A., Phillips, O. L., Aragão, L.E. O. C., Malhi, Y., Dolman, A. J., Restrepo-Coupe, N., Saleska,S. R., Baker, T. R., Almeida, S., Higuchi, N., and Lloyd, J.: Vari-ations in Amazon forest productivity correlated with foliar nu-trients and modelled rates of photosynthetic carbon supply, Phil.Trans. Roy. Soc. London Ser. B, 366, 3316–3329, 2011.
Moorcroft, P. R., Hurtt, G. C., and Pacala, S. W.: A method forscaling vegetation dynamics: the ecosystem demography model(ED), Ecol. Monogr., 71, 557–586, 2001.
Geosci. Model Dev., 7, 1251–1269, 2014 www.geosci-model-dev.net/7/1251/2014/

N. M. Fyllas et al.: Analysing Amazonian forest productivity using a new individual and trait-based model 1267
Mori, S., Yamaji, K., Ishida, A., Prokushkin, S. G., Masyagina, O.V., Hagihara, A., Hoque, A. T. M. R., Suwa, R., Osawa, A.,Nishizono, T., Ueda, T., Kinjo, M., Miyagi, T., Kajimoto, T.,Koike, T., Matsuura, Y., Toma, T., Zyryanova, O. A., Abaimov,A. P., Awaya, Y., Araki, M. G., Kawasaki, T., Chiba, Y., andUmari, M.: Mixed-power scaling of whole-plant respiration fromseedlings to giant trees, Proc. Natl. Aca. Sci., 107, 1447–1451,2010.
Muller-Landau, H. C.: The tolerance–fecundity trade-off and themaintenance of diversity in seed size, Proc. Natl. Aca. Sci., 107,4242–4247, 2010.
Nogueira, E. M., Fearnside, P. M., Nelson, B. W., Barbosa, R.I., and Keizer, E. W. H.: Estimates of forest biomass in theBrazilian Amazon: New allometric equations and adjustments tobiomass from wood-volume inventories, Forest Ecol. Manage.,256, 1853–1867, 2008.
Patiño, S., Lloyd, J., Paiva, R., Baker, T. R., Quesada, C. A., Mer-cado, L. M., Schmerler, J., Schwarz, M., Santos, A. J. B., Aguilar,A., Czimczik, C. I., Gallo, J., Horna, V., Hoyos, E. J., Jimenez,E. M., Palomino, W., Peacock, J., Peña-Cruz, A., Sarmiento, C.,Sota, A., Turriago, J. D., Villanueva, B., Vitzthum, P., Alvarez,E., Arroyo, L., Baraloto, C., Bonal, D., Chave, J., Costa, A. C. L.,Herrera, R., Higuchi, N., Killeen, T., Leal, E., Luizão, F., Meir,P., Monteagudo, A., Neil, D., Núñez-Vargas, P., Peñuela, M. C.,Pitman, N., Priante Filho, N., Prieto, A., Panfil, S. N., Rudas,A., Salomão, R., Silva, N., Silveira, M., Soares deAlmeida, S.,Torres-Lezama, A., Vásquez-Martínez, R., Vieira, I., Malhi, Y.,and Phillips, O. L.: Branch xylem density variations across theAmazon Basin, Biogeosciences, 6, 545–568, doi:10.5194/bg-6-545-2009, 2009.
Patiño, S., Fyllas, N. M., Baker, T. R., Paiva, R., Quesada, C.A., Santos, A. J. B., Schwarz, M., ter Steege, H., Phillips,O. L., and Lloyd, J.: Coordination of physiological and struc-tural traits in Amazon forest trees, Biogeosciences, 9, 775–801,doi:10.5194/bg-9-775-2012, 2012.
Pavlick, R., Drewry, D. T., Bohn, K., Reu, B., and Kleidon, A.:The Jena Diversity-Dynamic Global Vegetation Model (JeDi-DGVM): a diverse approach to representing terrestrial biogeog-raphy and biogeochemistry based on plant functional trade-offs,Biogeosciences, 10, 4137–4177, doi:10.5194/bg-10-4137-2013,2013.
Phillips, O. L., Malhi, Y., Higuchi, N., Laurance, W. F., Núñez,P. V., Vásquez, R. M., Laurance, S. G., Ferreira, L. V., Stern,M., Brown, S., and Grace, J.: Changes in the Carbon Balance ofTropical Forests: Evidence from Long-Term Plots, Science, 282,439–442, 1998.
Phillips, O. L., Baker, T. R., Arroyo, L., Higuchi, N., Killeen, T. J.,Laurance, W. F., Lewis, S. L., Lloyd, J., Malhi, Y., Monteagudo,A., Neill, D. A., Vargas, P. N., Silva, J. N. M., Terborgh, J.,Martínez, R. V., Alexiades, M., Almeida, S., Brown, S., Chave,J., Comiskey, J. A., Czimczik, C. I., Fiore, A. D., Erwin, T., Kue-bler, C., Laurance, S. G., Nascimento, H. E. M., Olivier, J., Pala-cios, W., Patiño, S., Pitman, N. C. A., Quesada, C. A., Saldias,M., Lezama, A. T., and Vinceti, B.: Pattern and process in Ama-zon tree turnover, 1976–2001, Phil. Trans. R. Soc. Lond. B, 359,381–407, 2004.
Phillips, O. L., Aragão, L. E. O. C., Lewis, S. L., Fisher, J. B., Lloyd,J., López-González, G., Malhi, Y., Monteagudo, A., Peacock,J., Quesada, C. A., Heijden, G. van der, Almeida, S., Amaral,
I., Arroyo, L., Aymard, G., Baker, T. R., Bánki, O., Blanc, L.,Bonal, D., Brando, P., Chave, J., Oliveira, Á. C. A. de, Cardozo,N. D., Czimczik, C. I., Feldpausch, T. R., Freitas, M. A., Gloor,E., Higuchi, N., Jiménez, E., Lloyd, G., Meir, P., Mendoza, C.,Morel, A., Neill, D. A., Nepstad, D., Patiño, S., Peñuela, M.C., Prieto, A., Ramírez, F., Schwarz, M., Silva, J., Silveira, M.,Thomas, A. S., Steege, H. ter, Stropp, J., Vásquez, R., Zela-zowski, P., Dávila, E. A., Andelman, S., Andrade, A., Chao,K.-J., Erwin, T., Fiore, A. D., C, E. H., Keeling, H., Killeen,T. J., Laurance, W. F., Cruz, A. P., Pitman, N. C. A., Vargas,P. N., Ramírez-Angulo, H., Rudas, A., Salamão, R., Silva, N.,Terborgh, J., and Torres-Lezama, A.: Drought Sensitivity of theAmazon Rainforest, Science, 323, 1344–1347, 2009.
Poorter, L., Bongers, L., and Bongers, F.: Architecture of 54 moist-forest tree species: traits, trade-offs, and functional groups, Ecol-ogy, 87, 1289–1301, 2006.
Purves, D. W., Lichstein, J. W., and Pacala, S. W.: Crown plasticityand competition for canopy space: a new spatially implicit modelparameterized for 250 North American tree species, PLoS One,2, e870, 2007.
Pury, D. de and Farquhar, G. D.: Simple scaling of photosynthesisfrom leaves to canopies without the errors of big-leaf models,Plant, Cell Environ., 20, 537–557, 1997.
Quesada, C. A., Lloyd, J., Schwarz, M., Patiño, S., Baker, T. R., Cz-imczik, C., Fyllas, N. M., Martinelli, L., Nardoto, G. B., Schmer-ler, J., Santos, A. J. B., Hodnett, M. G., Herrera, R., Luizão, F.J., Arneth, A., Lloyd, G., Dezzeo, N., Hilke, I., Kuhlmann, I.,Raessler, M., Brand, W. A., Geilmann, H., Moraes Filho, J. O.,Carvalho, F. P., Araujo Filho, R. N., Chaves, J. E., Cruz Junior,O. F., Pimentel, T. P., and Paiva, R.: Variations in chemical andphysical properties of Amazon forest soils in relation to theirgenesis, Biogeosciences, 7, 1515–1541, doi:10.5194/bg-7-1515-2010, 2010.
Quesada, C. A., Lloyd, J., Anderson, L. O., Fyllas, N. M., Schwarz,M., and Czimczik, C. I.: Soils of Amazonia with particular ref-erence to the RAINFOR sites, Biogeosciences, 8, 1415–1440,doi:10.5194/bg-8-1415-2011, 2011.
Quesada, C. A., Phillips, O. L., Schwarz, M., Czimczik, C. I., Baker,T. R., Patiño, S., Fyllas, N. M., Hodnett, M. G., Herrera, R.,Almeida, S., Alvarez Dávila, E., Arneth, A., Arroyo, L., Chao,K. J., Dezzeo, N., Erwin, T., di Fiore, A., Higuchi, N., HonorioCoronado, E., Jimenez, E. M., Killeen, T., Lezama, A. T., Lloyd,G., López-González, G., Luizão, F. J., Malhi, Y., Monteagudo,A., Neill, D. A., Núñez Vargas, P., Paiva, R., Peacock, J., Peñuela,M. C., Peña Cruz, A., Pitman, N., Priante Filho, N., Prieto, A.,Ramírez, H., Rudas, A., Salomão, R., Santos, A. J. B., Schmer-ler, J., Silva, N., Silveira, M., Vásquez, R., Vieira, I., Terborgh,J., and Lloyd, J.: Basin-wide variations in Amazon forest struc-ture and function are mediated by both soils and climate, Bio-geosciences, 9, 2203–2246, doi:10.5194/bg-9-2203-2012, 2012.
Raaimakers, D., Boot, R. G. A., Dijkstra, P., and Pot, S.: Photo-synthetic rates in relation to leaf phosphorus content in pioneerversus climax tropical rainforest trees, Oecologia, 102, 120–125,1995.
R Core Team: R: A language and environment for statistical com-puting. R Foundation for Statistical Computing, Vienna, Austria,2014.
www.geosci-model-dev.net/7/1251/2014/ Geosci. Model Dev., 7, 1251–1269, 2014

1268 N. M. Fyllas et al.: Analysing Amazonian forest productivity using a new individual and trait-based model
Reich, P. B., Walters, M. B., Ellsworth, D. S., and Uhl, C.:Photosynthesis-nitrogen relations in Amazonian tree species,Oecologia, 97, 62–72, 1994.
Reich, P. B., Walters, M. B., and Ellsworth, D. S.: From tropics totundra: global convergence in plant functioning, Pro. Natl. Aca.Sci., 94, 13730–13734, 1997.
Reich, P. B., Tjoelker, M. G., Pregitzer, K. S., Wright, I. J., Oleksyn,J., and Machado, J.-L.: Scaling of respiration to nitrogen inleaves, stems and roots of higher land plants, Ecol. Lett., 11, 793–801, 2008.
Reich, P. B., Oleksyn, J., and Wright, I. J.: Leaf phosphorus influ-ences the photosynthesis–nitrogen relation: a cross-biome analy-sis of 314 species, Oecologia, 160, 207–212, 2009.
Ryan, M. G., Hubbard, R. M., Clark, D. A., and Sanford Jr, R. L.:Woody-tissue respiration for Simarouba amara and Minquartiaguianensis, two tropical wet forest trees with different growthhabits, Oecologia, 100, 213–220, 1994.
Scheiter, S. and Higgins, S. I.: Impacts of climate change on thevegetation of Africa: an adaptive dynamic vegetation modellingapproach, Global Change Biol., 15, 2224–2246, 2009.
Scheiter, S., Langan, L., and Higgins, S. I.: Next-generation dy-namic global vegetation models: learning from community ecol-ogy, New Phytol., 198, 957–969, 2013.
Sheffield, J., Goteti, G., and Wood, E. F.: Development of a 50-yearhigh-resolution global dataset of meteorological forcings for landsurface modeling, J. Climate, 19, 3088–3111, 2006.
Shukla, J., Nobre, C., and Sellers, P.: Amazon deforestation andclimate change, Science, 247, 1322–1325, 1990.
Sitch, S., Smith, B., Prentice, I. C., Arneth, A., Bondeau, A.,Cramer, W., Kaplan, J. O., Levis, S., Lucht, W., Sykes, M. T.,Thonicke, K., and Venevsky, S.: Evaluation of ecosystem dy-namics, plant geography and terrestrial carbon cycling in the LPJdynamic global vegetation model, Global Change Biol., 9., 161–185, 2003.
Sombroek, W.: Amazon landforms and soils in relation to biologicaldiversity, Acta Amazonica, 30, 81–100, 2000.
Sombroek, W.: Spatial and temporal patterns of Amazon rainfall:consequences for the planning of agricultural occupation and theprotection of primary forests, AMBIO: A Journal of the HumanEnvironment, 30, 388–396, 2001.
Spitters, C. J. T.: Separating the diffuse and direct component ofglobal radiation and its implications for modeling canopy pho-tosynthesis Part II. Calculation of canopy photosynthesis, Agr.Forest Meteorol., 38, 231–242, 1986.
Spracklen, D. V., Arnold, S. R., and Taylor, C. M.: Observations ofincreased tropical rainfall preceded by air passage over forests,Nature, 489, 282–285, 2012.
Sultan, S. E.: Phenotypic plasticity for plant development, functionand life history, Trends Plant Sci., 5, 537–542, 2000.
Taylor, M. S. and Thompson, J. R.: A data based algorithm for thegeneration of random vectors, Comput. Stat. Data Analysis, 4,93–101, 1986.
Ter Steege, H., Pitman, N. C. A., Phillips, O. L., Chave, J.,Sabatier, D., Duque, A., Molino, J.-F., Prévost, M.-F., Spichiger,R., Castellanos, H., von Hildebrand, P., and Vásquez, R.:Continental-scale patterns of canopy tree composition and func-tion across Amazonia, Nature, 443, 444–447, 2006.
Ter Steege, H. ter, Pitman, N. C. A., Sabatier, D., Baraloto, C.,Salomão, R. P., Guevara, J. E., Phillips, O. L., Castilho, C. V.,
Magnusson, W. E., Molino, J.-F., Monteagudo, A., Vargas, P. N.,Montero, J. C., Feldpausch, T. R., Coronado, E. N. H., Killeen,T. J., Mostacedo, B., Vasquez, R., Assis, R. L., Terborgh, J.,Wittmann, F., Andrade, A., Laurance, W. F., Laurance, S. G.W., Marimon, B. S., Marimon, B.-H., Vieira, I. C. G., Amaral,I. L., Brienen, R., Castellanos, H., López, D. C., Duivenvoorden,J. F., Mogollón, H. F., Matos, F. D. de A., Dávila, N., García-Villacorta, R., Diaz, P. R. S., Costa, F., Emilio, T., Levis, C.,Schietti, J., Souza, P., Alonso, A., Dallmeier, F., Montoya, A. J.D., Piedade, M. T. F., Araujo-Murakami, A., Arroyo, L., Gribel,R., Fine, P. V. A., Peres, C. A., Toledo, M., C, G. A. A., Baker,T. R., Cerón, C., Engel, J., Henkel, T. W., Maas, P., Petronelli,P., Stropp, J., Zartman, C. E., Daly, D., Neill, D., Silveira, M.,Paredes, M. R., Chave, J., Filho, D. de A. L., Jørgensen, P. M.,Fuentes, A., Schöngart, J., Valverde, F. C., Fiore, A. D., Jimenez,E. M., Mora, M. C. P., Phillips, J. F., Rivas, G., Andel, T. R.van, Hildebrand, P. von, Hoffman, B., Zent, E. L., Malhi, Y., Pri-eto, A., Rudas, A., Ruschell, A. R., Silva, N., Vos, V., Zent, S.,Oliveira, A. A., Schutz, A. C., Gonzales, T., Nascimento, M. T.,Ramirez-Angulo, H., Sierra, R., Tirado, M., Medina, M. N. U.,Heijden, G. van der, Vela, C. I. A., Torre, E. V., Vriesendorp, C.,et al.: Hyperdominance in the Amazonian Tree Flora, Science,342, 6156 doi:10.1126/science.1243092, 2013.
Thompson, J. R.: Empirical Model Building, John Wiley & Sons,1989.
Tjoelker, M. G., Oleksyn, J., and Reich, P. B.: Modelling respira-tion of vegetation: evidence for a general temperature-dependentQ10, Global Change Biol., 7, 223–230, 2001.
Townsend, A. R., Asner, G. P., and Cleveland, C. C.: The biogeo-chemical heterogeneity of tropical forests, Trends Ecol. Evol.,23, 424–431, 2008.
Valentini, R., Matteucci, G., Dolman, A. J., Schulze, E.-D., Reb-mann, C., Moors, E. J., Granier, A., Gross, P., Jensen, N. O.,Pilegaard, K., Lindroth, A., Grelle, A., Bernhofer, C., Grünwald,T., Aubinet, M., Ceulemans, R., Kowalski, A. S., Vesala, T., Ran-nik, Ü., Berbigier, P., Loustau, D., Guðmundsson, J., Thorgeirs-son, H., Ibrom, A., Morgenstern, K., Clement, R., Moncrieff, J.,Montagnani, L., Minerbi, S., and Jarvis, P. G.: Respiration as themain determinant of carbon balance in European forests, Nature,404, 861–865, 2000.
Verheijen, L. M., Brovkin, V., Aerts, R., Bönisch, G., Cornelissen,J. H. C., Kattge, J., Reich, P. B., Wright, I. J., and van Bodegom,P. M.: Impacts of trait variation through observed trait–climaterelationships on performance of an Earth system model: a con-ceptual analysis, Biogeosciences, 10, 5497–5515, 2013,http://www.biogeosciences.net/10/5497/2013/.
Visual Numerics Fortran Numerical Stat Library, avail-able at: http://www.roguewave.com/portals/0/products/imsl-numerical-libraries/fortran-library/docs/7.0/stat/stat.htm(last access: 15 January 2014), 2014.
Vitousek, P. M. and Farrington, H.: Nutrient limitation and soil de-velopment: experimental test of a biogeochemical theory, Bio-geochemistry, 37, 63–75, 1997.
Walker, T. W. and Syers, J. K.: The fate of phosphorus during pedo-genesis, Geoderma, 15, 1–19, 1976.
Wang, Y. P., Lu, X. J., Wright, I. J., Dai, Y. J., Rayner, P. J., andReich, P. B.: Correlations among leaf traits provide a significantconstraint on the estimate of global gross primary production,Geophys. Res. Lett., 39, doi:10.1029/2012GL053461, 2012.
Geosci. Model Dev., 7, 1251–1269, 2014 www.geosci-model-dev.net/7/1251/2014/

N. M. Fyllas et al.: Analysing Amazonian forest productivity using a new individual and trait-based model 1269
White, A., Cannell, M. G., and Friend, A. D.: Climate change im-pacts on ecosystems and the terrestrial carbon sink: a new assess-ment, Global Environ. Change, 9, S21–S30, 1999.
Wright, I. J., Reich, P. B., Westoby, M., Ackerly, D. D., Baruch,Z., Bongers, F., Cavender-Bares, J., Chapin, T., Cornelissen, J.H. C., Diemer, M., Flexas, J., Garnier, E., Groom, P. K., Gu-lias, J., Hikosaka, K., Lamont, B. B., Lee, T., Lee, W., Lusk, C.,Midgley, J. J., Navas, M.-L., Niinemets, Ü., Oleksyn, J., Osada,N., Poorter, H., Poot, P., Prior, L., Pyankov, V. I., Roumet, C.,Thomas, S. C., Tjoelker, M. G., Veneklaas, E. J., and Villar, R.:The worldwide leaf economics spectrum, Nature, 428, 821–827,2004.
York, D., Evensen, N. M., Martínez, M. L., and Delgado, J.D. B.: Unified equations for the slope, intercept, and stan-dard errors of the best straight line, Am. J. Physics, 72, 367,doi:10.1119/1.16324862004, 2004.
Zhang, Y., Xu, M., Chen, H., and Adams, J.: Global pattern of NPPto GPP ratio derived from MODIS data: effects of ecosystemtype, geographical location and climate, Global Ecol. Biogeogr.,18, 280–290, 2009.
www.geosci-model-dev.net/7/1251/2014/ Geosci. Model Dev., 7, 1251–1269, 2014