
Analyses of Cerebral Microdialysis in Patients with ... · 1 Analyses of Cerebral Microdialysis in...
43
1 Analyses of Cerebral Microdialysis in Patients with Traumatic Brain Injury; Relations to Intracranial Pressure, Cerebral Perfusion Pressure and Catheter Placement. David W. Nelson 1 , Björn Thornquist 1 , Robert M. MacCallum 2 , Harriet Nyström 3 , Anders Holst 4 , Anders Rudehill 1 , Michael Wanecek 1 , Bo-Michael Bellander 5 * and Eddie Weitzberg 1 *. * contributed equally 1 Section of Anesthesiology and Intensive care Dept. of Physiology and Pharmacology Karolinska Institutet Stockholm Sweden 2 Division of Cell and Molecular Biology, Immunogenomics group Imperial College London United Kingdom 3 Section of Neuroradiology Dept. of Clinical Neuroscience Karolinska Institutet Stockholm Sweden 4 Swedish Institute of Computer science (SICS) Kista Sweden 5 Section of Neurosurgery Dept. of Clinical Neuroscience Karolinska Institutet Stockholm Sweden E-mail addresses: Dr David W Nelson MD DWN [email protected] Dr Björn Thornquist MD BT [email protected] Dr Robert M MacCallum PhD RMM [email protected] Dr Harriet Nyström MD HN [email protected] Dr Anders Holst PhD AH [email protected] Docent Anders Rudehill MD PhD AR [email protected] Dr Michael Wanecek MD PhD MW [email protected] Dr Bo-Michael Bellander MD PhD BMB [email protected] Professor Eddie Weitzberg MD PhD EW [email protected] Study conducted at the neurointensive care unit of the Karolinska University Hospital Suggested Keywords: Traumatic Brain Injury; TBI; Microdialysis; Intracranial Pressure; Cerebral Perfusion Pressure; Glasgow Outcome Scale; Corresponding author; David W. Nelson
Transcript of Analyses of Cerebral Microdialysis in Patients with ... · 1 Analyses of Cerebral Microdialysis in...

1
Analyses of Cerebral Microdialysis in Patients with Traumatic Brain
Injury; Relations to Intracranial Pressure, Cerebral Perfusion
Pressure and Catheter Placement.
David W. Nelson1, Björn Thornquist
1, Robert M. MacCallum
2, Harriet Nyström
3,
Anders Holst4, Anders Rudehill
1, Michael Wanecek
1, Bo-Michael Bellander
5* and
Eddie Weitzberg1*.
* contributed equally
1Section of Anesthesiology and Intensive care
Dept. of Physiology and Pharmacology
Karolinska Institutet
Stockholm Sweden
2Division of Cell and Molecular Biology, Immunogenomics group
Imperial College London
United Kingdom
3Section of Neuroradiology
Dept. of Clinical Neuroscience
Karolinska Institutet
Stockholm Sweden
4Swedish Institute of Computer science (SICS)
Kista
Sweden
5Section of Neurosurgery
Dept. of Clinical Neuroscience
Karolinska Institutet
Stockholm Sweden
E-mail addresses:
Dr David W Nelson MD DWN [email protected]
Dr Björn Thornquist MD BT [email protected]
Dr Robert M MacCallum PhD RMM [email protected]
Dr Harriet Nyström MD HN [email protected]
Dr Anders Holst PhD AH [email protected]
Docent Anders Rudehill MD PhD AR [email protected]
Dr Michael Wanecek MD PhD MW [email protected]
Dr Bo-Michael Bellander MD PhD BMB [email protected]
Professor Eddie Weitzberg MD PhD EW [email protected]
Study conducted at the neurointensive care unit of the Karolinska University Hospital
Suggested Keywords:
Traumatic Brain Injury; TBI; Microdialysis; Intracranial Pressure; Cerebral Perfusion Pressure;
Glasgow Outcome Scale;
Corresponding author; David W. Nelson

2
Abstract
Background: Cerebral microdialysis (MD) is used to monitor local brain chemistry of
patients with traumatic brain injury (TBI). Despite an extensive literature on cerebral
MD in the clinical setting it remains unclear how individual levels of real-time MD
data are to be interpreted. Intracranial pressures (ICP) and cerebral perfusion
pressures (CPP) are important continuous brain monitors in neurointensive care. They
are used as surrogate monitors of cerebral blood flow and have an established relation
to outcome. The purpose of this study was to investigate the relations between MD
parameters and ICP/CPP in patients with TBI.
Methods: Cerebral MD, ICP and CPP were monitored in 90 patients with TBI. Data
was extensively analyzed using over 7350 samples of complete (hourly) MD data sets
(glucose, lactate, pyruvate and glycerol), seeking representations of ICP, CPP and
MD that best correlated. MD-catheter positions were located on computed
tomography scans as pericontusional or non-pericontusional. MD markers were
analyzed for correlations to ICP and CPP using time series regression analysis, mixed
effect models and non-linear (artificial neural networks) computer based pattern
recognition methods.
Results: Despite much data indicating highly perturbed metabolism, MD shows weak
correlations to ICP and CPP. In contrast, the autocorrelation of MD is high for all
markers, even at up to 30 hours away. Consequently, subject identity alone explains
521-75% for MD marker variance. This indicates that the dominant metabolic
processes monitored with MD are long-term, spanning days or longer. In comparison,
short-term (differenced or delta) changes of MD vs. CPP are significantly correlated
in pericontusional locations, but with less than 1% explained variance. Moreover,

3
CPP and ICP were significantly related to outcome (Glasgow Outcome Scale), while
no significant relations were found between outcome and MD.
Conclusions: The multitude of highly perturbed local chemistry seen with MD in TBI
predominately represents long-term metabolic patterns, and is weakly correlated to
ICP and CPP. This suggests that other disturbances than pressure/flow have a
dominant influence on MD levels in patients with traumatic brain injury.

4
Background
Cerebral microdialysis (MD) has been used to monitor traumatic brain injury (TBI)
patients for over a decade, but the methodology has not yet found a clear place in the
neurointensive care (NICU) arsenal of multimodal monitoring [1, 2]. The commonly
monitored parameters that are advocated to follow dynamic metabolic changes in
viable but vulnerable tissue (and their current predominant interpretations) are;
lactate, pyruvate (metabolic markers of redox state and thus ischemia/hypoxia),
glucose (local capillary flow, but also related to blood glucose and metabolism),
glutamate (excitotoxic marker) and glycerol (phospholipid degradation as a marker of
cell breakdown and death) [3]. Baseline values have been investigated [4], ischemic
interpretations of MD have been suggested [5], and are supported by findings from
the ischemic penumbra [6]. MD has been shown repeatedly to correlate with other
components of multimodal brain monitoring, such as jugular venous saturation and
brain tissue oxygenation [3]. Specifically, intracranial pressure (ICP) and cerebral
perfusion pressure (CPP) have both been reported to correlate with MD values [7, 8],
and manipulation of these parameters are often first-line bedside responses to
pathological MD values. CPP has also been claimed to be the most frequently used
surrogate monitor of cerebral blood flow [9].
Despite the above, it remains unclear as to how the individual levels of the real-time
MD data streams are to be interpreted on a patient-to-patient basis and the value of
using MD in the treatment of TBI has not yet been established [2, 3, 10, 11]. While
MD derived data seems a sensitive monitor of local ischemic tissue, shown especially
in the experimental ischemic penumbra [12], there is a growing awareness that the

5
classical ”ischemic” interpretation of MD values in the traumatic border-zone may
often reflect metabolic states unrelated to ischemia or tissue hypoxia [13]. In addition
the scope of ischemia in TBI may not be as extensive as previously thought [13, 14].
Although sensitive, MD may thus be a non-specific monitor of ischemia [11]. This
appears in conflict with the expectations of MD as a dynamic monitor of ischemia
used for online interpretation and decision-making.
The real-time interpretability of an on-line monitoring system is fundamental for its
use, but conflicting interpretations of MD in TBI have emerged, especially those that
can potentially be interpreted as ischemia/hypoxia. The concept of ICP and CPP
vulnerable pericontusional tissue, where MD could be used to monitor the dynamic
metabolic effects of local oxygen delivery-dependant ischemia/hypoxia, contrasts that
of possible cytopathic hypoxic “states”. Here, instead local oxygen utilization itself
could be altered such as by mitochondrial dysfunction [15] or diffusion barriers [16].
These states would be expected to be less susceptible to ICP/CPP variation. A
consensus [17], and an investigation [18], have also highlighted the importance of
computed tomography (CT)-verified catheter placement, and MD is suggested to be
most informative when monitoring vulnerable, ischemia/hypoxia prone, traumatic
pericontusional (border-zone) tissue.
The analysis of MD data requires special consideration, as it is a time series, where
intra-subject data hours are correlated. This must be taken into account in analysis.
We have found earlier in TBI patients using a computer based pattern recognition
method (self organizing maps) [19] that MD patterns, even those potentially
interpretable as ischemia, were unexpectedly static over time and therefore highly
6
delineate subjects. This suggests that the dominant monitored metabolic processes
with MD were long term, extending over whole patient monitoring periods. It has
been recognized that this data intra-subject time-dependency has often been
overlooked in analysis of MD data [20]. Despite this, hourly MD from individuals
continues to be analyzed as independent data [21, 22].
The aim of the present study was to establish, in a large MD data set, the extent to
which MD correlates to ICP and CPP when taking into account the correlated time-
series nature of MD data in analyses. A strong correlation of MD values to ICP and
CPP would suggest pressure/flow processes to be central causes of locally perturbed
metabolism. To this purpose, extensive data mining was performed. In line with
consensus, a CT-defined group of optimally placed pericontusional catheters was
identified and contrasted to non-pericontusional placed catheters. In addition, MD,
CPP and ICP data were also analyzed for relations to Glasgow Outcome Scale (GOS).
Methods
The study was approved by the local ethics committee on human research at the
Karolinska Institutet and the Karolinska University Hospital. Our standard NICU care
was applied, and no interventions were employed as part of this investigation.
Inclusion
This study was a retrospective analysis including all consecutive patients admitted to
the adult (> 15 years of age) NICU with TBI requiring mechanical ventilation
7
(generally Glasgow Coma Scale (GCS) < 8), during a five-year period, with
functioning MD catheters, ICP monitoring and arterial catheters.
Patient management
All patients were intubated, mechanically ventilated and sedated with morphine,
midazolam or propofol. Mass lesions were evacuated as deemed appropriate by
neurosurgeons. ICP was measured predominantly with ventricular catheters, or in
some cases with intra-parenchymal pressure monitors (Codman
). Mean arterial
pressure (MAP) was measured invasively, commonly in the radial artery. CPP was
calculated as MAP-ICP, with both transducers placed at the mid lateral ventricular
level. Patient’s heads were elevated 20-30°. ICP was targeted at < 20 mm Hg and
CPP at 60-70 mm Hg. Targets were achieved with intravascular infusions (Ringer’s
acetate
, albumin), vasopressors (norepinephrine), osmotic therapy (hypertonic NaCl,
mannitol), intermittent cerebral spinal fluid (CSF) drainage from ventricular catheters,
ventilation and temperature control, and decompressiv craniotomy as needed. When
ICP could not be controlled with other measures, sodium thiopental was infused,
limited by burst suppression, and monitored with continuous EEG. PCO2 was
targeted at 4.5 kPa. When mild hyperventilation was employed, for ICP control, it
was guided by venous jugular bulbar saturation and arterial-jugular lactate difference.
Temperature was regulated to 37° C with paracetamol or external wrapping cooling
systems. Mild hypothermia (35-36° C) was used for high, refractory ICP. Blood
glucose was targeted at 4-8 mmol/L and hemoglobin was targeted at > 90 g/L.
Microdialysis technique

8
CT-visible gold-tipped MD catheters, of 10 mm length and a 20 kDa cutoff CMA 70
(CMA
, Solna, Sweden), were placed in conjunction with evacuation of mass lesions
or placement of ICP monitors, in theater. Catheters were perfused with a solution with
an electrolyte composition similar to the CSF (CMA
) at 0.3µL/min via a pump
(CMA
106). Dialysate was sampled to vials and analyzed immediately for glucose,
lactate, pyruvate and glycerol, using the CMA
600 enzyme photometric analyzer, at
1-hour intervals. The extraction ratio of this catheter and perfusion rate is known to be
close to 70% [23]. MD catheters were viewed on CT scans with assistance of a
neuroradiologist. Pericontusional location was defined as within 2 cm of a mass lesion
(hyper/hypodense contusion or a hematoma border) on CT-scan. Catheters not
fulfilling this definition were defined as non-pericontusional.
Data acquirement and preparation
ICP and MAP data were collected at 1-2 min intervals with the Datex monitoring
system (Datex-Ohmeda
, Helsinki, Finland), and saved to disk with MD data using
the program ICU pilot (CMA
, Solna Sweden). Data was checked for integrity
removing known artifacts, such as arterial catheter flushing, non-functioning dialysate
pumps, catheters producing empty vials, or logged events of erroneous handling or
labeling of vials. A MD catheter transfer time (from membrane to vial) of 17 minutes
was adjusted for. Limiters were applied to out of range data (as specified by CMA
)
to avoid nonsensical ratios. Sets of complete markers (glucose, lactate, pyruvate and
glycerol) were extracted with ICP/CPP and time codes. Ratios of lactate/pyruvate
(LP-ratio) and lactate/glucose (LG-ratio) were calculated. MD data was viewed for
skew and standard log10 and square-root transformations were performed to approach
normal distributions (lactate, pyruvate and glucose: square root, glycerol: log10).

9
Glasgow Outcome Scale (GOS) [24] was recorded at 3 time points; neurosurgical
discharge, 3-6 months post trauma and > 1 year post trauma. Best-GOS was defined
as the highest value of these time points and was used in the study. We hypothesize
that this value is most related to structural TBI changes. Patients with only discharge
GOS and that being 2-4 were considered lost to follow up.
Statistical Analyses
Analyses were performed using MATLAB
(Mathworks
, MA, USA) and the
statistical program R (R Foundation for Statistical Computing, Vienna, Austria.
http://www.R-project.org) [25].
Auto- and cross-correlation of MD and ICP/CPP data
Our earlier study suggested predominantly long-term (in the order of days) patterns of
MD and thus that there should be a high autocorrelation [19]. Therefore, MD and
ICP/CPP were analyzed for auto- and cross-correlations (per patient) of the time
series. Autocorrelation is the extent values are correlated with themselves over time.
Cross-correlation refers to the extent to which variables are correlated with each
other. In the cross-correlation analysis checks were also performed using (per patient)
randomly permuted MD data, thus eliminating the time-series component of the data.
Multivariate correlations of MD and ICP/CPP data
Composite patterns of MD may be more related to ICP/CPP than individual markers.
Multivariate analysis was therefore employed using two methods (one linear - mixed
effect linear models and one non-linear method- artificial neural networks). Both
avoid the principle problems of intra-subject data dependency, but by different means.

10
With mixed effect linear models the autocorrelated structure of the data can be
accounted for in analyses and significant correlations in excess of this can be
evaluated. With artificial neural networks a cross-validation procedure is employed
(in our case leaving one patient out at a time) to ensure that correlations generalize
and are thus relevant to all patients.
Mixed effect linear models (LME) were fitted, using Restricted Maximum Likelihood
(REML) using the nmle library for R. Random effects were that of patients, with an
autoregressive moving-average covariance (ARMA (1,1)) structure for near lying data
hours.
Artificial neural networks (ANNs) with radial basis functions were trained to predict
ICP/CPP from MD values. The strength of predictions was assessed as the correlation
of true vs. predicted ICP/CPP. Optimal number of nodes and training epochs, and
model assessments were determined with cross-validation (Radial Basis Networks,
MATLAB
ANN module, Netlab
by Bishop (www.ncrg.aston.ac.uk/netlab/)).
Hourly means of ICP and CPP (hour prior to MD sample time) were the predicted
variables. An extended search was also performed to identify other possible
representations or time-points of ICP/CPP (hour or % of monitoring over/under
cutoffs) that could enhance predictions.
As a consequence of findings from auto- and cross-correlation analyses, mean (per-
subject) MD/ICP/CPP data was subsequently correlated uni- and multivariately.
Outliers giving undue influence to correlations were identified as Cook’s distance >1.
Relative changes of MD data towards ICP/CPP
Pertinent information may be found in short-term (hourly) changes of MD. Univariate
and multivariate correlations of relative levels of MD towards ICP/CPP were explored

11
by two methods using linear regression; First, delta values, differenced MD (from 1-
to-4 hourly samples) were correlated to ICP/CPP (absolute levels and differenced).
Second, individual normalization (i.e. relative changes of a patients MD values
around their own means), which is motivated if there are differing “baseline” values
for local areas where MD catheters are positioned (and thus for subjects), and short-
term changes are superimposed on these baselines. Patient’s data were normalized to
a mean of zero and standard deviation of 1. Data was in addition checked to identify
any need for de-trending (relative values around a general trend or base-line; such as
that patients generally get better over time).
Outcome analysis
One-way ANOVA and Kruskal-Wallis were used for analyses of MD and ICP/CPP
towards GOS. Patients with less than 12 hours of MD were excluded from outcome
analyses.
Results
Data description
Ninety patients were eligible for analysis and had ages ranging from 15-77 years.
Mean age was 48.9 years. Mean GCS was 6.5 (median 6.0) . Admission GCS was 3-8
(72%), 9-12 (18%) and 13-15 (10%). Complete sets (all four markers) of MD were
obtained for a mean of 84 (hours-samples)/patient. Sixty-four catheters (64 patients,
5645 MD complete samples) were identified as pericontusional on CT scans and 26
(26 patients, 1731 MD complete samples) were identified as non-pericontusional. One

12
patient was lost to follow up and had only GOS at discharge. Five patients had less
than 12 hours of MD and were excluded from outcome analysis. Mortality was 15%
and there was a 57% percent favorable outcome (GOS 4 and 5). No patient was
vegetative (GOS 2).
Pooled MD data in relation to catheter placement, ICP and CPP
Mean MD data from pericontusional and non-pericontusional catheters are shown in
Table 1 and 2, binned to ICP and CPP intervals, respectively. Extreme caution must
be exerted interpreting such tables with pooled values, as they do not take into
account the correlated nature of repeated measures within subjects. A patient’s data
will be unevenly distributed between the bins and can thus affect bins
disproportionally. Despite this, primarily glucose levels, may suggest an interesting,
and possibly expected, trend in relation to ICP and CPP levels. Another approach to
visualize this data is a scatter-plot with a non-linear fit (lowess- locally weighted
regression), Fig. 1 and 2. The shown MD markers are chosen as those displaying
possible trends in Tables 1 and 2. The y-axis for the LP-ratios are truncated to allow
better inspection of the plots around the regression line, not showing some extreme
high values, but all data is used for the lowess fit. The data below 50 mm Hg for CPP
must be judged (as above) with caution, as the extreme MD values in this region are
seen clustered mainly from one subject and the consistency of MD responses at this
cut-off, between subjects, can therefore not be evaluated.
Longitudinal trends of MD
MD data from all patients are plotted from the time of catheter insertion, with a
lowess regression (Fig. 3), showing no clear trends motivating de-trending of the data

13
prior to analysis. The same applies for the non-pericontusional catheters separately
(not shown). This was confirmed as detrending data after second and third order
polynomial fits did not enhance later ICP or CPP predictions.
Autocorrelation
MD, ICP and CPP are all shown to be highly autocorrelated (Fig. 4), where CPP and
glucose exhibit the least autocorrelation and glycerol exhibits the highest. The degree
of autocorrelation is found to extend so far over time that individuals are identifiable.
This is seen with linear regression analyses using subject-identities as sole
explanatory variables. Here, subject identity is found to alone explain the variance of
MD to 521-75% (glucose R2=0.521, lactate R
2=0.75, pyruvate R
2=0.63, glycerol
R2=0.62, LG-ratio R
2=0.69, LP-ratio R
2=0.54) in 90 patients. These results indicate
that the dominant information in MD, with these markers, reflects long-term
processes (in the order of days), and that all other factors dynamically affecting MD
must consequently share the remaining unexplained variance.
Cross-correlations of MD and ICP/CPP
In contrast to the strong autocorrelations presented above, the associations between
MD variables and ICP/CPP are weak explaining at most 9 % of variance (Fig. 5 and
6). These weak correlations are also seen to be similar at all time off-sets (lag hours)
between MD and ICP/CPP, and are thus independent of when MD and ICP/CPP are
sampled in relation to each other. This strongly suggests that it is the mean patient
MD values, which are predominately related to mean subject ICP/CPP values. This is
conclusively tested by randomly permuting (scrambling) the MD time series per
subject. Correlations were then found substantially unaltered for all MD markers,

14
ratios and both catheter locations. Example of this is shown for the strongest cross-
correlations, those of LG-ratio and ICP/CPP from pericontusional catheters (Fig. 7).
A Monte-Carlo derived confidence interval is supplied after repeated random
permutations of MD data, per subject. A control, randomly permuting all the data
(also between subjects) gives the expected levels of near zero correlations.
In aggregate, these analyses convincingly indicate that the dominant information in
univariate correlations of MD values and ICP/CPP are weak and that there is little
information in the (ordered) time series in excess of data means. The relations
between MD and ICP/CPP appear thus more related to the individual patient than any
dynamic relationship that can be followed during MD monitoring. Consequently,
mean per-patient correlations were also assessed in further analyses (see below).
Multivariate correlations of MD and ICP/CPP
Composite patterns of MD variables may be more related to ICP/CPP than individual
MD variables. Therefore multivariate analyses of MD towards ICP/CPP were
performed with two methods, artificial neural networks and mixed models.
The motivation for using adaptive non-linear regression methods (such as ANNs) is
that they can adjust to potential non-linear relationships that can exist in limited
regions of data (for example that CPP could be related to an increased LP-ratio and
low glucose, but only under 50 mm Hg). This non-linearity would not be modeled in a
linear regression. A cross-validation procedure (repeatedly leaving out patients from
model development and using them to evaluate models) is crucial so that ANNs do

15
not “learn” patients, but model the underlying general relationship between MD and
ICP/CPP.
Results of these analyses are presented in Table 3 as the correlation coefficient
between true and predicted ICP/CPP, using MD parameters as explanatory variables.
Multivariate associations between MD and ICP/CPP were found to be weak in both
pericontusional and non-pericontusional catheter locations. ICP may be more related
to MD in non-pericontusional and CPP in pericontusional positions (the negative
correlation in models designed to make positive predictions is interpreted as “even
worse”). Again, there is clear indication that permuting (scrambling) subject data
hours has limited effects on predictions.
Linear mixed effect models allow for multivariate analyses of grouped data structures.
The dependency of interra-subject data can be analyzed as a random-effect. The
fixed-effect (subject independent effect) between MD and ICP/CPP can then be
evaluated. In addition, an intra-subject data structure (such as strong correlations and
dependency of near lying MD hours) can be introduced. Linear mixed effect analyses
were performed with MD markers and ratios as explanatory variables and ICP or CPP
as predicted variables. Pericontusional and non-pericontusional data were analyzed
separately. Data from adjacent MD hours were, in congruence with the
autocorrelation analyses, highly correlated (0.77-0.83) in all groups. In addition, these
analyses identified glucose and LG-ratio as significantly related (p<0.05) to both ICP
and CPP in pericontusional locations and LP-ratio was found significantly related to
ICP in both the peri- and non-pericontusional positions. There were no significant
correlations between MD and CPP in non-pericontusional positions. However, despite

16
these quoted significances, regression coefficients were small and extreme changes of
MD marker values predicted minor changes in ICP/CPP, indicating a generally weak
association between MD and ICP/CPP.
In summary, these analyses also indicate that the correlations between MD and
ICP/CPP are weak when taking into account the correlated nature of intra-subject
data. The main strength of correlation is shown, again, to be related to subject data
means. We identified no apparent multivariate and/or non-linear information that
appreciably strengthen correlations.
Mean data analysis of MD vs. ICP/CPP
Regression analysis to mean (per subject) values of MD markers vs. ICP/CPP was
performed. Here, significances were tested against number of patients (mean of each
patients whole monitoring period) instead of number of MD samples.
The significances in these analyses mirrored that of the mixed model analyses and the
strongest relationships were found between ICP and glucose in pericontusional tissue
(R2=0.16) and LP-ratio ratio in non-pericontusional tissue (R
2=0.15). Multivariate
regression did not enhance R2
values. An automated search for alternative cut-offs of
ICP and CPP that could better represent the data (stronger correlations) was
performed, but no other representation (hours or % of monitoring under/over cut-offs)
strengthened correlations, as compared to hourly means.
Differenced and by-subject normalization of MD data vs. ICP/CPP
17
The results presented so far strongly indicate that the dominant processes affecting
MD values follow an appreciably longer “time-span” than (the common) hourly
sampling. Differenced (delta) values could possibly reveal associations of short-term
effects of ICP/CPP superimposed on longer trends of MD. Thus, differenced MD was
analyzed towards ICP/CPP, and differenced ICP/CPP. In these uni- and multivariate
analyses significant changes were found for CPP in pericontusional catheters but no
R2 values were greater than 0.002.
In contrast to absolute levels of MD, the particular location of a MD catheter could
exhibit a “base-line” characteristic and relative changes could be related to ICP/CPP.
MD was therefore analyzed towards ICP/CPP, after normalization (per-subject) of the
data. These analyses identified statistically significant but weak multivariate
correlations (max R2=0.069) for ICP in non-pericontusional catheters. All other
analyses had R2<0.020 between MD and ICP/CPP in both catheter locations.
In summary, the two methods exploring relative changes and levels of MD in relation
to ICP/CPP indicate only weak associations.
MD, ICP and CPP vs. outcome
A reduction to mean-values-per-subject (motivated by the above analyses) enables the
examination of MD and ICP/CPP with respect to other global (per-subject)
parameters, such as outcome. There were significant differences in subject-means for
CPP (p=0.014) and ICP (p=0.021), as related to GOS levels (Fig. 8). In contrast, there
were no significant differences for any MD means, MD ratios or increased LP-ratios
(hours or % of monitoring time) (p=0.14-0.96) as compared to GOS, in the full

18
dataset, or subgroups of peri- and non-pericontusional catheters. Significant findings
(p <0.05) were unchanged with both Kruskal-Wallis ranked and one-way ANOVA
analyses. Excluding the subject with only discharge GOS did not alter significances.
Discussion
In this study, with more than 7350 hourly samples of complete MD sets from 90
patients, we have performed an extensive search with several types of statistical and
computer based linear and non-linear pattern recognition methods, to explore the
relationship between ICP, CPP and the commonly used MD markers in TBI
monitoring. The main finding was that despite much of the data indicating highly
perturbed metabolism, the relationships between MD and ICP, CPP, were weak. This
suggests that other factors than these pressure/surrogate-flow variables may be
dominant causes of perturbations in the clinical TBI setting. In contrast, intra-subject
correlations (autocorrelation) of MD are high for all MD parameters and ratios, even
up to 30 hours. In fact these autocorrelations are so extended in time that subject-
identities alone explain 52-75% of MD variable variance. This indicates that the
dominant patterns of MD seen in TBI (with the studied variables) are protracted,
reflecting processes that change over days or longer. This leaves limited unexplained
variance to be shared among other variables that have been shown to affect MD
values during monitoring, such as hyperventilation [26], meningitis [27], temperature
[28] and seizures [29]. Importantly, this applies for catheters in both (CT defined)
pericontusional and non-pericontusional locations. In contrast to long-term, short-
term (differenced) associations of MD, though significant for CPP in pericontusional

19
tissue, explain only up to 0.2% of variance. These results may not be harmonious with
the expectations of MD as a dynamic and interpretable on-line monitor of
ischemia/hypoxia in TBI. In addition, a significant relation was found between
CPP/ICP and GOS, but could not be confirmed for MD and GOS.
MD is commonly sampled once per hour in the NICU. The objective is to monitor
short-term changes and more long-term trends. Short-term changes have focused
primarily on potentially ischemic/hypoxic interpretations of the data, where increased
LP-ratios and low glucose have often been implicated as being local ischemic/hypoxic
metabolic responses [1]. The traumatic border zone has though been recognized as
distinctly different to the ischemic penumbra and regionally heterogeneous [30-32].
The interpretation of more long-term patterns of metabolic perturbation have received
less focus, but increased LP-ratios have also been linked to different causes of altered
oxygen utilization in TBI, as opposed to oxygen delivery. These include oxygen
diffusion barriers [16] , mitochondrial dysfunction [15, 33] and increased metabolism
of glucose [34]. In addition, irreversibly damaged (post hypoxic), but reperfused
regions, may also display extended periods with MD of ischemic/hypoxic character
[35]. Alternative interpretations of lactate, pyruvate and LP-ratios in TBI have
therefore been postulated [11] and more complex supply and demand relations of
these parameters under non-ischemic conditions have also been identified [36].
Moreover, MD may also be influenced by static parameters such as catheter
placement in grey or white matter [37], genetics [38] and gender [39]. Our study
strongly indicates that the dominant information content in MD of TBI patients is that
of long-term patterns, reflected in the strong autocorrelations and that MD can so
highly be explained by subject identities. This includes the LP-ratio, which is also
20
seen to be highly autocorrelated. The significant but weak cross-correlations between
MD and ICP/CPP are also seen to be predominantly caused by long-term
perturbations, as the correlations are largely unaffected by how subject MD data-
hours are serially related to ICP/CPP hours. In addition, the MD response to CPP/ICP
changes is variable even in ranges that are by consensus considered unsafe. This may
lead to question the current value of hourly sampling of MD in clinical TBI
monitoring, in the absence of known cause and effect relationships, and points to a
need of more reliable interpretations of pathological values for clinical use. We
suspect that to differentiate patterns displaying similar levels and with possible
different etiologies, one needs also to better include temporal relations of MD
patterns.
The effect of CPP/ICP on local and global blood flow in TBI is complex [9] and the
effects on MD have been found variable. Extreme ranges of ICP/CPP have been
shown to have predictable effects on regional MD [40] and Nordström et al. [41] have
identified MD changes related to CPP <50 & >70 mm Hg. In contrast, CPP
augmentation has been shown to increase cerebral blood flow with PET but not
translate to predictable changes in regional chemistry, as seen with MD [42]. In
addition, increased LP-ratios in pericontusional tissue have been shown to be
independent of CPP [20]. Our study distinguishes between long-term and short-term
relationships between MD and ICP/CPP. We have used multiple analysis techniques
to assess our data and their findings are in basic congruence. Despite being weak,
CPP is found related to MD exclusively in pericontusional tisse, whereas ICP is
related to MD in both peri and non-pericontusional tissues. In contrast to long-term
relations, differenced short-term values were exclusively related to CPP in

21
pericontusional locations but with less than 0.2% explained variance. Moreover, we
cannot confirm the findings of Belli et al. where [43] increased LP-ratios preceded
increased ICP. Multivariate analyses in our study also suggest that the composite
strongest association is found between MD and ICP in non-pericontusional data,
which is reasonable, as this catheter placement may represent a more global monitor.
Glucose is identified as the most dynamic marker and is least autocorrelated. In
aggregate, we can identify several expected and previously known relations between
CPP/ICP and MD, but conclude that the explained variance is such that MD
perturbations must have other main causes.
A few studies have related MD to GOS. Outcome has earlier been found related to
high MD levels of potassium [44], increased lactate and low glucose [45], persistent
low glucose values [46, 47], increased glutamate [48, 49], but variable for glycerol
[50, 51]. Recently, N-acetylaspartate sampled by MD has also been implicated as a
marker of outcome [52]. That MD is so highly subject-related motivates comparisons
of mean (per subject) MD and GOS. We found that GOS was significantly related to
CPP and ICP, but not to any separate MD marker level (glucose, lactate, pyruvate,
glycerol) or MD ratio. This indicates that the extremely local nature of this
monitoring method may portray information that does not necessarily translate to a
total patient situation.
Subsequently there exists, to our knowledge, no current interpretation of absolute,
relative or trend data of the current common MD variables that can be strongly and
consistently related to explanatory variables, such that it lends to clinical decision-
making, a prerequisite for any monitoring system. In addition, although the distinction
22
of peri and non-pericontusional catheter locations appears to provide different
information, possibly from different metabolic processes, the identification of
pericontusional tissue may be uncertain on CT’s [31]. Using MD as an alert signal
(“towards” normality-good or “away” from normality-bad) [11] appears logical but
must be accompanied by identifiable cause and effect relations by which to steer
interventions. As yet these are to our knowledge lacking for MD.
A potential weakness of the study is that the MD data was not blinded to the
caregivers. During periods when MD displayed possible true ICP/CPP dependencies,
these have been identified and acted on. We do not believe this to be the case, as
doctor responses to pathological MD values vary greatly. Moreover, no standardized
treatment algorithms were suggested during this study or in the literature. In addition,
resistance governs the relation between CPP and flow. This is affected by auto-
regulation, which we have no measure of globally or locally. An additional, weakness
is that we have no direct measure of tissue hypoxia with which to validate the absence
or presence of such in relation to MD values. A further weakness is that we have not
related MD to interventions such as ventricular drainage of CSF, additional increase
of CPP, Pentothal infusions or decompressive craniotomies. Therefore we cannot
exclude that such measures could have an impact on MD in our study.
Conclusions
In this study we have used extensive data mining with linear and non-linear
techniques to establish the relationship between MD and ICP/CPP; parameters that

23
are expected to affect local blood flow and thus to some extent oxygen delivery. Our
results indicate that, despite much data indicating highly perturbed metabolism, MD
shows little correlation to ICP and CPP, within the constraints of these parameters in
the NICU. In addition, ICP or CPP predictions were not meaningfully improved when
catheters were placed in CT-defined pericontusional locations versus non-
pericontusional catheters. In contrast, MD variance is strongly autocorrelated and
variance is highly explained by intra-subject data correlations, indicating that the
dominant processes followed with MD in TBI are long-term, over days. In addition,
short-term changes of MD are seen to exhibit extremely weak associations with
ICP/CPP. For MD to find a clear place in clinical TBI monitoring it is essential that
we establish a better understanding of the causes for long-term metabolic
perturbations, and seek additional dynamic markers of tissue distress [21, 52, 53].
More studies relating local MD and MD changes to other measures of tissue hypoxia
such as local brain tissue oxygenation monitoring and PET are needed, Cerebral
microdialysis remains as yet the only way to repeatedly sample local one-line
extracellular brain chemistry, and is as such an important tool in TBI research.
Competing interests
The authors declare that they have no competing interests
Author contributions
DWN was involved in design of the study, analyzed all data and drafted the
manuscript. BT was involved in data analysis. RMM analyzed data with special
24
involvement in machine learning methods. HN evaluated all CT scans for catheter
placement. AH analyzed data with special involvement in time series analyses. AR
participated in design of the study and manuscript preparation. MW participated in
design of study and helped in manuscript preparation. BMB was in charge of patient
database, design of study and manuscript preparation. EW was responsible for the
project, design of study, and manuscript preparation. All authors read and approved
the final manuscript
Acknowledgements
Funding for this study was provided in part by the regional agreement on medical
training and clinical research (ALF) between Stockholm County Council and the
Karolinska Institutet, funds from the Karolinska Institutet, The Swedish Research
Council, The Swedish Cancer and Traffic Injury Fund (CTRF). In addition, we wish
to thank Gunilla Bornhall Malmborg for her work with the Karolinska Brain Trauma
Databank.

25
References
1. Hillered L, Vespa PM, Hovda DA: Translational neurochemical research in
acute human brain injury: the current status and potential future for
cerebral microdialysis. J Neurotrauma 2005, 22(1):3-41.
2. Tisdall MM, Smith M: Cerebral microdialysis: research technique or
clinical tool. Br J Anaesth 2006, 97(1):18-25.
3. Johnston AJ, Gupta AK: Advanced monitoring in the neurology intensive
care unit: microdialysis. Curr Opin Crit Care 2002, 8(2):121-127.
4. Reinstrup P, Stahl N, Mellergard P, Uski T, Ungerstedt U, Nordstrom CH:
Intracerebral microdialysis in clinical practice: baseline values for
chemical markers during wakefulness, anesthesia, and neurosurgery.
Neurosurgery 2000, 47(3):701-709; discussion 709-710.
5. Hillered L, Persson L: Microdialysis for neurochemical monitoring of the
human brain. Scand Cardiovasc J 2003, 37(1):13-17.
6. Schulz MK, Wang LP, Tange M, Bjerre P: Cerebral microdialysis
monitoring: determination of normal and ischemic cerebral metabolisms
in patients with aneurysmal subarachnoid hemorrhage. J Neurosurg 2000,
93(5):808-814.
7. Stahl N, Mellergard P, Hallstrom A, Ungerstedt U, Nordstrom CH:
Intracerebral microdialysis and bedside biochemical analysis in patients
with fatal traumatic brain lesions. Acta Anaesthesiol Scand 2001,
45(8):977-985.
8. Nordstrom CH, Reinstrup P, Xu W, Gardenfors A, Ungerstedt U: Assessment
of the lower limit for cerebral perfusion pressure in severe head injuries
by bedside monitoring of regional energy metabolism. Anesthesiology
2003, 98(4):809-814.
9. White H, Venkatesh B: Cerebral perfusion pressure in neurotrauma: a
review. Anesth Analg 2008, 107(3):979-988.
10. Peerdeman SM, Girbes AR, Vandertop WP: Cerebral microdialysis as a new
tool for neurometabolic monitoring. Intensive Care Med 2000, 26(6):662-
669.
11. Hillered L, Persson L, Nilsson P, Ronne-Engstrom E, Enblad P: Continuous
monitoring of cerebral metabolism in traumatic brain injury: a focus on
cerebral microdialysis. Curr Opin Crit Care 2006, 12(2):112-118.
12. Enblad P, Frykholm P, Valtysson J, Silander HC, Andersson J, Fasth KJ,
Watanabe Y, Langstrom B, Hillered L, Persson L: Middle cerebral artery
occlusion and reperfusion in primates monitored by microdialysis and
sequential positron emission tomography. Stroke 2001, 32(7):1574-1580.
13. Vespa P, Bergsneider M, Hattori N, Wu HM, Huang SC, Martin NA, Glenn
TC, McArthur DL, Hovda DA: Metabolic crisis without brain ischemia is
common after traumatic brain injury: a combined microdialysis and
positron emission tomography study. J Cereb Blood Flow Metab 2005,
25(6):763-774.
14. Coles JP: Regional ischemia after head injury. Curr Opin Crit Care 2004,
10(2):120-125.

26
15. Lifshitz J, Sullivan PG, Hovda DA, Wieloch T, McIntosh TK: Mitochondrial
damage and dysfunction in traumatic brain injury. Mitochondrion 2004,
4(5-6):705-713.
16. Menon DK, Coles JP, Gupta AK, Fryer TD, Smielewski P, Chatfield DA,
Aigbirhio F, Skepper JN, Minhas PS, Hutchinson PJ et al: Diffusion limited
oxygen delivery following head injury. Crit Care Med 2004, 32(6):1384-
1390.
17. Bellander BM, Cantais E, Enblad P, Hutchinson P, Nordstrom CH, Robertson
C, Sahuquillo J, Smith M, Stocchetti N, Ungerstedt U et al: Consensus
meeting on microdialysis in neurointensive care. Intensive Care Med 2004,
30(12):2166-2169.
18. Engstrom M, Polito A, Reinstrup P, Romner B, Ryding E, Ungerstedt U,
Nordstrom CH: Intracerebral microdialysis in severe brain trauma: the
importance of catheter location. J Neurosurg 2005, 102(3):460-469.
19. Nelson DW, Bellander BM, Maccallum RM, Axelsson J, Alm M, Wallin M,
Weitzberg E, Rudehill A: Cerebral microdialysis of patients with severe
traumatic brain injury exhibits highly individualistic patterns as
visualized by cluster analysis with self-organizing maps. Crit Care Med
2004, 32(12):2428-2436.
20. Vespa PM, O'Phelan K, McArthur D, Miller C, Eliseo M, Hirt D, Glenn T,
Hovda DA: Pericontusional brain tissue exhibits persistent elevation of
lactate/pyruvate ratio independent of cerebral perfusion pressure. Crit
Care Med 2007, 35(4):1153-1160.
21. Brody DL, Magnoni S, Schwetye KE, Spinner ML, Esparza TJ, Stocchetti N,
Zipfel GJ, Holtzman DM: Amyloid-beta dynamics correlate with
neurological status in the injured human brain. Science 2008,
321(5893):1221-1224.
22. Low D, Kuralmani V, Ng SK, Lee KK, Ng I, Ang BT: Prediction of outcome
utilizing both physiological and biochemical parameters in severe head
injury. J Neurotrauma 2009, 26(8):1177-1182.
23. Hutchinson PJ, O'Connell MT, Al-Rawi PG, Maskell LB, Kett-White R,
Gupta AK, Richards HK, Hutchinson DB, Kirkpatrick PJ, Pickard JD:
Clinical cerebral microdialysis: a methodological study. J Neurosurg 2000,
93(1):37-43.
24. Jennett B, Bond M: Assessment of outcome after severe brain damage.
Lancet 1975, 1(7905):480-484.
25. R Development Core Team: R: A Language and Environment for
Statistical Computing. In. Vienna, Austria: R Foundation for Statistical
Computing; 2008.
26. Marion DW, Puccio A, Wisniewski SR, Kochanek P, Dixon CE, Bullian L,
Carlier P: Effect of hyperventilation on extracellular concentrations of
glutamate, lactate, pyruvate, and local cerebral blood flow in patients
with severe traumatic brain injury. Crit Care Med 2002, 30(12):2619-2625.
27. Mazzeo AT, Bullock R: Effect of bacterial meningitis complicating severe
head trauma upon brain microdialysis and cerebral perfusion. Neurocrit
Care 2005, 2(3):282-287.
28. Salci K, Nilsson P, Howells T, Ronne-Engstrom E, Piper I, Contant CF, Jr.,
Enblad P: Intracerebral microdialysis and intracranial compliance
monitoring of patients with traumatic brain injury. J Clin Monit Comput
2006, 20(1):25-31.

27
29. Vespa PM, Miller C, McArthur D, Eliseo M, Etchepare M, Hirt D, Glenn TC,
Martin N, Hovda D: Nonconvulsive electrographic seizures after traumatic
brain injury result in a delayed, prolonged increase in intracranial
pressure and metabolic crisis. Crit Care Med 2007, 35(12):2830-2836.
30. Vespa P, McArthur DL, Alger J, O'Phelan K, Hattori N, Wu C, Glenn T,
Bergsneider M, Martin NA, Hovda DA: Regional heterogeneity of post-
traumatic brain metabolism as studied by microdialysis, magnetic
resonance spectroscopy and positron emission tomography. Brain Pathol
2004, 14(2):210-214.
31. Furuya Y, Hlatky R, Valadka AB, Diaz P, Robertson CS: Comparison of
cerebral blood flow in computed tomographic hypodense areas of the
brain in head-injured patients. Neurosurgery 2003, 52(2):340-345;
discussion 345-346.
32. Coles JP, Cunningham AS, Salvador R, Chatfield DA, Carpenter A, Pickard
JD, Menon DK: Early metabolic characteristics of lesion and nonlesion
tissue after head injury. J Cereb Blood Flow Metab 2009, 29(5):965-975.
33. Signoretti S, Marmarou A, Aygok GA, Fatouros PP, Portella G, Bullock RM:
Assessment of mitochondrial impairment in traumatic brain injury using
high-resolution proton magnetic resonance spectroscopy. J Neurosurg
2008, 108(1):42-52.
34. Bergsneider M, Hovda DA, Shalmon E, Kelly DF, Vespa PM, Martin NA,
Phelps ME, McArthur DL, Caron MJ, Kraus JF et al: Cerebral
hyperglycolysis following severe traumatic brain injury in humans: a
positron emission tomography study. J Neurosurg 1997, 86(2):241-251.
35. Frykholm P, Hillered L, Langstrom B, Persson L, Valtysson J, Enblad P:
Relationship between cerebral blood flow and oxygen metabolism, and
extracellular glucose and lactate concentrations during middle cerebral
artery occlusion and reperfusion: a microdialysis and positron emission
tomography study in nonhuman primates. J Neurosurg 2005, 102(6):1076-
1084.
36. Hutchinson PJ, O'Connell MT, Seal A, Nortje J, Timofeev I, Al-Rawi PG,
Coles JP, Fryer TD, Menon DK, Pickard JD et al: A combined microdialysis
and FDG-PET study of glucose metabolism in head injury. Acta Neurochir
(Wien) 2009, 151(1):51-61; discussion 61.
37. Wu HM, Huang SC, Hattori N, Glenn TC, Vespa PM, Yu CL, Hovda DA,
Phelps ME, Bergsneider M: Selective metabolic reduction in gray matter
acutely following human traumatic brain injury. J Neurotrauma 2004,
21(2):149-161.
38. Kerr ME, Ilyas Kamboh M, Yookyung K, Kraus MF, Puccio AM, DeKosky
ST, Marion DW: Relationship between apoE4 allele and excitatory amino
acid levels after traumatic brain injury. Crit Care Med 2003, 31(9):2371-
2379.
39. Wagner AK, Fabio A, Puccio AM, Hirschberg R, Li W, Zafonte RD, Marion
DW: Gender associations with cerebrospinal fluid glutamate and
lactate/pyruvate levels after severe traumatic brain injury. Crit Care Med
2005, 33(2):407-413.
40. Stahl N, Mellergard P, Hallstrom A, Ungerstedt U, Nordstrom CH:
Intracerebral microdialysis and bedside biochemical analysis in patients
with fatal traumatic brain lesions. Acta Anaesthesiol Scand 2001,
45(8):977-985.

28
41. Nordstrom CH, Reinstrup P, Xu W, Gardenfors A, Ungerstedt U: Assessment
of the lower limit for cerebral perfusion pressure in severe head injuries
by bedside monitoring of regional energy metabolism. Anesthesiology
2003, 98(4):809-814.
42. Johnston AJ, Steiner LA, Coles JP, Chatfield DA, Fryer TD, Smielewski P,
Hutchinson PJ, O'Connell MT, Al-Rawi PG, Aigbirihio FI et al: Effect of
cerebral perfusion pressure augmentation on regional oxygenation and
metabolism after head injury. Crit Care Med 2005, 33(1):189-195;
discussion 255-187.
43. Belli A, Sen J, Petzold A, Russo S, Kitchen N, Smith M: Metabolic failure
precedes intracranial pressure rises in traumatic brain injury: a
microdialysis study. Acta Neurochir (Wien) 2008, 150(5):461-469;
discussion 470.
44. Reinert M, Khaldi A, Zauner A, Doppenberg E, Choi S, Bullock R: High
extracellular potassium and its correlates after severe head injury:
relationship to high intracranial pressure. Neurosurg Focus 2000, 8(1):e10.
45. Goodman JC, Valadka AB, Gopinath SP, Uzura M, Robertson CS:
Extracellular lactate and glucose alterations in the brain after head injury
measured by microdialysis. Crit Care Med 1999, 27(9):1965-1973.
46. Vespa PM, McArthur D, O'Phelan K, Glenn T, Etchepare M, Kelly D,
Bergsneider M, Martin NA, Hovda DA: Persistently low extracellular
glucose correlates with poor outcome 6 months after human traumatic
brain injury despite a lack of increased lactate: a microdialysis study. J
Cereb Blood Flow Metab 2003, 23(7):865-877.
47. Oddo M, Schmidt JM, Carrera E, Badjatia N, Connolly ES, Presciutti M,
Ostapkovich ND, Levine JM, Le Roux P, Mayer SA: Impact of tight
glycemic control on cerebral glucose metabolism after severe brain
injury: a microdialysis study. Crit Care Med 2008, 36(12):3233-3238.
48. Bullock R, Zauner A, Woodward JJ, Myseros J, Choi SC, Ward JD,
Marmarou A, Young HF: Factors affecting excitatory amino acid release
following severe human head injury. J Neurosurg 1998, 89(4):507-518.
49. Chamoun R, Suki D, Gopinath SP, Goodman JC, Robertson C: Role of
extracellular glutamate measured by cerebral microdialysis in severe
traumatic brain injury. J Neurosurg 2010, epublished.
50. Clausen T, Alves OL, Reinert M, Doppenberg E, Zauner A, Bullock R:
Association between elevated brain tissue glycerol levels and poor
outcome following severe traumatic brain injury. J Neurosurg 2005,
103(2):233-238.
51. Peerdeman SM, Girbes AR, Polderman KH, Vandertop WP: Changes in
cerebral interstitial glycerol concentration in head-injured patients;
correlation with secondary events. Intensive Care Med 2003, 29(10):1825-
1828.
52. Belli A, Sen J, Petzold A, Russo S, Kitchen N, Smith M, Tavazzi B, Vagnozzi
R, Signoretti S, Amorini AM et al: Extracellular N-acetylaspartate
depletion in traumatic brain injury. J Neurochem 2006, 96(3):861-869.
53. Marklund N, Blennow K, Zetterberg H, Ronne-Engstrom E, Enblad P,
Hillered L: Monitoring of brain interstitial total tau and beta amyloid
proteins by microdialysis in patients with traumatic brain injury. J
Neurosurg 2009, 110:1127-1237.

29
30
Figure legends
Figure 1) Scatterplots of intracranial pressures (ICP) vs. microdialysis (MD)
markers. Markers are selected as those with possible trends in Table 1. A locally
fitted regression (lowess) is supplied with a shaded standard error. A colored graph
is shown to illustrate how individuals cluster and thus disproportionally affect binned
data. A) from pericontusional located catheters. B) from non-pericontusional located
catheters. Lactate/pyruvate (LP) ratio, lactate/glucose (LG) ratio.
Figure 2) Scatterplots of cerebral perfusion pressures (CPP) vs. microdialysis
(MD) markers. Markers are selected as those with possible trends in Table 2. A
locally fitted regression (lowess) is supplied with a shaded standard error. A colored
graph is shown to illustrate how individuals cluster and thus disproportionally affect
binned data. A) from pericontusional located catheters. The colored lactate/glucose
(LG)-ratio scatterplot indicates that one patient is mainly responsible for the
apparent LG-ratio threshold at low CPPs found in Table 2. The inter-subject
reliability of this MD response can therefore not be judged from this data. B) from
non-pericontusional located catheters. Lactate/pyruvate (LP)-ratio.
Figure 3) Trends in cerebral microdialysis (MD) markers. A locally fitted regression
(lowess) was applied to the MD data, from the time of MD catheter insertion, to
visualize trends and evaluate any potential need for detrending in further analyses.
(90 catheters, 90 patients). Lactate/pyruvate (LP) ratio, lactate/glucose (LG) ratio.

31
Figure 4) Autocorrelations of microdialysis parameters, intracranial pressure (ICP)
and cerebral perfusion pressure (CPP). These are shown for up to 30 hours.
Variables are seen highly autocorrelated. Glucose and CPP are least autocorrelated
and thus the most dynamic variables. Lactate/pyruvate (LP) ratio, lactate/glucose
(LG) ratio. Pericontusional catheters.
Figure 5) Cross-correlations of microdialysis markers (MD) and intracranial
pressure (ICP). Correlations are shown shifted (lag-hours) from -35 + 35 hours
around MD sample time. The lactate/glucose (LG)-ratio is most highly correlated
with ICP, but no clear peak time relation is seen. Lactate/pyruvate (LP) ratio.
Pericontusional catheters.
Figure 6) Cross-correlation of microdialysis (MD) markers and cerebral perfusion
pressure (CPP). Correlations are shown shifted (lag-hours) from -35 + 35 hours
around MD sample time. The lactate/glucose (LG)-ratio is most highly correlated
with CPP, but no clear peak time relation is seen. Lactate/pyruvate (LP) ratio.
Pericontusional catheters.
Figure 7) Effects on cross-correlations of randomly permuting microdialysis (MD)
data, per patient. Cross-correlations of the lactate/glucose (LG)-ratio (lines) vs.
intracranial (ICP) and cerebral perfusion pressures (CPP) are shown as in figure 5
and 6, shifted (lag-hours) from -35 + 35 hours around MD sample time. In addition,
the analyses are performed with randomly permuted (scrambled) MD data per-
subject (dots), including a Monte Carlo derived confidence interval (0.95). The
correlations are as seen little affected by scrambling subject MD hours in relation to

32
their own ICP/CPP. The correlations above (ICP) and below (CPP) that of the per-
subject scrambled data, represents the added information in excess of a subject’s LG-
ratio mean. A control, randomly permuting data from all patients shows as expected
zero correlation.
Figure 8) Glasgow Outcome Scale (GOS) vs. Cerebral Perfusion Pressure (CPP)
and Intracranial Pressure (ICP). Significant differences in means (per subject) were
seen for CPP (p=0.014) and ICP (p=0.021) when compared to GOS levels (one-way
ANOVA). The box-and-whisker plot indicates the median, the lower and upper
quartiles (boxes), and 1.5 * inter-quartile range (whiskers). Outliers (outside
whiskers) are indicated as circles.

33
Pericontusional
ICP mm Hg <15 15-20 20-25 25-30 >30
Glucose mmol/l 2.2 1.6 1.3 1.9 0.9
SD 1.6 1.0 1.3 2.0 1.5
Lactate mmol/l 5.0 5.4 5.7 5.3 6.3
SD 2.7 2.7 2.4 3.0 5.7
Pyruvate µmol/l 176 161 148 209 195
SD 87 82 83 234 221
Glycerol µmol/l 256 260 240 181 284
SD 397 418 273 190 361
LP ratio 34 49 74 62 75
SD 39 84 122 116 158
LG ratio 5.2 8.1 18 24 51
SD 12 17 28 41 65
n samples (64 patients) 3059 1534 816 153 83
Non-pericontusional
ICP mm Hg <15 15-20 20-25 25-30 >30
Glucose mmol/l 2.2 1.5 1.4 1.0 1.9
SD 1.5 1.1 1.2 1.0 2.2
Lactate mmol/l 3.7 4.4 5.2 6.4 5.0
SD 1.8 2.8 2.7 2.9 2.6
Pyruvate µmol/l 162 150 161 170 161
SD 60 64 64 79 110
Glycerol µmol/l 171 337 414 735 1029
SD 207 450 513 763 907
LP ratio 23 31 36 42 36
SD 9.0 24 30 23 20
LG ratio 4.5 8.2 12 16 10
SD 9.8 20 24 11 12
n samples (26 patients) 903 570 220 34 4
Table 1) Pooled microdialysis data (means) and ICP. Data is binned to
levels of intracranial pressure (ICP) including the lactate/pyruvate (LP)
and lactate/glucose (LG) ratios, from 90 catheters (90 patients), in
pericontusional and non-pericontusional locations. SD=standard
deviation

34
Pericontusional
CPP mm Hg <40 40-50 50-60 60-70 70-80 80-90 >90
Glucose mmol/l 0.5 1.0 1.5 1.7 2.0 2.2 2.1
SD 0.7 1.2 1.4 1.4 1.6 1.6 1.4
Lactate mmol/l 11 5.0 5.3 5.3 5.2 5.0 4.8
SD 6.3 3.6 2.6 2.7 2.6 2.5 2.8
Pyruvate µmol/l 253 263 147 166 171 177 178
SD 190 348 85 83 89 85 89
Glycerol µmol/l 307 166 258 240 262 247 315
SD 312 213 303 374 430 377 422
LP ratio 45 55 61 46 45 36 28
SD 20 117 105 78 74 49 14
LG ratio 105 31 15 8.9 5.6 3.6 4.6
SD 70 43 25 19 12 3.4 9.4
n samples (64 patients) 45 67 825 1992 1576 646 388
Non-pericontusional
CPP mm Hg <40 40-50 50-60 60-70 70-80 80-90 >90
Glucose mmol/l 1.2 1.6 2.0 1.7 1.7 2.1 2.6
SD 0.7 0.9 1.3 1.4 1.5 1.6 1.4
Lactate mmol/l 4.8 4.1 3.8 4.1 4.4 4.1 4.3
SD 1.1 1.6 2.1 2.7 2.9 2.2 1.5
Pyruvate µmol/l 162 151 155 155 161 165 188
SD 52 58 73 61 62 58 57
Glycerol µmol/l 309 327 356 294 190 186 144
SD 410 513 462 415 242 213 170
LP ratio 36 28 25 28 29 25 23
SD 25 8.7 14 24 24 9.4 7.1
LG ratio 5.2 4.6 4.5 8.2 9.6 5.6 3.7
SD 2.6 6.4 8.4 19 22 11 5.9
n samples (26 patients) 47 130 372 571 375 142 65
Table 2) Pooled microdialysis data (means) and CPP. Data is binned to levels of cerebral
perfusion pressure (CPP) including the lactate/pyruvate (LP) and lactate/glucose (LG)
ratios, from 90 catheters (90 patients), in pericontusional and non-pericontusional
locations. SD=standard deviation

35
Pericontusional Non-pericontusional
ICP 0.165 + 0.013 0.372 + 0.019 permuted 0.129 + 0.016 0.265 + 0.021
CPP 0.134 + 0.018 -0.143 + 0.020 permuted 0.059 + 0.021 -0.111 + 0.030
Table 3) Correlation coefficients (+ SD) of true vs. predicted intracranial
pressures (ICP), and cerebral perfusion pressures (CPP), from a non-linear
multivariate analysis method (artificial neural networks). Microdialysis
markers (glucose, lactate, pyruvate, glycerol) and ratios (LP-ratio, LG-
ratio) were used as explanatory variables predicting mean ICP/CPP (0-60
minutes prior to MD sample time). In addition, correlations were analyzed
after randomly permuting (scrambling) MD data, per-subject, in relations to
ICP/CPP, to access what remains of correlations if no longer serially
related. Negative correlation (modeling positive prediction) is interpreted
as “even worse”. Standard deviations (SD) represent the variation of ANN
solutions from 200 separate runs with random initializations.

Figure 1
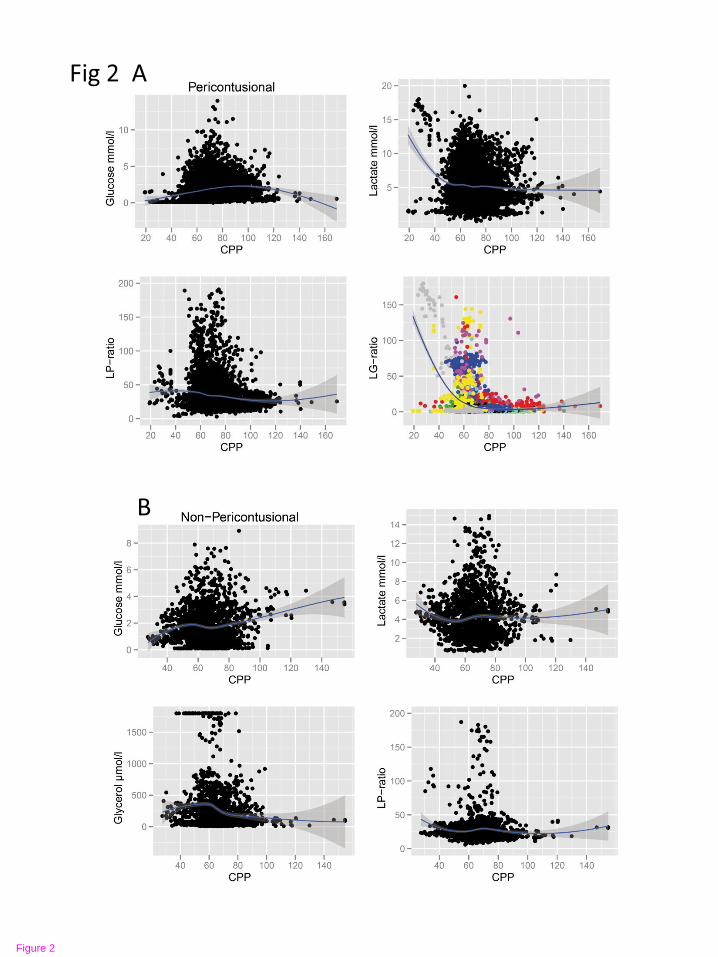
Figure 2

Figure 3

Figure 4

Figure 5

Figure 6

Figure 7

Figure 8