
AARHUS INSTITUTE OF ADVANCED STUDIES AIAS - Aarhus Universitet

Analyseinstitut for Forskning
Knowledge Circulation imbedded in Job Mobility Indicators – Nordic Experience based on register Data
Working papers 2003/2 Analyseinstitut for Forskning ISSN 1399-8897
The Danish Institute for Studies inResearch and Research Policy
Finlandsgade 4DK-8200 Aarhus N
www.afsk.au.dk
Ebbe Krogh Graversen

2

3
Knowledge Circulation imbedded in Job Mobility Indicators – Nordic Experience based on register Data
By
Ebbe Krogh Graversen*)
Paper presented at
NESiS – Statistics Finland Workshop Knowledge stocks and flows in the new information economy
Helsinki, Finland 11-12 March 2003 Abstract: The present paper summarizes the Nordic Experiences found in two projects on Job mobility based on Register Data; one study performed for the Nordic Innovation Fund and another performed for OECD. The studies explore the availability and quality of data and definitions on job mobility as well as it gives comparable mobility rates that – under the correct assumptions - can be benchmarked against other countries. The paper also uses new knowledge developed in a European Network on Mobility – ENMOB. 1. Introduction........................................................................................................... 5
1.1 Job mobility and human resources in firms ....................................................... 6 1.1.1 Identification of knowledge imbedded in human mobility............................ 8
1.2 Register data versus LFS data on job mobility.................................................. 9 1.3 Cross border migration.................................................................................... 10
2. Theoretical points............................................................................................... 10 2.1 Basic empirical assumptions ........................................................................... 12 2.2 Job mobility – an important node for economic growth ................................... 13 2.3 Empirical definition of job mobility – LFS versus register based ..................... 16
3. Empirical findings from the Nordic countries.................................................. 18 3.1 Job mobility rates in the Nordic countries........................................................ 18
3.1.1 Characteristics determining mobility rates ................................................ 22 3.1.2. Business cycle trends.............................................................................. 22
3.2 Sectoral job mobility rates in the Nordic countries .......................................... 26 3.3 Cross border mobility – migration between Denmark and the other Nordic countries................................................................................................................ 28
4. Summing up ........................................................................................................ 29 References .............................................................................................................. 30 Appendix ................................................................................................................. 33
*) Ebbe Krogh Graversen, Research Director. The Danish Institute for Studies in Research and Research Policy. E-mail: [email protected]. Internet: www.afsk.au.dk/Pers_pages/eg.htm

4

5
1. Introduction Indicators that involve human resources serve as an important complement to the traditional R&D statistics concerned with R&D spending and R&D performance. The mobility of highly qualified personnel is an important vehicle for knowledge flows, and indicators of this movement can help to map important linkages in innovation systems. Mobility indicators can further be used to evaluate the effects different policy measures have on areas of education, research, labour markets, regional development, etc. The paper summarizes the Nordic Experiences found in two projects on Job mobility based on Register Data; one study performed for the Nordic Innovation Fund and another performed for OECD. The studies explore the availability and quality of data and definitions on job mobility as well as it gives comparable mobility rates that – under the correct assumptions - can be benchmarked against other countries. The paper also uses new knowledge developed in a European Network on Mobility – ENMOB. The focus of the analysis is to investigate to what extent register data on employees can be utilised to study stocks and flows of personnel in a national innovation systems perspective. The stock of knowledge is a parameter used as an indicator for the potential in a knowledge-based economy and the mobility rates of human resources are assumed to reflect the innovation potential. The registers contain information on each single employee in the four countries in the study (Sweden, Norway, Finland and Denmark), including information regarding their age, education and employment at any particular time. This information is used partly to compare flows of personnel between work places and sectors. In the sectoral breakdown a particular attention has been given to higher education institutions (HEIs) and research institutes. Whereas the analyses of stocks can be said to describe the nodes in the innovation systems, the flow analysis adds to our capability of establishing and describing the links in the systems. By adding in information on knowledge creation, such as information on innovative activity or R&D expenditures, the methodology allows us to track the knowledge flows within the innovation systems. Mobility of highly educated labour is perhaps the most obvious mechanism of knowledge transfer. It should however be noted that, just as there is mobility without any significant knowledge transfer, so do knowledge flows and transfers take place without any prolonged physical mobility of individuals as the channel for the knowledge flow. The rapid development of information and communication technologies has made room for forms of knowledge transfer in which no permanent human mobility (if any) is involved. Knowledge transfer mechanisms other than labour-mobility include co-operations; temporary exchanges and replacements of staff; various types of networks; buyer-supplier relationships; R&D collaborations etc. In light of this, other applicable indicators include co-authorships, co-citations, co-

6
patenting, number of external contacts and co-operations, branch specific common activities etc. Therefore, one should be aware that this approach to map nodes and links in national innovation systems only covers one among many different aspects, which together constitute the system. In particular we will argue for the need to combine labour mobility data with other sources of information regarding knowledge creation and use, such as R&D statistics, innovation surveys and indicators for more embodied knowledge flows like investments in machinery and equipment. Although the experiences with the approach have revealed that this is a feasible and productive line of research to expand our knowledge about innovation systems, there are indeed methodological problems involved – even when comparing countries with many similarities such as the Nordic countries. The problems mainly relate to differences in industrial structures and education systems, resulting in problems with coding and updating of registers. Despite these problems we are confident, that we have presented a reasonable comparative picture of the Nordic countries. At an overall level we find the same main structures in all four countries, but naturally there are also clear differences on a more detailed level.
1.1 Job mobility and human resources in firms Indicators that measure human innovation resources are an important addition to traditional R&D-statistics on R&D-costs and R&D performed. Job mobility among highly educated employees or among employees with a large innovative potential is a vital part of the less visible knowledge circulation between innovative work places, private as well as public firms and research institutions.1 Indicators on the knowledge exchange and the knowledge stock among the work places map the innovation and research based links in the national innovation system; links that correspondingly can be used to valuate the effect of R&D policies or to prioritise the R&D policy by areas such as education, R&D, R&D absorption capacity, R&D cooperation, productivity, competitiveness and regional as well as national growth potential. Recognizing, that the industrial economy more and more is replaced by the knowledge economy with life-long learning, makes the management of the individual specific knowledge to a fundamental functional link in a community where possession or admittance to knowledge has become a parameter for survival among firms as well as public research institutions. Knowledge is created on several levels in the community. The entire formal education system is the first measurable step in human’s acquisition of knowledge.
1 In the following firm is used for as a synonym for private as well as public work places and research institutions unless other things stated.

7
This knowledge is typically formal meaning that it is visible, reproducible, sharable, but still basic for the human’s possibilities to absorb and develop new knowledge in the second step of their acquisition of knowledge; namely the informal or tacit personal and person specific knowledge. The level of formal education is typically highly correlated with the ability to acquire tacit knowledge, i.e. how effective, creative and innovative the humans are. Employees at work places acquire tacit firm specific knowledge through their experience, work and innovation on the work place. It is the innovation related part of the tacit knowledge that is especially individual specific, since it typically neither is visible nor directly shareable and since it is difficult or costly to reproduce by others. On the firm level it is important to know what knowledge and other competences the firm have at disposal through its employees. A full mapping of the existing knowledge stock gives the firms a management tool to provide, protect or replace lost knowledge in an effective, efficient and cost minimizing way. Many firms use large resources to identify and render visible what knowledge they have at disposal. Specific accounts of the existing formal as well as tacit knowledge can also help the firms to target their need for procurement of external knowledge in connection with its innovation activities. The firm can choose to develop new products or new knowledge through R&D or through collecting and formalising firm specific experience and knowledge among its employees. It can also choose to buy or in other ways getting access to the missing exact knowledge from an external source. The external knowledge can for example be procured through hires of new employees, cooperation and networks, consultants, temporary exchange of employees, education etc. No matter which form the external knowledge source has, the new knowledge should correspondingly be collected internally and transformed to formal firm specific knowledge. Hence, other indicators on knowledge circulation in and between firms than just job mobility can be all form for indicators that measure any of the activities mentioned. This paper analyses only results for the permanent physical mobility of employees in such a way that they reasonable well can be identified in an empirical context. Therefore, the revealed knowledge circulation is a conservative minimum measure for the amount of knowledge circulation, exchange and accumulation in the firms. Mobility indicators shall be hold together with other indicators on knowledge generation and use of knowledge such as R&D and innovation statistics, investments in ICT, machines or equipments, as well as regional or national labour market barriers and other structural conditions before a sufficient set of indicators usable for policy recommendations can be obtained.

8
Nonetheless has knowledge links as part of the national innovation systems been intensely analysed in the last decade by OECD, EU, national organisations and others in recognizing that knowledge on knowledge links is an important part in the understanding of the shift from industrial economies to knowledge economies and learning economies. A long row of analysis’ that builds on the assumption that links between organisations influence the innovation ability is published in the recent years; see for example OECD (1999a, 1999b, 2000, 2001a, 2001b, 2002), Scott et al (2001), and Graversen et al (2002) among others.
1.1.1 Identification of knowledge imbedded in human mobility Especially in the private sector is it difficult to precisely identify the knowledge imbedded in the mobile employees. People typically have several work tasks like, production, administration or planning at the same time. There exists no stringent definition to identify the knowledge imbedded in a person that shifts job. The number of certain kinds of employees at a work place can be summarised in full time equivalents but the same is much more difficult regarding job mobility. How shall a job shift count in a statistic if the mobile employee is not full time employed? Similarly, a mobile employee with long work specific tenure will be more valuable for the firm than a mobile employee with less tenure or experience. In the empirical literature, these groups are characterized as stable workers and nomads, c.f. Section 3.1. An example: The term researchers in studies of researcher mobility covers mostly employees that perform research in a significant part of their work time; more precisely is it difficult to measure it the researchers. This naturally also influences the degree of comparability of the researcher mobility indicators over sectors, time, geographical areas etc. According to the R&D Statistic from The Danish Institute for Studies in Research and Research Policy (AFSK 2001a, 2001b), the private sector has 28688 R&D-employees performing 21022 full time equivalent R&D man-years. Therefore the average R&D time per R&D-employee is in average 0.73, giving that the R&D personnel do other things than R&D in 27 percent of their work time. The corresponding numbers for the public sector research institutions are 25289 R&D-employees and 14629 full time equivalent R&D man-years, which only give a ratio between R&D-employees and R&D time on 0.58. Public employees R&D personnel uses 42 percent of their work time on other things than R&D. Hence R&D personnel in the private firms perform research in a larger fraction of their work time than R&D personnel in the public sector research institutions.

9
1.2 Register data versus LFS data on job mobility Country comparable studies on job mobility are often done on Eurostat Labour Force Survey, LFS, data with its common structure and definitions, see for example Laafia and Stimpson (2001). Numbers from these studies give variating job mobility rates around 10 percent in the most countries that calculate and publish these. The common definition on data as well as job mobility does not work perfectly in practice according to Laafia and Stimpson (2001). Furthermore, the specialised subsamples in the LFS are typically to small for small countries like Denmark etc. to be used to calculate valid and trustful job mobility rates for various subsamples like highly educated employees in R&D intensive sectors. In the Danish LFS is the survey sample approximately 10000 employed persons, cf. Graversen (2002). Alternatively, Denmark and the other Nordic countries2, plus a few other countries like Belgium and Holland have build register databases on the entire or parts of the population. These registers give opposite to the relatively small surveys in the LFS possibilities for analyses of even very narrowly defined subsamples of the population, since there are no sample errors in the data on the entire population. The sample is the entire population, so even subgroups on for example 10 persons give exact mobility rates without sample errors. Furthermore, the data is collected independent of the population, such that there is no individual determined non-response or missing information. The Danish studies as well as studies from the other Nordic countries based on register data find considerably higher job mobility rates, 20-35 percent, than found on the basis of Eurostat LFS data. Register data has the disadvantage that it just like the LFS data is collected for other purposes than mobility studies. A long list of emotional factors that is included in the LFS cannot be analysed in the register data. In relation to researcher mobility is the missing emotional data especially relevant for analyses of reasons for job shifts, i.e. whether it is caused by quitting, firing, carrier jumps or other reasons i connection to transnational mobility where there is a high focus on barriers for mobility. In the registers is it not possible to distinguish between immigrating researchers from other immigrants because the registers only have information collected in other procedures; for example in the national population register where everybody has to be registered. The information here includes typically age, gender, and country of origin, but not educational level, work experience, job function in new job etc. which would be more interesting in an analysis of researcher, knowledge or competence mobility.
2 Iceland has not in year 2000 a fully deployed register based database.

10
1.3 Cross border migration International mobility, especially researcher mobility, has been brought to top actuality by the recommendations and wishes from the European Commission on researcher mobility for and in the development of the European research area, ERA, cf. European Commission (2000a, 2000b). The Commissions wishes are mostly pointing at an optimisation of the transnational researcher mobility in EU and between EU and the most usual cooperating countries like the EAC-countries, Eastern Europe and US. The international researcher mobility is assumed to be a mirror of the national, just with considerably larger mobility barriers. The Commission writes in their paper on the creation of the European research area that: ”More use should be made....[of] mobility as an instrument of information and technology transfer. The mobility of researchers between the academic world and the business world, in different forms that this might take, should also be readily encouraged and developed”. The communiqué caused the creation of a ”high-level Expert Group” which should come with suggestions to improve the researcher mobility in EU. Their final report points at ways in which researcher mobility can be made more efficient in the EU countries, cf. European Commission (2001).
2. Theoretical points In a labour market perspective is the mobility a simple match problem. The job mobility is determined by job supply and demand in combination with a row of barriers like for example family and friendship relations, ownership of real estate, geographical (country) borders, among others. In this perspective the individuals act rational; they shift job when it is optimal and possible. They optimize their situation given the barriers they see as binding restrictions. The job shift can be caused by different reasons; better work conditions other places, worse conditions at the actual work place inclusive firing or the wish to test whether new work environments are better. The rationality for the job shift lies at the employees alone and it is a complex function of the above-mentioned factors inclusive barriers met by the employee as well as by the employer. In an industry economic perspective or in a national and international macro perspective the quality, speed, content and reason for the job mobility determines whether the job mobility is good or bad for the firm or the community. The employee can in this perspective act against the interest of the community or the firm in a way where the optimal and rational decision for the employee is opposite the optimal solution for the firm or the community. This potential divergence between interests on the micro, meso and macro level can result in large negative community externalities and justifies that the community through different incentives reduces these negative externalities or even changes them to positive externalities. However, the laws and
11
rules in the community are often creating new barriers that give other negative externalities. The public instruments useable are for example tax deductions involved in job mobility actions to the firm as well as the employee, indirect subsidies through the work places in the public sectors, laws and rules that corrects negative externalities in the bureaucracy of the public sector etc. Among the negative laws influencing the job mobility is for example refuge laws that prevent easy mobility of demanded labour into and out of Denmark or when high marginal tax rates reduces the attractiveness of Danish firms and the competitiveness of foreign as well as Danish employees. In a knowledge perspective the visibility and amount of knowledge imbedded in the employees are of high importance. Compared with earlier mass production it becomes very important in the knowledge economy to know which competences an employee has, especially if the firm’s production depends on the employee’s innovative capacity. In such a set up, the employment and up-qualification of the employee becomes an investment for the firm and the employee rather than an expense. In an investment related argumentation, the pay-off from the investment in form of increased competences is an important decision parameter. In order to be able to measure this and determine whether an investment shall be executed or not it is necessary for the firm to have a full track and statement of the competences. A knowledge account and competence catalogues are examples on such statements. Through these statements it is possible for the firm to manage, reward and develop the competences it needs or already have; for example through a higher payment to core competences, innovative or creative employees etc. Hence, active management to prevent or control the job mobility patterns in the firm becomes a vital part of the areas for management in the firms. No matter which economic modeling that is used in the analysis of job mobility, it is impossible to judge what the optimal mobility rate actually is. Theoretical the job mobility have to large enough to secure a well functioning and flexible labour market, but not so large that it prevent the firms to secure a continuous and efficient running. It is up to the empirical analysis to show what the typical or benchmarking mobility rate actually is, and to find which factors that determines the fluctuations in mobility rates over time, and between sectors or countries. In reality, the job mobility rate is determined by components from all the theoretical contributions to models of job mobility, such that job mobility depends more than anything else of time and place. The present paper gives a number of Danish and Nordic empirical results on job mobility rates that can be used to set up some benchmarks on the, may be not optimal, but actual mobility on certain periods, places and populations. These benchmarks can then be used as guidelines for policy that shall reduce negative externalities in the specific areas of interest.

12
2.1 Basic empirical assumptions A basic assumption underlying our work is that mobility of personnel between organisations or institutions indicates that there is also a knowledge-transfer taking place. This is of course true to a varying degree. It depends – among other things - upon each person’s ability and opportunity to learn from the organisation where he or she is employed. We expect that this depend upon the length of the employment, i.e. tenure, and the education of the person – variables that are available for the analysis. In addition the exact position or occupation in the organisation will influence the learning that is taking place, c.f. Section 2.2. Several choices have been made regarding the level of detail, population, years studied, and what constitutes labour mobility. First, by 'employed' we mean an individual who is employed at least one of the years studied in the present paper. Second, we have defined mobility as a change of workplace (establishment), c.f. Section 2.3. We could have chosen other bases for mobility, such as change of organisation, geographical change etc., c.f. Langberg and Graversen (2001), but have decided that a change of work establishment is the most solid and comparable mobility indicator available. An added criterion could be used, such as change of sector, but we argue that such a level of detail in the sector classification eventually would influence the mobility rates too much. Third, we have striven to arrive at a sectoral breakdown that reflects the characteristics of each country’s national innovation system (NIS). For practical reasons we have chosen to focus on the most important NIS sectors, the higher education institutes (HEI) and the R&D institutes (including the industrial research institutes). These two sectors also show some significant differences between the four countries, c.f. Section 3.2. One of the principal interests in mobility data is that human resources are supposed to represent knowledge bases and flows of knowledge within economies or innovation systems. There exist many forms of knowledge, such as formal knowledge, skills, competencies, codified knowledge, tacit knowledge, etc., c.f. Table 1 in Section 2.2. The indicator denoting type of knowledge in these studies is the level and field of formal education. The use of formal education as an indicator has clear advantages as a knowledge-indicator on a large scale, since indicators of other forms of knowledge would demand very elaborate means of data collection and collation. Although highest achieved formal education has its clear limitations as a knowledge indicator, it is probably the best we have so far. In the case of indicators involving the highly educated (including those with research credentials) the degree of specialisation is so high that formal knowledge is probably a more than acceptable indicator of knowledge. It is much more difficult to assess the impact and extent of knowledge transfer associated with tenure and experience. But one could use a

13
combined indicator of education and characteristics of a person’s occupational career. Strict compatibility of data from different countries is very difficult to achieve. Whatever indicators of flows being studied, they must naturally also be related to stock of the same or broader categories, as well as population sizes.
2.2 Job mobility – an important node for economic growth The original growth model by Solow operates with capital and labour as the only input factors. These two factors are, however, only able to explain parts of the empirical figures on growth. The Solow model claims that the growth rate in the long run equalizes between countries. This is not empirically evident since countries are observed with different growth rates, also in the long run. Hence, there is a residual, which cannot directly be explained in these models. This residual, called the total factor productivity, TFP, is necessary to augment the output of the two inputs to equal the observed growth levels. The TFP has been explored in various studies and one of the explanations is among others that the TFP reveals differences in technical progress, in knowledge levels, and in innovation abilities. So, knowledge and knowledge diffusion may create the environment where higher economic growth is possible with the same input of capital and labour. The latter argument is defended in Mankiw et al (1992) in a study that supports an extended version of Solows model, where physical capital is separated from knowledge capital. However, the empirical evidence in the study seems to depend highly on the included countries. A smaller study on OECD countries does not reveal the same support. The newer endogenous growth models developed in the 1980s and 1990s have all tried to decompose and explain the TFP part of the neoclassic growth model by Solow. Usually the empirical outcome is a model which in practice, although not theoretically is an augmented version of the original Solow model. Romer (1986) argues that increasing knowledge imbedded in humans, i.e. human capital, increases the production efficiency, and that the consequential learning increases the knowledge accumulation in the economy. Romer (1990) further develops these arguments in a policy recommendation that the quality of the knowledge stock determines the economic growth, not the population size, i.e. the stock of humans. In his model he finds that investment in knowledge is a deliberate decision made by the firms (and the government) in order to improve productivity (and efficiency) in the economy. The investment decision is driven by an equilibrium with monopolistic competition in the markets. Hence, technological improvements (the TFP factor) are driven by a usually higher than normal profit argument, which can be maintained at least in the short run. Lundvall (1992) argues that the channels, in which the knowledge is spread, are as important as the knowledge creation itself. Hence, networks, institutional structures, new candidates as knowledge carriers that diffuses the newest research knowledge, so all parts of the economy, in an efficient way, can

14
handle this and become innovatively up to date. This also means that a country or a firm/university can loose growth if some research areas are totally abandoned, since nobody in this case can use or implement innovation results from other sources, c.f. Salter and Martin (2001). Hence, a diffusion of employees through job mobility to all sectors in the economy is preferable. The knowledge and innovation created at publicly owned universities and research institutes contribute to the diffusion of highly educated potentially innovative workers to the economy. The social value of the candidate production and mobility of researchers are usually far above the corresponding private value, c.f. Salter and Martin (2001). Salter and Martin also find that there are geographical effects, so firms situated near research institutes or universities have large benefits from this, and that one of the most important channels for knowledge diffusion is through candidates from universities. From a community point of view, an effective circulation of the publicly providing knowledge increase is important for the economic growth in the economy. Externalities in the private investments in new knowledge causes the social returns from investment in knowledge to be higher than the private returns to the firms or individuals, c.f. Firth and Mellor (2000). Hence, there are cases where the public sector, i.e. public universities and research institutions, may invest in profitable knowledge improvements that would not be performed otherwise. Afterwards, efficient knowledge infrastructures where HRST employees move between jobs are of vital importance in order to create the social return that justifies a public investment. A considerable mobility rate is preferable to diffuse and collect new knowledge. However, a too high mobility is not preferable, because it takes time to exchange and obtain new knowledge, i.e. the community return from job mobility among workers is a bell shaped function of the mobility rates. A too low and a too high mobility reduce the community return. Unfortunately, there is no clear evidence showing at which mobility rate the community return is maximized. From a firm, community or country view the knowledge in an organisation can be transferred as shown in Figure 1. The carriers of the knowledge transferred in this set up may be employees that shift between jobs. The process with knowledge diffusion is dynamic and continues over time such that the knowledge level in the organisation increases if the knowledge exchange works optimal, i.e. the knowledge gain exceeds the knowledge loss or natural destruction. The circle in Figure 1 illustrates the third dimension, the economic growth that increases by every turn of knowledge exchange in the firm or community.

15
Figure 1. The exchange of knowledge – the knowledge spiral
The knowledge transferred in the organisation in figure 1 can be imbedded in the human resources of each employee. Even though the carrier is a physical employee, the media for the transfer of knowledge does not have to be a physical job move. As table 1 illustrates from a case on science-industry relations, job mobility is just one out of many ways to exchange knowledge in a firm, community or country. However, job mobility is one of a few media for knowledge exchange that both results in formal, tacit and personal knowledge exchange.

16
Table 1. Types of knowledge interactions between industry and knowledge institutions
2.3 Empirical definition of job mobility – LFS versus register based In an empirical analysis of job mobility the most often used definition on mobility is the following job-to-job. However, also out-of-job as well as into-job mobility can be measured as shown in table 2. The ‘out of job’ mobility rate can only be calculated in one way as the share of
employees in year t who are not employed in year t+1 divided by the total stock of employees in year t (column three in Table 2) The ‘job-to-job’ outflow mobility rate can be calculated in two ways as the share
of employees employed in both years but at another employment place in year t+1 divide by the total stock of employees in year t (column three in Table 2) the total stock of employees employed in both years (column four in Table 2)
Similarly, the inflow mobility rate can be calculated in two ways: The ‘into job’ mobility rate can only be calculated in one way as the share of
employees in year t+1 who are not employed in the previous year t divided by the total stock of employees in year t+1 (column seven in Table 2)

17
The ‘job-to-job’ inflow mobility rate can be calculated in two ways as the share of employees employed in both years but at another employment place in year t divide by the total stock of employees in year t+1 (column seven in Table 2) the total stock of employees employed in both years (column six in Table 2)
Only the job-to-job mobility rates with employment stock of employees employed both years produce equal inflow and outflow mobility rates, see column four and six. Mobility rates calculated this way are significantly higher than the job-to-job mobility rates presented with the total employment stock used as divisor, see column four and seven. Table 2. Inflow and outflow job mobility rates from Danish LFS data, example
from 4th quarter 1998 to 4th quarter 1999. Weighted to population figures. Base 1999
State of employment Persons(1999)
Outflow Stock or flow type Inflow
Millions ----- % ----- ----- % -----
Employed in 1998 2712 100.0 Stock in 1998
Outgoing employees 289 10.7 ‘Out of job’ mobility
Employed in both years 2422 100.0 Common stock 100.0 Employed same place 2136 78.8 88.2 Stable workers 88.2 79.5
Changed employment 286 10.5 11.8 ‘Job to job’ mobility 11.8 10.6
Employed in 1999 2688 Stock in 1999 100.0Employees coming from
Unemployment 43 ‘Into job’ mobility 1.6
Schooling 184 ‘Into job’ mobility 6.8
Other reasons for no job 38 ‘Into job’ mobility 1.4Source: Statistics Denmark: Statistiske Efterretninger. Arbejdsmarked. 2000:14. Table 2 shows mobility rates calculated from LFS data. For comparison, similar mobility rates have been calculated on the basis of register data in Table 3. The time period diverges a few years, but other studies have shown a remarkably stable mobility rate pattern in Denmark, see also Figure 3, so the figures are judge to be almost directly comparable. The interesting general feature is that the stock of employees is 5-10 percent smaller in the registers compared to the LFS in Table 2 compared to table 3. Similar differences are observed for the outgoing and less clear

18
for the incoming flow of employees as well as the stock of stable workers. The opposite is the case concerning mobile workers employed both years. According to the registers this number is more than 20 (1996) or 30 (1995) percent higher than the LFS stock of job-to-job mobile workers. This seems to be the major reason for the 50 percent higher mobility rates found in register data compared to LFS data. Again the conclusion may be that there exists a lack of memory or understanding among the respondents of the questions in the LFS questionnaire. At least, there exists a difference so clear that it influences any comparison significantly. Table 3. Inflow and outflow job mobility rates from Danish IDA database,
example from 1995 (outflow) and 1996 (inflow). Weighted population figures. Base 1995 and 1996 respectively
State of employment Persons (1995)
Outflow Stock or flow
type Inflow
Persons(1996)
Millions ----- % ----- ----- % ----- Millions
Employed in 1995 2472 100.0 Stock in 1995
Outgoing employees 241 9.7‘Out of job’
mobility
Employed in both years 2231 100.0 Common stock 100.0 2269
Employed same place
1851 74.9 83.0 Stable workers 84.6 76.0 1920
Changed work place
380 15.4 17.0‘Job to job’
mobility 15.4 13.8 349
Employed in 1996 Stock in 1996 100.0 2526Employees coming from
‘Into job’ mobility
10.2 257
Source: Graversen 1999. Own calculations. Based on a sample of all highly educated and 1 percent of the remaining population aged 20-65. Hence, the population weighted common stock deviates between 1995 and 1996.
3. Empirical findings from the Nordic countries The following section show selected results from the studies on job mobility in the Nordic countries. The figures presented are based on register data that is largely comparable between the countries.
3.1 Job mobility rates in the Nordic countries As a start, the job-to-job and out-of-job mobility rates are shown for the Nordic countries, Sweden, Norway, Finland and Denmark in Table 4. Naturally, the out-of-

19
job mobility rate is higher than the job-to-job mobility rate. There is a weak tendency that the job-to-job mobility rate is lower for all employees than for higher educated employees. The opposite seems to be the case with the out-of-job mobility rates, which indicates that it is cheaper to replace a lower educated employees, permanently or periodically. Hence, the higher educated employees seem to have a slightly better and stable job career. The mobility rates in the four countries are remarkably equals, a fact that is elaborated further below. Table 4. Mobility rates for all employees and for employees with higher
education by scientific field and country. Percent of employees
Type of employees Type of
mobility rate Sweden1 Norway Finland Denmark2
Out of job 24.0 20.1 23.3 27.2 All employees
Job to job 16.2 12.4 11.5 18.2 Out of job 23.4 18.6 23.9 21.8 All higher educated
employees Job to job 19.5 12.8 17.9 16.4 Out of job 22.4 19.9 23.3 22.2 Natural sciences and
engineering Job to job 19.0 14.6 17.8 17.4 Out of job 25.1 21.4 26.7 22.9
Medical fields of science Job to job 21.9 14.7 21.2 16.8 Out of job 23.3 17.4 23.6 21.2 Social sciences,
humanities and others Job to job 19.2 11.7 17.4 15.8 Out of job type of mobility: Including persons leaving active work force. Job to job type of mobility: Excluding those leaving active work force. 1 For Sweden only persons working in establishments with valid NACE codes both years are included. 2 The Danish numbers are based on a full sample of higher educated individuals and a random sample on one percent of the remaining population. First, the composition of highly educated employees is shown in Figure 2. The differences in the composition of employees are one among many explanatories behind the minor differences in mobility rates between the countries observed in table 4. The differences in the stock of highly educated employees in the three educational areas illustrates the potential educational structural differences between the countries; a structural difference that is usually not recognised.

20
Figure 2. Stock of highly educated employees (ISCED=6+) by disciplines and country, 1995. Percent
0%
10%
20%
30%
40%
50%
60%
70%
80%
90%
100%
Sweden Norway Finland Denmark
Perc
ent
Social sciences,humanities andother disciplines
Medical and healthrelated disciplines
Natural sciencesand engineering
The job-to-job mobility rates in the four Nordic countries over a decade are shown in Figure 3. Even though there are some level differences the time trend seems to be common. This is further elaborated in Section 3.1.2, where the mobility rate level is shown to be business cycle dependent. Figure 3 shows that the use of register data to determine mobility rates seems to be valid in country comparable studies. Figure 3. The job-to-job inflow mobility rates by country 1988-98; pct.
11
13
15
17
19
21
23
25
1988 1989 1990 1991 1992 1993 1994 1995 1996 1997 1998Year
Mob
ility
rate
, per
cent
Denmark Finland Norway Sweden
Note: Swedish data is only available for 1991 and onwards. The volatility in the Norwegian data after 1994 is caused by a change of establishment definition, which influences the mobility rates.

21
Figure 4 illustrate that the stability in the employment in the labour force is twofold. One large fraction is very seldom changing jobs and another fraction is more like nomads. A nomad is identified as a person shifting job three years in a row. Figure 4. Permanent and mobile employees by type of mobility. Denmark 1994-
1996. Percent
0%
10%
20%
30%
40%
50%
60%
70%
80%
90%
100%
1994 1995 1996
Not employed previous year, no otherchange
Not employed previous year, newemployer next year
Not employed previous year, notemployed following year
New employer since previous year,otherwise stable
New employer since previous year,new employer also next year
New employer next year, otherwisestable
New employer since previous year,not employed next year
Not employed following year, no otherchange
Employees without job shift
Outside active labour force
The same fact is illustrated in Figure 5 where the employees are separated in stable and new employees. The new employees have a considerable higher probability to leave again during the next year. Figure 5. Mobility rates for “stable employees” and “new employees” by
country. Percent
05
101520253035404550
Norway 1993 Finland 1994 Denmark 1995Shar
e of
per
sons
leav
ing.
Per
cent
Stable workforce from previous year New employees from previous year
Note: “Stable employees” has the same employer previous year while “new employees” does not have the same employer previous year.

22
3.1.1 Characteristics determining mobility rates The analysis’ of determinant factors for job mobility has resulted in a few stylised facts that seems to both obvious and statistically significant. The results are summarised in table 5. The results from a country specific regression on the probability to be job mobile are given in the Appendix. As table 5 shows, job mobility is highly dependent of age, education and workplace size. Table 5. Determinant factors for inflow job-to-job mobility rates for the Nordic
countries Background characteristics Tendency and trends in the ordering and cyclicality
Sector
• The sector effect is not clear. The HEI sector seems to have low mobility rates, the ICT sector seems to have high rates. In between, it appears to matter for the mobility rates whether the sectors are shrinking (agriculture) or expanding (trade).
Age • The age effect is dominant. In all the Nordic countries, the mobility
rate decreases with age.
Education • The educational effect is clear. The mobility rate increases as the educational level rises.
Size of workplace • Workplace size clearly matters. The mobility rate decreases as the
size of the workplace increases.
3.1.2. Business cycle trends From economic theory on supply and demand for labour it is expected that there is a procyclical correlation between the mobility rate level and the business cycle as shown in table 6. Table 6. Expectations to cyclicality of in- and outflow mobility rates
Type of business cycle
Boom Downturn Type of cyclicality Firm (Demand side) Fires Hires Total employment
Decrease Increase Increase
Increase Decrease Decrease
Countercyclical
Procyclical Procyclical
Employee (Supply side) Separations Job offers Total employment
Increase Increase Increase
Decrease Decrease Decrease
Procyclical Procyclical Procyclical
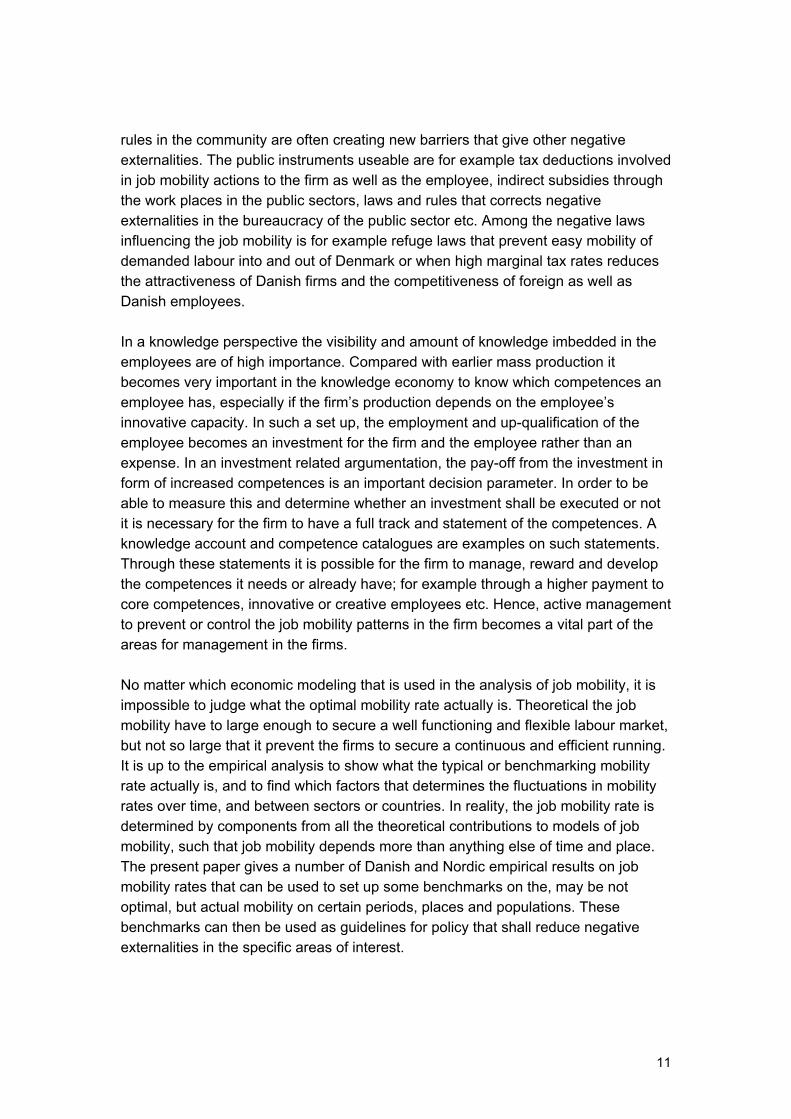
When the mobility rates from each of the four Nordic countries are indexed and set together a common trend as shown in figure 6 is revealed.
23
Figure 6. The indexed job-to-job inflow mobility rates by country 1988-98, (1991=100)
80
90
100
110
120
130
140
150
1988 1989 1990 1991 1992 1993 1994 1995 1996 1997 1998Year
Inde
x fo
r mob
ility
rate
s
Denmark Finland Norway Sweden Trend
Note: The trend rate is fitted by a second order polynomial trend based on a non-weighted average of the national mobility rates. Swedish data is only available for 1991 and onwards. The volatility in the Norwegian data after 1994 is caused by a change of establishment definition, which influences the mobility rate. In the regression on the probability of mobility in the Nordic countries shown in the appendix, two measures are used to approximate the business cycle, the unemployment rate and the GDP real growth rate. A negative coefficient to the unemployment rate or a positive coefficient to the GDP real growth rate confirms the positive correlation, the procyclicality. This is generally the case. In another analysis, the simple correlation between the mobility rates and the business cycle approximate is found on worker inflow rates as well as on worker outflow rates, see table 7. In general the procyclicality with the business cycle is confirmed. However there seems to be a lead on one to two years between the mobility rate pattern and the unemployment rate and a lack on two to three years between the mobility rate pattern and the GDP real growth rate, see figure 7 and 8. Hence, as a predictor the GDP real growth rate seems to be the best predictor for level changes in the mobility rates two years ahead.

24
Table 7. Cyclicality of job-to-job mobility rates in the Nordic countries. Correlation coefficients in parentheses Business cycle indicator Worker inflow Worker outflow
Unemployment rate
Denmark Pro-cyclical (-0.27) Pro-cyclical (-0.27)
Finland Pro-cyclical (-0.86) Pro-cyclical (-0.66)
Norway Pro-cyclical (-0.62) Pro-cyclical (-0.84)
Sweden Pro-cyclical (-0.32) Pro-cyclical (-0.59)
GDP real growth rate Denmark Pro-cyclical (0.01) Pro-cyclical (0.47)
Finland Pro-cyclical (0.50) Pro-cyclical (0.88)
Norway Counter-cyclical (-0.44) Pro-cyclical (0.88)
Sweden Pro-cyclical (0.64) Pro-cyclical (0.49) Note: The Spearman rank correlation coefficient is used in this section since the non-parametric rank correlation best fit the conditions required for inference studies on the correlation between two measures with no clear distributional assumptions. However, due to the short time period of data, ten years, it is difficult to find significant rank correlations from the empirical data. A 10% significance level requires a correlation coefficient of at least 0.56. Figure 7. Unemployment rate by country, 1988-98; pct.
1
4
7
10
13
16
19
22
1988 1989 1990 1991 1992 1993 1994 1995 1996 1997 1998Year
Une
mpl
oym
ent r
ate,
per
cent
Denmark Finland Norway Sweden Trend
Note: The trend is fitted by a second order polynomial trend based on a non-weighted average of the national unemployment rates.

25
Figure 8. GDP real growth rate by country, 1988-98; pct.
-6
-4
-2
0
2
4
6
1988 1989 1990 1991 1992 1993 1994 1995 1996 1997 1998Year
GD
P re
al g
row
th ra
te, p
erce
nt
Denmark Finland Iceland Norway Sweden Trend
Note: The trend rate is fitted by a second order polynomial trend based on a non-weighted average of the national GDP real growth rates. Table 8 sums the result on procyclicality in relation to the impact of determinant factors for job mobility. This is a way to illustrate these factors’ impact on mobility at various levels in the business cycles in the countries. Table 8. Trends in inflow job-to-job mobility rates by background
characteristics for the Nordic countries Background characteristics Tendency and trends in the ordering and cyclicality
Sector • The business cycle matters, most volatile for the younger employees, least volatile for the HEI and the ICT sectors.
Age • The business cycle matters for all age groups, although
apparently it is most volatile for the younger age group.
Education • The business cycle matters for all groups, although apparently it is most volatile for the low educated groups.
Size of workplace • A business cycle effect is seen for all firm sizes, but is
apparently most volatile for small workplaces.

26
3.2 Sectoral job mobility rates in the Nordic countries Sectoral mobility is highly interesting from a knowledge diffusion point of view. Instead of showing sectoral mobility rates for the entire economy, only mobility into and out of the knowledge producing sectors are given in tables 9 and 10. Rates and shares are given for the four Nordic countries and the figures are directly comparable. Table 9 shows that the R&D institutes generally recruit a larger share from the private production sector and from the product service sector than the HEI sector. The opposite holds for human service sector. However, the largest differences among the countries are found in the share of internal recruitment (bold figures in Tables 9 and 10). R&D institutes in Sweden recruit mainly from the HEI sector; those in Finland primarily recruit internally. The HEI sector recruits in general a small share from R&D institutes and 20–30 percent internally. The HEI sector recruits a larger share from the human service sector, especially in Sweden and Norway. Table 9. Into-job mobility of highly educated employees by delivering sectors.
Shares and persons. Mobility shares sum horizontally to 100 percent
Delivering sector ⇒
⇓ Receiving sector R&D
inst
itute
s
Hig
her e
duca
tion
inst
itutio
ns
Priv
ate
prod
uctio
n1
Prod
uct s
ervi
ces2
Hum
an s
ervi
ces3
With
out j
ob in
na
tiona
l lab
our
mar
ket
Num
ber o
f per
sons
m
ovin
g
Num
ber o
f per
sons
em
ploy
ed
Aver
age
mob
ility
rate
in
to p
rese
nt jo
b
---------------Share of mobility (%) ------------- %
Denmark 1995–96
R&D institutes 16 18 4 10 19 32 729 3 420 21
Higher educ. institutions 5 26 2 7 25 36 4 475 12 886 35
Sweden 1994–95
R&D institutes 7 56 8 8 7 14 2 527 6 457 39
Higher educ. institutions 3 20 3 7 33 33 5 256 27 029 19
Norway 1995–96
R&D institutes 20 12 5 6 19 32 710 5 110 14
Higher educ. institutions 7 21 2 5 32 33 2 318 11 781 20
Finland 1994–95
R&D institutes 38 9 4 5 12 32 794 3 625 22
Higher educ. institutions 1 31 1 3 19 44 4 787 11 508 42 1 Agriculture, mining, manufacturing, utilities and construction. 2 Trade, hotels, restaurants, transport, communications, financial intermediation and other services related to products. 3 Private and public health activities, public administration and other community and private services related to individuals. Source: Graversen (1999); Nås et al. (1998).

27
Mobility rates in Table 9 indicate that there is broad co-operation and knowledge circulation in the Nordic research sectors, although there is little inflow from the private sector. This is not unexpected, owing to a tradition of a clear demarcation between publicly financed R&D and private sector R&D and production The figures in Table 10 indicate the knowledge flow to the surrounding economy, and R&D institutes and HEI are again of special interest. Overall, outflow mobility is approximately equal to inflow mobility except for the few deviations mentioned above. On average, less than one-third of those moving leave the active labour market (retirement, emigration, unemployment, leave, etc.). Table 10. Out-of-job mobility of highly educated employees by receiving
sectors. Shares and numbers of persons. Mobility shares sum horizontally to 100 percent
Receiving sector ⇒
⇓ Delivering sector R&D
inst
itute
s
Hig
her e
duca
tion
inst
itutio
ns
Priv
ate
prod
uctio
n1
Prod
uct s
ervi
ces2
Hum
an s
ervi
ces3
With
out j
ob in
nat
iona
l la
bour
mar
ket
Num
ber o
f per
sons
m
ovin
g
Num
ber o
f per
sons
em
ploy
ed
Aver
age
mob
ility
rate
ou
t of p
rese
nt jo
b
---------------Share of mobility (%) ------------- (%)
Denmark 1995–96
R&D institutes 13 23 4 23 18 20 907 3 505 26
Higher educ. institutions 4 30 5 2 24 27 3 874 14 524 27
Sweden 1994–95
R&D institutes 14 12 24 24 11 15 1 336 5 266 23
Higher educ. institutions 23 17 7 9 23 21 6 165 27 938 22
Norway 1995–96
R&D institutes 14 15 9 23 13 28 1 038 5 438 19
Higher educ. institutions 4 22 6 7 22 38 2 155 11 618 19
Finland 1994–95
R&D institutes 39 9 12 7 8 25 778 3 830 20
Higher educ. institutions 2 35 6 5 11 31 4 327 13 098 33 1 Agriculture, mining, manufacturing, utilities and construction. 2 Trade, hotels, restaurants, transport, communications, financial intermediation and other services related to products. 3 Private and public health activities, public administration and other community and private services related to individuals. Source: Graversen (1999) and Nås et al. (1998).

28
3.3 Cross border mobility – migration between Denmark and the other Nordic countries The mobility across borders is of high interest form a national brain gain, drain or circulation point of view. Results from estimations on the propensity to migrate to and from Denmark as well as remigrate to and from Denmark from the other Nordic countries only reveal a very low number of moving people. The income level, labour market, language and life style are so equal between the countries that no usual pull or push effect really matter. Instead, socio-economic and demographic determinants are in play.3 An empirical model on cross border mobility in the appendix gives estimation results from a logistic probability model on a pooled sample of the entire population. The model estimates the probability of migration and determines differences depending on observed characteristics among the individuals. The appendix table refers also the results on a model of the years from migration until return migration happens on the sample of migrants in 1988.4 The probability model reveals that the immigration probability is counter-cyclical, and that the emigration probability is procyclical. This indicates that there is no push effect in the emigration from Denmark and no pull effect in the immigration to Denmark. In fact, the opposite effects are significant. These findings are in contrast with the conventional belief in the area, that push and pull effects are highly dominating among the migration motives. However, these beliefs concern economies with large economic and socio-economic differences. The probability model also reveals that a minority of the population migrate (negative constant), that Danish citizens have a lower migration probability than other Nordic citizens, that men have a higher emigration probability than women (no gender difference in the immigration probability), that singles and cohabiting have a higher migration probability than married migrate, that children decreases the migration probability, that the migration probability decreases with age and increases with educational levels, that being in education increases the migration rates opposite being in job which does not matter. Finally, being employed in ICT sector increases the emigration probability; employment in the research sector increases the migration probability in general. So do employment in the private and public service sectors.
3 A study of long distance mobility in Denmark reveals similarly, that 90% of all job mobility is in the local area and that it does not include shifts in place of living. The remaining mobility is highly concentrated among the young part of the labour force. 4 An OLS model is estimated, but it does not allow a correct treatment of the migrants being staying abroad in 10 or more years. Due to the 10-year data period, these individuals’ returning year is unobservable. A right-censored model corrects for this, estimating the upper-censored individuals as a point probability. This is the Tobit model. Correcting for the unobserved return year changes the estimation results considerably.

29
Estimating the years from 1988 before migrants return is also presented in the appendix table. The Tobit model reveals that an average person immigrating to Denmark in 1988 leaves again after 11 years, similarly emigrant from 1988 also return after 11 years on average. Being a Danish citizen increases or decreases the years by 4 and 6 years respectively. Male immigrants stay one year less than female immigrants, male emigrants return half a year earlier than female emigrants. Similarly being single reduces the years as migrant, although not significant among the emigrants. Cohabiting decreases the years significant among emigrants but not among immigrants, all compared to married migrants. Children reduce the years of migration but not significantly. There is a tendency that the migration time increases with age. However, the effect is only significant among young emigrants. Pensioners emigrate longer and immigrate shorter periods. However, an unknown and unidentifiable share of this age group who dies when they are abroad causes this result. The educational differences among the migrants do not significantly influence the length of the migration period before return, and even the tendencies are mixed. Working sector at the migration time does neither reveal significant information on the time for return. Neither does work at all although the tendency is negative on migration length. However, immigrants in education leave faster than other immigrants. The opposite is the case among emigrants although not significant. Hence, the years before return migration reveals the expected patterns, that single well-educated young adults return faster than the average migrant. This supports the knowledge circulation thesis and indicates that there seems not to be any trend in who and why the permanent migrants are selected, at least not among the used background characteristics.
4. Summing up The present paper summarizes the Nordic Experiences found in two projects on Job mobility based on Register Data; one study performed for the Nordic Innovation Fund and another performed for OECD. The studies explore the availability and quality of data and definitions on job mobility as well as it gives comparable mobility rates that – under the correct assumptions - can be benchmarked against other countries. The paper also uses new knowledge developed in a European Network on Mobility – ENMOB. There is a strong need for a thorough understanding of the institutional conditions of the individual countries before comparability becomes valid. Discrepancies in institutional and educational systems necessarily reduce the value of direct comparisons, since they are only possible on a very broad and basic level. The work shows that even when comparing four countries that are so similar in many respects, there is still work to be done to make comparisons analytically meaningful.

30
References AFSK. 2001a. Forskning og udviklings arbejde i den offentlige sektor 1999. (R&D in
the public sector 1999.) The Danish Institute for Studies in Research and Research Policy.
AFSK. 2001a. Erhvervslivets forskning og udviklings arbejde 1999. (R&D in the private sector 1999.) The Danish Institute for Studies in Research and Research Policy.
European Commission. 2000a. Meddelelse fra kommissionen til Rådet og Europa-parlamentet. En mobilitetsstrategi for det europæiske forskningsrum. Kommissionen KOM(2001) 331 endelig udgave.
European Commission. 2000b. Communication from the Commission to the Council, the European Parliament, the Economic and Social Committee and the Committee of the Regions. Making a reality of the European Research Area: Guidelines for the EU research activities (2002-2006). COM(2000) 612 final.
European Commission. 2001. High-Level Expert Group on Improving Mobility of Researchers. Final Report. DG-Research 2001.
Firth L. and D. Mellor. 2000. Learning and the new growth theories: Policy dilemma. Research Policy 29. Pp. 1157-1163.
Graversen E. K. 2003. Researcher mobility in Denmark. Translated version of Forskermobilitet i Danmark. AFSK Working Papers 2002/8. Preliminary version used at the 3rd ENMOB-meeting in Madrid. October 2002.
Graversen E. K. 2002. Forskermobilitet i Danmark. AFSK Working Papers 2002/8. Graversen E. K, Svein Olav Nås, Anders Ekeland, Markus Bugge, Christian
Svanfeldt and Mikael Åkerblom. 2002. Knowledge transfer by labour mobility in the Nordic countries. AFSK WP 2002/1.
Graversen E. K. 2002. Job Mobility - LFS versus Registers Data Sources on Human Capital Mobility - the Danish case. AFSK Notat 2002/7.
Graversen E. K and Kenny Friis-Jensen. 2001. Job mobility implications of the HRST definition - Illustrated by empirical numbers from register data. Chapter 4 in the OECD proceedings “Innovative People. Mobility of skilled Personnel in National Innovation Systems”.
Graversen E. K, Anders Ekeland, Svein Olav Nås, Mikael Åkerblom, Markku Virtaharju, Adrian Ratkic and Christian Svanfeldt. 2001. Job mobility rates in the Nordic Countries, 1988-1998. Chapter 7 in the OECD proceedings “Innovative People. Mobility of skilled Personnel in National Innovation Systems”.
Graversen E. K. 2001. Human Capital Mobility into and out of Research Sectors in the Nordic Countries. Chapter 8 in the OECD Proceedings “Innovative People. Mobility of skilled Personnel in National Innovation Systems”

31
Graversen E. K, Mette Lemming, Mikael Åkerblom and Markku Virtaharju. 2001. Migration between the Nordic countries - What can be said about the knowledge flow from register data?. Chapter 18 in the OECD proceedings "Innovative People. Mobility af skilled Personnel in National Innovation Systems".
Graversen E. K and Kamma Langberg. 2001. Knowledge mobility and mobility of researchers - in a Triple Helix perspective. REMAP Conference, Hillerød.
Graversen E. K. 2001. Human Capital Mobility – A Comparable Knowledge Indicator for the Nordic Countries. Chapter 4 in: Willemaus et al (eds.), ‘Science and Technology indicators for the Nordic countries 2000. A collection of articles’. TemaNord 2001:539. Nordic Council of Ministers.
Graversen E. K. 2001. Mobility Rates from Register Data – Comparability among four Nordic Countries. Chapter 13 in: Holm and Pilegaard (eds.), ‘Methodology and use of Nordic register data’. TemaNord. Nordic Council of Ministers.
Graversen E. K and Kenny Friis-Jensen. 2001. HRST Job Mobility Rates in Denmark. Evidence from Danish Register data, 1988-97. Published online by EU “Experts Group on Benchmarking: Human Resources in RTD”. DG Research.
Graversen E. K and Kenny Friis-Jensen. 2001. Job mobility implications of the HRST definition - Illustrated by empirical numbers from register data. Published online by EU “Experts Group on Benchmarking: Human Resources in RTD”. DG Research.
Graversen E. K and Kenny Friis-Jensen. 2001. Job mobility for the HRST population – Implications and evidence from register data. AFSK WP 2001/8.
Graversen E. K. 2000. Cyclicality of Mobility Rates on Human Capital - Evidence from Danish register data, 1988-1997. AFSK WP 2000/5.
Graversen E. K. 1999. Formal Competencies in the National Innovation System. AFSK Rapport 1999/4.
Laafia I. and A. Stimpson. 2001. Using the Community Labour Force Survey to Develop Mobility Rates on Human Resources in Science and Technology. Chapter 9 in OECD (ed.). Innovative People. Mobility of Skilled Personnel in National Innovation Systems. OECD Proceedings.
Langberg K. and E. K. Graversen. 2001. Mobility among researchers. AFSK WP 2001/7.
Lundvall. 1992. National Systems of Innovation: Towards a Theory of Innovation and Interactive Learning. Frances Pinter, London.
Mankiw G., D. Romer and D. Weil.1992. A contribution to the empirics of economic growth. Quarterly Journal of Economics. Pp. 407-437.
Nonaka I., U. Katsuhiro and S. Keigo. 1998. Three tales of Knowledge-creating Companies In van Krogh G., J. Roos and D. Kleine (eds.). Knowing in Firms. Sage, London.

32
Nås S. O., A. Ekeland, E. J. Iversen, M. Åkerblom, M. Virtaharju C. Svanfeldt and J. Ullström. 1998. Formal Competencies in the innovation Systems of the Nordic countries: An analysis based on register data. STEP Report 98/6.
OECD. 1999a. Boosting Innovation. The Cluster Approach. OECD Proceedings. OECD. 1999b. Managing National Innovation Systems. OECD. 2000. Innovative Clusters. Drivers of National Innovation Systems. OECD
Proceedings. Science and Innovation. OECD. 2001a. Innovative People. Mobility of Skilled Personnel in National
Innovation Systems. OECD Proceedings. Science and Innovation. OECD. 2001b. Innovative Networks. Cooperation in National Innovation Systems.
OECD Proceedings. Science and Innovation. OECD. 2002. International Mobility of the Highly Skilled. OECD Proceedings. Romer P. 1986. Increasing Returns and Long Run Growth. Journal of Political
Economy, 94. Romer P. 1990. Endogenous Technological Change. Journal of Political Economy,
98. Salter A. and B. Martin. 2001. The economic benefits of publicly funded basic
research: A critical review. Research Policy, vol. 30, issue 3. Schartinger D., C. Rammer, M. M. Fischer and J. Fröhlich. 2002. Knowledge
interactions between university and industry: Sectoral patterns and determinants. Research Policy, vol. 31, issue 3.
Scott A., G. Steyn, A. Genua, S. Brusoni og E. Steinmueller. 2001. The Economic Return to Basic Research and the Benefits of University-Industry Relationships. A literature review and update of findings. Report prepared for the Office of Science and Technology, November 2001. SPRU.

33
Appendix Table A.1. Logistic model of the inflow job-to-job mobility of employees in the
Nordic countries Explanatory variable Denmark Finland Norway Sweden Unemployment rate -0.005* -0.029 -0.196 -0.136
Real GDP growth rate 0.021* 0.021 -0.045 -0.062
Constant -1.545 -1.643 -1.165 -1.573 -0.807 -1.607 -0.781 -1.654 Gender Male 0.186* 0.185* 0.016 0.009 -0.007 -0.005 0.077 0.076 Age group 20 -24 years 1.184* 1.186* 0.904 0.934 1.102 1.095 1.138 1.131 25-29 years 0.668* 0.667* 0.532 0.546 0.678 0.678 0.634 0.631 30-34 years 0.320* 0.320* 0.244 0.244 0.333 0.335 0.337 0.338 45-54 years -0.334* -0.337* -0.192 -0.218 -0.333 -0.321 -0.280 -0.279 55-64 years -0.604* -0.606* -0.441 -0.451 -0.673 -0.756 -0.540 -0.537 64+ years -0.486* -0.485* -0.595 -0.600 -1.080 -1.093 -0.317 -0.318 Educational level Low -0.040* -0.039* -0.295 -0.272 -0.066 -0.086 -0.285 -0.288 Medium 0.006* 0.006* -0.172 -0.171 -0.243 -0.250 -0.192 -0.189 PhD 0.182* 0.175* 0.357 0.354 0.292 0.303 0.108 0.108 Sectoral group HEI and R&D 0.149* 0.149* 0.335 0.316 0.026 0.021 0.468 0.462 ICT 0.197* 0.200* 0.725 0.690 0.266 0.260 0.790 0.790 Trade, hotels, etc. 0.159* 0.159* 0.407 0.394 0.196 0.194 0.509 0.505 Community services 0.243* 0.242* 0.392 0.372 0.207 0.209 0.600 0.594 Size of workplace 10-49 employees -0.158* -0.158* -0.162 -0.175 -0.091 -0.089 -0.014 -0.014 50-99 employees -0.219* -0.220* -0.174 -0.186 -0.156 -0.155 -0.109 -0.109 100-249 employees -0.166* -0.167* -0.181 -0.190 -0.172 -0.172 -0.156 -0.156 250+ employees -0.279* -0.277* -0.283 -0.298 -0.311 -0.314 -0.346 -0.349 Share of current prediction
0.639 0.639 0.622 0.616 0.548 0.550 0.531 0.531
Cyclicality Pro Pro Pro Pro Pro Counter Pro Counter Mobile share 20.7 17.7 14.4 18.0 Observations/year 206264 1619202 1503320 3618905 Number of years 10 11 11 4 Note: The cyclicality trend is measured by unemployment rate or the GDP real growth rate. * means significance at least at a 1% level. No * are given for Finland, Norway and Sweden since the sample equals the population. The reference individual (or excluded categories) is a woman, aged 35-44, highly educated, and employed in the manufacturing, etc., sector at a workplace with 1-9 employees.
34
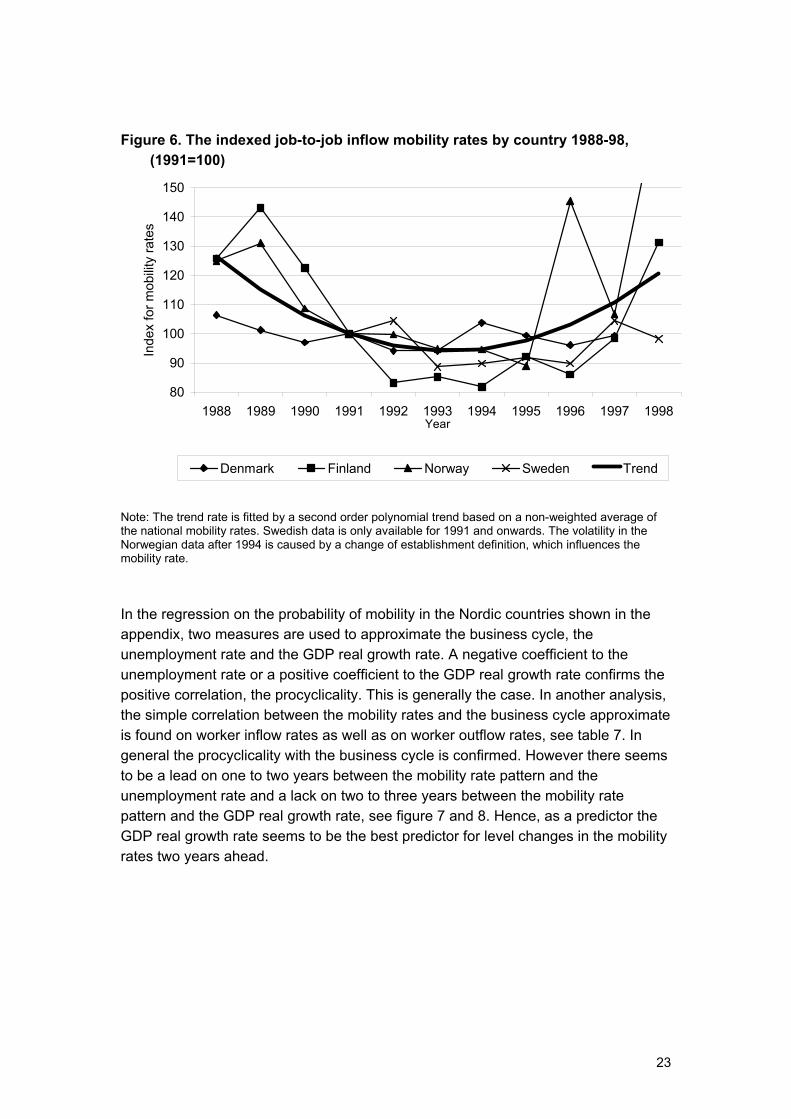
Table A.2. Estimation model on the immigration and emigration probability in the period 1988-97 and the years before return migration of the 1988-cohort in Denmark
Immigration Emigration
Probability 1988-97
Years from 1988 before return migration
Probability 1988-97
Years from 1988 before return
migration Explanatory variable
Logit OLS
regression Tobit
regression Logit OLS
regression Tobit
regression
Unemployment rate 0.069* -0.021* Constant -3.715* 8.685* 11.690* -3.445* 7.729* 11.650* Citizenship Danish citizen -1.684* 1.912* 3.637* -1.349* -2.644* -5.558* Other - - - - - Gender Male -0.003 -0.552* -1.218* 0.073* -0.286* -0.479* Female - - - - - - Civil status Single 0.361* -0.365* -0.805* 0.886* -0.231* -0.397* Cohabiting 0.018* 0.032 0.015 0.234* -0.420* -0.807* Married - - - - - - Children # Children aged 0-17 -0.516* -0.180 -0.196 -0.371* -0.025 -0.023 # Children squared 0.059* 0.058 0.081 0.038* -0.007 -0.016 Age group 19 years 0.863* -0.280 -0.390 0.256* -2.072* -2.754* 20-24 years 0.523* -0.224 -0.312 0.367* -1.030* -1.560* 25-29 years 0.151* -0.187 -0.246 0.238* -0.249* -0.381 30-34 years - - - - - - 35-44 years -0.506* 0.247 0.441 -0.388* 0.003 -0.083 45-54 years -1.134* 0.321 0.490 -1.026* -0.145 -0.422 55-64 years -1.806* 0.762* 0.347 -1.772* 0.431 0.642 65-74 years -2.881* -2.536* -4.122* -2.517* 2.576* 8.535* Educational level ISCED97 1 + 2 -1.521* -0.906* -1.953* -1.357* 0.348* 0.679* ISCED97 3 + 4 -0.689* -0.231 0.372 -0.700* 0.354* 0.667* Bachelor or Master - - - - - - PhD 1.133* -2.691 -6.459* 0.923* 4.7385 30.010 No information 0.647* -2.588* -4.390* 0.392* 1.253* 2.673* Sectoral group HEI and R&D 0.040* -0.285 -0.116 0.242* -0.023 0.185 ICT -0.012 -0.817 -1.805 0.588* -0.168 -0.347 Trade, hotels etc. 0.105* 0.178 0.619 0.243* 0.065 0.053 Community services 0.055* -0.234 0.016 0.138* 0.174 0.220 No information 1.107* -0.954* -1.160* 0.638* 0.044 0.027 Manufacturing etc. - - - - - - Job In job 0.055* -0.417 -0.114 0.032* -0.026 -0.025 Not in job - - - - - - Education In education -0.425* -0.348* -0.731* -0.019* 0.215 0.366 Not in education - - - - - - Number of observations 37672959 3689 3689 37672959 5090 5090 Share of correct predictions 0.734 0.696 Normal scale parameter 5.049 4.720 R2
adj. 0.331 0.230 Note: The characteristics of the reference person for the dummy variables are indicated by – in the table. * indicates significance at a 10%-level.