“Anaerobic Digestion of Food Waste” - US EPA · U.S. ENVIRONMENTAL PROTECTION AGENCY REGION 9...
62
_______________________________ _______________________________ _______________________________ U.S. ENVIRONMENTAL PROTECTION AGENCY REGION 9 “Anaerobic Digestion of Food Waste” Funding Opportunity No. EPA-R9-WST-06-004 FINAL REPORT March 2008 Prepared by: East Bay Municipal Utility District Donald M.D. Gray (Gabb) PRINCIPAL INVESTIGATOR Paul Suto PROJECT MANAGER Cara Peck EPA PROJECT MANAGER
Transcript of “Anaerobic Digestion of Food Waste” - US EPA · U.S. ENVIRONMENTAL PROTECTION AGENCY REGION 9...
_______________________________
_______________________________
_______________________________
U.S. ENVIRONMENTAL PROTECTION AGENCY REGION 9
“Anaerobic Digestion of Food Waste”
Funding Opportunity No. EPA-R9-WST-06-004
FINAL REPORT March 2008
Prepared by:
East Bay Municipal Utility District
Donald M.D. Gray (Gabb) PRINCIPAL INVESTIGATOR
Paul Suto PROJECT MANAGER
Cara Peck EPA PROJECT MANAGER

TABLE OF CONTENTS
Acknowledgements ........................................................................................................................ i
List of Tables ................................................................................................................................. ii
List of Figures ............................................................................................................................... iii
Executive Summary .................................................................................................................. ES-1
1.0 Introduction and Background .................................................................................................. 1
2.0 Materials and Methods............................................................................................................. 3
3.0 Results and Discussion ............................................................................................................ 6 3.1 Mean Cell Residence Time........................................................................................... 6 3.2 Temperature .................................................................................................................. 9 3.3 pH ............................................................................................................................... 11 3.4 Digester Gas Production ............................................................................................. 13 3.5 Total Alkalinity and Total Volatile Acids .................................................................. 15 3.6 Total Solids and Volatile Solids ................................................................................. 19 3.7 Volatile Solids Loading Rate...................................................................................... 22 3.8 Volatile Solids Destruction......................................................................................... 24 3.9 Digester Gas Composition .......................................................................................... 26 3.10 Specific Methane Gas Production Rate ...................................................................... 29 3.11 Chemical Oxygen Demand (COD) Loading Rate ...................................................... 30 3.12 Food Waste Energy Value .......................................................................................... 32
4.0 Summary and Conclusions .................................................................................................... 35
References................................................................................................................................... R-1
Appendix A................................................................................................................................ A-1
Appendix B ................................................................................................................................. B-1
ACKNOWLEDGEMENTS
The project team would like to acknowledge Ryoko Kataoka, who operated the bench-scale digesters during the study. The following individuals are also acknowledged for contributing to the success of the project: Mark Chien, Ken Gerstman, John Hake, Jack Lim, and Idit Zarchi.
Anaerobic Digestion of Food Waste Funding Opportunity No. EPA-R9-WST-06-004
i

LIST OF TABLES
ES-1 Energy Benefit Comparison of Anaerobically Digested Food Waste and Anaerobically Digested Municipal Wastewater Solids ........................................................................ ES-3
ES-2 Bench-scale Anaerobic Food Waste Digester Volatile Solids Destruction (VSD) Summary ....................................................................................................................... ES-4
ES-3 Comparison of Residuals Production for Food Waste and Municipal Wastewater Solids Digestion at a 15-day MCRT............................................................................. ES-5
ES-4 Bench-scale Anaerobic Food Waste Digester MCRT Summary.................................. ES-5 ES-5 Bench-scale Anaerobic Food Waste Digester Volatile Solids Loading Rate
Summary ....................................................................................................................... ES-6 ES-6 Bench-Scale Anaerobic Food Waste Digester Methane Gas Composition
Summary ....................................................................................................................... ES-7 ES-7 Bench-scale Anaerobic Food Waste Digester COD Loading Rate Summary.............. ES-8 ES-8 Summary of Parameters Comparing Anaerobic Food Waste Digestion to
Anaerobic Municipal Wastewater Solids Digestion ..................................................... ES-9 3.1 Bench-scale Anaerobic Food Waste Digester MCRT Summary........................................ 7 3.2 Bench-scale Anaerobic Food Waste Digester Temperature Summary............................... 9 3.3 Bench-scale Anaerobic Food Waste Digester pH Summary ............................................ 11 3.4 Bench-scale Anaerobic Food Waste Digester Gas Production Summary ........................ 13 3.5 Bench-scale Anaerobic Food Waste Digester Solids (TS and VS/TS) Summary ............ 19 3.6 Bench-Scale Anaerobic Food Waste Digester Volatile Solids Loading Rate Summary ........................................................................................................................... 23 3.7 Bench-scale Anaerobic Food Waste Digester Volatile Solids Destruction (VSD)
Summary ........................................................................................................................... 24 3.8 Comparison of Residuals Production for Food Waste and Municipal Wastewater
Solids Digestion at a 15-day MCRT................................................................................. 26 3.9 Bench-scale Anaerobic Food Waste Digester Methane Gas Composition Summary ...... 26 3.10 Bench-scale Anaerobic Food Waste Digester COD Loading Rate Summary.................. 31 3.11 Energy Benefit Comparison of Anaerobically Digested Food Waste and Anaerobically
Digested Municipal Wastewater Solids ............................................................................ 33 4.1 Summary of Parameters Comparing Anaerobic Food Waste Digestion to
Anaerobic Municipal Wastewater Solids Digestion ......................................................... 35
Anaerobic Digestion of Food Waste Funding Opportunity No. EPA-R9-WST-06-004
ii

LIST OF FIGURES
2.1 Bench-scale Anaerobic Food Waste Digester Schematic................................................... 4 2.2 EBMUD Food Waste Treatment Process (Patent-Pending) ............................................... 5 3.1 Anaerobic Food Waste Digester Mean Cell Residence Time ............................................ 8 3.2 Anaerobic Food Waste Digester Temperature.................................................................. 10 3.3 Anaerobic Food Waste Digester pH ................................................................................. 12 3.4 Anaerobic Food Waste Digester Gas Production ............................................................. 14 3.5 Anaerobic Food Waste Digester Total Alkalinity ............................................................ 16 3.6 Anaerobic Food Waste Digester Total Volatile Acids ..................................................... 16 3.7 Anaerobic Food Waste Digester Total Volatile Acids to Total Alkalinity Ratio ............. 17 3.8 Anaerobic Food Waste Digester Total Solids................................................................... 20 3.9 Anaerobic Food Waste Digester VS/TS ........................................................................... 20 3.10 Anaerobic Food Waste Digester Volatile Solids Loading Rate........................................ 23 3.11 Anaerobic Food Waste Digester Volatile Solids Destruction........................................... 25 3.12 Anaerobic Food Waste Digester Methane Content of Digester Gas ................................ 27 3.13 Anaerobic Food Waste Digester Carbon Dioxide Content of Digester Gas..................... 27 3.14 Anaerobic Food Waste Digester Specific Methane Gas Production Rate........................ 30 3.15 Anaerobic Food Waste Digester COD Loading Rate ....................................................... 31
Anaerobic Digestion of Food Waste Funding Opportunity No. EPA-R9-WST-06-004
iii

EXECUTIVE SUMMARY
Introduction and Background
Food waste is the single largest category of municipal solid waste (MSW) in California at 5.9 million tons or 16% of total MSW as of 1999 (CIWMB, 1999). Diverting a portion of food waste from landfills can provide a significant contribution toward achieving EPA, state, and local mandated solid waste diversion goals. In addition, diverting food waste from landfills prevents uncontrolled emissions of its breakdown products, including methane—a potent greenhouse gas. Currently, only about 2.5% of food waste is recycled nationwide, and the principal technology is composting. While composting provides an alternative to landfill disposal of food waste, it requires large areas of land; produces volatile organic compounds (smog precursors), which are released into the atmosphere; and consumes energy. Consequently, better recycling alternatives to composting food waste should be explored. Anaerobic digestion has been successfully used for many years to stabilize municipal organic solid wastes, and to provide beneficial end products, i.e., methane gas and fertilizer. In California, approximately 137 wastewater treatment plants have anaerobic digesters, with an estimated excess capacity of 15-30% (Shang, et. al., 2006). This excess digester capacity could provide an opportunity to recycle post-consumer food waste while producing renewable energy and reducing greenhouse gas emissions in California.
At the East Bay Municipal Utility District’s (EBMUD) Main Wastewater Treatment Plant (MWWTP), food waste is currently co-digested with primary and secondary municipal wastewater solids and other high-strength wastes. Due to the limitations at full-scale, and risks of overloading digesters, it has been difficult to accurately quantify methane gas production rates, mean cell residence time (MCRT) requirements, and volatile solids reduction values that are specific to food waste digestion. Bench-scale anaerobic digesters were fed only food waste pulp from EBMUD’s food waste processing system (see Figure 2,2). The digesters were operated at both mesophilic and thermophilic temperatures, at 15-, 10-, and 5-day MCRTs. In addition, anaerobic food waste digestion was compared with anaerobic municipal wastewater solids digestion to demonstrate the benefits of food waste digestion at wastewater treatment plants. Key digester design and operating criteria investigated included:
• Minimum MCRT.
• Volatile solids and chemical oxygen demand (COD) loading rates.
• Volatile solids destruction.
• Methane gas production rates.
• Process stability.
• Thermophilic and mesophilic operating temperatures.
Anaerobic Digestion of Food Waste ES-1 Funding Opportunity No. EPA-R9-WST-06-004
Results and Discussion
The following sections summarize the key study results, which include: the energy value of food waste digestion, volatile solids destroyed and biosolids produced, MCRT, volatile solids loading rate, methane gas content and methane gas production rates, COD loading rate, and others. The food waste evaluated during this study is representative of food wastes available from restaurants, grocery stores, and produce markets throughout California, and around the country. Food waste anaerobically digested at EBMUD’s MWWTP is collected from local restaurants, grocery stores, and produce markets that source separate food waste. This collected food waste is pre-processed by a local hauler, and then further processed at EBMUD’s MWWTP into a food waste pulp, to reduce contaminants and prepare the food waste for optimal digestion, prior to pumping to EBMUD’s anaerobic digesters.
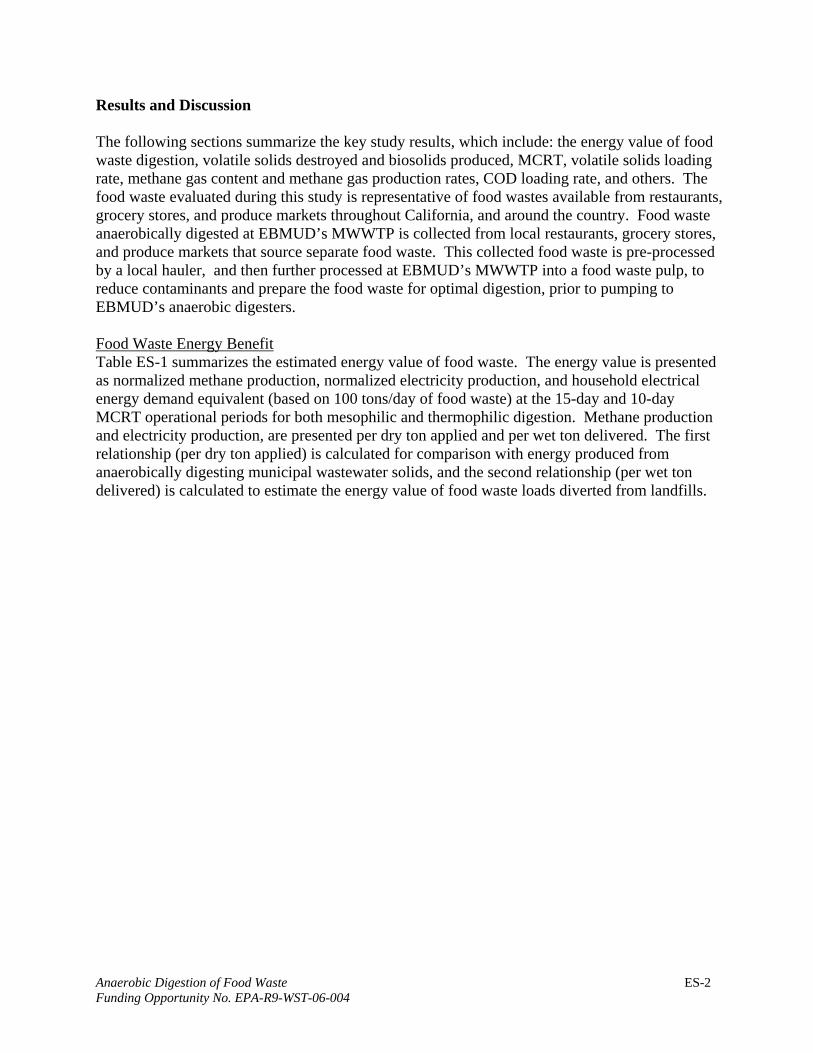
Food Waste Energy Benefit Table ES-1 summarizes the estimated energy value of food waste. The energy value is presented as normalized methane production, normalized electricity production, and household electrical energy demand equivalent (based on 100 tons/day of food waste) at the 15-day and 10-day MCRT operational periods for both mesophilic and thermophilic digestion. Methane production and electricity production, are presented per dry ton applied and per wet ton delivered. The first relationship (per dry ton applied) is calculated for comparison with energy produced from anaerobically digesting municipal wastewater solids, and the second relationship (per wet ton delivered) is calculated to estimate the energy value of food waste loads diverted from landfills.
Anaerobic Digestion of Food Waste ES-2 Funding Opportunity No. EPA-R9-WST-06-004

Table ES-1. Energy Benefit Comparison of Anaerobically Digested Food Waste and Anaerobically Digested Municipal Wastewater Solids.
Parameter Unit
Food Waste 15-day MCRT
AVG (Range)
Food Waste 10-day MCRT
AVG (Range)
Municipal Wastewater
Solids 15-day MCRT
AVG (Range) (5)
Methane Production Rate
ft3/dry ton applied(1)
13,300 (9,800 – 17,000)
9,500 (6,600 – 14,400)
10,000 (7,500 – 12,600)
ft3/wet ton delivered(2)
3,300 (2,500 – 4,300)
2,400 (1,700 – 3,600) NA(6)
m3/ dry metric ton applied(1)
420 (300 – 530)
300 (200 – 450)
310 (230 – 390)
m3/wet metric ton delivered(2)
100 (75 – 135)
75 (50 – 110) NA(6)
ft3 per day/ 1,000 ft3 digester volume
2,300 (1,100 – 3,200)
2,600 (1,800 – 3,800)
750 (550 – 930)
Electricity Production Rate(3)
kWh/dry ton applied(1)
990 (730 – 1,300)
710 (490 – 1,080)
750 (560 – 940)
kWh/wet ton delivered(2)
250 (190 – 320)
180 (130 – 270) NA(6)
kWh/dry metric ton applied(1)
1,100 (800 – 1,400)
780 (540 – 1,190)
830 (620 – 1,040)
kWh/wet metric ton delivered(2)
280 (200 - 350)
200 (140 - 300) NA(6)
kWh per year/ 1,000 ft3 digester volume
43,700 (21,300 – 62,100)
57,000 (43,000 – 73,700)
14,600 (10,700 – 18,000)
Household Energy Equivalent Rate(4)
households/year/ 100 tons/day
1,100 (800 – 1,400)
800 (550 –1,200) NA(6)
households/year/ 100 metric tons/day
1,200 (880 – 1,500)
880 (600 – 1,300) NA(6)
households per year/ 1,000 ft3
digester volume
7.3 (3.6 – 10.3)
8.4 (5.8 – 12.3)
2.4 (1.8 – 3)
Notes: 1. Dry ton applied refers to food waste solids applied to the digesters after processing a wet ton delivered load. 2. Wet ton delivered refers to food waste tonnage (including water) delivered by the hauler prior to processing, 3. Calculated based on 1 ft3 CH4 = 1,000 BTUs and 13,400 BTUs = 1 kWh. 4. Calculated based on 2001 EIA residential energy survey for CA where average household energy use is 6,000
kWh annually. 5. Based on data from previous EBMUD bench-scale pilot study. Digesters were fed thickened waste activated
sludge and screened primary sludge. 6. Data is not typical of municipal wastewater solids loading to digesters. 7. For annual data, 100 tons/day food waste assumes processing at 5 days per week, 52 weeks per year. 8. For annual data, it is assumed municipal wastewater solids loading occurs 5 days per week, 52 weeks per year. 9. A typical food waste load delivered weighs approximately 20 tons, and has a 28% TS content. 10. Approximately 10% of the delivered food waste as total solids (TS) mass is discharged in reject stream. 11. Data range presented is from stable digester operating periods for both mesophilic and thermophilic digesters. 12 .AVG= Average. NA=Not Applicable.
Anaerobic Digestion of Food Waste ES-3 Funding Opportunity No. EPA-R9-WST-06-004
At the 15-day MCRT operational period, the energy benefit on a normalized basis is higher than during the 10-day MCRT operational period. This is likely due to the lower waste rate at the 15day MCRT, allowing more of the slower growing methanogens (which produce methane in anaerobic digesters) to grow and populate the digested sludge, compared to the higher waste rate needed to achieve a 10-day MCRT. However, at the shorter MCRT period, more tonnage is applied to a fixed digester volume, which can result in an increase in overall gas production at a 10-day MCRT compared to a 15-day MCRT. For example, a 1 million gallon digester operating at a 15-day MCRT and assuming 10% feed solids, has a food waste loading rate of approximately 27.8 dry tons per day. At a 10-day MCRT, the food waste loading is approximately 41.7 dry tons per day for the same digester and feed solids. Using the average methane production rate at a 15-day MCRT, the result is 369,740 cubic feet (ft3) of methane gas produced per day. At a 10-day MCRT, 396,150 ft3 of methane is produced per day, which is approximately 7% more than the methane gas produced at the 15-day MCRT.
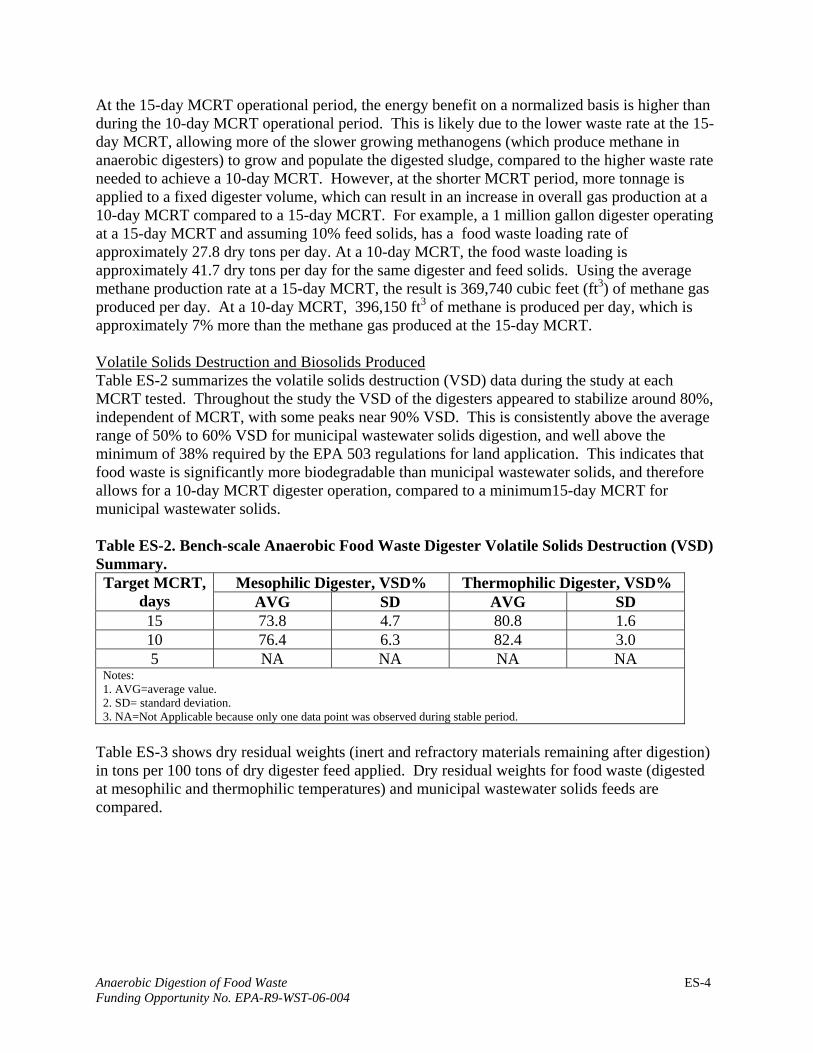
Volatile Solids Destruction and Biosolids Produced Table ES-2 summarizes the volatile solids destruction (VSD) data during the study at each MCRT tested. Throughout the study the VSD of the digesters appeared to stabilize around 80%, independent of MCRT, with some peaks near 90% VSD. This is consistently above the average range of 50% to 60% VSD for municipal wastewater solids digestion, and well above the minimum of 38% required by the EPA 503 regulations for land application. This indicates that food waste is significantly more biodegradable than municipal wastewater solids, and therefore allows for a 10-day MCRT digester operation, compared to a minimum15-day MCRT for municipal wastewater solids.
Table ES-2. Bench-scale Anaerobic Food Waste Digester Volatile Solids Destruction (VSD) Summary. Target MCRT,
days Mesophilic Digester, VSD% Thermophilic Digester, VSD%
AVG SD AVG SD 15 73.8 4.7 80.8 1.6 10 76.4 6.3 82.4 3.0 5 NA NA NA NA
Notes: 1. AVG=average value. 2. SD= standard deviation. 3. NA=Not Applicable because only one data point was observed during stable period.
Table ES-3 shows dry residual weights (inert and refractory materials remaining after digestion) in tons per 100 tons of dry digester feed applied. Dry residual weights for food waste (digested at mesophilic and thermophilic temperatures) and municipal wastewater solids feeds are compared.
Anaerobic Digestion of Food Waste ES-4 Funding Opportunity No. EPA-R9-WST-06-004
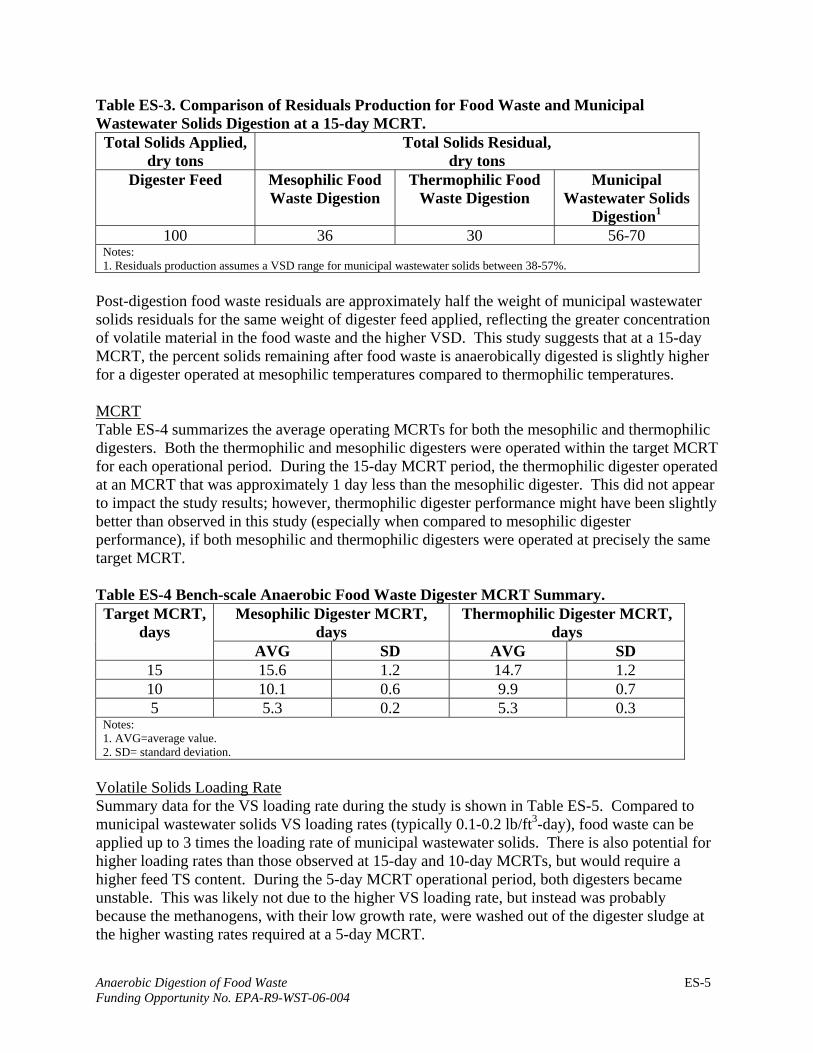
Table ES-3. Comparison of Residuals Production for Food Waste and Municipal Wastewater Solids Digestion at a 15-day MCRT. Total Solids Applied,
dry tons Total Solids Residual,
dry tons Digester Feed Mesophilic Food
Waste Digestion Thermophilic Food
Waste Digestion Municipal
Wastewater Solids Digestion1
100 36 30 56-70 Notes: 1. Residuals production assumes a VSD range for municipal wastewater solids between 38-57%.
Post-digestion food waste residuals are approximately half the weight of municipal wastewater solids residuals for the same weight of digester feed applied, reflecting the greater concentration of volatile material in the food waste and the higher VSD. This study suggests that at a 15-day MCRT, the percent solids remaining after food waste is anaerobically digested is slightly higher for a digester operated at mesophilic temperatures compared to thermophilic temperatures.
MCRT Table ES-4 summarizes the average operating MCRTs for both the mesophilic and thermophilic digesters. Both the thermophilic and mesophilic digesters were operated within the target MCRT for each operational period. During the 15-day MCRT period, the thermophilic digester operated at an MCRT that was approximately 1 day less than the mesophilic digester. This did not appear to impact the study results; however, thermophilic digester performance might have been slightly better than observed in this study (especially when compared to mesophilic digester performance), if both mesophilic and thermophilic digesters were operated at precisely the same target MCRT.
Table ES-4 Bench-scale Anaerobic Food Waste Digester MCRT Summary. Target MCRT,
days Mesophilic Digester MCRT,
days Thermophilic Digester MCRT,
days AVG SD AVG SD
15 15.6 1.2 14.7 1.2 10 10.1 0.6 9.9 0.7 5 5.3 0.2 5.3 0.3
Notes: 1. AVG=average value. 2. SD= standard deviation.
Volatile Solids Loading Rate Summary data for the VS loading rate during the study is shown in Table ES-5. Compared to municipal wastewater solids VS loading rates (typically 0.1-0.2 lb/ft3-day), food waste can be applied up to 3 times the loading rate of municipal wastewater solids. There is also potential for higher loading rates than those observed at 15-day and 10-day MCRTs, but would require a higher feed TS content. During the 5-day MCRT operational period, both digesters became unstable. This was likely not due to the higher VS loading rate, but instead was probably because the methanogens, with their low growth rate, were washed out of the digester sludge at the higher wasting rates required at a 5-day MCRT.
Anaerobic Digestion of Food Waste ES-5 Funding Opportunity No. EPA-R9-WST-06-004
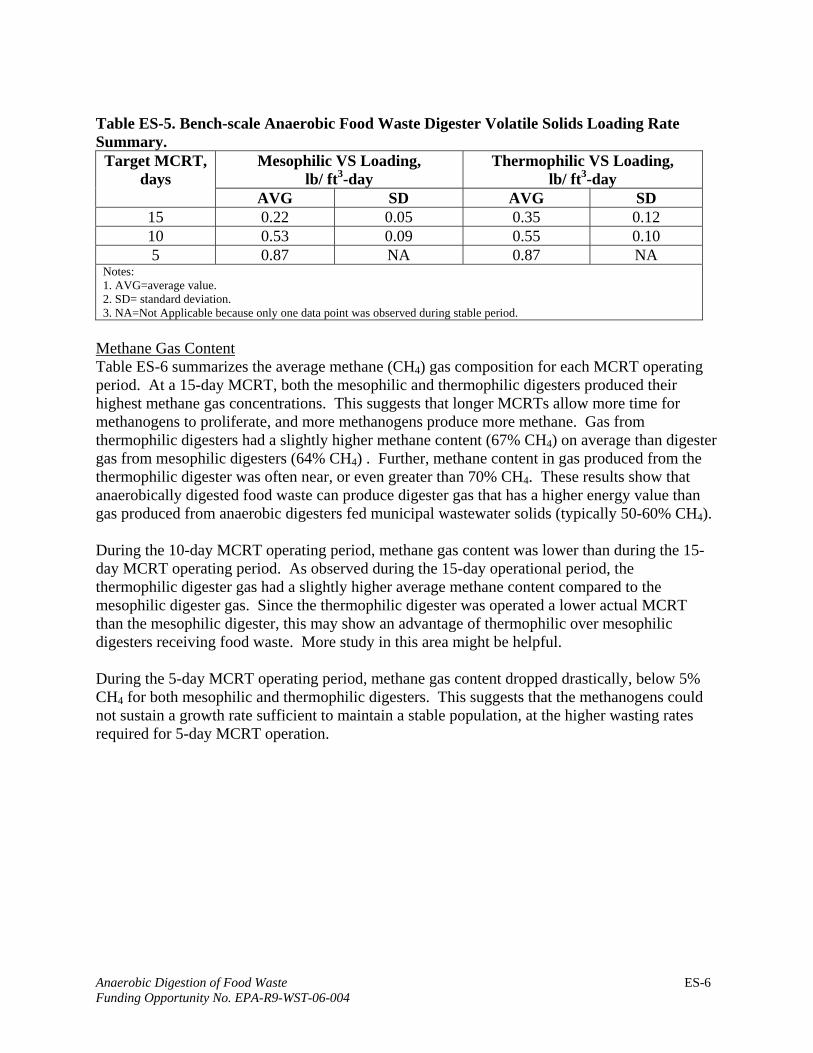
Table ES-5. Bench-scale Anaerobic Food Waste Digester Volatile Solids Loading Rate Summary.
Target MCRT, days
Mesophilic VS Loading, lb/ ft3-day
Thermophilic VS Loading, lb/ ft3-day
AVG SD AVG SD 15 0.22 0.05 0.35 0.12 10 0.53 0.09 0.55 0.10 5 0.87 NA 0.87 NA
Notes: 1. AVG=average value. 2. SD= standard deviation. 3. NA=Not Applicable because only one data point was observed during stable period.
Methane Gas Content Table ES-6 summarizes the average methane (CH4) gas composition for each MCRT operating period. At a 15-day MCRT, both the mesophilic and thermophilic digesters produced their highest methane gas concentrations. This suggests that longer MCRTs allow more time for methanogens to proliferate, and more methanogens produce more methane. Gas from thermophilic digesters had a slightly higher methane content (67% CH4) on average than digester gas from mesophilic digesters (64% CH4) . Further, methane content in gas produced from the thermophilic digester was often near, or even greater than 70% CH4. These results show that anaerobically digested food waste can produce digester gas that has a higher energy value than gas produced from anaerobic digesters fed municipal wastewater solids (typically 50-60% CH4).
During the 10-day MCRT operating period, methane gas content was lower than during the 15day MCRT operating period. As observed during the 15-day operational period, the thermophilic digester gas had a slightly higher average methane content compared to the mesophilic digester gas. Since the thermophilic digester was operated a lower actual MCRT than the mesophilic digester, this may show an advantage of thermophilic over mesophilic digesters receiving food waste. More study in this area might be helpful.
During the 5-day MCRT operating period, methane gas content dropped drastically, below 5% CH4 for both mesophilic and thermophilic digesters. This suggests that the methanogens could not sustain a growth rate sufficient to maintain a stable population, at the higher wasting rates required for 5-day MCRT operation.
Anaerobic Digestion of Food Waste ES-6 Funding Opportunity No. EPA-R9-WST-06-004
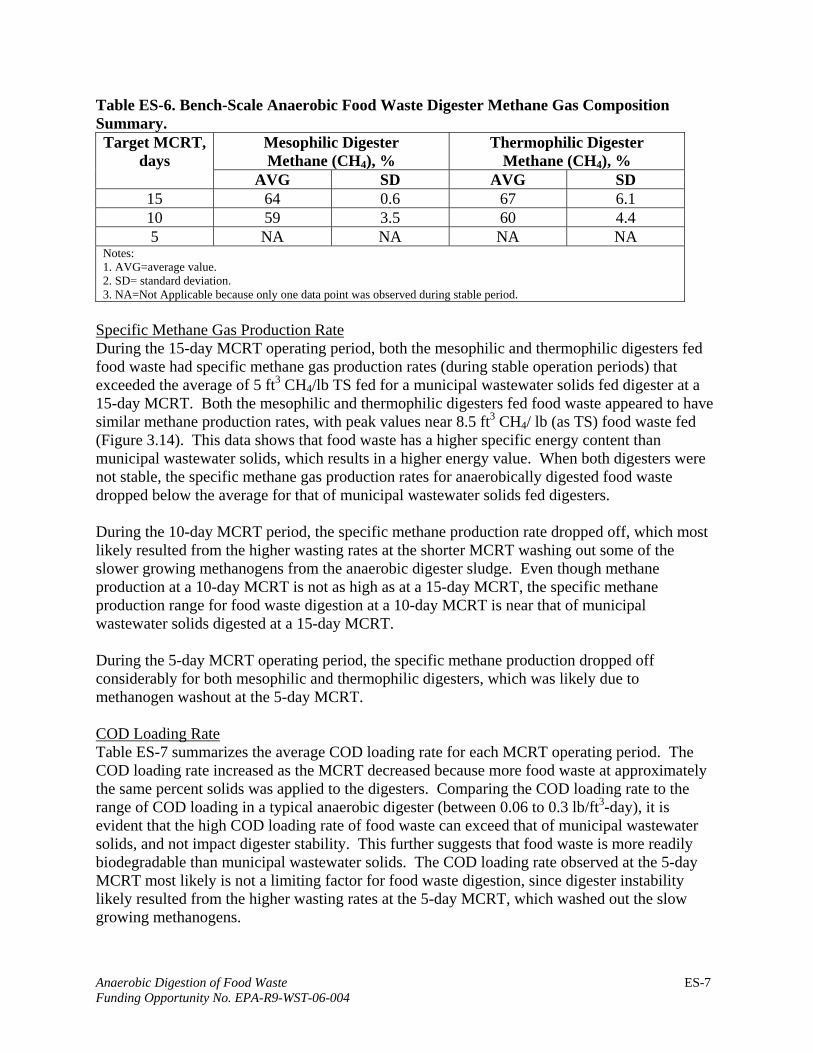
Table ES-6. Bench-Scale Anaerobic Food Waste Digester Methane Gas Composition Summary. Target MCRT,
days Mesophilic Digester Methane (CH4), %
Thermophilic Digester Methane (CH4), %
AVG SD AVG SD 15 64 0.6 67 6.1 10 59 3.5 60 4.4 5 NA NA NA NA
Notes: 1. AVG=average value. 2. SD= standard deviation. 3. NA=Not Applicable because only one data point was observed during stable period.
Specific Methane Gas Production Rate During the 15-day MCRT operating period, both the mesophilic and thermophilic digesters fed food waste had specific methane gas production rates (during stable operation periods) that exceeded the average of 5 ft3 CH4/lb TS fed for a municipal wastewater solids fed digester at a 15-day MCRT. Both the mesophilic and thermophilic digesters fed food waste appeared to have similar methane production rates, with peak values near 8.5 ft3 CH4/ lb (as TS) food waste fed (Figure 3.14). This data shows that food waste has a higher specific energy content than municipal wastewater solids, which results in a higher energy value. When both digesters were not stable, the specific methane gas production rates for anaerobically digested food waste dropped below the average for that of municipal wastewater solids fed digesters.
During the 10-day MCRT period, the specific methane production rate dropped off, which most likely resulted from the higher wasting rates at the shorter MCRT washing out some of the slower growing methanogens from the anaerobic digester sludge. Even though methane production at a 10-day MCRT is not as high as at a 15-day MCRT, the specific methane production range for food waste digestion at a 10-day MCRT is near that of municipal wastewater solids digested at a 15-day MCRT.
During the 5-day MCRT operating period, the specific methane production dropped off considerably for both mesophilic and thermophilic digesters, which was likely due to methanogen washout at the 5-day MCRT.
COD Loading Rate Table ES-7 summarizes the average COD loading rate for each MCRT operating period. The COD loading rate increased as the MCRT decreased because more food waste at approximately the same percent solids was applied to the digesters. Comparing the COD loading rate to the range of COD loading in a typical anaerobic digester (between 0.06 to 0.3 lb/ft3-day), it is evident that the high COD loading rate of food waste can exceed that of municipal wastewater solids, and not impact digester stability. This further suggests that food waste is more readily biodegradable than municipal wastewater solids. The COD loading rate observed at the 5-day MCRT most likely is not a limiting factor for food waste digestion, since digester instability likely resulted from the higher wasting rates at the 5-day MCRT, which washed out the slow growing methanogens.
Anaerobic Digestion of Food Waste ES-7 Funding Opportunity No. EPA-R9-WST-06-004
Table ES-7. Bench-scale Anaerobic Food Waste Digester COD Loading Rate Summary. Target MCRT,
days Mesophilic COD Loading,
lb/ ft3-day Thermophilic COD Loading,
lb/ ft3-day AVG SD AVG SD
15 0.42 0.15 0.68 0.30 10 1.07 0.29 1.03 0.15 5 1.89 NA 1.91 NA
Notes: 1. AVG=average value. 2. SD= standard deviation. 3. NA=Not Applicable because only one data point was observed during stable period.
Summary and Conclusions
The results of this study have demonstrated that anaerobic digestion of food waste can be achieved at a reduced MCRT (10 days), and at both mesophilic and thermophilic temperatures. Compared to municipal wastewater solids digestion, food waste digestion has many benefits. Table ES-8 summarizes the parameters comparing food waste digestion to municipal wastewater solids digestion.
Anaerobic Digestion of Food Waste ES-8 Funding Opportunity No. EPA-R9-WST-06-004

Table. ES-8. Summary of Parameters Comparing Anaerobic Food Waste Digestion to Anaerobic Municipal Wastewater Solids Digestion.
Parameter Units
Food Waste Digestion Municipal Wastewater
Solids Digestion
15-day MCRT Meso Thermo
10-day MCRT Meso Thermo
15-day MCRT Meso(1)
VS (as percent of TS), Feed % 86.3 87 89.9 90.6 77
VS Loading, Feed lb/ft3-day 0.28 0.29 0.53 0.54 0.2(2)
COD Loading, Feed lb/ft3-day 0.55 0.57 1.09 1.11 0.06-0.3(3)
VSD % 73.8 80.8 76.4 82.4 38-57%(4)
Methane (CH4) Content % 64 67 59 60 63
Methane Production Rate, Avg (Range)
ft3/lb TS applied
13,300 (9,800–17,000)(5)
9,500 (6,600–14,400)(5)
10,000 (7,500–12,600)
ft3 per day/ 1,000 ft3
digester volume
2,300 (1,100–3,200)
2,600 (1,800–3,800)
750 (550–930)
Residuals (Mass of Biosolids Produced) as a Percent of Feed Applied.
% 36 30 31 26 56-70
Notes: 1. Based on data from previous EBMUD bench-scale pilot study. Digesters were fed thickened waste activated sludge
and screened primary sludge. 2. Maximum recommended loading rate, WEF MOP 8. 3. Maximum recommended loading rate, M&E, 4th Edition. 4. EPA 503 Regulations minimum is 38%. Typical average is 57% from EBMUD bench-scale pilot study. 5. Data combined for mesophilic and thermophilic digesters.
The main conclusions from this study are as follows:
• The food waste evaluated during this study is representative of food waste available from restaurants, grocery stores, and produce markets throughout California, and around the U.S.
• Anaerobic digestion of food waste pulp from the EBMUD food waste process provides a higher normalized energy benefit, compared to municipal wastewater solids:
o 730 to 1,300 kWh per dry ton of food waste applied. o 560 to 940 kWh per dry ton of municipal wastewater solids applied.
Anaerobic Digestion of Food Waste ES-9 Funding Opportunity No. EPA-R9-WST-06-004

• Anaerobic digestion of food waste provides a higher normalized energy benefit at a 15-day MCRT than at a 10-day MCRT:
o 190 to 320 kWh per wet ton of food waste at a 15-day MCRT, or the equivalent of satisfying the power demand of 800 to 1,400 homes per year at 100 tons of food waste per day.
o 130 to 270 kWh per wet ton of food waste at a 10-day MCRT, or the equivalent of satisfying the power demand of 550 to 1,200 homes per year at 100 tons of food waste per day.
• Food waste contains more biodegradable solids, with a higher VS/TS percentage (86% to 90%) than municipal wastewater solids (70% to 80%).
• Volatile solids destroyed (VSD) is higher for food waste when anaerobically digested (74 to 81%) than for municipal wastewater solids when anaerobically digested (57%), and much higher than the 38% VSD required by the EPA’s 503 Regulations for land application.
• Since food waste is more readily biodegradable (i.e., with higher VS/TS and VSD) than municipal wastewater solids, a 10-day MCRT could be used rather than the minimum of 15-days for municipal wastewater solids anaerobic digestion.
• With a shorter MCRT possible for food waste, smaller digester volumes would be needed, possibly reducing capital costs.
• The higher VS/TS percentage and VSD of food waste digestion also results in half the biosolids produced (residual solids) compared to anaerobically digesting municipal wastewater solids.
• Stable anaerobic digestion of food waste at both mesophilic and thermophilic temperatures provides more gas production (6 to 8.5 ft3 CH4/lb TS applied) than digestion of municipal wastewater solids (5 ft3 CH4/lb TS applied).
• Anaerobic digestion of food waste can occur at significantly higher VS loading (0.53 lb/ ft3-day) and COD loading (1.1 lb/ ft3-day) rates than typically seen for municipal wastewater solids (0.1 to 0.2 lb VS/ ft3-day and 0.06 to 0.3 lb COD/ ft3day).
• Thermophilic anaerobic digestion may provide for a slightly higher methane content in digester gas than mesophilic anaerobic digestion when only food waste is fed (67% versus 64% at 15-day MCRT, and 60% versus 59% at 10-day MCRT, respectively). Especially since the actual MCRT was consistently lower for the thermophilic digester compared to the mesophilic digester. More work, however, is needed in this area.
• Although the specific methane gas production rate for food waste anaerobically digested at a 10-day MCRT is less than the rate at a 15-day MCRT, the increased food waste loading rate (tonnage delivered) at a 10-day MCRT can result in a slight increase in gas production per digester volume compared to a digester fed only food waste and operated at a 15-day MCRT.
• Food waste digestion results in a nearly 3 times higher methane gas yield per digester volume at both 15-day (2,300 ft3 CH4/1000 ft3 digester volume) and 10-day MCRT (2,600 ft3 CH4/1,000 ft3 digester volume) operation compared to that of municipal wastewater solids digestion (750 ft3 CH4/1,000 ft3 digester volume ) at a 15-day MCRT.
Anaerobic Digestion of Food Waste ES-10 Funding Opportunity No. EPA-R9-WST-06-004

1.0 Introduction and Background
Food waste is the single largest category of municipal solid waste (MSW) in California at 5.9 million tons or 16% of total MSW as of 1999 (CIWMB, 1999). Diverting a portion of food waste from landfills can provide a significant contribution toward achieving EPA, state, and local mandated solid waste diversion goals. In addition, diverting food waste from landfills prevents uncontrolled emissions of its breakdown products, including methane—a potent greenhouse gas. Currently, only about 2.5% of food waste is recycled nationwide, and the principal technology is composting. While composting provides an alternative to landfill disposal of food waste, it requires large areas of land; produces volatile organic compounds (smog precursors), which are released into the atmosphere; and consumes energy. Consequently, better recycling alternatives to composting food waste should be explored. Anaerobic digestion has been successfully used for many years to stabilize municipal organic solid wastes, and to provide beneficial end products, i.e., methane gas and fertilizer. In California, approximately 137 wastewater treatment plants have anaerobic digesters, with an estimated excess capacity of 15-30% (Shang et. al., 2006). This excess digester capacity could provide an opportunity to recycle post-consumer food waste while producing renewable energy and reducing greenhouse gas emissions in California.
At the East Bay Municipal Utility District’s (EBMUD) Main Wastewater Treatment Plant (MWWTP), food waste is currently co-digested with primary and secondary municipal wastewater solids and other high-strength wastes. Due to the limitations at full-scale, and risks of overloading digesters, it has been difficult to accurately quantify methane gas production rates, mean cell residence time (MCRT) requirements, and volatile solids reduction values that are specific to food waste digestion. Bench-scale anaerobic digesters were fed only food waste pulp from EBMUD’s food waste processing system. The digesters were operated at both mesophilic and thermophilic temperatures, and at 15-, 10-, or 5-day MCRTs. In addition, anaerobic food waste digestion was compared with anaerobic municipal wastewater solids digestion to demonstrate the benefits of food waste digestion at wastewater treatment plants. Key digester design and operating criteria investigated included:
• Minimum MCRT.
• Volatile solids and chemical oxygen demand (COD) loading rates.
• Volatile solids reduction.
• Methane gas production rates.
• Process stability.
• Thermophilic and mesophilic operating temperatures.
The anaerobic digestion process is widely used to convert organic biomass (e.g., wastewater solids) into stabilized biomass. During the stabilization process, biomass is converted into methane gas, carbon dioxide, and water. Stabilization is measured as a reduction in volatile solids, and a reduction in fecal coliforms. Anaerobic refers to the process occurring without the presence of oxygen. The stabilization process encompasses complex interactions among bacteria.
Anaerobic Digestion of Food Waste Funding Opportunity No. EPA-R9-WST-06-004
1
The simplified version of stabilization occurs in three phases: hydrolysis, acetogenesis, and methanogenesis.
Hydrolysis is the first step where complex organics are converted to soluble organics through extracellular enzymes. Complex organics include carbohydrates, proteins, and lipids. The soluble organics include glucose, amino acids, fatty acids. Acetogenesis is the first complex step where acid producing bacteria (acetogens) convert soluble organics into volatile fatty acids, with acetic acid as the fully converted end point. Methanogenesis is the next step where the volatile fatty acids are converted to methane, and carbon dioxide. The growth rate of acetogens is much higher than that of methanogens, and the anaerobic digestion process requires a balance between these two populations so that the rate of acid formation does not outpace methane formation. If organic acids accumulate because the methanogen population is insufficient to convert the available organic acids into methane, the pH will drop, which may inhibit methanogens, resulting in even less methane produced.
The rate of conversion from hydrolysis to acetogenesis to methanogenesis is influenced by MCRT, temperature, pH, and the concentration of toxic inhibitors (e.g., ammonia). The key to successful digester operation is maintaining consistent operating conditions, such as temperature, and MCRT.
The majority of municipal anaerobic digesters in service operate in the mesophilic temperature range; however, in recent years thermophilic anaerobic digestion has been increasing in popularity due to its pathogen destruction capabilities and its ability to meet EPA’s Class A pathogen requirements, per EPA’s 503 regulations for biosolids land application (Gray, et. al., 2004). In addition, thermophilic digestion is more suited for breaking down wastes that contain fats, oils, and greases, compared to mesophilic digestion (Suto, et. al., 2006).
Anaerobic Digestion of Food Waste Funding Opportunity No. EPA-R9-WST-06-004
2

2.0 Materials and Methods
Digesters Two 30-L acrylic digesters were operated at either mesophilic or thermophilic temperatures, and at a 15-, 10-, and 5- day MCRT during the study. There were a total of four feed cycles, and four sludge drawdown cycles occurring at six hour intervals throughout the day. The sludge drawdown cycle occurred before the feed cycle to prevent short-circuiting. The frequency and duration of the feed cycles were adjusted with a programmable two-channel timer. The drawdown cycles were adjusted similarly in order to meet the target MCRT. To maintain the temperatures in the mesophilic and thermophilic digesters at 35 ºC and 50 ºC, respectively, each digester was placed in a water bath with circulating immersion heaters (VWR International, Inc., 13271-010, West Chester, PA). Digesters and water bath temperatures were continuously monitored and logged using thermocouples and LabVIEW® Virtual Benchlogger™ software. The digesters were sealed to be gas tight with silicone sealant, and they were fed food waste pulp (produced from the EBMUD food waste process) semi-continuously at a set flow rate using a dual-head peristaltic pump and controller (Masterflex, Cole-Parmer, Chicago, IL). The contents of each digester was mixed continuously with an externally mounted variable-speed DC motor (Dayton Electrical Mfg. Co., 4Z128, Niles, IL) that turned a stainless steel shaft with two 4-inch diameter impellers. Biogas volumes produced by the digesters were measured using wet-tip gas meters (Wet Tip Gas Meter Co., Nashville, TN) with a digital totalizer that counts 1 unit per 100mL of gas produced. To measure the digester sludge pH in situ, an 8-inch probe connected to an Orion 230A portable pH meter was inserted through a sampling port on the lid of the digesters. Figure 2.1 provides a schematic layout for one digester.
Anaerobic Digestion of Food Waste Funding Opportunity No. EPA-R9-WST-06-004
3

Figure 2.1 Bench-scale Anaerobic Food Waste Digester Schematic.
Preparation of Feed Five-gallon buckets of the final processed food waste slurry (called pulp) being fed to EBMUD’s full-scale digesters were collected weekly and stored in a refrigerator (maintained at approximately 4 to 8 ºC) for feed to the bench-scale digesters. The food waste evaluated during this study is representative of food waste available from restaurants, grocery stores, and produce markets throughout California, and around the U.S. Food waste was collected from local restaurants, grocery stores, and other food handling facilities that source separate food waste, and then pre-processed by a local waste hauler. The pre-processing included: screening to remove larger objects, a magnet to remove ferrous metals, and grinding to reduce particle size. After delivery of the pre-processed food waste by the hauler to EBMUD, the waste was slurried for pumping and underwent additional on-site processing to remove more contaminants. The on-site processing (EBMUD food waste process—patent pending) included pumping the food waste slurry through a rock trap and grinder to remove any remaining large debris, and then passing the food waste slurry through a paddle finisher to remove grit and smaller debris, such as plastics, rubber bands, and chopsticks. The paddle finisher is composed of 2-4 paddles that rotate along the inside length of a cylindrical screen, with 0.040 or 0.065 inch openings; modifications to the size openings could be explored. Soft biodegradable materials are pushed and extruded through the screen. After passing through the screen this material is called “pulp” . The harder materials, which are not extrudable through the screen openings, is called “pomace.” The pomace is transported by the paddles down the inside length of the screen and pushed out of the finisher. The pulp was pumped to EBMUD’s anaerobic digesters and the pomace was trucked to a landfill, but might be recycled with a dry digester (producing more methane gas for electricity generation), gasification (producing a synthetic gas for electricity generation and less residual solids), or some other process. The EBMUD process requires that all food waste materials be
Anaerobic Digestion of Food Waste Funding Opportunity No. EPA-R9-WST-06-004
4

small enough so that the slurry can be pumped through the process, therefore, some form of material size reduction prior to the EBMUD process may be necessary. The process is shown schematically in Figure 2.2. The pulp produced during this study was sampled and fed to the bench-scale digesters (see Gray (Gabb), et. al., 2008).
Initially, during the 10-day MCRT operating period, digester temperature periodically dropped below the target temperature following feed cycles. To address this observed temperature drop at lower MCRTs, due to the higher feeding rates, daily feed buckets were stored at room temperature (approximately 15 ºC) to minimize the feed stock temperature effect on digester temperature.
Sampling During the effluent discharge cycle, the digester sludge was collected in sample containers for analysis. Gas samples were collected in glass syringes with a luer lock connection from the digester gas line to the wet-tip gas meter.
Laboratory Analysis Feed and digester sludge samples were analyzed by the EBMUD Laboratory for total alkalinity (Standard Methods (SM), vol. 18, 2320B); total volatile acids (SM, vol. 18, 5560C); total ammonia (EPA 350.2/SM, vol. 20, 4500); total solids and volatile solids (SM, vol.18, 2540B, 2540 G/ EPA 160.3, 160.4); COD (SM, vol. 18, 5220D); fecal coliform (SM, vol. 18, 9221E); and gas composition (SM, vol. 18, 2720C). More specific information on the analytical methods can be found in the Quality Assurance Project Plan (QAPP) submitted to the EPA, separately from this report.
Figure 2.2 EBMUD Food Waste Treatment Process (Patent-Pending).
Anaerobic Digestion of Food Waste Funding Opportunity No. EPA-R9-WST-06-004
5

3.0 Results and Discussion
The following subsections present and discuss the significant findings from the data collected in this study. This data is also summarized in Appendix A, Table A-1. In addition, ammonia and nitrogen data are presented in Appendix C. Only data collected during stable operating periods are included in the summaries, except total solids, volatile solids , and COD for food waste feed and digester temperature. The data summarized for these parameters includes all data collected during digester operation at the target MCRTs. The average values for municipal wastewater solids on the accompanying figures are from a previous EBMUD digestion bench-scale study using municipal wastewater primary and thickened waste activated sludge, unless noted otherwise.
The digester operational targets included a baseline startup period for at least one MCRT, or until stable digester operation was observed. After the startup period, the digesters were to operate at a 15-day MCRT for a minimum of 3 MCRTs, followed by a 10-day MCRT for a minimum of 2 MCRTs, and a 5-day MCRT for a minimum of 2 MCRTs. The goal was to demonstrate the feasibility of digesting food waste at a higher rate than municipal wastewater solids, which has a minimum required MCRT of 15 days to meet the Class B requirements of the 40 Code of Federal Regulations, 503 regulations for land application.
Due to stability issues, the digesters were reseeded with new sludge during the 15-day and 10day MCRT periods, which extended the study schedule.
3.1 Mean Cell Residence Time
The mean cell residence time (MCRT) is the theoretical average time a bacterial cell remains in a digester. The shorter the MCRT, bacterial populations would need to reproduce faster to prevent being washed out of the digester. As the digester MCRT decreases the slower growing bacterial populations also decrease, until the MCRT is so short that the slower growing bacteria (e.g., methanogens) are eliminated from the digester. Eliminating the slower growing methanogenic bacteria usually results in a volatile acid accumulation in the digested sludge and consequently an incomplete digestion process.
The MCRT is a key parameter that is used to control process stability and determine the required digester volume. Longer MCRTs generally result in a more stable process and a higher degree of solids stabilization; however, this requires larger digesters and greater capital funding. Therefore, a tradeoff exists between process stability and capital costs.
In the municipal wastewater treatment industry, the minimum MCRT for an anaerobic digester is 15 days to meet the Class B requirements of the 503 regulations. In practice, the MCRT range is typically 15 to 30 days. For stable digester operation, however, it is also important to maintain a consistent MCRT that is long enough to maintain a sufficient methanogen population.
Food waste is composed of organic material, such as carbohydrates, proteins, and short-chain fats that are readily biodegradable. Municipal wastewater solids contain human waste that has already decomposed to a certain degree and is more resistant to further degradation. Because
Anaerobic Digestion of Food Waste Funding Opportunity No. EPA-R9-WST-06-004
6

food waste is more biodegradable than municipal wastewater solids, operating digesters fed only food waste at shorter MCRTs should be feasible. The benchmark 15-day MCRT was included in this study as a reference for comparison to the digestion of municipal wastewater solids, but 10- and 5-day MCRTs were also investigated to determine the minimum MCRT required for food waste.
MCRT was calculated on a daily basis after the initial startup period, using the measured volume of wasted sludge from the digesters over one day. The equation used to calculate MCRT is as follows:
MCRT, days = Active digester volume , L Daily digester sludge volume wasted, L/day
Table 3.1 summarizes the digester MCRT data during the study. Figure 3.1 shows the actual MCRTs compared to the target MCRTs along with the days when the digesters were restarted.
Table 3.1 Bench-scale Anaerobic Food Waste Digester MCRT Summary. Target MCRT,
days Mesophilic Digester MCRT,
days Thermophilic Digester MCRT,
days AVG SD AVG SD
15 15.6 1.2 14.7 1.2 10 10.1 0.6 9.9 0.7 5 5.3 0.2 5.3 0.3
Notes: 1. AVG=average value. 2. SD= standard deviation.
Anaerobic Digestion of Food Waste Funding Opportunity No. EPA-R9-WST-06-004
7

15 days 10 days
5 days
Figure 3.1 Anaerobic Food Waste Digester Mean Cell Residence Time M
CR
T (d
ays)
11/25/06 12/9/06 12/23/06 1/6/07 1/20/07 2/3/07 2/17/07 3/3/07 3/17/07
Date
15- day MCRT Initially, there was some difficulty in maintaining the MCRT at 15 days since the flow rate of the waste and feed pumps required frequent adjustments due to the varying thickness of the feed. Once the target MCRT was reached, however, the MCRT was relatively stable. The target 15day MCRT was operated for a total of three MCRTs from 11/27/06 to 1/8/07. Both the thermophilic and mesophilic digesters were restarted due to instability based on the volatile acids and alkalinity data. The instability coincided with substantial temperature variations which are discussed in the next section (Section 3.2). The thermophilic digester was restarted on 12/14/06 after 16 days of operation, and operated for 25 days before the MCRT was reduced to 10 days. The mesophilic digester was restarted after 36 days of continuous operation on 1/3/07, and ran for 4 days before another restart on 1/8/07, one day prior to the switch to a 10-day MCRT.
10- day MCRT The digesters were operated at a 10-day MCRT from 1/9/07 to 3/2/07. The mesophilic digester was restarted on 1/29/07, after 20 days of operation. It was operated for an additional 32 days before the switch to a 5-day MCRT. The thermophilic digester was restarted on 2/9/07 after 31 days of operation at a 10-day MCRT, and operated for another 21 days before the switch to a 5day MCRT.
20
15
10
5
0
Thermo Reseed 12/14/06 Meso Reseed 1/3/07,1/8/07,1/29/07 Thermo Reseed 2/9/07
Thermo Test Meso Test Target
Anaerobic Digestion of Food Waste Funding Opportunity No. EPA-R9-WST-06-004
8
5- day MCRT The 5-day MCRT operational period was from 3/3/07 to 3/17/07 (almost 3 MCRTs), and neither digester was restarted during this time.
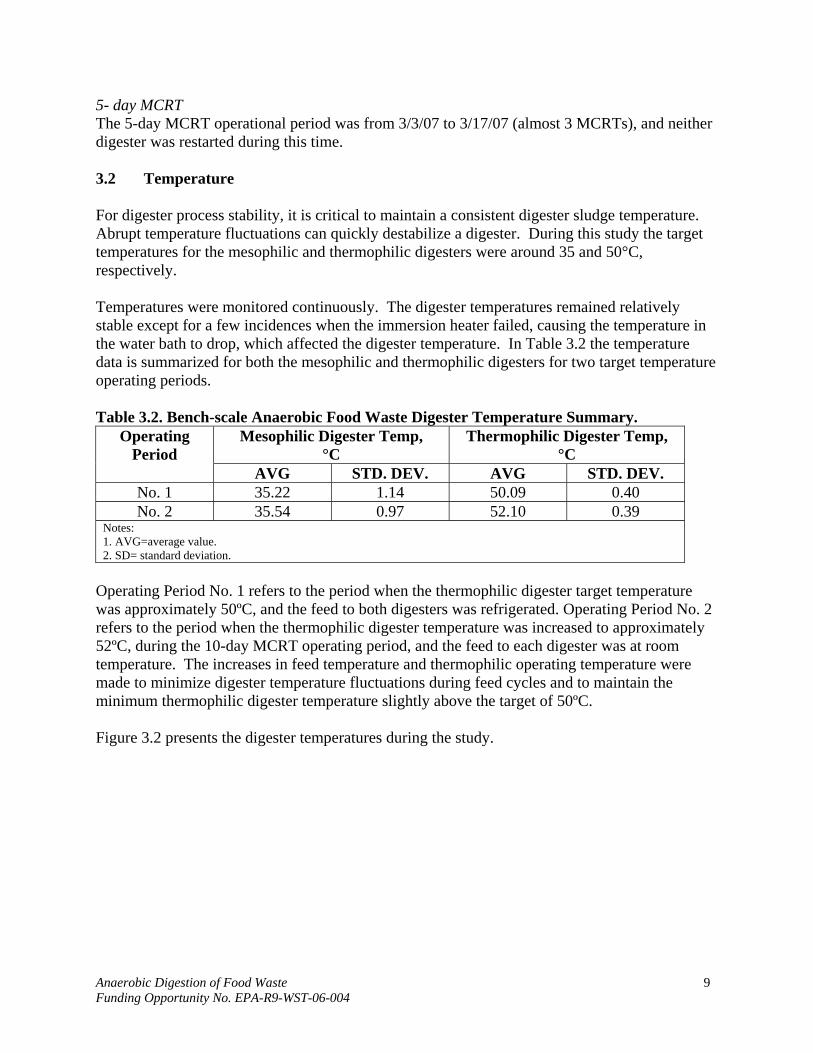
3.2 Temperature
For digester process stability, it is critical to maintain a consistent digester sludge temperature. Abrupt temperature fluctuations can quickly destabilize a digester. During this study the target temperatures for the mesophilic and thermophilic digesters were around 35 and 50°C, respectively.
Temperatures were monitored continuously. The digester temperatures remained relatively stable except for a few incidences when the immersion heater failed, causing the temperature in the water bath to drop, which affected the digester temperature. In Table 3.2 the temperature data is summarized for both the mesophilic and thermophilic digesters for two target temperature operating periods.
Table 3.2. Bench-scale Anaerobic Food Waste Digester Temperature Summary. Operating
Period Mesophilic Digester Temp,
°C Thermophilic Digester Temp,
°C AVG STD. DEV. AVG STD. DEV.
No. 1 35.22 1.14 50.09 0.40 No. 2 35.54 0.97 52.10 0.39
Notes: 1. AVG=average value. 2. SD= standard deviation.
Operating Period No. 1 refers to the period when the thermophilic digester target temperature was approximately 50ºC, and the feed to both digesters was refrigerated. Operating Period No. 2 refers to the period when the thermophilic digester temperature was increased to approximately 52ºC, during the 10-day MCRT operating period, and the feed to each digester was at room temperature. The increases in feed temperature and thermophilic operating temperature were made to minimize digester temperature fluctuations during feed cycles and to maintain the minimum thermophilic digester temperature slightly above the target of 50ºC.
Figure 3.2 presents the digester temperatures during the study.
Anaerobic Digestion of Food Waste Funding Opportunity No. EPA-R9-WST-06-004
9

Tem
pera
ture
(C)
Figure 3.2 Anaerobic Food Waste Digester Temperature
20
25
30
35
40
45
50
55
11/25/06 12/9/06 12/23/06 1/6/07 1/20/07 2/3/07 2/17/07 3/3/07 3/17/07
Date
Start 10d MCRT 1/9/2007
(2/13/07)
Start 5d MCRT 3/3/2007
Start 15d MCRT 11/27/2006
New Target Temp for Thermo: 52 C, and Feed at Room Temperature.
Thermo Test Meso Test
Water bath heater failures occurred during the study which drastically lowered the operating temperature in both mesophilic and thermophilic digesters (see temperature drops in Figure 3.2). Each failure event resulted from heavy electrical load on the heaters during the colder months. The minimum temperatures reached by the digesters due to the heater failures were 41.4 ºC (1/15/07) and 29.3 ºC (12/18/06) for thermophilic and mesophilic digesters, respectively. In order to prevent further temperature changes because of failing heaters, back-up heaters were added for a total of two heaters in each bath.
As the MCRT was decreased, digester temperature fluctuations increased during feed cycles. This was due to the increased amount of refrigerated feed that caused the digester temperature to drop. To minimize temperature fluctuations, the thermophilic digester temperature set-point was increased, and the daily feed was removed from the refrigerator and brought to room temperature.
On 2/13/07, the target temperature for the thermophilic digester was increased to 52 ºC so the minimum digester temperature would remain above 50 ºC. Also, to prevent temperature fluctuations from feeding refrigerated feed sludge, digester feed was stored at room temperature (approximately 15 ºC) but replaced with fresh feed on a daily basis.
By adding a redundant heater to each water bath, the larger temperature fluctuations were eliminated and the digester temperatures were maintained at an average of 52.4 ºC and 35.6 ºC for thermophilic and mesophilic digesters, respectively.
Anaerobic Digestion of Food Waste 10 Funding Opportunity No. EPA-R9-WST-06-004

There appeared to be a correlation between severe temperature fluctuations, and digester stability for both mesophilic and thermophilic digesters. As temperature increased or decreased for either the mesophilic or thermophilic digester, the volatile acids increased in response. By maintaining a steady temperature with minimal variations, digester operation became more stable. For the thermophilic digester, maintaining a minimum temperature above 50 ºC resulted in stable operation. For the mesophilic digester, maintaining a minimum temperature above 35 ºC resulted in stable operation. This is discussed in more detail in Section 3.5.
3.3 pH
To maintain a healthy population of methanogens, the pH in an anaerobic digester is typically maintained between 7 and 7.5. The pH is maintained by a balance between the acetogens and methanogens. Acetogens produce acid, and methanogens consume acid (increasing alkalinity) to produce methane gas. Therefore, if the acetogens outpace the methanogens, the pH will drop, which can inhibit methanogens, and ultimately lead to an upset, or ‘sour’ digester. The means to anticipate a significant pH drop is to monitor digester sludge volatile acids, alkalinity, and gas quality and production, which is discussed in subsequent sections. pH is not a sensitive monitoring process parameter, as a significant change may indicate it is too late to make adjustments to stabilize digester operation, and will most likely require a long period of time to recover.
pH was monitored on a daily basis. For most of the study, the pH remained in a stable operating range between 7 and 8, which was consistent with the average pH of 7.44 during previous EBMUD bench-scale anaerobic digestion studies. There were a few occurrences when the digester pH dropped significantly, which indicated unstable operation and required restarting the digesters with new seed sludge from EBMUD’s full-scale digesters. Table 3.3 summarizes the digester pH data for each target MCRT operating period. Figure 3.3 shows daily pH for each digester.
Table 3.3. Bench-scale Anaerobic Food Waste Digester pH Summary. Target MCRT,
days Mesophilic Digester pH Thermophilic Digester pH
AVG SD AVG SD 15 7.41 0.13 7.47 0.13 10 7.26 0.24 7.45 0.24 5 6.94 0.23 7.00 0.20
Notes: 1. AVG=average value. 2. SD= standard deviation.
Anaerobic Digestion of Food Waste Funding Opportunity No. EPA-R9-WST-06-004
11
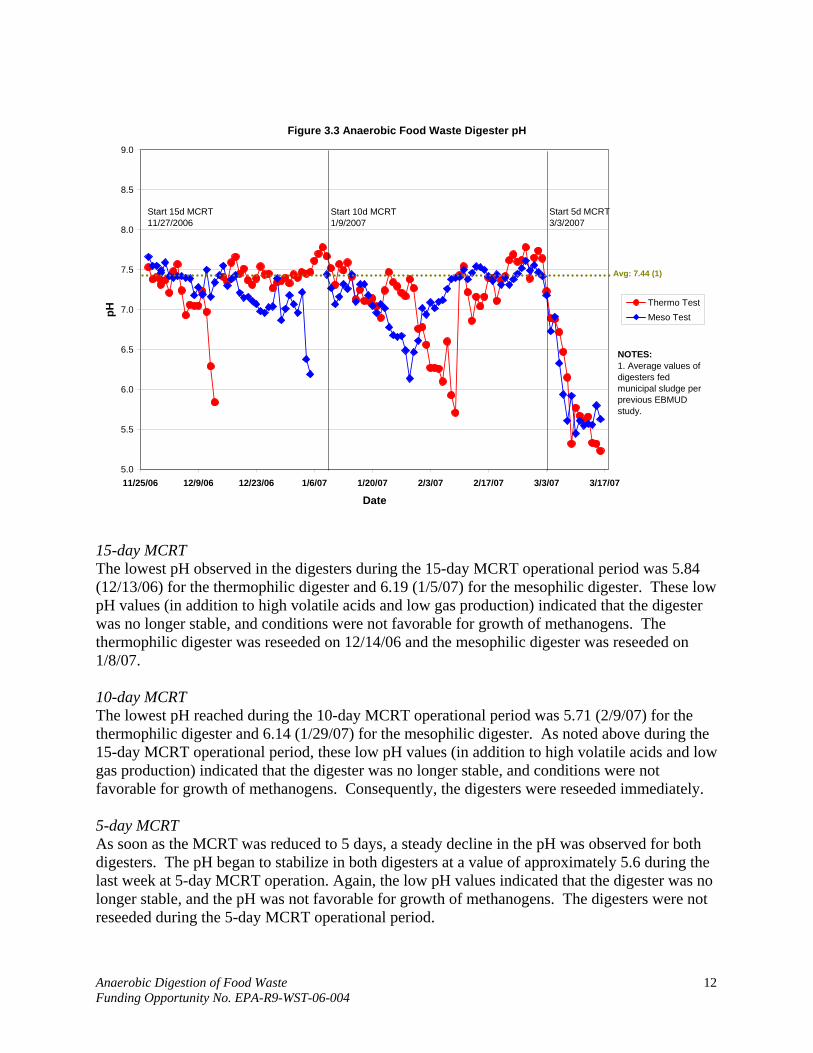
Figure 3.3 Anaerobic Food Waste Digester pH
pH
9.0
8.5
8.0
7.5
7.0
6.5
6.0
5.5
5.0
Start 15d MCRT 11/27/2006
Start 10d MCRT 1/9/2007
Start 5d MCRT 3/3/2007
Avg: 7.44 (1)
Thermo Test Meso Test
NOTES: 1. Average values of digesters fed municipal sludge per previous EBMUD study.
11/25/06 12/9/06 12/23/06 1/6/07 1/20/07 2/3/07 2/17/07 3/3/07 3/17/07
Date
15-day MCRT The lowest pH observed in the digesters during the 15-day MCRT operational period was 5.84 (12/13/06) for the thermophilic digester and 6.19 (1/5/07) for the mesophilic digester. These low pH values (in addition to high volatile acids and low gas production) indicated that the digester was no longer stable, and conditions were not favorable for growth of methanogens. The thermophilic digester was reseeded on 12/14/06 and the mesophilic digester was reseeded on 1/8/07.
10-day MCRT The lowest pH reached during the 10-day MCRT operational period was 5.71 (2/9/07) for the thermophilic digester and 6.14 (1/29/07) for the mesophilic digester. As noted above during the 15-day MCRT operational period, these low pH values (in addition to high volatile acids and low gas production) indicated that the digester was no longer stable, and conditions were not favorable for growth of methanogens. Consequently, the digesters were reseeded immediately.
5-day MCRT As soon as the MCRT was reduced to 5 days, a steady decline in the pH was observed for both digesters. The pH began to stabilize in both digesters at a value of approximately 5.6 during the last week at 5-day MCRT operation. Again, the low pH values indicated that the digester was no longer stable, and the pH was not favorable for growth of methanogens. The digesters were not reseeded during the 5-day MCRT operational period.
Anaerobic Digestion of Food Waste Funding Opportunity No. EPA-R9-WST-06-004
12

3.4 Digester Gas Production
Organic carbon (as represented by chemical or biochemical oxygen demand) is removed in anaerobic digesters through its conversion into methane and carbon dioxide gas by methanogenic bacteria. Gas production is an indicator of how well the anaerobic digestion process is performing. Gas production is influenced by the characteristics of the waste stream applied to the digester, digester temperature, and organic loading rate to the digester. For example, fats and greases have a higher gas production rate per unit mass destroyed than proteins or carbohydrates. Gas production will also be influenced by how readily wastes are biodegraded.
Gas production was monitored continuously and then averaged on a daily basis. Table 3.4 summarizes the gas production during each operational period. Figure 3.4 presents the gas production for both the mesophilic and thermophilic digesters during the study. The gaps between data points resulted from leaks in the gas line, which were repaired after restarting the digesters.
Table 3.4. Bench-scale Anaerobic Food Waste Digester Gas Production Summary. Target MCRT,
days Mesophilic Digester Gas
Production, L/hr Thermophilic Digester Gas
Production, L/hr AVG SD AVG SD
15 4.0 0.7 4.8 1.6 10 4.5 0.8 5.4 1.5 5 NA NA NA NA
Notes: 1. AVG=average value. 2. SD= standard deviation. 3. NA=Not Applicable because only one data point was observed during stable period.
Anaerobic Digestion of Food Waste Funding Opportunity No. EPA-R9-WST-06-004
13

Figure 3.4 Anaerobic Food Waste Digester Gas Production
Gas
Pro
duct
ion
(L/h
r)
0
2
4
6
8
10
12
11/25/06 12/9/06 12/23/06 1/6/07 1/20/07 2/3/07 2/17/07 3/3/07 3/17/07
Date
Start 5d MCRT 3/3/2007
Typical Avg: 1.3 L/hr(1)
Start 10d MCRT 1/9/2007
Start 15d MCRT 11/27/2006
Thermo Test Meso Test
NOTES: 1. Average values of digesters fed municipal sludge per previous EBMUD study.
15-day MCRT The thermophilic digester showed a steady increase in gas production prior to the switch to 10day MCRT operation. Fluctuation in gas production was observed in both digesters. The gas fluctuations appeared to result from both variations in feed strength, and also from periods of digester instability that resulted from digester temperature change. During stable operational periods, the gas production averaged 4.8 L/ hr (standard deviation 1.6 L/hr) for the thermophilic digester, and 4 L/hr (standard deviation 0.7 L/hr) for the mesophilic digester. Compared to the average gas production of 1.3 L/hr at a 15-day MCRT from a previous EBMUD digestion pilot study feeding municipal wastewater solids, food waste provides over a 3 fold increase in gas production. Based on the data in this study, gas production appears to increase when anaerobic digesters are operated at thermophilic rather than mesophilic temperatures, which may be attributed to the higher growth rate of the methanogens at higher temperatures. The changes in feed strength in the form of volatile solids (VS) loading and chemical oxygen demand (COD) loading due to feed changes are discussed in Sections 3.8 and 3.12. For the thermophilic digester, gas production continued to increase during the 15-day MCRT period and peaked at 10.8 L/hr, which was the highest observed during the study. The continued increase in gas production was likely due to an increase in volatile solids loading rate, as discussed in Section 3.8. Higher loading rates occurred during the shorter MCRT periods, but peak gas production was never as high as during the 15-day MCRT operational period. This is likely the result of the lower wasting rates at the 15-day MCRT, which would allow higher populations of the slower growing methanogens to develop and produce more methane gas.
Anaerobic Digestion of Food Waste Funding Opportunity No. EPA-R9-WST-06-004
14

10-day MCRT During stable operational periods, the gas production averaged 5.4 L/ hr (standard deviation 1.5 L/hr) for the thermophilic digester and 4.5 L/hr (standard deviation 0.8 L/hr) for the mesophilic digester. Average gas production increased during the 10-day MCRT operational period, compared to the 15-day MCRT period, resulting from an increase in organic loading to the digesters.
5-day MCRT Gas production first increased sharply and then dropped off sharply (as presented in Figure 3.4) when both thermophilic and mesophilic digesters were operated at a 5-day MCRT; although gas production was typically higher in the thermophilic digester compared to the mesophilic digester. The lower gas production was likely due to the methanogens growth rate being too slow for the 5-day MCRT, resulting in a washout of methanogens. The initial jump in gas production was likely due to the higher organic loading in the presence of a sufficient methanogen population, which later washed out.
3.5 Total Alkalinity and Total Volatile Acids
Total alkalinity (TALK) represents the acid neutralizing capacity in the digester, and is important because it indicates the ability of the digester to buffer an increase in acid. If alkalinity is increasing, then the methanogen population is growing. If the alkalinity is being reduced, then the acetogens are producing volatile acids at a faster rate than the methanogens ability to convert the volatile acids into methane, leaving acids available to consume alkalinity.
Total volatile acids (TVA) are short-chain organic acids, or volatile fatty acids, measured as acetic acid in mg/L. Complex organic compounds such as carbohydrates, longer-chain fats, and proteins are broken down during acetogenesis to produce TVAs. TVA concentrations are used to indicate the balance between acetogens and methanogens. If TVA concentrations continue to increase, it indicates that the methanogens are not able to grow as quickly as the acetogens.
Combining TVA and TALK in a ratio is a useful tool to monitor digester stability, since the ratio can indicate if the acids are out of balance with the alkalinity. For municipal wastewater solids digested at mesophilic temperatures, a conservative TVA/TALK ratio of 0.1 or less has been used as a safe operating zone. TVA/TALK ratio trends are monitored regularly to assess digester stability.
TALK and TVA were sampled twice weekly during the study to monitor digester stability. Figure 3.5 presents the TALK trend. Figure 3.6 presents the TVA trend. Figure 3.7 presents the TVA/TALK ratio trend in the digesters.
Anaerobic Digestion of Food Waste Funding Opportunity No. EPA-R9-WST-06-004
15

Tota
l Vol
atile
Aci
ds (m
g A
cetic
Aci
d/L)
To
tal A
lkal
inity
(mg
CaC
O3/
L)
Figure 3.5 Anaerobic Food Waste Digester Total Alkalinity 14,000
12,000
10,000
8,000
6,000
4,000
2,000
Start 15d MCRT 11/27/2006
Start 10d MCRT 1/9/2007
Start 5d MCRT 3/3/2007
Typical Avg: 9,000 mg/L(1)
11/25/06 12/9/06 12/23/06 1/6/07 1/20/07 2/3/07 2/17/07 3/3/07
Date
Figure 3.6 Anaerobic Food Waste Digester Total Volatile Acids 25,000
20,000
15,000
10,000
5,000
0
Start 5d MCRT 3/3/2007
Typical Thermo Avg: 540 mg/L(1)
Start 10d MCRT 1/9/2007
Start 15d MCRT 11/27/2006
11/25/06 12/9/06 12/23/06 1/6/07 1/20/07 2/3/07 2/17/07 3/3/07
Date
Thermo Test Meso Test
NOTES: 1. Average values of digesters fed municipal sludge per previous EBMUD study.
3/17/07
Thermo Test Meso Test
NOTES: 1. Average values of digesters fed municipal sludge per previous EBMUD study.
Typical Meso Avg: 249 mg/L(1)
3/17/07
Anaerobic Digestion of Food Waste Funding Opportunity No. EPA-R9-WST-06-004
16

Figure 3.7 Anaerobic Food Waste Digester Total Volatile Acids to Total Alkalinity Ratio
TVA
/TA
LK (m
g A
cetic
Aci
d/ m
g C
aCO
3)
5.0
4.5
4.0
3.5
3.0
2.5
2.0
1.5
1.0
0.5
0.0
Start 15d MCRT 11/27/2006
Start 10d MCRT 1/9/2007
Start 5d MCRT 3/3/2007
Typical Avg: 0.05(1)
Thermo Test Meso Test
NOTES: 1. Average values of digesters fed municipal sludge per previous EBMUD study.
11/25/06 12/9/06 12/23/06 1/6/07 1/20/07 2/3/07 2/17/07 3/3/07 3/17/07
Date
15-day MCRT During the 15-day MCRT operational period, TALK remained relatively stable, while TVAs fluctuated significantly.
Because the volatile acids in the thermophilic digester continued to increase, the thermophilic digester was restarted with new thermophilic anaerobic digested sludge from an EBMUD full-scale digester. After the thermophilic digester was reseeded on 12/14/2006, TVAs gradually increased from approximately 1,000 mg/L to a peak of 4,800 mg/L, and then began to steadily decrease to 1,700 mg/L prior to the change to 10-day MCRT.
During the 15-day MCRT operational period, the TALK for the thermophilic digester reached a peak of 10,000 mg/L (as CaCO3 mg/L), but dropped to approximately 8,000 mg/L prior to the digester being reseeded. Overall, the digester alkalinity was within a stable range. After the 12/14/2006 digester reseeding, TALK remained steady around 8,000 mg/L before increasing to 11,000 mg/L.
TALK remained stable, and slightly decreased to 7,000 mg/L as TVAs increased after the heater failure. The mesophilic digester TVAs remained stable, typically less than 500 mg/L, with a maximum of 2,000 mg/L. After the heater failed on 12/18/2006, however, TVAs steadily increased to 12,000 mg/L before the digester was reseeded.
During stable operation, the thermophilic digester TVA/TALK average was 0.28, and the mesophilic digester TVA average was 0.09. During this period, the mesophilic digester operated
Anaerobic Digestion of Food Waste Funding Opportunity No. EPA-R9-WST-06-004
17

at a lower TVA/TALK ratio, and with less variation than the thermophilic digester. Both of these ratios are close to or higher than typical values for stable digesters fed municipal wastewater solids (i.e., TVA/TALK < 0.1), and may indicate that when digesting food waste at higher temperatures, a higher TVA/TALK ratio should be anticipated.
10-day MCRT As observed during the 15-day MCRT operational period, TALK remained in a stable range for both thermophilic and mesophilic digesters, while TVAs fluctuated considerably during the 10day MCRT operation. For the thermophilic digester, TVAs increased to 14,000 mg /L after the heater failed on 1/15/2007. TVAs dropped to 4,300 mg /L briefly, before TVAs continued to increase up to 20,000 mg/L prior to reseeding the digester. After the digester was reseeded, the temperature setting was increased to 52°C and the feed was brought to room temperature on a daily basis, which reduced the drop in digester temperature during feed cycles. These two changes allowed more stable digester temperatures, which appeared to provide more stable digester operation as TVAs continued to decline and reached 2,700 mg/L before switching to 5day MCRT operation.
For the mesophilic digester, TVAs increased to a peak of 20,000 mg/L on 1/29/2007 after the change to 10-day MCRT operation. After reseeding the digester, TVAs slightly increased to approximately 7,800 mg/L on 2/13/2007. The feed was then brought to room temperature on a daily basis, which led to a slight increase in digester temperature, and more stable digester temperature during feed cycles. TVAs began to gradually decrease to below 500 mg/L before the change to 5-day MCRT operation.
The large fluctuations in the TVA/TALK ratio were due to fluctuations in TVAs, which as previously discussed, were mostly a result of the temperature fluctuations and the use of refrigerated feed, which became more important as the MCRT was decreased and more cold feed was added on a daily basis. During stable operation, the thermophilic and mesophilic digester TVA/TALK ratio averages were 0.45 (SD 0.18) and 0.56 (SD 0.40), respectively. During this period, the thermophilic digester operated at a lower TVA/TALK ratio, and with less variation than the mesophilic digester.
5-day MCRT TVAs in both thermophilic and mesophilic digesters increased significantly following the switch to 5-day MCRT operation, while the alkalinity decreased significantly.
The TVA/TALK ratio increase corresponded to the increase in TVAs and decrease in TALK during the 5-day MCRT operation. The loss of digester stability was most likely the result of the methanogen’s growth rate being too slow to maintain a sufficient population causing a washout of the existing methanogenic bacteria, and ultimately leading to an acid digester.
Anaerobic Digestion of Food Waste Funding Opportunity No. EPA-R9-WST-06-004
18
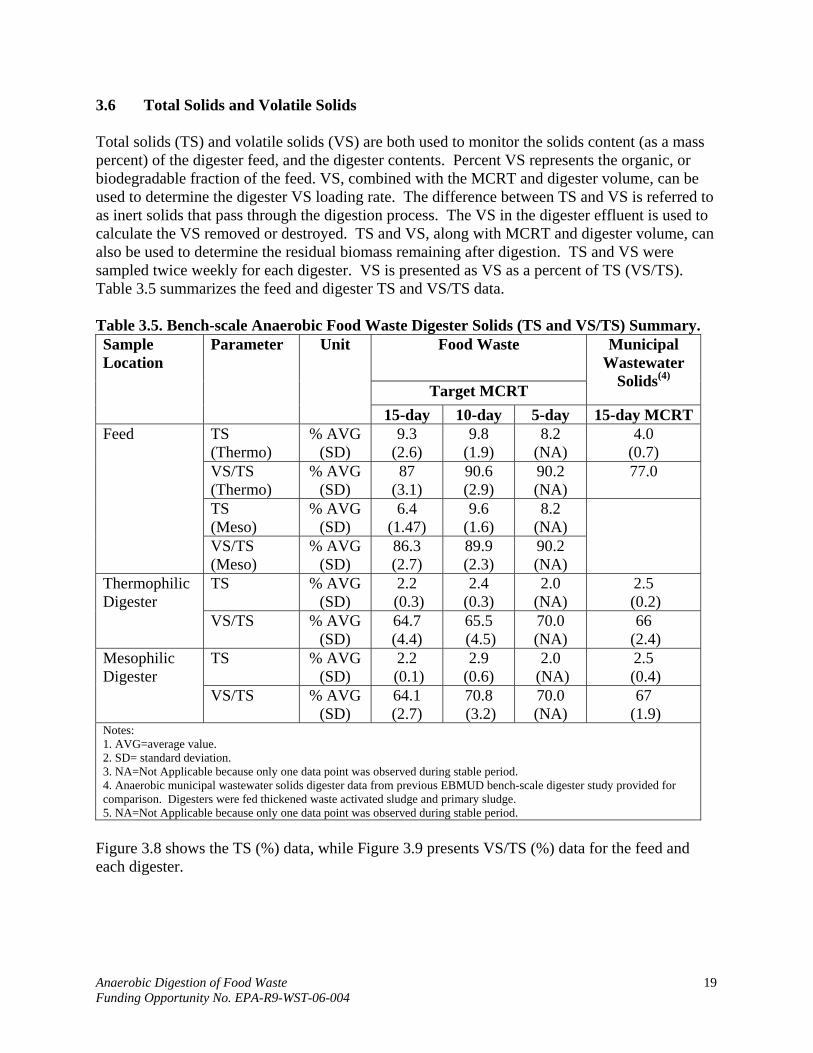
3.6 Total Solids and Volatile Solids
Total solids (TS) and volatile solids (VS) are both used to monitor the solids content (as a mass percent) of the digester feed, and the digester contents. Percent VS represents the organic, or biodegradable fraction of the feed. VS, combined with the MCRT and digester volume, can be used to determine the digester VS loading rate. The difference between TS and VS is referred to as inert solids that pass through the digestion process. The VS in the digester effluent is used to calculate the VS removed or destroyed. TS and VS, along with MCRT and digester volume, can also be used to determine the residual biomass remaining after digestion. TS and VS were sampled twice weekly for each digester. VS is presented as VS as a percent of TS (VS/TS). Table 3.5 summarizes the feed and digester TS and VS/TS data.
Table 3.5. Bench-scale Anaerobic Food Waste Digester Solids (TS and VS/TS) Summary. Sample Location
Parameter Unit Food Waste Municipal Wastewater
Solids(4) Target MCRT
15-day 10-day 5-day 15-day MCRT Feed TS
(Thermo) % AVG
(SD) 9.3
(2.6) 9.8
(1.9) 8.2
(NA) 4.0
(0.7) VS/TS (Thermo)
% AVG (SD)
87 (3.1)
90.6 (2.9)
90.2 (NA)
77.0
TS (Meso)
% AVG (SD)
6.4 (1.47)
9.6 (1.6)
8.2 (NA)
VS/TS (Meso)
% AVG (SD)
86.3 (2.7)
89.9 (2.3)
90.2 (NA)
Thermophilic Digester
TS % AVG (SD)
2.2 (0.3)
2.4 (0.3)
2.0 (NA)
2.5 (0.2)
VS/TS % AVG (SD)
64.7 (4.4)
65.5 (4.5)
70.0 (NA)
66 (2.4)
Mesophilic Digester
TS % AVG (SD)
2.2 (0.1)
2.9 (0.6)
2.0 (NA)
2.5 (0.4)
VS/TS % AVG (SD)
64.1 (2.7)
70.8 (3.2)
70.0 (NA)
67 (1.9)
Notes: 1. AVG=average value. 2. SD= standard deviation. 3. NA=Not Applicable because only one data point was observed during stable period. 4. Anaerobic municipal wastewater solids digester data from previous EBMUD bench-scale digester study provided for comparison. Digesters were fed thickened waste activated sludge and primary sludge. 5. NA=Not Applicable because only one data point was observed during stable period.
Figure 3.8 shows the TS (%) data, while Figure 3.9 presents VS/TS (%) data for the feed and each digester.
Anaerobic Digestion of Food Waste Funding Opportunity No. EPA-R9-WST-06-004
19

2
4
16
Figure 3.8 Anaerobic Food Waste Digester Total Solids
Start 15d MCRT 11/27/2006
Start 10d MCRT 1/9/2007
Start 5d MCRT 3/3/2007
Typical Feed Avg: 4 %(1)
Typical Digester Avg: 2 %(1)
14
12
Tota
l Sol
ids
(%)10
Feed 8 Thermo Test
Meso Test
6 NOTES: 1. Average values of digesters fed municipal sludge per previous EBMUD study.
0 11/25/06 12/9/06 12/23/06 1/6/07 1/20/07 2/3/07 2/17/07 3/3/07 3/17/07
Date
Figure 3.9 Anaerobic Food Waste Digester VS/TS 100%
Start 15d MCRT 11/27/2006
Start 10d MCRT 1/9/2007
Start 5d MCRT 3/3/2007
Typical Feed Avg 77% (1)
Typical Digested Sludge Average 65% (1)
95%
90%
85%
80%
VS/T
S (%
)
Feed 75% Thermo Test
Meso Test
70% NOTES: 1. Average values of
65% digesters fed municipal sludge per previous EBMUD study.
55%
50%
60%
11/25/06 12/9/06 12/23/06 1/6/07 1/20/07 2/3/07 2/17/07 3/3/07 3/17/07
Date
Anaerobic Digestion of Food Waste Funding Opportunity No. EPA-R9-WST-06-004
20

As shown in Figure 3.8, food waste is typically fed at more than two times the TS concentration of municipal wastewater solids, which is typically about 4%. Figure 3.9 shows that food waste has a higher VS/TS (usually over 85%) than municipal wastewater solids which is typically around 77%. The higher solids content means that food waste provides a more efficient use of digester volume and so required digester volume is less for food waste than for municipal wastewater solids. The higher VS/TS also means that more of the food waste can be consumed by digester bacteria, yielding more energy, and producing less inert residual biosolids to haul off compared to municipal wastewater solids.
15-day MCRT TS and VS/TS of mesophilic and thermophilic digesters remained stable during the 15-day MCRT operational period. The feed TS gradually increased to over 12%, but the average TS was 8% during this period. The TS in the mesophilic and thermophilic digesters trended closely until the feed TS began to increase. The thermophilic TS slightly increased compared to the mesophilic TS. However, both digesters were operating near the TS of a municipal digester, even though the feed TS averaged two times that of average municipal wastewater solids feed. This demonstrates that food waste is more degradable than municipal wastewater solids, and will not significantly increase residual solids remaining for disposal, even at a higher feed TS.
During this period, the food waste feed VS/TS was well above the VS/TS of typical municipal wastewater solids. The mesophilic and thermophilic digesters trended closely together. The thermophilic digester VS/TS averaged slightly higher than the mesophilic digester, which was most likely a result of the temperature fluctuations discussed earlier in Section 3.2 resulting in more unstable periods for the thermophilic digester. Both digesters averaged a slightly higher VS/TS compared to municipal wastewater solids digestion. However, the values are fairly close, and at times were actually less than that of the municipal wastewater solids average value. This shows that even though the feed VS/TS of food waste is significantly higher than that of municipal wastewater solids, the digested sludge VS/TS can be close to that of municipal wastewater solids.
10-day MCRT During the 10-day MCRT operational period, the feed TS varied, but had an overall increasing trend. The average feed sludge during this period was 9.6%, which was higher compared to the feed sludge during the 15-day MCRT period. The TS gradually increased for both the mesophilic and thermophilic digesters, and both were trending closely with each other until February 8, 2007, when the TS for the thermophilic digester dropped, while the TS for the mesophilic digester continued to rise. During this period, the feed solids TS gradually increased, and peaked at 11%. The mesophilic digester TS peaked at 4%, and then began to decrease to match the TS of the thermophilic digester. The thermophilic digester TS increased gradually to a peak of 3.1%, before dropping gradually to 2% at the end of the period. It is worth noting that the TS for both digesters decreased after the temperature in both digesters increased. This illustrates the importance of maintaining a minimum digester temperature, and the impacts on TS in the digester. Comparing the mesophilic to thermophilic operation, the overall TS was less for the thermophilic digester, suggesting that thermophilic temperatures provide better digester performance by reducing the digester solids content, compared to digesters operated at mesophilic temperature.
Anaerobic Digestion of Food Waste Funding Opportunity No. EPA-R9-WST-06-004
21

By the end of the 10-day MCRT operational period, the mesophilic digester VS/TS had dropped to the level observed in the thermophilic digester. Overall, it appears that anaerobic digesters operated at thermophilic temperatures are better able to reduce the VS, compared to digesters operated at mesophilic temperature. However, both digesters fed food waste maintained a VS/TS close to that of municipal wastewater solids, even though the feed sludge had a considerably higher TS and VS/TS than typical municipal feed sludge. This was observed at both mesophilic and thermophilic temperatures, and also at the shorter 10-day MCRT operational period.
5-day MCRT During the 5-day MCRT operational period, the feed TS continued to increase, and peaked at 14%. Interestingly, the digester sludge TS did not significantly increase at either thermophilic or mesophilic digesters during this period. This shows that the food waste solids can be broken down under acid digester conditions, but without the benefit of methane gas production.
Digester sludge VS/TS for both mesophilic and thermophilic digesters increased during this period due to an increase in feed VS/TS. However, during this period, the thermophilic digester maintained a slightly lower VS/TS, again showing that temperature is significant for bacterial growth at low MCRTs in order to sustain a population to breakdown volatile solids.
3.7 Volatile Solids Loading Rate
The VS loading rate is often used to monitor the organic loading applied to anaerobic digesters. The VS loading rate can be used in conjunction with other parameters, such as TVA and TALK to monitor impacts of digester organic load on digester stability. Municipal sludge VS loading rates typically range from 0.12 to 0.16 lb VS per cubic foot of active digester volume per day (lb/ ft3-day) for stable mesophilic digesters (WEF, 1998).
The VS loading rate was calculated using the measured VS of the feed, digester volume, and the feed rate. The following simplified equation was used:
VSload (lb/ft3-day) = VS%feed X Feed Rate (L/day) ×0.62 (conversion factor) Digester Volume (L)
The conversion factor above resulted from converting solids percent by mass to pounds of solids, and converting liters of digester volume to cubic feet.
Table 3.6 summarizes the average VS loading rate for both the food waste-fed thermophilic and mesophilic digesters during the study
Anaerobic Digestion of Food Waste Funding Opportunity No. EPA-R9-WST-06-004
22

Table 3.6. Bench-Scale Anaerobic Food Waste Digester Volatile Solids Loading Rate Summary.
Target MCRT, days
Mesophilic VS Loading, lb/ ft3-day
Thermophilic VS Loading, lb/ ft3-day
AVG SD AVG SD 15 0.22 0.05 0.35 0.12 10 0.53 0.09 0.55 0.10 5 0.87 NA 0.87 NA
Notes: 1. AVG=average value. 2. SD= standard deviation. 3. NA=Not Applicable because only one data point was observed during stable period.
Figure 3.10 shows the VS loading rate for each bench-scale food waste-fed digester.
As shown in Figure 3.10, both digesters had nearly the same VS loading rate. Compared to municipal wastewater solids loading rates, food waste can be applied 3 times higher or more. Higher food waste loading rates might be achieved compared to those observed at 15-day and 10-day MCRTs, but would require a higher TS percent in the feed applied to the digesters. During the 5-day MCRT operational period, the acid digester conditions were most likely due to washout of the methanogens, as their growth rate was not high enough to keep up with a 5-day MCRT wasting rate.
Figure 3.10 Anaerobic Food Waste Digester Volatile Solids Loading Rate
VS L
oadi
ng R
ate
(lb/ft
3 -day
)
1.8
1.6
1.4
1.2
Start 15d MCRT 11/27/2006
Recommended maximum: 0.2 lb VS/ft3-day*
Start 10d MCRT 1/9/2007
Start 5d MCRT 3/3/2007
Thermo Test
Meso Test 1
0.8
0.6
0.4
0.2
0 11/25/2006 12/9/2006 12/23/2006 1/6/2007 1/20/2007 2/3/2007 2/17/2007 3/3/2007 3/17/2007
Date *Based on WEF MOP 8.
Anaerobic Digestion of Food Waste Funding Opportunity No. EPA-R9-WST-06-004
23
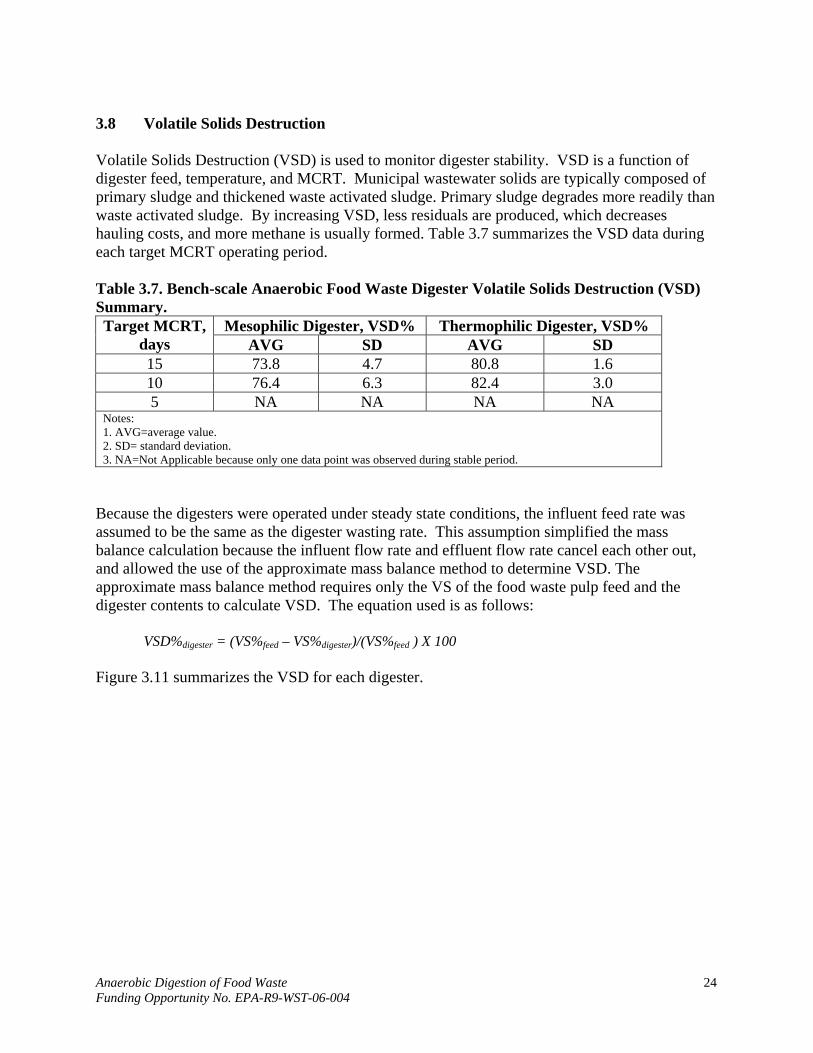
3.8 Volatile Solids Destruction
Volatile Solids Destruction (VSD) is used to monitor digester stability. VSD is a function of digester feed, temperature, and MCRT. Municipal wastewater solids are typically composed of primary sludge and thickened waste activated sludge. Primary sludge degrades more readily than waste activated sludge. By increasing VSD, less residuals are produced, which decreases hauling costs, and more methane is usually formed. Table 3.7 summarizes the VSD data during each target MCRT operating period.
Table 3.7. Bench-scale Anaerobic Food Waste Digester Volatile Solids Destruction (VSD) Summary. Target MCRT,
days Mesophilic Digester, VSD% Thermophilic Digester, VSD%
AVG SD AVG SD 15 73.8 4.7 80.8 1.6 10 76.4 6.3 82.4 3.0 5 NA NA NA NA
Notes: 1. AVG=average value. 2. SD= standard deviation. 3. NA=Not Applicable because only one data point was observed during stable period.
Because the digesters were operated under steady state conditions, the influent feed rate was assumed to be the same as the digester wasting rate. This assumption simplified the mass balance calculation because the influent flow rate and effluent flow rate cancel each other out, and allowed the use of the approximate mass balance method to determine VSD. The approximate mass balance method requires only the VS of the food waste pulp feed and the digester contents to calculate VSD. The equation used is as follows:
VSD%digester = (VS%feed – VS%digester)/(VS%feed ) X 100
Figure 3.11 summarizes the VSD for each digester.
Anaerobic Digestion of Food Waste Funding Opportunity No. EPA-R9-WST-06-004
24

Figure 3.11 Anaerobic Food Waste Digester Volatile Solids Destruction
VSD
(%)
100
90
80
70
60
50
40
30
20
10
0
Typical Avg: 57%(1)
Start 15d MCRT 11/27/2006
EPA 503 Regulations Minimum 38%
Start 10d MCRT 1/9/2007
Start 5d MCRT 3/3/2007
Thermo Test Meso Test
NOTES: 1. Average values of digesters fed municipal sludge per previous EBMUD study.
11/25/06 12/9/06 12/23/06 1/6/07 1/20/07 2/3/07 2/17/07 3/3/07 3/17/07
Date
Throughout the study at 15-, 10-, and 5-day MCRTs, VSD in the digesters appeared to stabilize at approximately 80%, with some peaks near 90%, but both the thermophilic and mesophilic digesters were consistently above the average range of 50% to 60% VSD for municipal wastewater solids digestion. Also, the VSD is well above the minimum of 38% required by the EPA 503 regulations for biosolids land application. This indicates that food waste is significantly more biodegradable than municipal wastewater solids. During the 5-day MCRT operational period, the VSD in both digesters were still high despite low pH and gas production. This appears to be contradictory and may need further investigation.
Residual Digested Solids Table 3.8 shows dry residual digested solids weights in tons per 100 tons of dry digester feed. Dry residual weights for food waste (digested at mesophilic and thermophilic temperatures) and municipal wastewater solids feeds are compared. Residuals are the materials remaining after digestion, and include both inert (non-biodegradable) and refractory (difficult to digest) organic materials. A 15-day MCRT is assumed for the digestion of food waste and municipal wastewater solids.
Anaerobic Digestion of Food Waste Funding Opportunity No. EPA-R9-WST-06-004
25
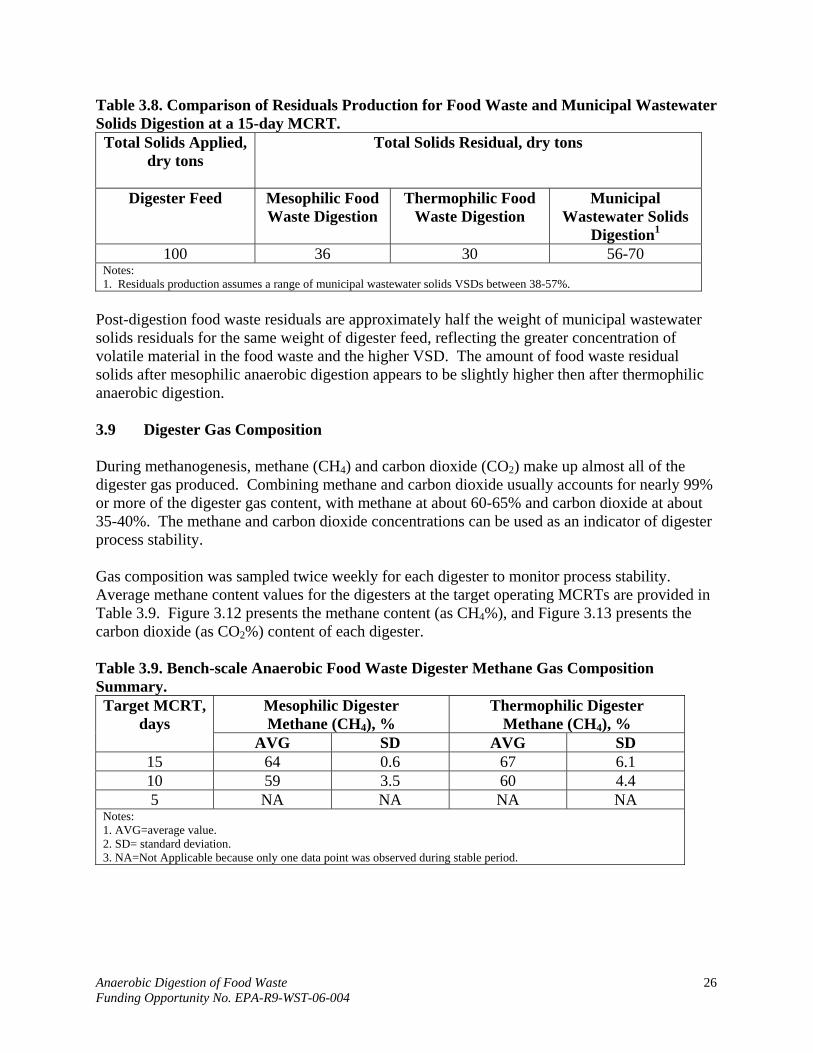
Table 3.8. Comparison of Residuals Production for Food Waste and Municipal Wastewater Solids Digestion at a 15-day MCRT. Total Solids Applied,
dry tons Total Solids Residual, dry tons
Digester Feed Mesophilic Food Waste Digestion
Thermophilic Food Waste Digestion
Municipal Wastewater Solids
Digestion1
100 36 30 56-70 Notes: 1. Residuals production assumes a range of municipal wastewater solids VSDs between 38-57%.
Post-digestion food waste residuals are approximately half the weight of municipal wastewater solids residuals for the same weight of digester feed, reflecting the greater concentration of volatile material in the food waste and the higher VSD. The amount of food waste residual solids after mesophilic anaerobic digestion appears to be slightly higher then after thermophilic anaerobic digestion.
3.9 Digester Gas Composition
During methanogenesis, methane (CH4) and carbon dioxide (CO2) make up almost all of the digester gas produced. Combining methane and carbon dioxide usually accounts for nearly 99% or more of the digester gas content, with methane at about 60-65% and carbon dioxide at about 35-40%. The methane and carbon dioxide concentrations can be used as an indicator of digester process stability.
Gas composition was sampled twice weekly for each digester to monitor process stability. Average methane content values for the digesters at the target operating MCRTs are provided in Table 3.9. Figure 3.12 presents the methane content (as CH4%), and Figure 3.13 presents the carbon dioxide (as CO2%) content of each digester.
Table 3.9. Bench-scale Anaerobic Food Waste Digester Methane Gas Composition Summary. Target MCRT,
days Mesophilic Digester Methane (CH4), %
Thermophilic Digester Methane (CH4), %
AVG SD AVG SD 15 64 0.6 67 6.1 10 59 3.5 60 4.4 5 NA NA NA NA
Notes: 1. AVG=average value. 2. SD= standard deviation. 3. NA=Not Applicable because only one data point was observed during stable period.
Anaerobic Digestion of Food Waste Funding Opportunity No. EPA-R9-WST-06-004
26
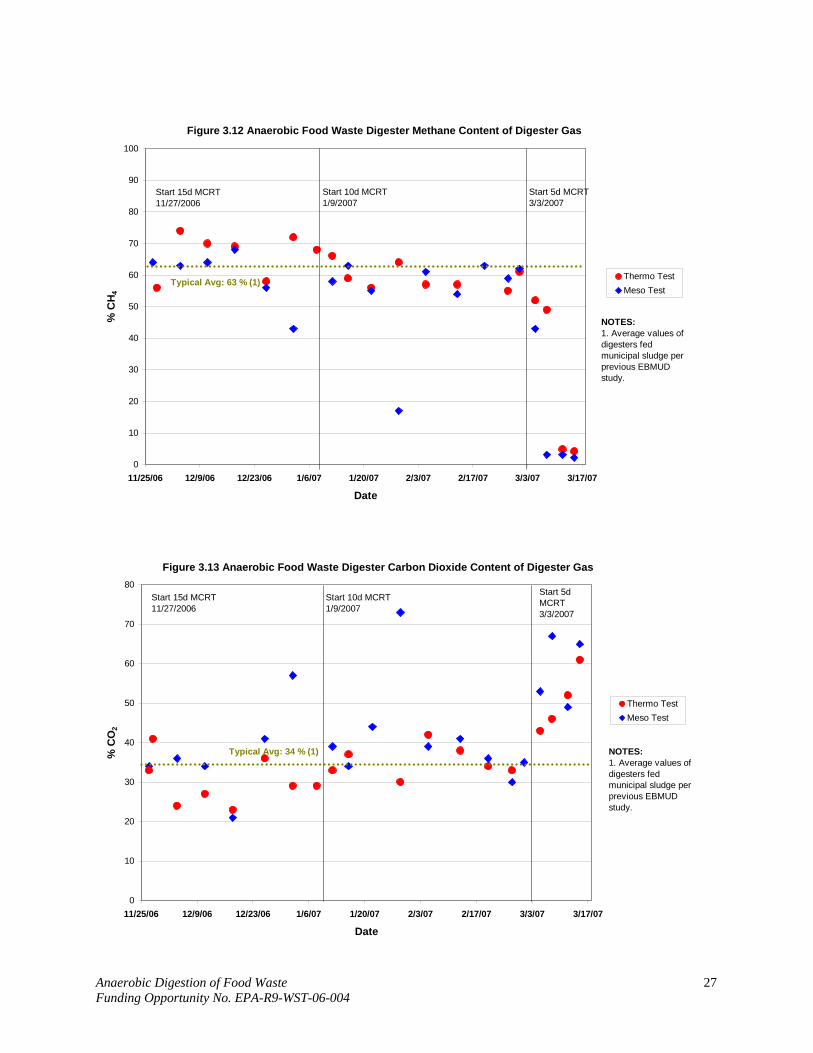
Figure 3.12 Anaerobic Food Waste Digester Methane Content of Digester Gas
% C
O2
% C
H 4
0
10
20
30
40
50
60
70
80
90
100
11/25/06 12/9/06 12/23/06 1/6/07 1/20/07 2/3/07 2/17/07 3/3/07 3/17/07
Date
Typical Avg: 63 % (1)
Start 10d MCRT 1/9/2007
Start 5d MCRT 3/3/2007
Start 15d MCRT 11/27/2006
Thermo Test Meso Test
NOTES: 1. Average values of digesters fed municipal sludge per previous EBMUD study.
Figure 3.13 Anaerobic Food Waste Digester Carbon Dioxide Content of Digester Gas 80
70
60
50
Start 15d MCRT 11/27/2006
Start 10d MCRT 1/9/2007
Start 5d MCRT 3/3/2007
Typical Avg: 34 % (1)
Thermo Test Meso Test
40 NOTES: 1. Average values of digesters fed
30 municipal sludge per previous EBMUD study.
20
10
0 11/25/06 12/9/06 12/23/06 1/6/07 1/20/07 2/3/07 2/17/07 3/3/07 3/17/07
Date
Anaerobic Digestion of Food Waste Funding Opportunity No. EPA-R9-WST-06-004
27

15-day MCRT During the 15-day MCRT operational period, both mesophilic and thermophilic digesters produced gas with a higher methane content than during the shorter MCRT periods, which suggests that a longer MCRT allows larger methanogen populations to optimize methane production. The thermophilic digester had a slightly higher average methane content (67% CH4) than that of the mesophilic digester (64% CH4) during stable periods of operation. Compared to municipal wastewater solids, both the mesophilic and thermophilic digesters met or exceeded the typical average for municipal wastewater solids digestion. Digester gas samples from the thermophilic digester were often near, or even higher than 70% methane. These results show that food waste can produce digester gas that has a higher energy value than gas produced from municipal wastewater solids. As expected, the carbon dioxide data had an inverse relationship to methane data. Figure 3.13 shows the average carbon dioxide content was 29% for the thermophilic digester and 35% for the mesophilic digester (during stable periods of operation). Prior to restart of the mesophilic digester, a drastic drop in the methane content to 43% (1/2/07) was observed.
10-day MCRT Methane gas concentrations were stable within the 55-65% range during the 10-day MCRT operational period for both digesters, with one exception. A drop in methane content to 17% was observed in the mesophilic digester on 1/29/07 prior to its restart. The average methane gas concentrations were lower during this period (59-60%) than during the 15-day MCRT operational period (64-67%).
5-day MCRT Methane gas quality drastically decreased during the 5-day MCRT operational period. The methane content dropped below 5% and carbon dioxide exceeded 60% for both mesophilic and thermophilic digesters. This was likely due to a washout of the slower growing methanogens at the higher 5-day MCRT wasting rate.
Anaerobic Digestion of Food Waste Funding Opportunity No. EPA-R9-WST-06-004
28

3.10 Specific Methane Gas Production Rate
The specific methane gas production rate is defined as the digester methane gas production rate normalized by the food waste solids (as TS) applied. The specific methane gas production rate of food waste was calculated and compared to the specific methane gas production rate of municipal wastewater solids using the following equation:
CH4 production rate (ft3/lb)= CH4% X Gas Production ( ft3/day) TS% X Feed (gal/day) X 8.34 lbs per gal
Figure 3.14 presents the specific methane gas production rate data during operation at the 15-, 10-, and 5-day MCRT operational periods. The chart is shaded to denote stable and unstable operational periods so that a representative comparison can be made with municipal wastewater solids.
15-day MCRT During stable operation periods at 15-day MCRT operation, both the mesophilic and thermophilic digesters had specific methane gas production rates that exceeded the average of 5 ft3 CH4/lb for municipal wastewater solids at a 15-day MCRT. Both digesters appeared to have comparable methane production rates, with peak values near 8.5 ft3 CH4/ lb food waste. When digesters were not stable, the specific gas production rates dropped below the average for municipal wastewater solids. This data shows that food waste has a significantly higher specific methane gas production rate than municipal wastewater solids, which results in a higher energy value when both digesters are stable.
10-day MCRT During the 10-day MCRT operational period, the specific methane gas production rate dropped off, which most likely resulted from a reduced methanogen population. This was observed earlier in Section 3.10, when the methane content dropped off at the 10-day MCRT. Even though the specific methane gas production rate is not optimized, the range is near that of municipal wastewater solids specific methane production during a 15-day MCRT. The specific methane gas production rates from both mesophilic and thermophilic digesters appear to be similar.
5-day MCRT During this period, the specific methane gas production dropped off considerably for both mesophilic and thermophilic digesters, probably due to methanogen washout from the much higher sludge wasting rate.
Anaerobic Digestion of Food Waste Funding Opportunity No. EPA-R9-WST-06-004
29
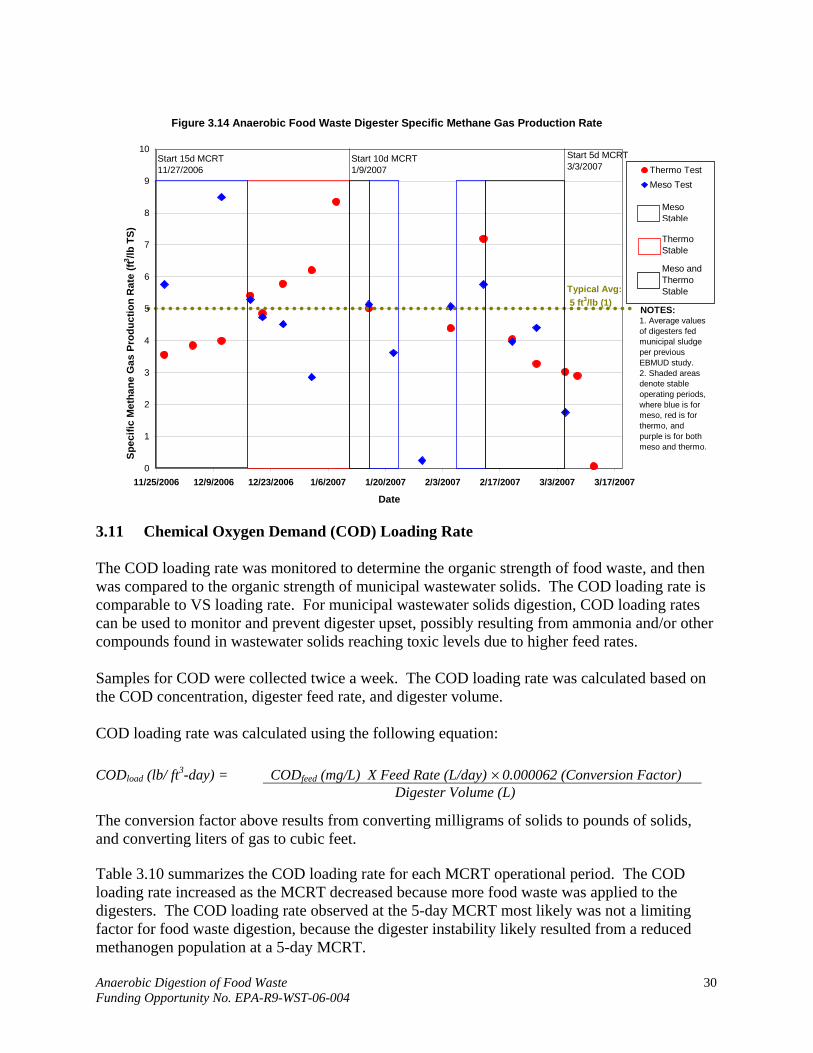
Figure 3.14 Anaerobic Food Waste Digester Specific Methane Gas Production Rate
10 Start 15d MCRT Start 10d MCRT Start 5d MCRT 11/27/2006 1/9/2007 3/3/2007 Thermo Test
9 Meso Test
/lb T
S)
8 Meso Stable
(ft3
7 Thermo Stable
Meso and
te
Ra
6 Thermo Typical Avg: Stable
ion
5 5 ft3/lb (1) NOTES:
uct
1. Average values
rod
s P
4 of digesters fed municipal sludge per previous
Ga
ne 3
EBMUD study. 2. Shaded areas denote stable
ha operating periods,
Spec
ific
Met 2 where blue is for
meso, red is for thermo, and
1 purple is for both meso and thermo.
0 11/25/2006 12/9/2006 12/23/2006 1/6/2007 1/20/2007 2/3/2007 2/17/2007 3/3/2007 3/17/2007
Date
3.11 Chemical Oxygen Demand (COD) Loading Rate
The COD loading rate was monitored to determine the organic strength of food waste, and then was compared to the organic strength of municipal wastewater solids. The COD loading rate is comparable to VS loading rate. For municipal wastewater solids digestion, COD loading rates can be used to monitor and prevent digester upset, possibly resulting from ammonia and/or other compounds found in wastewater solids reaching toxic levels due to higher feed rates. Samples for COD were collected twice a week. The COD loading rate was calculated based on the COD concentration, digester feed rate, and digester volume. COD loading rate was calculated using the following equation:
CODload (lb/ ft3-day) = CODfeed (mg/L) X Feed Rate (L/day) ×0.000062 (Conversion Factor) Digester Volume (L)
The conversion factor above results from converting milligrams of solids to pounds of solids, and converting liters of gas to cubic feet. Table 3.10 summarizes the COD loading rate for each MCRT operational period. The COD loading rate increased as the MCRT decreased because more food waste was applied to the digesters. The COD loading rate observed at the 5-day MCRT most likely was not a limiting factor for food waste digestion, because the digester instability likely resulted from a reduced methanogen population at a 5-day MCRT.
Anaerobic Digestion of Food Waste 30 Funding Opportunity No. EPA-R9-WST-06-004
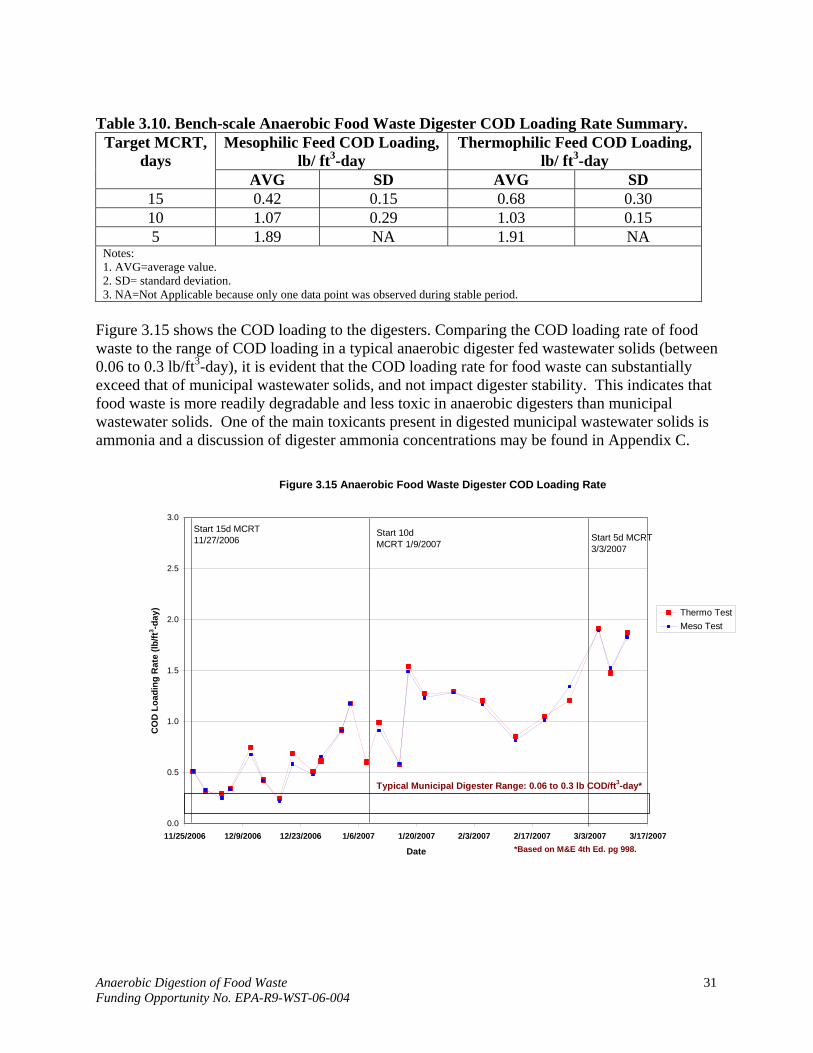
Table 3.10. Bench-scale Anaerobic Food Waste Digester COD Loading Rate Summary. Target MCRT,
days Mesophilic Feed COD Loading,
lb/ ft3-day Thermophilic Feed COD Loading,
lb/ ft3-day AVG SD AVG SD
15 0.42 0.15 0.68 0.30 10 1.07 0.29 1.03 0.15 5 1.89 NA 1.91 NA
Notes: 1. AVG=average value. 2. SD= standard deviation. 3. NA=Not Applicable because only one data point was observed during stable period.
Figure 3.15 shows the COD loading to the digesters. Comparing the COD loading rate of food waste to the range of COD loading in a typical anaerobic digester fed wastewater solids (between 0.06 to 0.3 lb/ft3-day), it is evident that the COD loading rate for food waste can substantially exceed that of municipal wastewater solids, and not impact digester stability. This indicates that food waste is more readily degradable and less toxic in anaerobic digesters than municipal wastewater solids. One of the main toxicants present in digested municipal wastewater solids is ammonia and a discussion of digester ammonia concentrations may be found in Appendix C.
Figure 3.15 Anaerobic Food Waste Digester COD Loading Rate
CO
D L
oadi
ng R
ate
(lb/ft
3 -day
)
3.0
2.5
Start 15d MCRT Start 10d Start 5d MCRT 11/27/2006 MCRT 1/9/2007 3/3/2007
Typical Municipal Digester Range: 0.06 to 0.3 lb COD/ft3-day*
Thermo Test 2.0
Meso Test
1.5
1.0
0.5
0.0 11/25/2006 12/9/2006 12/23/2006 1/6/2007 1/20/2007 2/3/2007 2/17/2007 3/3/2007 3/17/2007
Date *Based on M&E 4th Ed. pg 998.
Anaerobic Digestion of Food Waste 31 Funding Opportunity No. EPA-R9-WST-06-004

3.12 Food Waste Energy Value
Food waste energy value was calculated from the specific methane gas production rate data (discussed in Section 3.11) during stable periods of operation for both the mesophilic and thermophilic digesters. Table 3.11 presents the energy value of food waste. The energy value is presented as normalized methane production, normalized electricity production, and household electrical energy demand equivalent (based on 100 tons/day of food waste) at the 15-day and 10day MCRT operational periods. The data presented is combined for both mesophilic and thermophilic digestion, since the limited data available did not show a clear advantage for mesophilic or thermophilic digestion. For the methane production rate and the electricity production rate, two units are presented: dry tons applied and wet tons delivered. Dry tons applied is presented to show the energy produced of actual food waste solids applied to the digester. Wet tons delivered is presented to estimate the energy value of an actual wet ton of food waste delivered. The difference between the two is that wet tons delivered includes the weight of water in the food waste as delivered, and includes the weight of the solids in the reject stream during processing of the food waste prior to digestion.
Anaerobic Digestion of Food Waste Funding Opportunity No. EPA-R9-WST-06-004
32
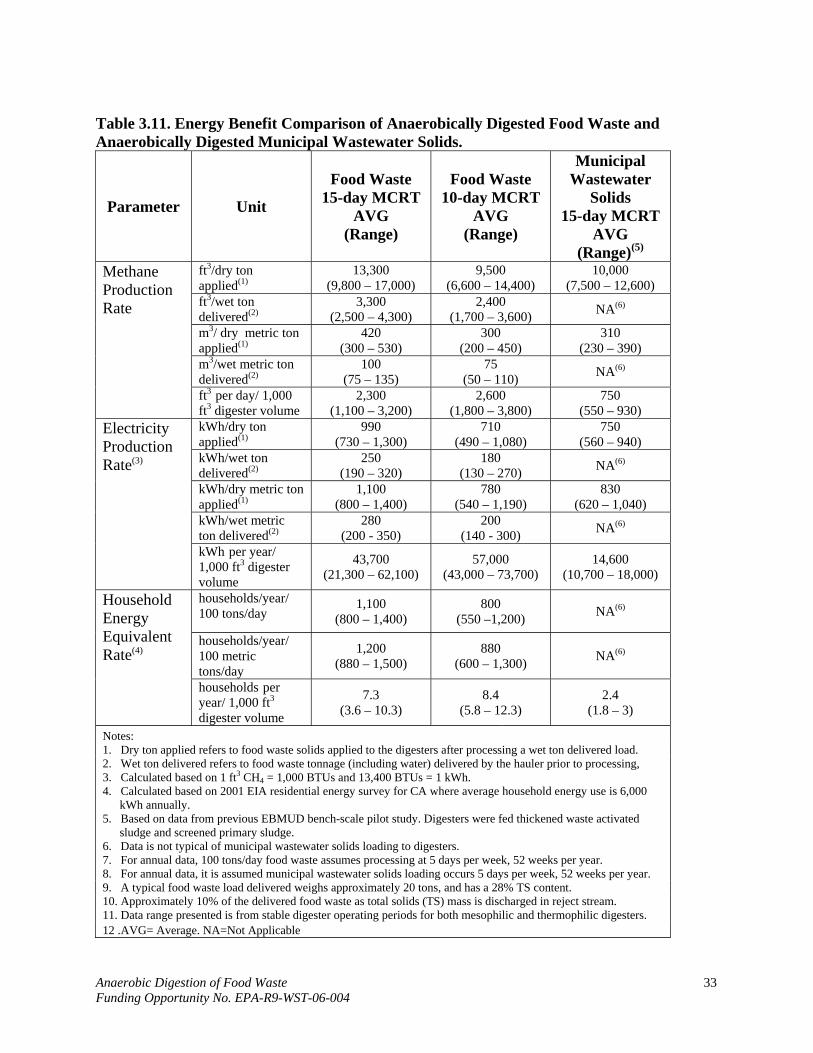
Table 3.11. Energy Benefit Comparison of Anaerobically Digested Food Waste and Anaerobically Digested Municipal Wastewater Solids.
Parameter Unit
Food Waste 15-day MCRT
AVG (Range)
Food Waste 10-day MCRT
AVG (Range)
Municipal Wastewater
Solids 15-day MCRT
AVG (Range)(5)
Methane Production Rate
ft3/dry ton applied(1)
13,300 (9,800 – 17,000)
9,500 (6,600 – 14,400)
10,000 (7,500 – 12,600)
ft3/wet ton delivered(2)
3,300 (2,500 – 4,300)
2,400 (1,700 – 3,600) NA(6)
m3/ dry metric ton applied(1)
420 (300 – 530)
300 (200 – 450)
310 (230 – 390)
m3/wet metric ton delivered(2)
100 (75 – 135)
75 (50 – 110) NA(6)
ft3 per day/ 1,000 ft3 digester volume
2,300 (1,100 – 3,200)
2,600 (1,800 – 3,800)
750 (550 – 930)
Electricity Production Rate(3)
kWh/dry ton applied(1)
990 (730 – 1,300)
710 (490 – 1,080)
750 (560 – 940)
kWh/wet ton delivered(2)
250 (190 – 320)
180 (130 – 270) NA(6)
kWh/dry metric ton applied(1)
1,100 (800 – 1,400)
780 (540 – 1,190)
830 (620 – 1,040)
kWh/wet metric ton delivered(2)
280 (200 - 350)
200 (140 - 300) NA(6)
kWh per year/ 1,000 ft3 digester volume
43,700 (21,300 – 62,100)
57,000 (43,000 – 73,700)
14,600 (10,700 – 18,000)
Household Energy Equivalent Rate(4)
households/year/ 100 tons/day
1,100 (800 – 1,400)
800 (550 –1,200) NA(6)
households/year/ 100 metric tons/day
1,200 (880 – 1,500)
880 (600 – 1,300) NA(6)
households per year/ 1,000 ft3
digester volume
7.3 (3.6 – 10.3)
8.4 (5.8 – 12.3)
2.4 (1.8 – 3)
Notes: 1. Dry ton applied refers to food waste solids applied to the digesters after processing a wet ton delivered load. 2. Wet ton delivered refers to food waste tonnage (including water) delivered by the hauler prior to processing, 3. Calculated based on 1 ft3 CH4 = 1,000 BTUs and 13,400 BTUs = 1 kWh. 4. Calculated based on 2001 EIA residential energy survey for CA where average household energy use is 6,000
kWh annually. 5. Based on data from previous EBMUD bench-scale pilot study. Digesters were fed thickened waste activated
sludge and screened primary sludge. 6. Data is not typical of municipal wastewater solids loading to digesters. 7. For annual data, 100 tons/day food waste assumes processing at 5 days per week, 52 weeks per year. 8. For annual data, it is assumed municipal wastewater solids loading occurs 5 days per week, 52 weeks per year. 9. A typical food waste load delivered weighs approximately 20 tons, and has a 28% TS content. 10. Approximately 10% of the delivered food waste as total solids (TS) mass is discharged in reject stream. 11. Data range presented is from stable digester operating periods for both mesophilic and thermophilic digesters. 12 .AVG= Average. NA=Not Applicable
Anaerobic Digestion of Food Waste Funding Opportunity No. EPA-R9-WST-06-004
33

At the 15-day MCRT operational period, the energy benefit on a normalized basis (per ton of food waste fed) was higher than during the 10-day MCRT operational period. The 15-day MCRT likely provides more time for more methanogens to grow and produce more methane gas, compared to the 10-day MCRT. However, at the shorter MCRT period, more food waste is fed per unit of digester volume, which can result in an increase in overall gas production at a 10-day MCRT compared to a 15-day MCRT. For example, a 1 million gallon digester operating at a 15day MCRT is fed food waste at 66,666 gallons per day. Assuming 10% solids, the food waste loading is approximately 27.8 dry tons per day. At a 10-day MCRT, the feed rate is 100,000 gallons per day, which at 10% solids results in approximately 41.7 dry tons of food waste fed per day. The resulting increase in food waste fed is 13.9 dry tons per day or 50% more than the 27.8 dry tons per day at a 15-day MCRT. Using the average methane production at a 15-day MCRT (from Table 3.11, 13,300 ft3 methane/ dry ton of food waste fed per day), and 27.8 dry tons of food waste fed per day at the 15-day MCRT, 369,740 ft3 of methane gas is produced per day. Because of the higher feed rates at a 10-day MCRT, using the same digester volume and food waste solids fed, 50% more food waste is fed to digester (for a total of 41.7 dry tons of food waste fed per day) than if the digester was operated at a 15-day MCRT. Using the 10-day MCRT average daily methane production rate (from Table 3.11, 9,500 ft3 methane/ dry ton of food waste fed per day), results in 396,150 ft3 of methane produced per day, which is approximately 7% more than the daily methane gas produced at a 15-day MCRT (369,740 ft3
/day).
Anaerobic Digestion of Food Waste Funding Opportunity No. EPA-R9-WST-06-004
34

4.0 Summary and Conclusions
The results of this study demonstrate that anaerobic digestion of food waste can be achieved at a reduced MCRT (10 days), and at both mesophilic and thermophilic temperatures. Compared to municipal wastewater solids digestion, food waste digestion has many benefits. Food waste digestion is also an attractive alternative to composting since it can be done in a smaller foot print, and is a net energy producer rather than consumer. Table 3.12 summarizes the parameters comparing food waste digestion to municipal wastewater solids digestion.
Table 4.1. Summary of Parameters Comparing Anaerobic Food Waste Digestion to Anaerobic Municipal Wastewater Solids Digestion.
Parameter Units
Food Waste Digestion Municipal Wastewater
Solids Digestion
15-day MCRT Meso Thermo
10-day MCRT Meso Thermo
15-day MCRT Meso(1)
VS (as percent of TS), Feed % 86.3 87 89.9 90.6 77
VS Loading, Feed lb/ft3-day 0.28 0.29 0.53 0.54 0.2(2)
COD Loading, Feed lb/ft3-day 0.55 0.57 1.09 1.11 0.06-0.3(3)
VSD % 73.8 80.8 76.4 82.4 38-57%(4)
Methane (CH4) Content % 64 67 59 60 63
Methane Production Rate, Avg (Range)
ft3/lb TS applied
13,300 (9,800–17,000)(5)
9,500 (6,600–14,400)(5)
10,000 (7,500–12,600)
ft3 per day/ 1,000 ft3
digester volume
2,300 (1,100–3,200)
2,600 (1,800–3,800)
750 (550–930)
Residuals (Mass of Biosolids Produced) as a Percent of Feed Applied.
% 36 30 31 26 56-70
Notes: 1. Based on data from previous EBMUD bench-scale pilot study. Digesters were fed thickened waste activated sludge
and screened primary sludge. 2. Maximum recommended loading rate, WEF MOP 8. 3. Maximum recommended loading rate, M&E, 4th Edition. 4. EPA 503 Regulations minimum is 38%. Typical average is 57% from EBMUD bench-scale pilot study. 5. Data combined for mesophilic and thermophilic digesters
Anaerobic Digestion of Food Waste Funding Opportunity No. EPA-R9-WST-06-004
35
The main conclusions from this study are as follows:
• The food waste evaluated during this study is representative of food wastes available from restaurants, grocery stores, and produce markets throughout California, and around the U.S.
• Anaerobic digestion of food waste provides a higher normalized energy benefit, compared to municipal wastewater solids:
o 730 to 1,300 kWh per dry ton of food waste applied. o 560 to 940 kWh per dry ton of municipal wastewater solids applied.
• Anaerobic digestion of food waste provides a higher normalized energy benefit at a 15-day MCRT than at a 10-day MCRT:
o 190 to 320 kWh per wet ton of food waste at a 15-day MCRT, or the equivalent of satisfying the power demand of 800 to 1,400 homes per year at 100 tons of food waste per day.
o 130 to 270 kWh per wet ton of food waste at a 10-day MCRT, or the equivalent of satisfying the power demand of 550 to 1,200 homes per year at 100 tons of food waste per day.
• Food waste contains more biodegradable solids, with a higher VS/TS percentage (86% to 90%) than municipal wastewater solids (70% to 80%).
• Volatile solids destroyed (VSD) is higher for food waste when anaerobically digested (74 to 81%) than for municipal wastewater solids anaerobically digested (57%), and much higher than the 38% VSD required by the EPA’s 503 Regulations for land application.
• Since food waste is more readily biodegradable (i.e., with higher VS/TS and VSD) than municipal wastewater sludge, a 10-day MCRT could be used rather than the minimum of 15-days for municipal wastewater sludge anaerobic digestion.
• With a shorter MCRT possible for food waste, smaller digester volumes would be needed, possibly reducing capital costs.
• The higher VS/TS percentage and VSD of food waste digestion also results in half the biosolids produced (residual solids) compared to anaerobically digesting municipal wastewater solids.
• Stable anaerobic digestion of food waste at both mesophilic and thermophilic temperatures provides more gas production (6 to 8.5 ft3 CH4/lb TS applied) than digestion of municipal wastewater solids (5 ft3 CH4/lb TS applied).
• Anaerobic digestion of food waste can occur at significantly higher VS loading (0.53 lb/ ft3-day) and COD loading (1.1 lb/ ft3-day) rates than typically seen for municipal wastewater solids (0.1 to 0.2 lb VS/ ft3-day and 0.06 to 0.3 lb COD/ ft3day).
• Thermophilic anaerobic digestion of food waste may provide a slight increase in digester gas methane content compared to mesophilic digestion (67% versus 64% at 15-day MCRT, and 60% versus 59% at 10-day MCRT). Especially since the actual MCRT was consistently lower for the thermophilic digester compared to the mesophilic digester. More work, however, is needed in this area.
Anaerobic Digestion of Food Waste Funding Opportunity No. EPA-R9-WST-06-004
36

• Although the specific gas production rate for food waste anaerobically digested at a 10-day MCRT is less than the rate at a 15-day MCRT, the increased food waste loading rate (tonnage delivered) at a 10-day MCRT can result in a slight increase in gas production per digester volume compared to a digester operated at a 15-day MCRT.
• Food waste digestion results in a nearly 3 times higher methane gas yield per digester volume at both 15-day (2,300 ft3 CH4/1000 ft3 digester volume) and 10-day MCRT (2,600 ft3 CH4/1,000 ft3 digester volume) operation compared to that of municipal wastewater solids digestion (750 ft3 CH4/1,000 ft3 digester volume) at a 15-day MCRT.
Anaerobic Digestion of Food Waste Funding Opportunity No. EPA-R9-WST-06-004
37
References
California Integrated Waste Management Board. (1999) Statewide Waste Characterization Study Results and Final Report.
Gray (Gabb), D.M.D. and Hake, J.M.. (2004) Pathogen Destruction Efficiency in High-Temperature Digestion. Water Environment Research Foundation, Report 97-REM-2.
Gray (Gabb), D.M.D., Suto, P.J., and Chien, M.H. (2008) Green Energy from Food Wastes at Wastewater Treatment Plant. BioCycle, 49, 1, 53-58.
Metcalf & Eddy, Inc. (2003) Wastewater Engineering – Treatment and Reuse (4th ed.). New York: McGraw-Hill.
Part 503, Title 40, Code of Federal Regulations (CFR).
Suto, P., Gray (Gabb), D.M.D,, Larsen, E., and Hake, J.M.. (2006) Innovative Anaerobic Digestion Investigation of Fats, Oils, and Grease. WEF Biosolids and Residuals Conference Proceedings.
Water Environment Foundation (WEF) and the American Society of Civil Engineers (ASCE). (1998) Design of Municipal Wastewater Treatment Plants (4th ed.) WEF Manual of Practice 8, ASCE Manual and Report on Engineering Practice No. 76. Volume 3. Virginia: WEF.
Shang, Y, Soroushian, F., Whitman, E.J., and Zhang, Z. (2006) Co-digestion- Potential Increase of Renewable Energy Production from Waste for California. Presented at the Annual California Water Environment Association Conference, Sacramento, CA.
Anaerobic Digestion of Food Waste Funding Opportunity No. EPA-R9-WST-06-004
R-1
APPENDIX A
Anaerobic Digestion of Food Waste A- 1 Funding Opportunity No. EPA-R9-WST-06-004

Table A-1 Averages and Standard Deviations of Parameters
Item Parameter Units # of
samples Thermo Meso 1 Residence Time (15 d)
(MCRT) Days 23/20 average 14.7 15.6
std. dev. 1.2 1.2 coeff. var. 0.08 0.08
Residence Time (10 d) (MCRT)
Days 24/49 average 9.9 10.1 std. dev. 0.7 0.6
coeff. var. 0.07 0.06 Residence Time (5 d) (MCRT)
Days 3 average 5.3 5.3 std. dev. 0.3 0.2 coeff. var. 0.05 0.04
2 Temperature oC 29/76 average 50.09 35.22 std. dev. 0.40 1.14 coeff. var. 0.008 0.032
Temperature (New Target) oC 21 average 52.1 35.54 std. dev. 0.39 0.97
coeff. var. 0.008 0.03 3 pH (15 d) 23/22 average 7.47 7.41
std. dev. 0.13 0.13 coeff. var. 0.02 0.02
pH (10 d) 24/49 average 7.45 7.26 std. dev. 0.24 0.24
coeff. var. 0.03 0.03 pH (5 d) 3 average 7.00 6.94
std. dev. 0.20 0.23 coeff. var. 0.03 0.03
4 Gas Production (15 d) L/hr 22/21 average 4.8 4.0 std. dev. 1.6 0.7 coeff. var. 0.33 0.18
Gas Production (10 d) L/hr 24/49 average 5.4 4.5 std. dev. 1.5 0.8
coeff. var. 0.28 0.17 Gas Production (5 d) L/hr 3 average 6.3 4.9
std. dev. 0.2 0.4 coeff. var. 0.03 0.09
Anaerobic Digestion of Food Waste A- 2 Funding Opportunity No. EPA-R9-WST-06-004

Table A-1 Averages and Standard Deviations of Parameters-Continued
Item Parameter Units # of
samples Thermo Meso 5 Total Alkalinity (15 d) mg CaCO3/L 7/6 average 8,771 10,617
std. dev. 1,195 1,132 coeff. var. 0.14 0.11
Total Alkalinity (10 d) mg CaCO3/L 7/14 average 9,571 9,507 std. dev. 901 982
coeff. var. 0.09 0.10 Total Alkalinity (5 d) mg CaCO3/L 1 average 6,600 5,600
std. dev. N/A N/A coeff. var. N/A N/A
6 Total Volatile Acids (15 d) mg acetic acid/L
7/6 average 2,439 945 std. dev. 1,829 727 coeff. var. 0.75 0.77
Total Volatile Acids (10 d) mg acetic acid/L
6/13 average 4,183 5,143 std. dev. 1,363 3,520
coeff. var. 0.33 0.68 Total Volatile Acids (5 d) mg acetic
acid/L 1 average 8,900 8,500 std. dev. N/A N/A
coeff. var. N/A N/A 7 TVA/TALK Ratio (15 d) mg acetic
acid/ mg CaCO3
7/6 average 0.28 0.09 std. dev. 0.22 0.08 coeff. var. 0.79 0.86
TVA/TALK Ratio (10 d) mg acetic acid/ mg CaCO3
6/13 average 0.45 0.56 std. dev. 0.18 0.40
coeff. var. 0.40 0.71 TVA/TALK Ratio (5 d) mg acetic
acid/ mg
CaCO3
1 average 1.35 1.52 std. dev. N/A N/A
coeff. var. N/A N/A 8 Total Solids (15 d)
(Digester) % 7/6 average 2.2 2.2
std. dev. 0.3 0.1 coeff. var. 0.13 0.05
Total Solids (10 d) (Digester)
% 7/14 average 2.4 2.9 std. dev. 0.3 0.6
coeff. var. 0.11 0.20 Total Solids (5 d) (Digester)
% 1/1 average 2.0 2.0 std. dev. N/A N/A
coeff. var. N/A N/A 9 Total Solids (15 d) (Feed)
% 7/6 average 9.3 6.4 std. dev. 2.6 1.5 coeff. var. 0.28 0.23
Total Solids (10 d) (Feed)
% 7/14 average 9.8 9.6 std. dev. 1.9 1.6 coeff. var. 0.19 0.17
Total Solids (5 d) (Feed)
% 1/1 average 8.2 8.2 std. dev. N/A N/A coeff. var. N/A N/A
Anaerobic Digestion of Food Waste A- 3 Funding Opportunity No. EPA-R9-WST-06-004

Table A-1 Averages and Standard Deviations of Parameters-Continued
Item Parameter Units # of
samples Thermo Meso 10 Volatile Solids (15 d)
(Digester) %
of TS 7/6 average 64.7 64.1
std. dev. 4.4 2.7 coeff. var. 0.07 0.04
Volatile Solids (10 d) (Digester)
% of TS
7/14 average 65.5 70.8 std. dev. 4.5 3.2
coeff. var. 0.07 0.04 Volatile Solids (5 d) (Digester)
% of TS
1/1 average 70 70 std. dev. N/A N/A
coeff. var. N/A N/A 11 Volatile Solids (15 d)
(Feed) %
of TS 7/6 average 87 86.3
std. dev. 3.1 2.7 coeff. var. 0.04 0.03
Volatile Solids (10 d) (Feed)
% of TS
7/14 average 90.6 89.9 std. dev. 2.9 2.3
coeff. var. 0.03 0.03 Volatile Solids (5 d)
(Feed) %
of TS 1/1 average 90.2 90.2
std. dev. N/A N/A coeff. var. N/A N/A
12 VS Loading (15 d) lb/ft3-day 13/12 average 0.35 0.22 std. dev. 0.12 0.05 coeff. var. 0.35 0.23
VS Loading (10 d) lb/ft3-day 15 average 0.55 0.53 std. dev. 0.10 0.09
coeff. var. 0.18 0.17 VS Loading (5 d) lb/ft3-day 5 average 0.87 0.87
std. dev. N/A N/A coeff. var. N/A N/A
13 VS Destruction (15 d) % 7/6 average 80.8 73.8 std. dev. 1.6 4.7 coeff. var. 0.02 0.06
VS Destruction (10 d) % 7/14 average 82.4 76.4 std. dev. 3.0 6.3
coeff. var. 0.04 0.08 VS Destruction (5 d) % 1 average 83.3 83.3
std. dev. N/A N/A coeff. var. N/A N/A
14 Methane Content (15 d) % 4/3 average 67 64 std. dev. 6.1 0.6 coeff. var. 0.09 0.01
Methane Content (10 d) % 5/8 average 60 59 std. dev. 4.4 3.5
coeff. var. 0.07 0.06 Methane Content (5 d) % 1 average 52 43
std. dev. N/A N/A coeff. var. N/A N/A
Anaerobic Digestion of Food Waste A- 4 Funding Opportunity No. EPA-R9-WST-06-004

Table A-1 Averages and Standard Deviations of Parameters-Continued
Item Parameter Units # of samples Thermo Meso 15 Gas/VSD (15 d) ft3/lb 7/5 average 13.7 19.6
std. dev. 2.4 5.0 coeff. var. 0.18 0.26
Gas/VSD (10 d) ft3/lb 7/14 average 10.7 10.4 std. dev. 2.9 3.0
coeff. var. 0.27 0.29 Gas/VSD (5 d) ft3/lb 1 average 7.7 5.5
std. dev. N/A N/A coeff. var. N/A N/A
16 Methane/VSD (15 d) ft3/lb 4/3 average 9.3 11.7 std. dev. 1.7 4.0 coeff. var. 0.19 0.34
Methane/VSD (10 d) ft3/lb 5/8 average 6.4 6.9 std. dev. 2.0 1.8
coeff. var. 0.31 0.25 Methane/VSD (5 d) ft3/lb 1 average 4.0 2.3
std. dev. N/A N/A coeff. var. N/A N/A
17 Carbon Dioxide Content (15 d)
% 4/3 average 29 35 std. dev. 5.3 1.2 coeff. var. 0.18 0.03
Carbon Dioxide Content (10 d)
% 5/8 average 35 37 std. dev. 2.1 4.4
coeff. var. 0.06 0.12 Carbon Dioxide Content (5 d)
% 1 average 43 53 std. dev. N/A N/A
coeff. var. N/A N/A 18 COD Loading
(15 d) lb/ft3-day 13/12 average 0.68 0.42
std. dev. 0.30 0.15 coeff. var. 0.44 0.36
COD Loading (10 d)
lb/ft3-day 9 average 1.03 1.07 std. dev. 0.15 0.29
coeff. var. 0.14 0.28 COD Loading (5 d)
lb/ft3-day 3 average 1.91 1.89 std. dev. N/A N/A
coeff. var. N/A N/A 19 Gas/COD Consumed
(15 d) ft3/lb 5/2 average 7.1 10.3
std. dev. 2.0 4.6 coeff. var. 0.28 0.45
Gas/COD Consumed (10 d)
ft3/lb 3/6 average 5.2 5.6 std. dev. 0.9 1.2
coeff. var. 0.17 0.21 Gas/COD Consumed (5 d)
ft3/lb 1 average 3.0 2.2 std. dev. N/A N/A coeff. var. N/A N/A
Anaerobic Digestion of Food Waste A- 5 Funding Opportunity No. EPA-R9-WST-06-004
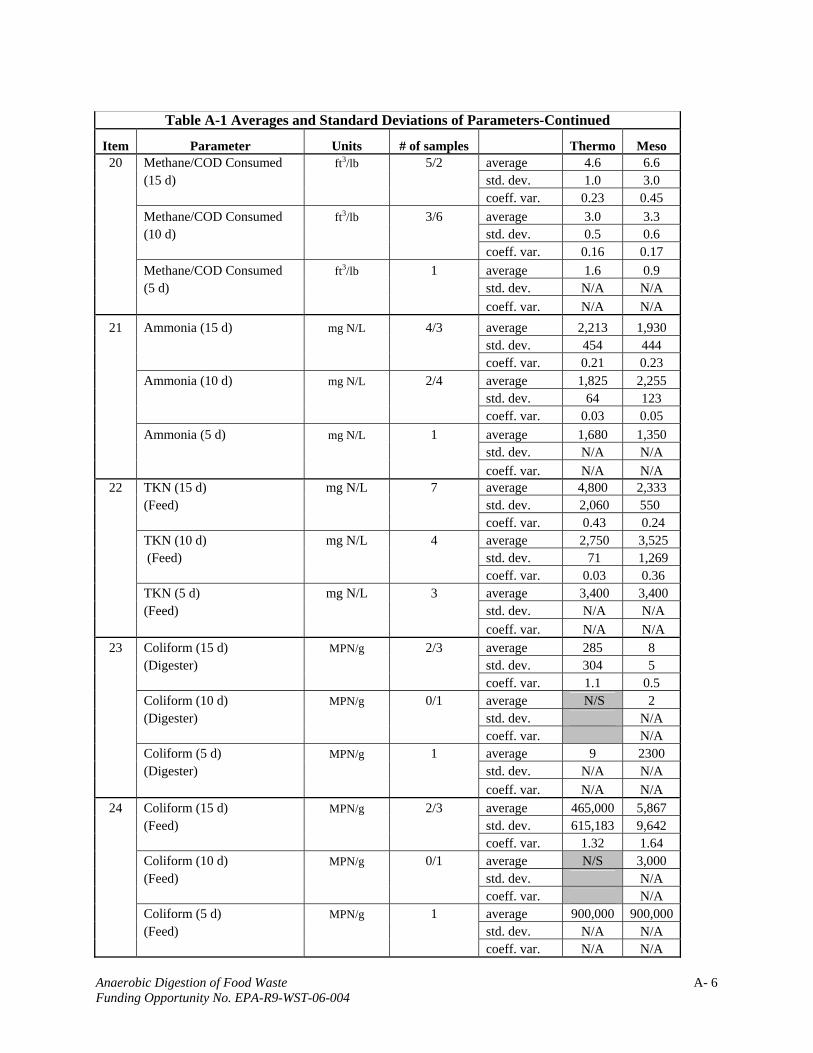
Table A-1 Averages and Standard Deviations of Parameters-Continued
Item Parameter Units # of samples Thermo Meso 20 Methane/COD Consumed
(15 d) ft3/lb 5/2 average 4.6 6.6
std. dev. 1.0 3.0 coeff. var. 0.23 0.45
Methane/COD Consumed (10 d)
ft3/lb 3/6 average 3.0 3.3 std. dev. 0.5 0.6
coeff. var. 0.16 0.17 Methane/COD Consumed (5 d)
ft3/lb 1 average 1.6 0.9 std. dev. N/A N/A
coeff. var. N/A N/A 21 Ammonia (15 d) mg N/L 4/3 average 2,213 1,930
std. dev. 454 444 coeff. var. 0.21 0.23
Ammonia (10 d) mg N/L 2/4 average 1,825 2,255 std. dev. 64 123
coeff. var. 0.03 0.05 Ammonia (5 d) mg N/L 1 average 1,680 1,350
std. dev. N/A N/A coeff. var. N/A N/A
22 TKN (15 d) (Feed)
mg N/L 7 average 4,800 2,333 std. dev. 2,060 550 coeff. var. 0.43 0.24
TKN (10 d) (Feed)
mg N/L 4 average 2,750 3,525 std. dev. 71 1,269 coeff. var. 0.03 0.36
TKN (5 d) (Feed)
mg N/L 3 average 3,400 3,400 std. dev. N/A N/A coeff. var. N/A N/A
23 Coliform (15 d) (Digester)
MPN/g 2/3 average 285 8 std. dev. 304 5 coeff. var. 1.1 0.5
Coliform (10 d) (Digester)
MPN/g 0/1 average N/S 2 std. dev. N/A
coeff. var. N/A Coliform (5 d) (Digester)
MPN/g 1 average 9 2300 std. dev. N/A N/A
coeff. var. N/A N/A 24 Coliform (15 d)
(Feed) MPN/g 2/3 average 465,000 5,867
std. dev. 615,183 9,642 coeff. var. 1.32 1.64
Coliform (10 d) (Feed)
MPN/g 0/1 average N/S 3,000 std. dev. N/A
coeff. var. N/A Coliform (5 d)
(Feed) MPN/g 1 average 900,000 900,000
std. dev. N/A N/A coeff. var. N/A N/A
Anaerobic Digestion of Food Waste A- 6 Funding Opportunity No. EPA-R9-WST-06-004

Table A-1 Averages and Standard Deviations of Parameters-Continued
Item Parameter Units # of samples Thermo Meso 25 Hydrogen Sulfide (15 d) ppm 2 average 525 535
std. dev. 106 417 coeff. var. 0.20 0.78
Hydrogen Sulfide (10 d) ppm 0/1 average N/S 1,400 std. dev. N/A
coeff. var. N/A Hydrogen Sulfide (5 d) ppm N/S N/S
Notes: 1. N/S- Not Sampled. 2. N/A- Not Applicable.
Anaerobic Digestion of Food Waste A- 7 Funding Opportunity No. EPA-R9-WST-06-004
APPENDIX B Ammonia and TKN Concentrations
Anaerobic Digestion of Food Waste Funding Opportunity No. EPA-R9-WST-06-004
B-1

Ammonia (NH4+) concentrations are used to indicate digestion efficiency, since ammonia is an
end product of the breakdown of complex organics such as proteins, which are composed of nitrogen based compounds. Total Kjeldahl Nitrogen (TKN) is used to determine the total nitrogen content, which includes both ammonia and organic nitrogen, in the feed. Digester bacteria consume organic nitrogen for energy and/or growth, and ammonia is released as a byproduct. Samples from both the mesophilic and thermophilic digesters were taken and analyzed for ammonia-nitrogen. Figure C-1 shows the TKN in the feed and the ammonia in the digester sludge samples.
Ammonia levels are correlated with the feed TKN for both digesters. Overall, the thermophilic digester had slightly higher ammonia levels, except for two data points at the10-day MCRT, and the last data point at the 5-day MCRT. This might suggest that thermophilic anaerobic digestion achieves more efficient conversion of complex organics, such as proteins, compared to mesophilic anaerobic digestion.
Figure C-1. Anaerobic Food Waste Digester TKN and Ammonia 5,000 10,000
4,500 9,000
11/25/2006 12/9/2006 12/23/2006 1/6/2007 1/20/2007 2/3/2007 2/17/2007 3/3/2007 3/17/2007
Date
Start 15d MCRT 11/27/2006
Start 5d MCRT 3/3/2007
Typical Avg: 2,130 mg/L(1)
Start 10d MCRT 1/9/2007
Thermo Test 4,000 8,000
Meso Test
3,500 7,000 Feed TKN
Am
mon
ia a
s N
(mg/
L)
3,000 6,000
2,500 5,000
2,000 4,000
Feed
TK
N (m
g/L)
NOTES: 1,500 3,000 1. Average values of
digesters fed municipal sludge per
1,000 2,000 previous EBMUD study.
500 1,000
0 0
Anaerobic Digestion of Food Waste Funding Opportunity No. EPA-R9-WST-06-004
B-2