Ana Raquel Cardoso de Freitas - … · III Acknowledgments ACKNOWLEDGMENTS This dissertation is a...
115
Ana Raquel Cardoso de Freitas Compatible strengthening of masonry structures based on the TRM technique Ana Raquel Cardoso de Freitas dezembro de 2016 UMinho | 2016 Compatible strengthening of masonry structures based on the TRM technique Universidade do Minho Escola de Engenharia
Transcript of Ana Raquel Cardoso de Freitas - … · III Acknowledgments ACKNOWLEDGMENTS This dissertation is a...
Ana Raquel Cardoso de Freitas
Compatible strengthening of masonrystructures based on the TRM technique
Ana
Raqu
el Ca
rdos
o de
Fre
itas
dezembro de 2016UMin
ho |
201
6C
ompa
tible
str
engt
heni
ng o
f mas
onry
str
uctu
res
base
d on
the
TRM
tech
niqu
e
Universidade do MinhoEscola de Engenharia
dezembro de 2016
Dissertação de MestradoCiclo de Estudos Integrados Conducentes aoGrau de Mestre em Engenharia Civil
Trabalho efetuado sob a orientação doProfessor Doutor Daniel OliveiraDoutor Bahman Ghiassi
Ana Raquel Cardoso de Freitas
Compatible strengthening of masonrystructures based on the TRM technique
Universidade do MinhoEscola de Engenharia

III
Acknowledgments
ACKNOWLEDGMENTS
This dissertation is a product of a great deal of hard work and endeavor that would not be
possible to do without the help and support of several different people. This work could not
be finished without properly thanking them, so, I would like to publicly express my sincere
gratitude towards those persons:
To Professor Daniel Oliveira for your guidance. Thank you for always being available to help
and advise me, for all the knowledge that I learned from you, for all the time spent with me
and with my work and for all the critics that enriched this dissertation.
To Doctor Bahman Ghiassi also for your guidance. Thank you for always being available to
help us with the experimental work, even when not present, for all the advice and critics that
improved this dissertation and for always being committed to our work.
To Ali Esfahani, my lab partner and my friend. Thank you for always being with me, guiding
me during all the experimental work and helping me in everything else. Thank you for
becoming my friend, for sharing a bit of your culture with me and for all the advice that you
gave me.
To the all the people that wok in the Structures and Materials Laboratories, technicians and
students, for all the fundamental help and guidance that they provided, specially to António
José Matos for helping and teaching me in everything that he could, even the smallest details,
always with a smile on his face.
To the friends that I made throughout the years that I spent in the university, specially my
tigers that always been with me through this academic journey and deserve congratulations
for finishing their own dissertations. Hope to continue supporting each other for many more
years.
To all my family, that without much that they could do, always tried to help and support, not
only in this dissertation, but in everything that I do in life. I would like to specially thank to
my parents, Fernando Freitas e Maria Cardoso, for all the sacrifices that they had to go
through to give me the best future and education possible and for always loving me.

IV
Compatible strengthening of masonry Structures based on the TRM technique
To my friends that supported me during these years, specially Joana Fernandes and Rita Dias,
who are the very best friends that anyone can wish for. Thank you for understanding when I
had to stay home working, helping me in everything you could and always being there for me,
“even in the darkest of times”.
To my teammates. Even though most of them didn’t know what I was doing, they always
tried to support me. Thank you for teaching me hard work, commitment and perseverance,
those skills were essential to this dissertation as well as for the rest of my life.
V
Abstract
ABSTRACT
Several masonry structures are constructed around the world, many of them centuries old.
There is a great concern in preserving and rehabilitating these structures, always maintaining
their historical, cultural and social value. Many of the retrofitting methods used nowadays do
not respect these values. Currently, is common to use composites, such as FRPs, to strength
and rehabilitate masonry structures. These composites are composed by a matrix and fibers,
being the matrices usually epoxy and the fibers commonly of carbon, glass and basalt.
Although solutions using FRPs are very efficient for concrete, for masonry constructions, the
behavior is not the same. The epoxy matrices are not compatible with the masonry substrate
and the fibers normally used are too stiff. This problem can be solved using the Textile
Reinforced Mortar (TRM) reinforcement system. This system replaces the epoxy matrix by an
inorganic matrix, which is more physically and chemically compatible with masonry. Being
this technique relatively new, it is necessary to make the experimental characterization of this
method to understand its behavior under different circumstances.
In this dissertation, the characterization of this reinforcement technique is made through
experimental tests of bond, traction and shear. There are also performed tests under cyclic
loading which provide further knowledge on the subject, helping understand better the
behavior of the system und seismic activity. The matrix used is a commercialized hydraulic
lime mortar and the fibers are of glass and steel. This work will generate new knowledge
mainly on the fiber/matrix and reinforcement/substrate interface behavior in the TRM
reinforcement system, necessary for the calibration of numerical models and for the future
exploration and application of this reinforcement system on structural components. This work
will also provide knowledge on the different tests setups and their advantages and
disadvantages.
KEY-WORDS: Textile Reinforced Mortar; Masonry reinforcement; Experimental
characterization; Composite materials; Cyclic loadings.

VI
Compatible strengthening of masonry Structures based on the TRM technique
VII
Resumo
RESUMO
Existem várias estruturas de alvenaria construídas no mundo, muitas delas com séculos de
idade. Existe uma grande preocupação em preservar e reabilitar estas estruturas, mantendo
sempre o seu valor histórico, cultural e social. Muitos dos métodos de reabilitação usados hoje
em dia não respeitam esses valores. Atualmente, é comum o uso de compósitos, tais como
FRPs, para fortalecer e reabilitar estruturas de alvenaria. Estes compósitos são compostos por
uma matriz e fibras, sendo as matrizes usualmente de epóxi e as fibras normalmente de
carbono, vidro e basalto. Embora as soluções usando FRPs sejam muito eficientes para o
betão, para as construções de alvenaria, o comportamento não é o mesmo. As matrizes de
epóxi não são compatíveis com o substrato de alvenaria e as fibras, normalmente utilizadas,
são demasiado rígidas. Este problema pode ser resolvido usando o sistema TRM (Textile
Reinforced Mortar). Este sistema substitui a matriz de epóxi por uma matriz inorgânica, que é
fisicamente e quimicamente mais compatível com as alvenarias. Sendo esta técnica
relativamente nova, é necessário fazer a caracterização experimental deste método para
entender o seu comportamento sob diferentes circunstâncias.
Nesta dissertação, a caracterização desta técnica de reforço é feita através de ensaios
experimentais de aderência, tração e corte. Também foram realizados ensaios com cargas
cíclicas que proporcionam maior conhecimento sobre o assunto, ajudando a compreender
melhor o comportamento do sistema quando sujeito a atividade sísmica. A matriz utilizada é
uma argamassa de cal hidráulica comercial e as fibras são de vidro e aço. Este trabalho irá
gerar novos conhecimentos principalmente sobre o comportamento da interface fibra/matriz e
reforço/substrato no sistema de reforço TRM, necessários para a calibração de modelos
numéricos e para a futura exploração e aplicação deste sistema de reforço em componentes
estruturais. Este trabalho também fornecerá conhecimento sobre diferentes configurações de
ensaio e as suas vantagens e desvantagens.
PALAVRAS-CHAVE: Textile Reinforced Mortar; Reforço de Alvenarias; Caracterização
Experimental; Materiais Compósitos; Carregamentos Cíclicos.

VIII
Compatible strengthening of masonry Structures based on the TRM technique

IX
List of Abbreviations and Acronyms
LIST OF ABBREVIATIONS AND ACRONYMS
TRM – Textile Reinforced Mortar
FRCM – Fabric Reinforced Cementitious Matrix
FRP – Fiber Reinforced Polymer
LVDT – Linear Variable Differential Transducer
URM – Un-Reinforced Masonry
GFRP – Glass Fiber Reinforced Polymer
NHL – Natural Hidraulic Lime
CML – Constructions Materials Laboratory of the University of Minho
LEST – Structures Laboratory of the University of Minho
CEB – Compressed Earth Blocks
DIC – Digital Image Correlation

X
Compatible strengthening of masonry Structures based on the TRM technique
XI
Table of Contents
TABLE OF CONTENTS
Acknowledgments .................................................................................................................... III
Abstract ...................................................................................................................................... V
Resumo ................................................................................................................................... VII
List of Abbreviations and Acronyms ....................................................................................... IX
Table of Contents ..................................................................................................................... XI
List of Figures ......................................................................................................................... XV
List of Tables ......................................................................................................................... XIX
Chapter I - Introduction .......................................................................................................... 1
1.1. Background ...................................................................................................................... 1
1.2. Objectives and methodology ........................................................................................... 1
1.3. Dissertation structure ....................................................................................................... 2
Chapter II - State-of-the-Art review ..................................................................................... 3
2.1. Introduction ..................................................................................................................... 3
2.2. TRM technique ................................................................................................................ 4
2.3. Experimental characterization ......................................................................................... 5
2.3.1. Direct tensile tests ..................................................................................................... 5
2.3.2. Bond tests ............................................................................................................... 10
2.3.3. Shear tests ............................................................................................................... 12
2.3.4. Cyclic tests .............................................................................................................. 17
Chapter III - Experimental characterization of the materials............................................... 19
3.1. Introduction ................................................................................................................... 19
3.2. Materials ........................................................................................................................ 19
3.3. Preparation of the specimens ......................................................................................... 21
3.3.1. Absorption tests ...................................................................................................... 21
3.3.2. Axial compressive tests .......................................................................................... 22

XII
Compatible strengthening of masonry Structures based on the TRM technique
3.3.3. Flexural tests .......................................................................................................... 22
3.3.4. Direct tensile tests .................................................................................................. 22
3.4. Test procedures ............................................................................................................. 23
3.4.1. Absorption tests...................................................................................................... 23
3.4.2. Axial compressive tests .......................................................................................... 25
3.4.3. Flexural tests .......................................................................................................... 26
3.4.4. Direct tensile tests .................................................................................................. 27
3.5. Results and discussion .................................................................................................. 28
3.5.1. Absorption tests...................................................................................................... 28
3.5.2. Axial compressive tests .......................................................................................... 31
3.5.3. Flexural tests .......................................................................................................... 34
3.5.4. Direct tensile tests .................................................................................................. 37
Chapter IV - Experimental characterization of the TRM reinforcement system ................ 41
4.1. Introduction ................................................................................................................... 41
4.2. Preparation of the specimens ........................................................................................ 41
4.2.1. Direct tensile tests .................................................................................................. 42
4.2.2. Fiber-to-mortar bond tests (Pull-out) ..................................................................... 44
4.2.3. Shear tests (Single-lap) .......................................................................................... 49
4.3. Test procedure ............................................................................................................... 51
4.3.1. Direct tensile tests .................................................................................................. 51
4.3.2. Fiber-to-mortar bond tests (Pull-out) ..................................................................... 51
4.3.3. Shear tests (Single-lap) .......................................................................................... 54
4.4. Results and discussion .................................................................................................. 57
4.4.1. Direct tensile tests .................................................................................................. 57
4.4.2. Fiber-to-mortar bond tests (Pull-out) ..................................................................... 61
4.4.3. Shear tests (Single-lap) .......................................................................................... 66
Chapter V - Conclusions and future work .......................................................................... 75

XIII
Table of Contents
5.1. Introduction ................................................................................................................... 75
5.2. General conclusions ....................................................................................................... 75
5.2. Future work ................................................................................................................... 77
Bibliography ............................................................................................................................. 79
Appendices ............................................................................................................................... 85
Appendix I – Materials technical informaion ....................................................................... 85
Appendix II - Complementary information on the absorption tests ..................................... 88
Appendix III - Complementary information on the single-lap tests ..................................... 89
Appendix IV - Complementary information on the direct tensile tests on TRM ................. 95

XIV
Compatible strengthening of masonry Structures based on the TRM technique
XV
List of Figures
LIST OF FIGURES
Figure 2.1 - Typical stress-strain response curve (RILEM TC-250 CSM, 2014a) .................... 6
Figure 2.2 - Geometry of a tensile specimen (Larrinaga et al., 2014)........................................ 6
Figure 2.3 - Lay-out of the uniaxial tensile test setup (Larrinaga et al., 2014). ......................... 7
Figure 2.4 – Tensile test setup (a) (Carozzi and Poggi, 2015). (b) (De Santis and De Felice,
2015). .......................................................................................................................................... 7
Figure 2.5 – Tensile test setup (Arboleda, 2014) ....................................................................... 8
Figure 2.6 – (a) Tensile test specimens (Ghiassi et al., 2016). (b)Tensile test setup (Ghiassi et
al., 2016). .................................................................................................................................... 9
Figure 2.7 – Specimens geometry (RILEM TC-250 CSM, 2014a).......................................... 10
Figure 2.8 – Test specimen configuration (Portal et al., 2014). ............................................... 11
Figure 2.9 – Experimental tests setup (Portal et al., 2014). ...................................................... 11
Figure 2.10 - (b) geometrical details of the specimens; (c) test setup (Ghiassi et al., 2016).... 12
Figure 2.11 - Failure modes in shear bond tests on externally bonded TRM strengthening
systems (Ascione et al., 2015). ................................................................................................. 13
Figure 2.12 - Typical force-slip curves observed in shear bond tests on externally bonded
TRM strengthening systems related to failure modes A, B, and C (a), failure mode D (b),
failure mode E (c), and failure mode F (d) (Ascione et al., 2015). .......................................... 13
Figure 2.13 – Single-lap test setup (D’antino et al., 2014). ..................................................... 14
Figure 2.14 – Single-lap specimens and setup (Ghiassi et al., 2016). ...................................... 14
Figure 2.15 - Experimental setups shear bond tests (De Santis e De Felice, 2015). ................ 15
Figure 2.16 – (a) Specimens geometry (RILEM TC-250 CSM, 2014b).. (b) Possible single-lap
test setup (RILEM TC-250 CSM, 2014b). ............................................................................... 16
Figure 2.17 - Possible transducers to record relative displacement between reinforcement and
substrate (RILEM TC-250 CSM, 2014b). ................................................................................ 17
Figure 2.18 – Comparison between monotonic and cyclic tests (Carozzi e Poggi, 2015) ....... 18
Figure 3.1 – (a) Planitop HDM Restauro. (b) Mapegrid G220. (c) FIDSTEEL 3X2-G 4-12-
500 HARDWIRE. ..................................................................................................................... 20
Figure 3.2 - (a) Casted mortar specimens. (b) Mortar specimen. ............................................. 21
Figure 3.3 - (a) Flexural specimens mold. (b) Flexural tests preparation. ............................... 22
Figure 3.4 – (a) Tensile tests specimen (steel). (b) Tensile tests specimen (glass). ................. 23
Figure 3.5 – Immersion test setup. ........................................................................................... 24
Figure 3.6 – Capillarity test setup. ............................................................................................ 25
XVI
Compatible strengthening of masonry Structures based on the TRM technique
Figure 3.7 – Compressive test setup. ....................................................................................... 25
Figure 3.8 – Flexural test setup. ............................................................................................... 26
Figure 3.9 – Direct tensile tests’ setups. (a) Groups of steel fibers. (b) Groups of glass fibers.
(c) Single fiber of steel. ............................................................................................................ 27
Figure 3.10 - Water absorption by immersion in mortar at the age of (a) 31 days and (b) 92
days. ......................................................................................................................................... 28
Figure 3.11 – Comparison between the average value of water absorption by immersion at 31
and 92 days............................................................................................................................... 29
Figure 3.12 - Water absorption by capillarity in mortar at the age of (a) 43 days and (b) 92
days. ......................................................................................................................................... 30
Figure 3.13 - Comparison between the average value of water absorption by capillarity at 31
and 92 days............................................................................................................................... 31
Figure 3.14 – Compressive stress-strain curves of the mortar at the age of: (a) 3 days. (b) 7
days. (c) 14 days. (d) 28 days. (e) 60 days. (f) 90 days. .......................................................... 32
Figure 3.15 – Evolution of the average compressive strength of the mortar with time. .......... 34
Figure 3.16 – Flexural stress vs. vertical displacement at mid span for the ages of: (a) 7 days.
(b) 14 days. (c) 28 days. (d) 61 days. (e) 92 days. ................................................................... 35
Figure 3.17 - Evolution of the flexural strength of the mortar with time. ............................... 36
Figure 3.18 – Tensile strength of the steel fibers: (a) Single fibers. (b) Groups of 8 fibers. ... 37
Figure 3.19 – Direct tensile tests failure mode (steel). ............................................................ 38
Figure 3.20 - Tensile strength of the glass fibers: (a) Single fibers. (b) Groups of 3 fibers. ... 38
Figure 3.21 - Direct tensile tests failure mode (glass). ............................................................ 39
Figure 4.1 – (a) Type 1 tensile tests specimen. (b) Type 2 tensile tests specimen. ................. 43
Figure 4.2 – Specimens casting procedure: (a) cast of the first mortar layer. (b) Positioning of
the fibers. (c) Type 1 specimens casted. (d) Type 2 specimens casted. ................................... 44
Figure 4.3 – Pull-out type 1 and 2 specimens’ configuration. ................................................. 45
Figure 4.4 – Molds prepared for pull-out (a) type 1 and (b) type 2 specimens. ...................... 46
Figure 4.5 – Resin mold for pull-out specimens. ..................................................................... 46
Figure 4.6 – Resin preparation. ................................................................................................ 47
Figure 4.7 – Pull-out type 1 specimens’ preparation. (a) First layer and fibers casted. (b) Third
layer casted. .............................................................................................................................. 48
Figure 4.8 – Pull-out cylindrical specimens’ casted. ............................................................... 49
Figure 4.9 – Single-lap steel specimen. ................................................................................... 49
Figure 4.10 – Single-lap specimens’ preparation sequence. .................................................... 50

XVII
List of Figures
Figure 4.11 – Tensile tests setup. ............................................................................................. 51
Figure 4.12 – Type 1 specimens test setup. .............................................................................. 52
Figure 4.13 – Type 2 specimens test setup. .............................................................................. 53
Figure 4.14 – Cylindrical specimens test setup. ....................................................................... 53
Figure 4.15 – Loading procedure for the cycle 1. .................................................................... 54
Figure 4.16 – Loading procedure for the cycle 2. .................................................................... 55
Figure 4.17 – Single-lap tests setup. (a) Specimens geometry (Ghiassi et al., 2016). (b) Test
setup (Ghiassi et al., 2016). (c) Side view. (d) Front view. (e) Clamping mechanism. ........... 56
Figure 4.18 – TRM, with glass fibers, tensile strength: (a) TT1; (b) TT2. .............................. 57
Figure 4.19 – TT1 glass specimens’ failure mode.................................................................... 58
Figure 4.20 – TT2 glass specimens’ failure mode.................................................................... 58
Figure 4.21 – TRM, with steel fiber, tensile strength: (a) TT1. (b) TT2. ................................. 59
Figure 4.22 – TT1 steel specimen after testing. ....................................................................... 60
Figure 4.23 – TT2 steel specimens after testing. ...................................................................... 61
Figure 4.24 – Pull-out behavior between the mortar and steel fibers: (a) type 1 specimens; (b)
type 2 specimens; (c) cylindrical specimens. ........................................................................... 62
Figure 4.25 – Pull-out behavior between the mortar and the glass fibers: (a) Single fibers; (b)
Single fibers and transverse fibers; (c) Groups of fibers. ......................................................... 64
Figure 4.26 – Pull-out behaviour between the mortar and the steel fibers: (a) Single fibers; (b)
Single fibers and transverse fibers; (c) Groups of fibers. ......................................................... 65
Figure 4.27 – Slip between the substrate and the fibers. (a) Glass fibers. (b) Steel fibers. ...... 67
Figure 4.28 – Single-lap glass specimens’ failure mode. ......................................................... 67
Figure 4.29 – Single-lap steel specimens’ failure mode. .......................................................... 68
Figure 4.30 – Slip between the substrate and the fibers glass fibers: (a) Specimen G3; (b)
Specimen G4; (c) Specimen G5; (d) Specimen G6. ................................................................. 69
Figure 4.31 – Slip between the substrate and the fibers steel fibers. (a) Specimen S2. (b)
Specimen S3. (c) Specimen S4. (d) Specimen S5. ................................................................... 70
Figure 4.32 – Average peak loads for (a) glass specimens and (b) steel specimens. ............... 71
Figure 4.33 – Loss of strength with the increase of displacement. (a) Glass specimens. (b)
Steel specimens. ....................................................................................................................... 72
Figure 4.34 – Loss of strength for cycle 2. (a) Glass specimens. (b) Steel specimens............. 73
Figure A. 1 – Mortar technical data. ......................................................................................... 85
Figure A. 2 – Glass fibers technical data. ................................................................................. 86
XVIII
Compatible strengthening of masonry Structures based on the TRM technique
Figure A. 3 – Steel fibers technical data. ................................................................................. 86
Figure A. 4 – Resin technical data. .......................................................................................... 87
Figure A. 5 – Glue technical data. ........................................................................................... 87
Figure A. 6 – Silicone technical data. ...................................................................................... 88
Figure A. 7 – Capillarity retests for the specimens with 43 days of age. ................................ 88
Figure A. 8 – Comparison between the peak loads for the steel specimens under cycle 1
loading. ..................................................................................................................................... 90
Figure A. 9 - Comparison between the peak loads for the glass specimens under cycle 1
loading. ..................................................................................................................................... 91
Figure A. 10 – Slip between the substrate and the fibers for the steel specimens under the
cycle 2 loading. ........................................................................................................................ 92
Figure A. 11 - Slip between the substrate and the fibers for the glass specimens under the
cycle 2 loading. ........................................................................................................................ 93
Figure A. 12 - Single-lap monotonic results from the internal displacement (steel). .............. 94
Figure A. 13 - Single-lap monotonic results from the internal displacement (glass). ............. 94
Figure A. 14 – Clip-gauge results from TT1 steel specimens. ................................................ 95
Figure A. 15 – Clip-gauge results from TT2 steel specimens. ................................................ 95
XIX
List of Tables
LIST OF TABLES
Table 3.1 – Bulk density of the mortar. .................................................................................... 30
Table 3.2 - Evolution of the compressive strength of the mortar with time (average values). 34
Table 3.3 - Evolution of the flexural strength of the mortar with time (average values). ........ 37
Table 3.4 – Average tensile strength of the fibers. ................................................................... 39
Table 4.1 – Number of specimens produced. ........................................................................... 42
Table 4.2 – Average results for maximum force and corresponding displacement (glass
fibers). ....................................................................................................................................... 59
Table 4.3 - Average results for maximum force and corresponding slip values (steel fibers). 61
Table 4.4 – Average pull-out strength and associated slip between the mortar and the steel
fiber for different setups. .......................................................................................................... 63
Table 4.5 – Average bond strength between the mortar and the fibers. ................................... 66
Table 4.6 – Average maximum load slip between the mortar and fibers. ................................ 68
Table 4.7 – Average difference between peaks of load. ........................................................... 71
Table 4.8 - Average maximum load for cycle 1. ...................................................................... 72
Table 4.9 – Average maximum load for cycle 2. ..................................................................... 73

XX
Compatible strengthening of masonry Structures based on the TRM technique
1
Introduction
CHAPTER I - INTRODUCTION
1.1. Background
The extensive existing built heritage is under continuous deterioration due to natural and man-
made hazards. As these structures have vast cultural and economic values, they should be
carefully preserved. Development of advanced rehabilitation and strengthening methods is
thus of critical importance in this field of structural engineering. Structures can undergo
interventions in order to improve their performance conserving their initial functionality, or
even to have new functions. In most of the historical built heritage (palaces, churches,
monuments, etc.), there is a need to maintain their cultural value (particularly their
authenticity) as much as possible. Development of economic and efficient rehabilitation and
strengthening techniques that have the above-mentioned characteristics and are compatible
with the existing construction are current topics in many scientific studies. In this context,
there has been an interest in the use of composite materials reinforced with fibers, namely
Fiber Reinforced Polymers (FRP) composites. Despite the advantages of using FRPs, these
composites are relatively brittle, are often incompatible with the masonry and have a poor
performance under high temperature conditions (fire exposure). Therefore, there is a tendency
to search for new solutions, mainly based on the use of inorganic matrices, which can have
better (mechanical, physical and chemical) compatibility with masonry structures. In this
regard, Textile Reinforced Mortars (TRMs) have received extensive attention as a sustainable
and compatible substitute for FRPs. TRMs are made of continuous fibers embedded in an
inorganic mortar. However, there are still many uncertainties regarding the TRM
reinforcement systems. The mechanical performance, durability and test and design
procedures are still not available.
This work intends to contribute to the mechanical characterization of this innovative
materials. This dissertation presents a set of experimental tests that aim to characterize the
behavior of the materials used in the TRM reinforcement system as well the strengthened
masonry.
1.2. Objectives and methodology
The main objective of this dissertation is to experimentally characterize the mechanical
behavior of TRM reinforcements (at the material and composite level) and the bond between

2
Compatible strengthening of masonry Structures based on the TRM technique
TRM and masonry substrates under static monotonic and static cyclic loading conditions.
This study is defined based on the previous knowledge developed about this subject in the
Historical and Masonry Structures (HMS) section at the University of Minho.
The main following tasks have been followed for fulfilling the objectives of the thesis:
A deep state-of-the-art review on the foundations of masonry rehabilitation, TRM
reinforcement technique, and mechanical test methods (with focus on different test
setups and measuring systems);
Mechanical characterization of component materials;
Characterization of the fiber-to-mortar bond performance considering the influence of
the test setup, the number of fibers and the presence of transverse fibers under
monotonic pull-out loading;
Characterization of the tensile response of TRMs under monotonic tensile loading
considering the effect of different gripping methods;
Characterization of the TRM-to-masonry bond behavior under shear static monotonic
and static cyclic loading.
1.3. Dissertation structure
This dissertation is divided into five chapters. The first chapter is the introduction, where the
main goal is to clarify the dissertation theme, the objectives and the conducted work.
The second chapter is related to the theoretical backgrounds and the state-of-the-art review.
The chapter includes the previous studies performed on masonry retrofitting, the TRM
reinforcement system and experimental characterization of these composites.
The third chapter presents the experimental characterization of the materials used in the TRM
system, namely the fibers and the matrix. The materials preparation procedures, the
preparation of the specimens, the tests procedures, the results and it discussion are presented
in this chapter.
The fourth chapter presents the experimental characterization of the TRM reinforcement
system. The procedures followed for preparation of the specimens, for performing the tests
and the obtained results are presented and discussed for tensile and shear bond tests.
In the fifth and last chapter, the main conclusions are drawn by analyzing the results
presented. Suggestions for future works to further explore the performance of TRM
reinforcement system are also presented in this chapter.
3
State-of-the-Art review
CHAPTER II - STATE-OF-THE-ART REVIEW
2.1. Introduction
Masonry construction is one of the oldest types of building. Historical monuments, such as
the Egyptian Pyramids, The Colosseum of Rome, Taj Mahal and The Great Wall of China,
were built using this technique and still stand through time. Masonry constructions are built
by stably laying individual units of different materials bonded together forming a structure
that works as a whole. Many materials can be used in masonry, natural or artificial, such as
clay bricks, stone, concrete blocks and even more uncommon materials like earth blocks
(CEB) and others. In the beginning, the masonry structures were built by stacking stones and
filling the empty spaces with smaller stones, dirt and straw. Nowadays, these structures are
usually constructed using industrialized clay bricks and concrete blocks, which are laid in a
designed way and bonded with mortar and are usually used in residential buildings.
Concrete and steel are the usual materials used in construction today, but masonry is still very
important in the construction of walls, with or without a structural function. Strength,
durability, fire protection, sound and thermal isolation are some of the qualities that make
masonry one of the best options for building walls. There are a lot of types and configurations
of masonry units in the market. This makes it easier and better to construct masonry,
compared to the past, and makes it possible to build with more quality, less workmanship and
a different aesthetic variety.
During its life, the structures are exposed to natural hazards such as wind, temperature, water
and seismic activity. Although the masonry has a high durability, these natural phenomena
damage the structures, lowering its capacities including its strength.
Masonry has a unique behavior with an excellent compressive strength, but low tensile and
shear strengths, making masonry structures very vulnerable to earthquakes and in danger of
destruction in seismic areas. In particular, masonry infilled walls are very vulnerable
structural components during an earthquake. With seismic forces, the masonry walls detach
from the columns and beams and, the entire wall, might fall due to out of plane failure.
Besides the patrimonial damage, it can also kill people, so, preventing this behavior is a big
concern.

4
Compatible strengthening of masonry Structures based on the TRM technique
The number of buildings constructed with masonry is high and holds a high patrimonial and
cultural value many times, so, there is a big concern in preventing and repairing damages in
this kind of structures. Interventions may therefore be applied to improve the structural
performance so that it can safely fulfill its original functions or it can be upgraded to fulfil
new functions. For historical constructions, it is important that, during the intervention, the
cultural value is not corrupted and the authenticity is maintained. There are different ways to
repair and reinforce masonry structures, but some may not respect these important issues.
Compatibility with the substrate, durability, economic aspects, among others, should also be
considered in choosing a strengthening method.
The usage of composite materials for retrofitting structures is a growing area in the Civil
Engineering, providing some competitive solutions. For retrofitting masonry walls, the
composites are also a very competitive option where there is still much to study and improve.
Textile reinforced mortars (TRMs), also known as fiber-reinforced cementitious matrix
(FRCM), are one of the most promising composite systems for strengthening and
rehabilitation of masonry construction providing a sustainable and durable solution. The
system is composed of fibers that can be from different materials such as steel, glass, basalt
and PBO, and an inorganic matrix, a mortar, instead of the traditional resin used in the FRP
systems. The use of an inorganic matrix provides a better mechanical, physical and chemical
compatibility between the reinforcement system and the weak substrate, typical of traditional
masonry. Unlike the systems that use epoxy, this system does not damage the substrate when
implemented, and does not compromise neither the historic value nor the authenticity of the
construction.
2.2. TRM technique
TRM composites are advanced mortar-based materials that recently received attention for
strengthening of masonry or concrete structures. The system is usually composed of a dry grid
of fibers embedded in mortar (Carozzi and Poggi, 2015). In composite reinforcement
solutions, the matrix guarantees the uniform distribution of the stress and the connection
between the fibers and the substrate and, therefore, the transmission of the stress to the fibers.
Using a mortar matrix ensures resistance to high temperatures, thermal and chemical
resistance, compressive strength, compatibility with the substrate, and reversibility and a
reduction in material and installation costs, compared to the use of organic matrices (Marques,
5
State-of-the-Art review
2014). In this dissertation glass and steel fibers are used as reinforcing materials. The steel
fibers are durable and resistant and are composed of aligned rovings of steel filaments twisted
together, with a very small diameter. The glass fibers are composed of yarns of dry fibers
configured as a grid. These fibers are lightweight, easy to handle, flexible in case of steel,
have high chemical resistance and high mechanical properties, especially tensile strength.
2.3. Experimental characterization
For a better understanding of the TRM reinforcement systems, it is important to perform
experimental tests to characterize their mechanical properties. In this dissertation, direct
tensile, pull-out and single-lap tests are performed. Several test setups were studied to choose
the best setup option.
2.3.1. Direct tensile tests
Direct tensile tests are performed to understand the behavior of the TRM reinforcement
system in tension and to determine the values necessary for analysis and design of structural
elements. To provide accurate material characteristics for design, the geometric relationships
between the microstructure and the stresses in the test specimens as well as the boundary
conditions must correlate to those in the product to be designed (Arboleda, 2014). The tensile
behavior of mortar-based composites is different from that of polymeric matrices due to the
brittleness of the inorganic matrix while inorganic matrices crack before the maximum strain
of the textile is reached. After cracking, the tensile stress is carried entirely by the fibers.
(Larrinaga et al., 2014).
As can be seen in Figure 2.1, the results for the tensile tests usually have three phases. The
first phase is the un-cracked stage, in which the mortar contributes to load bearing and
stiffness. The second phase is the crack development stage during which crack pattern
develops progressively. The third and final phase is the cracked stage in which crack pattern
is completely developed and only the fibers continue to work (De Santis and De Felice,
2015).

6
Compatible strengthening of masonry Structures based on the TRM technique
Figure 2.1 - Typical stress-strain response curve (RILEM TC-250 CSM, 2014a)
The gripping method is one of the most important parts of the tensile tests setup because it
defines how the loading is going to be transferred to the specimens. According to the
literature, there are two main gripping methods. The most common method is to apply the
grip directly to the matrix. The other method is to apply the grip to the dry fibers.
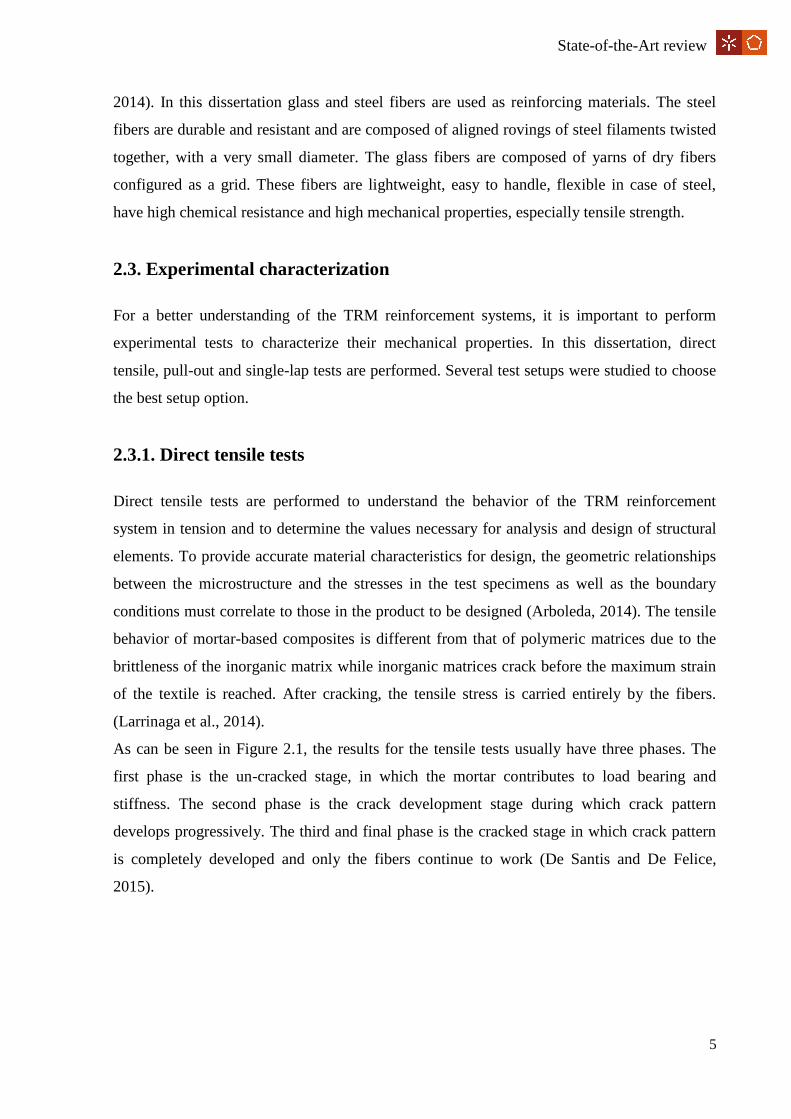
Tests using the first gripping method were carried out in (Larrinaga et al., 2014). For these
tests, the specimens’ geometry used is represented in Figure 2.2. It was used an extra
reinforcement layer was used in the ends of the specimens, with 200 mm of length, to
guarantee that the failure mode occurred in the middle of the specimen. Metallic clamps were
used to fix the specimens and the test were performed under displacement control with a rate
of 0.5 mm/min. To measure the slip, two transducers were used. These transducers measured
the displacement of between two steel plates attached to the specimens, as shown in Figure
2.3.
Figure 2.2 - Geometry of a tensile specimen (Larrinaga et al., 2014).
7
State-of-the-Art review
Figure 2.3 - Lay-out of the uniaxial tensile test setup (Larrinaga et al., 2014).
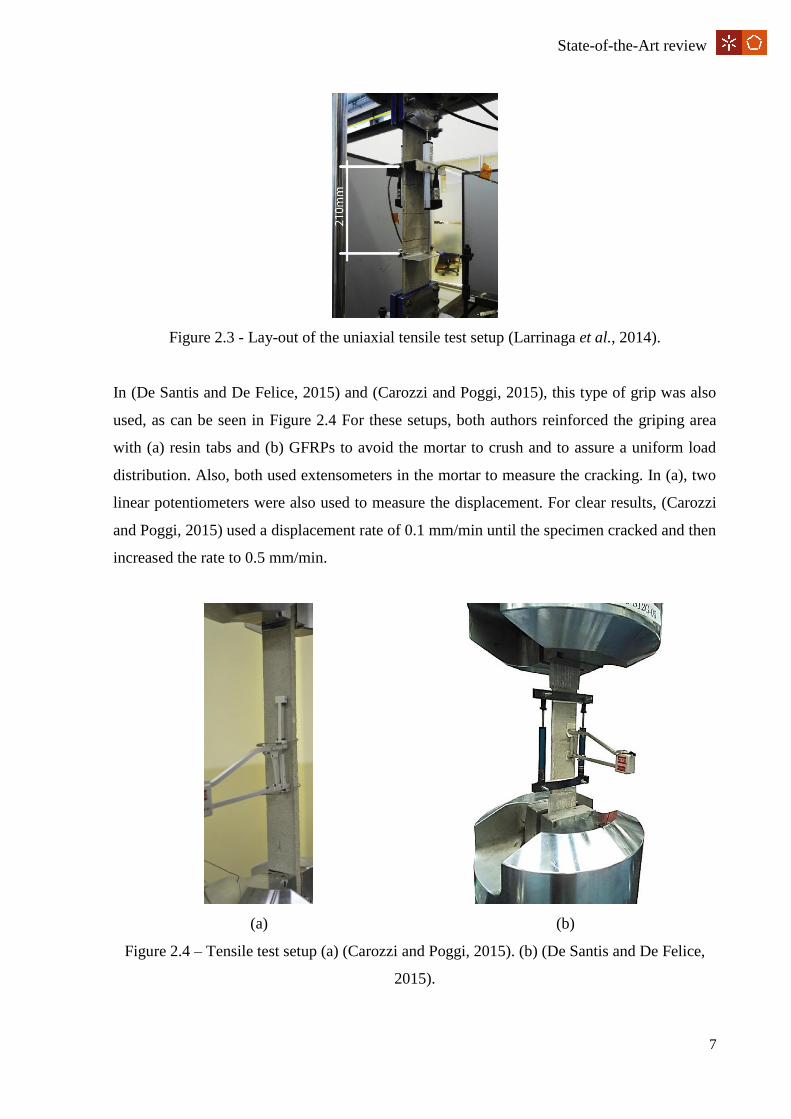
In (De Santis and De Felice, 2015) and (Carozzi and Poggi, 2015), this type of grip was also
used, as can be seen in Figure 2.4 For these setups, both authors reinforced the griping area
with (a) resin tabs and (b) GFRPs to avoid the mortar to crush and to assure a uniform load
distribution. Also, both used extensometers in the mortar to measure the cracking. In (a), two
linear potentiometers were also used to measure the displacement. For clear results, (Carozzi
and Poggi, 2015) used a displacement rate of 0.1 mm/min until the specimen cracked and then
increased the rate to 0.5 mm/min.
(a) (b)
Figure 2.4 – Tensile test setup (a) (Carozzi and Poggi, 2015). (b) (De Santis and De Felice,
2015).
8
Compatible strengthening of masonry Structures based on the TRM technique
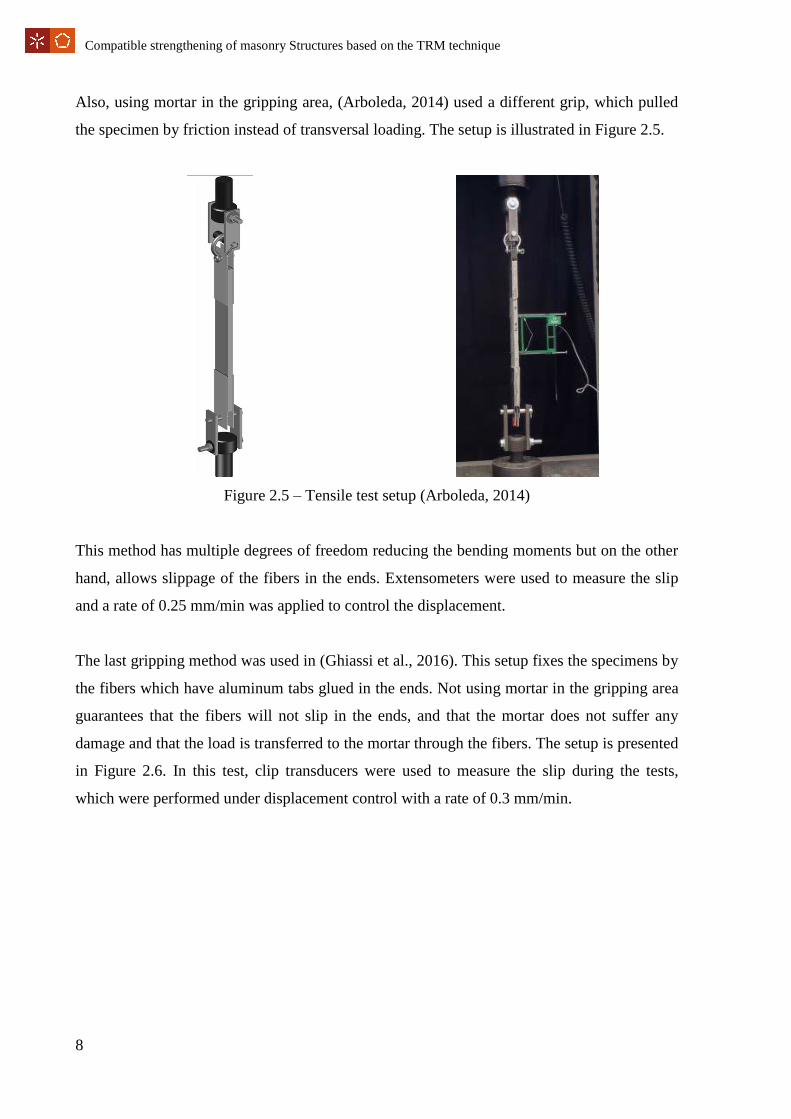
Also, using mortar in the gripping area, (Arboleda, 2014) used a different grip, which pulled
the specimen by friction instead of transversal loading. The setup is illustrated in Figure 2.5.
Figure 2.5 – Tensile test setup (Arboleda, 2014)
This method has multiple degrees of freedom reducing the bending moments but on the other
hand, allows slippage of the fibers in the ends. Extensometers were used to measure the slip
and a rate of 0.25 mm/min was applied to control the displacement.
The last gripping method was used in (Ghiassi et al., 2016). This setup fixes the specimens by
the fibers which have aluminum tabs glued in the ends. Not using mortar in the gripping area
guarantees that the fibers will not slip in the ends, and that the mortar does not suffer any
damage and that the load is transferred to the mortar through the fibers. The setup is presented
in Figure 2.6. In this test, clip transducers were used to measure the slip during the tests,
which were performed under displacement control with a rate of 0.3 mm/min.

9
State-of-the-Art review
(a) (a)
Figure 2.6 – (a) Tensile test specimens (Ghiassi et al., 2016). (b)Tensile test setup (Ghiassi et
al., 2016).
The RILEM Technical Group 250-CSM issued a recommendation named “Round-robin test
on the tensile behavior of mortar-based strengthening systems”, (RILEM TC-250 CSM,
2014a). This recommendaion states that the tensile specimens should be composed by two
layers of mortar and one of fibers in the middle. These fibers and mortar should be from the
same manufacture. The geometry of the specimens is presented in Figure 2.6. Concernig the
gripping, it is stated that an homogeneous stress distribution should be assured. For that and
for preventing damage in the mortar, FRP reinforcements or tabs should be applied in the
ends, however these reainforcements should be soft enough to avoid local stress
concentrations.
The displacement must not be higher than 0.3 mm/min, yet, it can be increased after the
mortar craking. To measure the slip, displacement transducers, extensometers,
potenciometers, LVDTs or digital indicators can be used. To measure the tensile modulus of
elasticity in the first phase, local strain measures shoul be used.

10
Compatible strengthening of masonry Structures based on the TRM technique
Figure 2.7 – Specimens geometry (RILEM TC-250 CSM, 2014a).
2.3.2. Bond tests
In fiber composite materials, the bond behavior between the yarn or roving and the matrix is a
principal factor influencing the global structural behavior (Portal et al., 2014). Yarns or
rovings are groups of filaments that create a heterogeneous structure. Pull-out tests are a
typical method used to understand the shear bond phenomenon between the fibers and its
surrounding matrix. In this tests, the fibers are pulled from the matrix through tensile loading.
The main types of test configurations known from literature include one-sided and double-
sided pull-out tests (Portal et al., 2014). In one-sided configurations, used in (Banholzer,
2006), (Zhang et al., 2013), (Tuyan and Yazıcı, 2012), (Baena et al., 2016) and (Ghiassi et al.,
2016), the fibers are embedded in the matrix only in one side of the specimens while on
double-sided configuration, used in (Lorenz and Ortlepp, 2012) and (Portal et al., 2014), the
matrix is present in both sides of the specimens.
In the double-sided solution presented in (Portal et al., 2014), a mortar prism with a fiber
roving inside were used, as presented in Figure 2.8. To limit the length of the fibers inside the
mortar, a saw cut was made, in the middle of the specimens, that went through the mortar and
the fibers, cutting the fibers to the desired length. Another two saw cuts were made in each
side of the mortar, not cutting the fibers. This cuts are used to isolate the fiber and guarantee
that the mortars cracks and the fibers slip in that place. The test setup is presented in Figure
2.9. The test setup is similar to a tensile test, where the mortar is gripped by wood clamps and
pulled. To measure the displacement, two LVDTs were used, attached to supports fixed on the
specimens.

11
State-of-the-Art review
Figure 2II.8 – Test specimen configuration (Portal et al., 2014).
Figure 2.9 – Experimental tests setup (Portal et al., 2014).
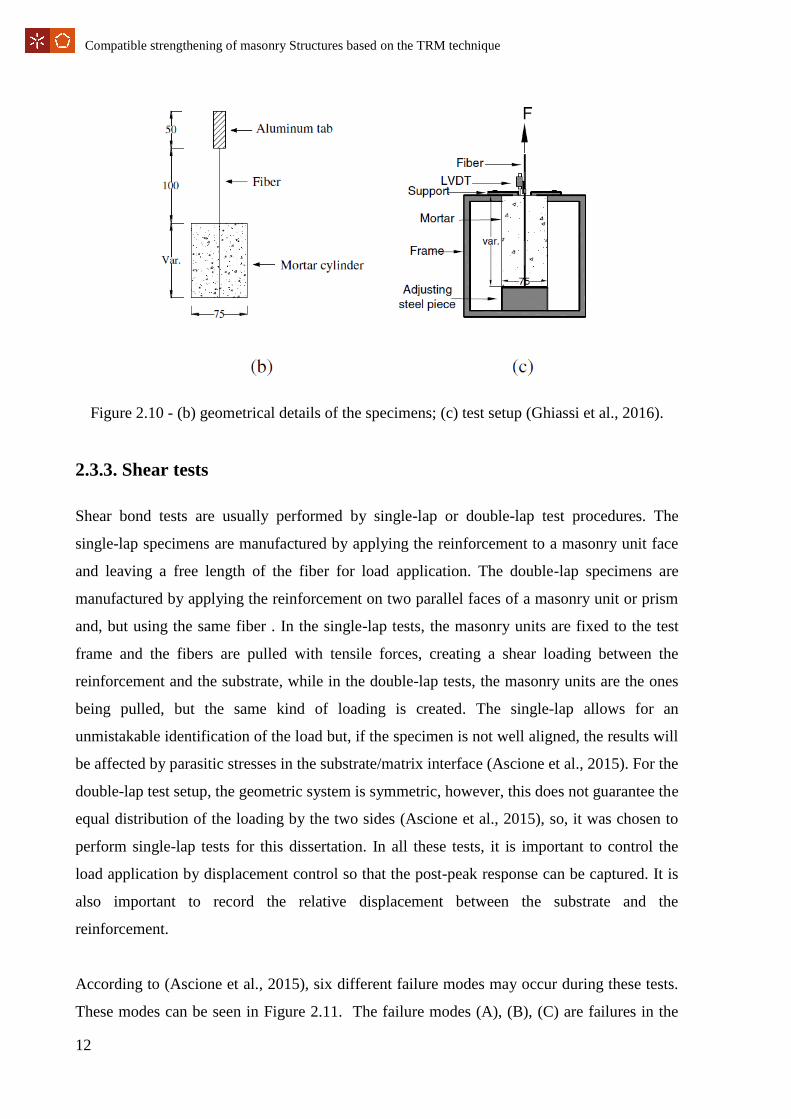
In the test carried out by (Ghiassi et al., 2016), a one-sided configuration was used. In these
tests, cylindrical mortar prims were used. Fibers were placed inside the cylinders with a free
length left to facilitate gripping. Aluminum tabs were glued in the ends of the fibers to obtain
a better grip. The geometrical details are presented in Figure 2.10(b). To perform the tests, the
specimens were blocked in a rigid frame and the fibers were pulled. The test setup is
presented in Figure 2.10 (c). The tests were performed under displacement control with a rate
of 0.3 mm/min. To measure the displacement between the fibers and the matrix, an LVDT
was glued to the fibers, which proved to be difficult to set up. To resolve this problem, resin
can be used as in (Banholzer, 2006), where the fibers were inside a resin prism. This system
provides a good grip, less chance of fiber damage and a better surface to glue the LVDTs, and
therefore, guarantees better results.
12
Compatible strengthening of masonry Structures based on the TRM technique
Figure 2.10 - (b) geometrical details of the specimens; (c) test setup (Ghiassi et al., 2016).
2.3.3. Shear tests
Shear bond tests are usually performed by single-lap or double-lap test procedures. The
single-lap specimens are manufactured by applying the reinforcement to a masonry unit face
and leaving a free length of the fiber for load application. The double-lap specimens are
manufactured by applying the reinforcement on two parallel faces of a masonry unit or prism
and, but using the same fiber . In the single-lap tests, the masonry units are fixed to the test
frame and the fibers are pulled with tensile forces, creating a shear loading between the
reinforcement and the substrate, while in the double-lap tests, the masonry units are the ones
being pulled, but the same kind of loading is created. The single-lap allows for an
unmistakable identification of the load but, if the specimen is not well aligned, the results will
be affected by parasitic stresses in the substrate/matrix interface (Ascione et al., 2015). For the
double-lap test setup, the geometric system is symmetric, however, this does not guarantee the
equal distribution of the loading by the two sides (Ascione et al., 2015), so, it was chosen to
perform single-lap tests for this dissertation. In all these tests, it is important to control the
load application by displacement control so that the post-peak response can be captured. It is
also important to record the relative displacement between the substrate and the
reinforcement.
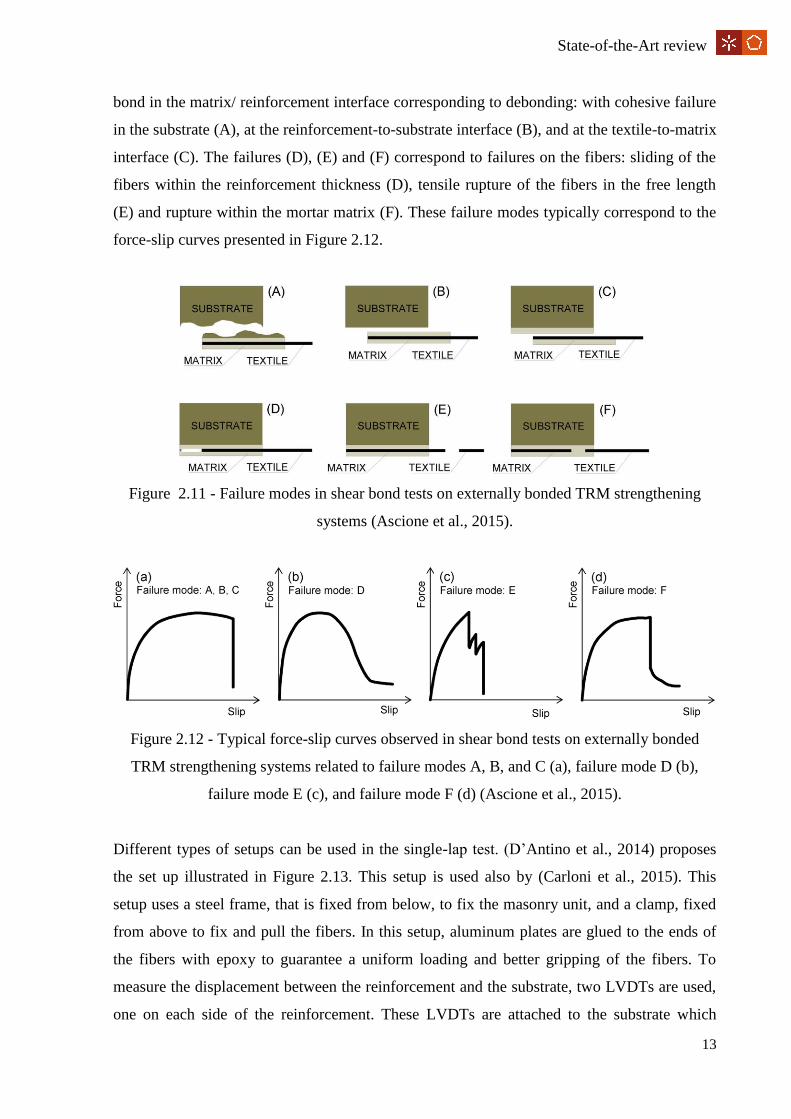
According to (Ascione et al., 2015), six different failure modes may occur during these tests.
These modes can be seen in Figure 2.11. The failure modes (A), (B), (C) are failures in the
13
State-of-the-Art review
bond in the matrix/ reinforcement interface corresponding to debonding: with cohesive failure
in the substrate (A), at the reinforcement-to-substrate interface (B), and at the textile-to-matrix
interface (C). The failures (D), (E) and (F) correspond to failures on the fibers: sliding of the
fibers within the reinforcement thickness (D), tensile rupture of the fibers in the free length
(E) and rupture within the mortar matrix (F). These failure modes typically correspond to the
force-slip curves presented in Figure 2.12.
Figure 2.11 - Failure modes in shear bond tests on externally bonded TRM strengthening
systems (Ascione et al., 2015).
Figure 2.12 - Typical force-slip curves observed in shear bond tests on externally bonded
TRM strengthening systems related to failure modes A, B, and C (a), failure mode D (b),
failure mode E (c), and failure mode F (d) (Ascione et al., 2015).
Different types of setups can be used in the single-lap test. (D’Antino et al., 2014) proposes
the set up illustrated in Figure 2.13. This setup is used also by (Carloni et al., 2015). This
setup uses a steel frame, that is fixed from below, to fix the masonry unit, and a clamp, fixed
from above to fix and pull the fibers. In this setup, aluminum plates are glued to the ends of
the fibers with epoxy to guarantee a uniform loading and better gripping of the fibers. To
measure the displacement between the reinforcement and the substrate, two LVDTs are used,
one on each side of the reinforcement. These LVDTs are attached to the substrate which

14
Compatible strengthening of masonry Structures based on the TRM technique
measure the displacement with an Ω-shaped aluminum plate that is glued to the fibers. For
this setup, displacement rate used was 0.05 mm/min.
Figure 2.13 – Single-lap test setup (D’antino et al., 2014).
A similar test setup was used in (Ghiassi et al., 2016), but in this case, a smaller displacement
rate, 0.3mm/min, was used. The Figure 2.14 shows the scheme of the specimens and the test
setup.
Figure 2.14 – Single-lap specimens and setup (Ghiassi et al., 2016).
A different setup, however, was used in (De Santis and De Felice, 2015) and (Ascione et al.,
2015) for performing the single-lap shear tests, see Figure 2.15. In this setup, a steel frame is
used, which is clamped from above to fix the masonry unit and a clamp is used at the bottom

15
State-of-the-Art review
to fix and pull the fibers. To measure the displacement between the substrate and the
reinforcement, two LVDTs were attached to the masonry unit in each side of the
reinforcement. In this case, an extensometer was also applied on the fibers to measure
displacements within the fiber mesh. An even lower displacement rate was used in this setup
(0.18 mm/min).
Figure 2.15 - Experimental setups shear bond tests (De Santis e De Felice, 2015).
(De Felice et al., 2014) used a similar setup where the masonry unit was fixed from the above.
In this case the measuring system was different. The displacement between the substrate and
the reinforcement was measured with two LVDTs attached to the frame. One measuring the
displacement between the frame and the reinforcement and another measuring the
displacement between the substrate and the frame. Combining the data obtain by the two
LVDTs, it was possible to obtain the slip of the fibers. In this case, a displacement rate of 0.48
mm/min was used for performing the tests.
The RILEM technical committee 250-CSM issued a recommendation for single-lap tests of
mortar-based strengthening systems on masonry substrate, (RILEM TC-250 CSM, 2014b).
This recommendation implies the substrate geometry, production and condition, the
specimens’ preparation and the tests setup for single-lap and double-lap setups. This
recommendation specifies a steel frame should be used for the setup to avoid rotations and
distortions. The fibers should be subjected to pull-out forces by application of the grip on
aluminum, steel, plumb or GRFP plates glued on the free end of dry fibers. To promote a
16
Compatible strengthening of masonry Structures based on the TRM technique
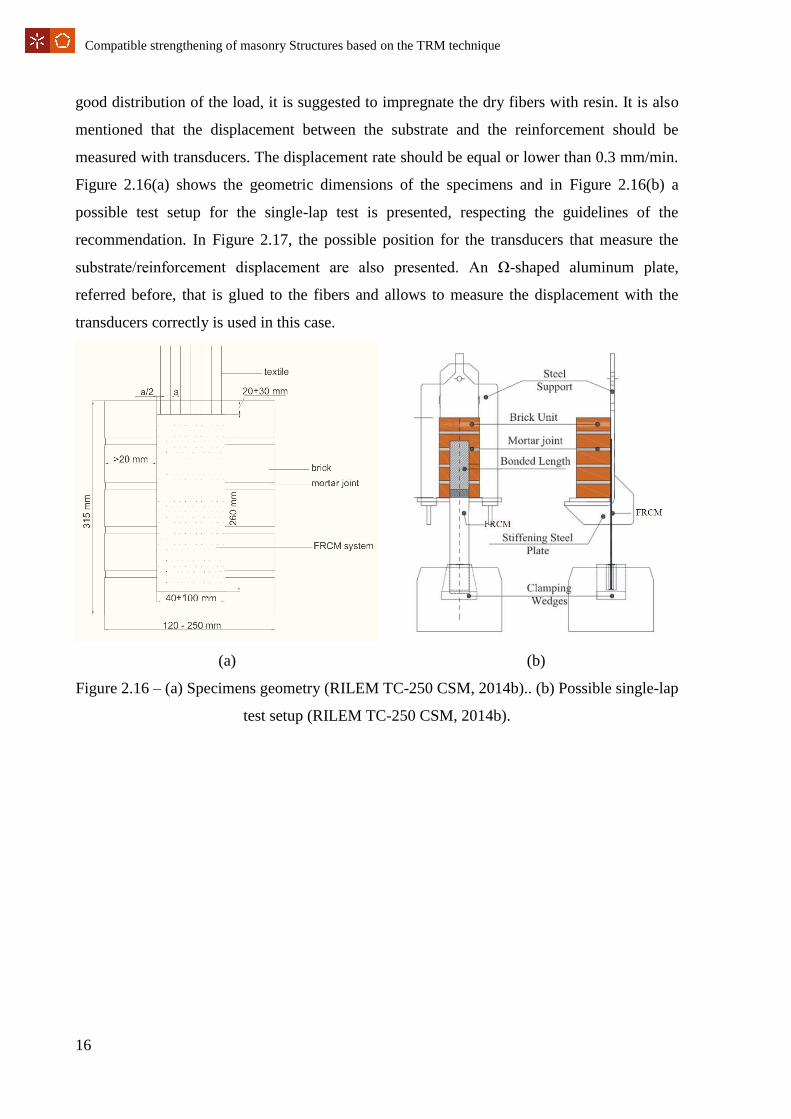
good distribution of the load, it is suggested to impregnate the dry fibers with resin. It is also
mentioned that the displacement between the substrate and the reinforcement should be
measured with transducers. The displacement rate should be equal or lower than 0.3 mm/min.
Figure 2.16(a) shows the geometric dimensions of the specimens and in Figure 2.16(b) a
possible test setup for the single-lap test is presented, respecting the guidelines of the
recommendation. In Figure 2.17, the possible position for the transducers that measure the
substrate/reinforcement displacement are also presented. An Ω-shaped aluminum plate,
referred before, that is glued to the fibers and allows to measure the displacement with the
transducers correctly is used in this case.
(a) (b)
Figure 2.16 – (a) Specimens geometry (RILEM TC-250 CSM, 2014b).. (b) Possible single-lap
test setup (RILEM TC-250 CSM, 2014b).

17
State-of-the-Art review
Figure 2.17 - Possible transducers to record relative displacement between reinforcement and
substrate (RILEM TC-250 CSM, 2014b).
2.3.4. Cyclic tests
Experimental studies characterizing the mechanical properties under cyclic loadings are very
important to understand the behavior of the TRM system under seismic loads. These tests
allow to develop the required theoretical background for future application of this technique
as a seismic reinforcement technique for masonry. However, very few studies have been done
in this field. The tests performed on masonry walls reinforced with the TRM technique under
cyclic loading in (Almeida et al., 2015) showed a stiffness degradation during each cycle and
a deterioration of the strengthening mechanisms. In (Carozzi and Poggi, 2015), cyclic
loadings were imposed during the tensile tests on TRM composites. The results are presented
in Figure 2.18. A good correlation between the monotonic and cyclic curves was observed.
The tests showed a reduction of the maximum load with the number of cycles. It seems that in
the first cycles, the initial part of the reloading path is apparently similar to the elastic stiffness
of the starting cycle. For higher loads, however, the slope of the reloading path decreases.

18
Compatible strengthening of masonry Structures based on the TRM technique
Figure 2.18 – Comparison between monotonic and cyclic tests (Carozzi e Poggi, 2015)
19
Experimental characterization of the materials
CHAPTER III - EXPERIMENTAL CHARACTERIZATION OF
THE MATERIALS
3.1. Introduction
Before starting the experimental characterization of the TRM reinforcement system, it was
necessary to characterize the materials that were going to be used in the tests. For that
characterization, four different types of tests were performed, as follows: (a) absorption tests;
(b) axial compressive tests on the mortar; (c) flexural tests on the mortar; (d) direct tensile
tests on the dry fibers.
The mortar specimens and tests were made and performed in the Construction Materials
Laboratory, while the tensile tests were performed in the Structures Laboratory (LEST).
The compressive and flexural tests were performed at different ages. These tests aim to
characterize the compressive and flexural strength of the mortar. Performing these mechanical
tests at different ages, shows the changes of mechanical properties of the mortar with time.
This information is of great importance at the design and application stages and can be used
as the input of durability studies.
Two kind of absorption tests were done, immersion and capillarity tests. These tests help to
understand the behavior of the mortar when exposed to water.
The direct tensile tests were performed considering two different specimen geometries and
two different materials. The tests were performed on specimens made of steel and glass fibers
consisting of (i) a single fiber, (ii) groups of 3 fibers of glass and (iii) groups of 8 fibers of
steel. This allows to comprehend the maximum tensile strength of the fibers as a singulars and
as groups.
3.2. Materials
All the tests performed for this dissertation were done using the same materials. Solid clay
bricks were used as the substrate (for the single-lap tests). The bricks were taken from the
same batch and their surfaces were sand blasted three times before application of the TRM
system as suggested in (Razavizadeh et al., 2014).
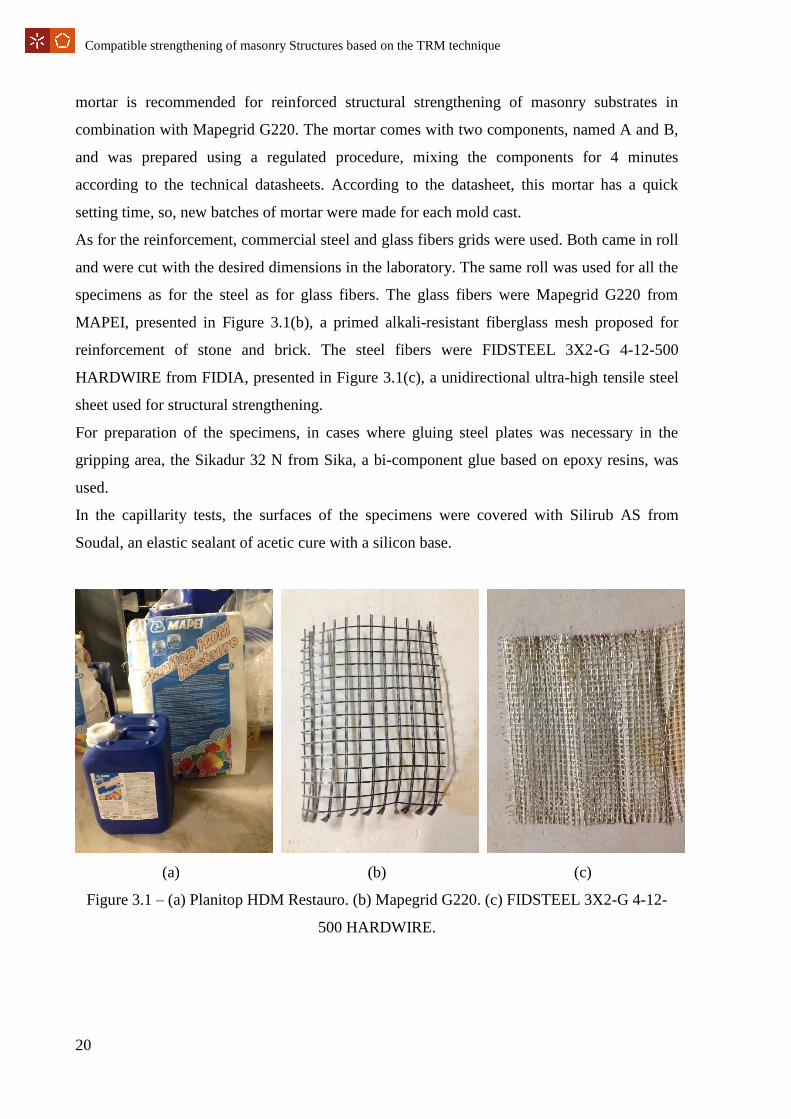
The TRM system was composed of a commercial mortar and two different commercial fibers.
For the mortar, a natural high-ductility hydraulic lime (NHL) and Eco-Pozzolan based mortar
from MAPEI named Planitop HDM Restauro was used, presented in Figure 3.1(a). This
20
Compatible strengthening of masonry Structures based on the TRM technique
mortar is recommended for reinforced structural strengthening of masonry substrates in
combination with Mapegrid G220. The mortar comes with two components, named A and B,
and was prepared using a regulated procedure, mixing the components for 4 minutes
according to the technical datasheets. According to the datasheet, this mortar has a quick
setting time, so, new batches of mortar were made for each mold cast.
As for the reinforcement, commercial steel and glass fibers grids were used. Both came in roll
and were cut with the desired dimensions in the laboratory. The same roll was used for all the
specimens as for the steel as for glass fibers. The glass fibers were Mapegrid G220 from
MAPEI, presented in Figure 3.1(b), a primed alkali-resistant fiberglass mesh proposed for
reinforcement of stone and brick. The steel fibers were FIDSTEEL 3X2-G 4-12-500
HARDWIRE from FIDIA, presented in Figure 3.1(c), a unidirectional ultra-high tensile steel
sheet used for structural strengthening.
For preparation of the specimens, in cases where gluing steel plates was necessary in the
gripping area, the Sikadur 32 N from Sika, a bi-component glue based on epoxy resins, was
used.
In the capillarity tests, the surfaces of the specimens were covered with Silirub AS from
Soudal, an elastic sealant of acetic cure with a silicon base.
(a) (b) (c)
Figure 3.1 – (a) Planitop HDM Restauro. (b) Mapegrid G220. (c) FIDSTEEL 3X2-G 4-12-
500 HARDWIRE.

21
Experimental characterization of the materials
3.3. Preparation of the specimens
3.3.1. Absorption tests
The specimens for the absorption tests were cubes entirely made of mortar with the
dimensions of 50x50x50 mm3. Regulated steel molds, provided by the laboratory, were used
to cast the specimens. Before preparing the mortar, it was necessary to clean and grease with
oil the molds to facilitate the demolding of the specimens.
The mortar was composed by two components, component A, a powdered component, and
component B, a liquid component. To mix the mortar, for each part of component B, 5 parts
of component A were added, as specified by the manufacturer. The mortar was mixed for 4
minutes in the slowest velocity of the mixer, as specified by the manufacture, and cast into the
mold until half of its capacity. After, the mold was vibrated in the vibrating table for 40
seconds. Then, the rest of the mold was filled with mortar and vibrated again for more 40
seconds. The casted specimens are presented in Figure 3.2(a).
After casting the mortar, the mold was wrapped with plastic and left to cure. In the day after
casting, the specimens were demolded, measured, weighted and stored in a room with
controlled temperature. The weight of the specimens was regularly controlled, performing
weighting measurements at different ages. An exemple of a specimen is presented in Figure
3.2(b).
(a) (b)
Figure 3.2 - (a) Casted mortar specimens. (b) Mortar specimen.

22
Compatible strengthening of masonry Structures based on the TRM technique
3.3.2. Axial compressive tests
The specimens for the axial compressive tests were made with the same dimensions and
procedure as the specimens for the absorption tests. The only difference in the preparation of
the specimens was that the specimens were demolded after 3 days and then stored in a
controlled environment chamber.
3.3.3. Flexural tests
The specimens for these tests were prismatic with dimensions of 40x160x40 mm3. For these
specimens, a different mold was used, presented in Figure 3.3, compared to the specimens
prepared for compressive tests (because of the size of the specimens) but with similar
characteristics. The mortar was prepared and casted as explained before. The specimens were
demolded after 7 days of curing and then were stored in laboratory conditions. The changes in
the weight of the specimens were also regularly controlled.
(a) (b)
Figure 3.3 - (a) Flexural specimens mold. (b) Flexural tests preparation.
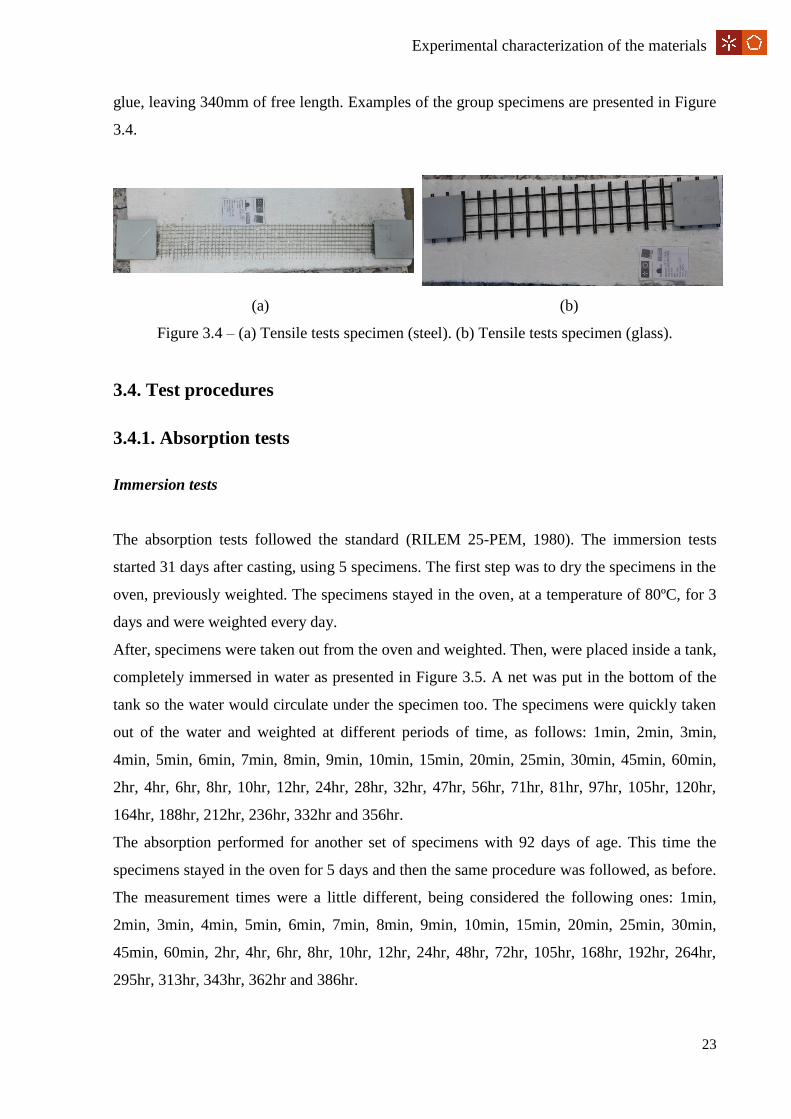
3.3.4. Direct tensile tests
Specimens were prepared by simply cutting the fibers (glass and steel) and gluing steel plates
at both ends to facilitate gripping for mechanical tests. The plates for the single fibers had
dimensions of 50x50mm2 while the plates for the groups of fibers had 55x55mm2. After, the
glue was mixed, poured over the plates with the fibers and another plate was placed above the
23
Experimental characterization of the materials
glue, leaving 340mm of free length. Examples of the group specimens are presented in Figure
3.4.
(a) (b)
Figure 3.4 – (a) Tensile tests specimen (steel). (b) Tensile tests specimen (glass).
3.4. Test procedures
3.4.1. Absorption tests
Immersion tests
The absorption tests followed the standard (RILEM 25-PEM, 1980). The immersion tests
started 31 days after casting, using 5 specimens. The first step was to dry the specimens in the
oven, previously weighted. The specimens stayed in the oven, at a temperature of 80ºC, for 3
days and were weighted every day.
After, specimens were taken out from the oven and weighted. Then, were placed inside a tank,
completely immersed in water as presented in Figure 3.5. A net was put in the bottom of the
tank so the water would circulate under the specimen too. The specimens were quickly taken
out of the water and weighted at different periods of time, as follows: 1min, 2min, 3min,
4min, 5min, 6min, 7min, 8min, 9min, 10min, 15min, 20min, 25min, 30min, 45min, 60min,
2hr, 4hr, 6hr, 8hr, 10hr, 12hr, 24hr, 28hr, 32hr, 47hr, 56hr, 71hr, 81hr, 97hr, 105hr, 120hr,
164hr, 188hr, 212hr, 236hr, 332hr and 356hr.
The absorption performed for another set of specimens with 92 days of age. This time the
specimens stayed in the oven for 5 days and then the same procedure was followed, as before.
The measurement times were a little different, being considered the following ones: 1min,
2min, 3min, 4min, 5min, 6min, 7min, 8min, 9min, 10min, 15min, 20min, 25min, 30min,
45min, 60min, 2hr, 4hr, 6hr, 8hr, 10hr, 12hr, 24hr, 48hr, 72hr, 105hr, 168hr, 192hr, 264hr,
295hr, 313hr, 343hr, 362hr and 386hr.

24
Compatible strengthening of masonry Structures based on the TRM technique
Figure 3.5 – Immersion test setup.
Capillarity tests
The capillarity tests followed the standard (ASTM C1585-04, 2014). The capillarity tests
started 43 days after casting, using 5 specimens. The test procedure started by drying the
specimens in the oven for 5 days. The specimens were weighted before and after drying.
Then, silicon was added to the specimens, covering the lateral surfaces of the specimens,
leaving the top and the bottom clean, to allow a unidirectional flow of water. After the silicon
was dried, specimens were weighted and placed inside a water container. The water had
15mm height and a net was placed in the bottom to allow the water to flow under the
specimens as presented in Figure 3.6. The face not covered with silicon was facing the water.
Like in the immersion tests, specimens were quickly taken out of the water and weighted at
different periods of time after the beginning of the test, as follows: 1min, 2min, 3min, 4min,
5min, 6min, 7min, 8min, 9min, 10min, 15min, 20min, 25min, 30min, 45min, 60min, 2hr, 4hr,
6hr, 8hr, 22hr, 32hr, 46hr, 54hr, 69hr, 79hr, 101hr, 126hr, 141hr, 150hr, 164hr, 174hr, 188hr,
212hr, 236hr and 308hr.
The capillarity tests were repeated for the same specimens at the age of 71 days, considering
the following times: 1min, 2min, 3min, 4min, 5min, 6min, 7min, 8min, 9min, 10min, 15min,
20min, 25min, 30min, 45min, 60min, 2hr, 4hr, 6hr, 8hr, 10hr, 26hr, 48hr, 72hr, 96hr, 120hr,
148hr, 179hr, 203hr, 227hr, 244hr, 268hr, 292hr, 312hr, 336hr, 360hr, 384hr, 432hr, 480hr,
504hr and 356hr.
Later, another 5 new specimens were tests. This time, the specimens had 92 days of age. The
same procedure was followed and the weightings were done at: 1min, 2min, 3min, 4min,
5min, 6min, 7min, 8min, 9min, 10min, 15min, 20min, 25min, 30min, 45min, 60min, 2hr, 4hr,
6hr, 8hr, 24hr, 48hr, 80hr, 144hr, 168hr, 240hr, 271hr, 289hr, 319hr, 362hr and 356hr.

25
Experimental characterization of the materials
Figure 3.6 – Capillarity test setup.
3.4.2. Axial compressive tests
The axial compressive tests were performed using the LR 50K plus universal testing machine
from LLOYD instruments. This machine has automatic data acquisition and is prepared for
compressive, flexural and tensile tests.
The specimens were placed between the two machine plates. The one on bottom is fixed in
place while the one on top applies uniform loads in the top surface of the specimen while the
tests are performed. For better results, a hinge was used between the bottom base and the
specimens, to allow adjustments for a uniform loading and two greased Teflon sheets were
placed between the specimen and the machine in each surface. The test setup is presented in
Figure 3.7.
Figure 3.7 – Compressive test setup.

26
Compatible strengthening of masonry Structures based on the TRM technique
The tests were performed following the standard (ASTM C109/C109M-07, 2007), with the
rate load of 150N/s and a pre-load of 50N. The test automatically stopped when the specimens
failed. The specimens were tested at the ages of 3, 7, 14, 28, 60 and 90 days.
3.4.3. Flexural tests
The universal testing machine LR 50k plus was also used for the flexural tests. The flat bases
were replaced by the flexural test setup of the machine. In this setup, the prismatic specimens
are supported at the extremities and a load is applied in the middle of the specimen.
Specimens were initially marked for a suitable adjustment at the machine, thus guaranteeing
better results. The test setup is presented in Figure 3.8.
The tests were performed under the standard (EN 1015-11, 1999), with the rate of 10N/s and a
pre-load of 150N. The test automatically stopped when the specimens ruptured.
The tests were performed in a total of 27 specimens, at least 5 for each different age. The
specimens were tested in the ages of 7, 14, 28, 61 and 92 days.
Figure 3.8 – Flexural test setup.
27
Experimental characterization of the materials
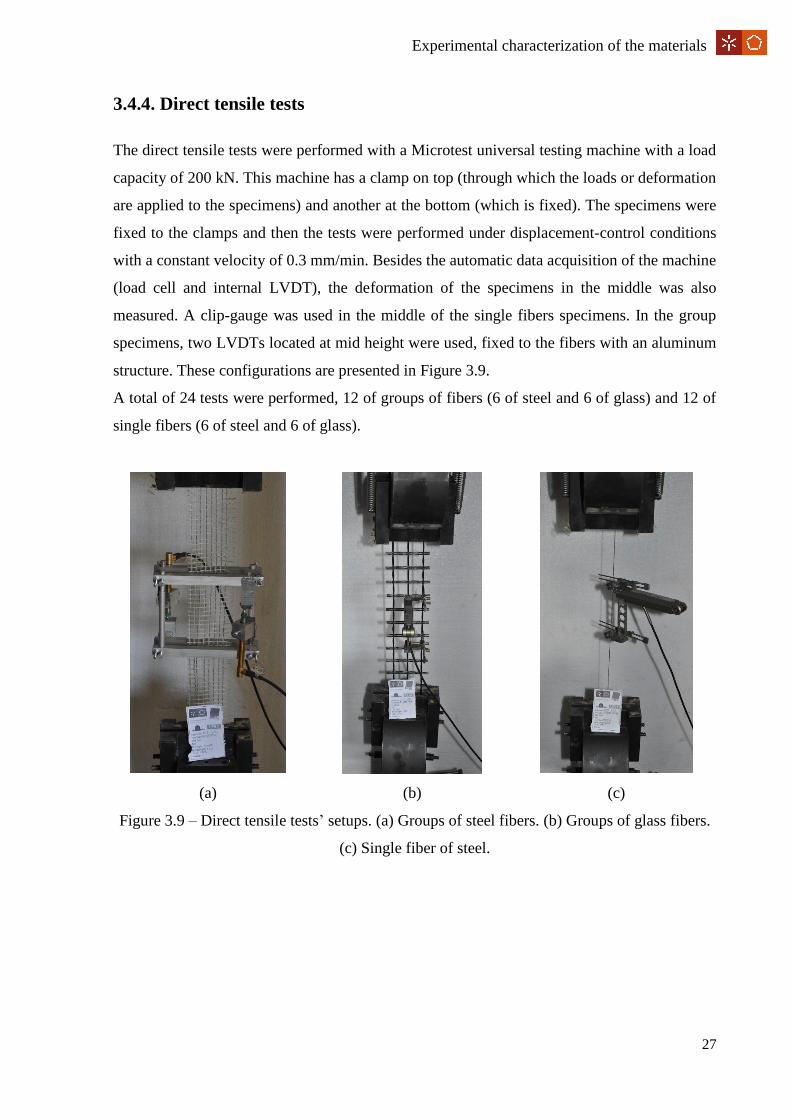
3.4.4. Direct tensile tests
The direct tensile tests were performed with a Microtest universal testing machine with a load
capacity of 200 kN. This machine has a clamp on top (through which the loads or deformation
are applied to the specimens) and another at the bottom (which is fixed). The specimens were
fixed to the clamps and then the tests were performed under displacement-control conditions
with a constant velocity of 0.3 mm/min. Besides the automatic data acquisition of the machine
(load cell and internal LVDT), the deformation of the specimens in the middle was also
measured. A clip-gauge was used in the middle of the single fibers specimens. In the group
specimens, two LVDTs located at mid height were used, fixed to the fibers with an aluminum
structure. These configurations are presented in Figure 3.9.
A total of 24 tests were performed, 12 of groups of fibers (6 of steel and 6 of glass) and 12 of
single fibers (6 of steel and 6 of glass).
(a) (b) (c)
Figure 3.9 – Direct tensile tests’ setups. (a) Groups of steel fibers. (b) Groups of glass fibers.
(c) Single fiber of steel.

28
Compatible strengthening of masonry Structures based on the TRM technique
3.5. Results and discussion
3.5.1. Absorption tests
For a better analysis of the results of the absorption tests, was calculated the absorption rate of
the specimens through the following equation:
Water absorption (%)=ms-ms,dry
ms,dry×100 (3.1)
Where ms is the weight of the specimen that variates with time during the test and ms,dry is the
dry weight of the specimen before the test started. This equation was used for both immersion
and capillarity tests.
Immersion Tests
Charts comparing the water absorption with time for each test have been prepared, see Figure
3.10.
(a) (b)
Figure 3.10 - Water absorption by immersion in mortar at the age of (a) 31 days and (b) 92
days.

29
Experimental characterization of the materials
As can be observed, the water absorption increases with time for all specimens and for both
ages. It is possible to observe that the water absorption rate decreases with time. The
maximum water absorption is reached in the end and has a average value of 18% for both
ages.
For the specimens with 92 days of age, the only difference is that the rate of absorption is
lower until 12%, as presented in Figure 3.11, and the results are less scattered.
Figure 3.11 – Comparison between the average value of water absorption by immersion at 31
and 92 days.
Concluding, the age of the mortar does not influence the maximum water absorption, only
slightly changes the behavior of the rate, for this mortar. With the results of this tests it was
also calculated the bulk density of the mortar with the following equation:
ρmortar
=ms,dry
Vs (3.2)
Where:
Vs=ms,sat-ms,i
ρwater
(3.3)
Where ms,sat is the saturated weight of the specimen, ms,i is the immersed weight of the
specimen and ρwater is 1000kg/m3, the density of the water. The results are listed in Table 3.1.
With an average of 1489 kg/m3, results for the bulk density are below the data provided by the
manufacture that specifies the mortar bulk density as 1900kg/m3.

30
Compatible strengthening of masonry Structures based on the TRM technique
Table 3.1 – Bulk density of the mortar.
ρ mortar (kg/m3)
S1 1492,43
S2 1472,78
S3 1476,95
S4 1498,00
S5 1503,18
Average 1488,67
Co.V. (%) 0,89
Capillarity Tests
As for the capillarity tests, the same type of diagrams were built, but the results are very
different, see Figure 3.12 and Figure 3.13.
(a) (b)
Figure 3.12 - Water absorption by capillarity in mortar at the age of (a) 43 days and (b) 92
days.
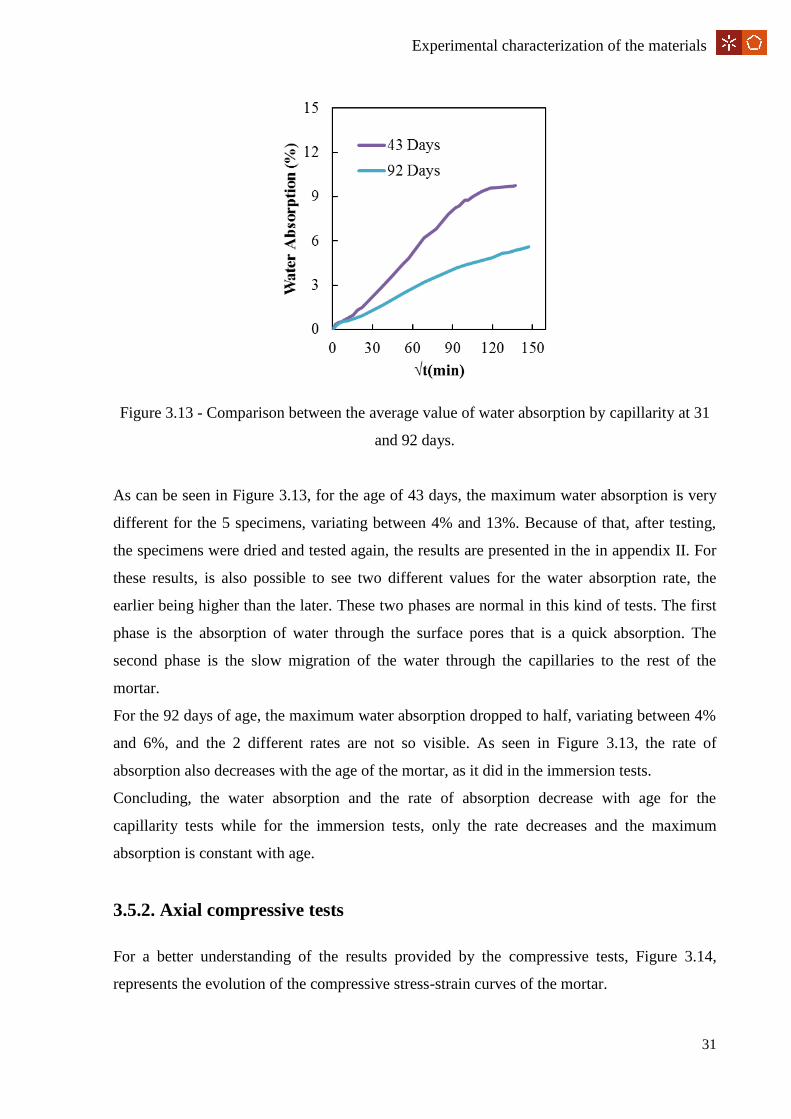
31
Experimental characterization of the materials
Figure 3.13 - Comparison between the average value of water absorption by capillarity at 31
and 92 days.
As can be seen in Figure 3.13, for the age of 43 days, the maximum water absorption is very
different for the 5 specimens, variating between 4% and 13%. Because of that, after testing,
the specimens were dried and tested again, the results are presented in the in appendix II. For
these results, is also possible to see two different values for the water absorption rate, the
earlier being higher than the later. These two phases are normal in this kind of tests. The first
phase is the absorption of water through the surface pores that is a quick absorption. The
second phase is the slow migration of the water through the capillaries to the rest of the
mortar.
For the 92 days of age, the maximum water absorption dropped to half, variating between 4%
and 6%, and the 2 different rates are not so visible. As seen in Figure 3.13, the rate of
absorption also decreases with the age of the mortar, as it did in the immersion tests.
Concluding, the water absorption and the rate of absorption decrease with age for the
capillarity tests while for the immersion tests, only the rate decreases and the maximum
absorption is constant with age.
3.5.2. Axial compressive tests
For a better understanding of the results provided by the compressive tests, Figure 3.14,
represents the evolution of the compressive stress-strain curves of the mortar.
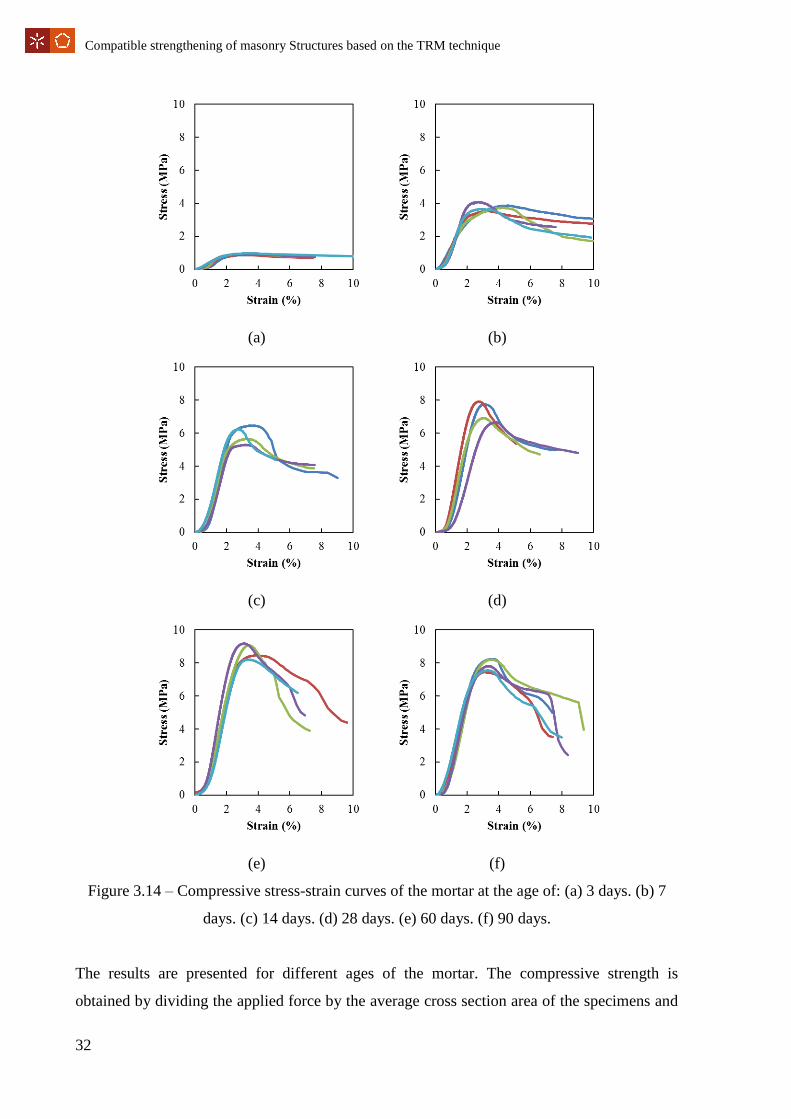
32
Compatible strengthening of masonry Structures based on the TRM technique
(a) (b)
(c) (d)
(e) (f)
Figure 3.14 – Compressive stress-strain curves of the mortar at the age of: (a) 3 days. (b) 7
days. (c) 14 days. (d) 28 days. (e) 60 days. (f) 90 days.
The results are presented for different ages of the mortar. The compressive strength is
obtained by dividing the applied force by the average cross section area of the specimens and
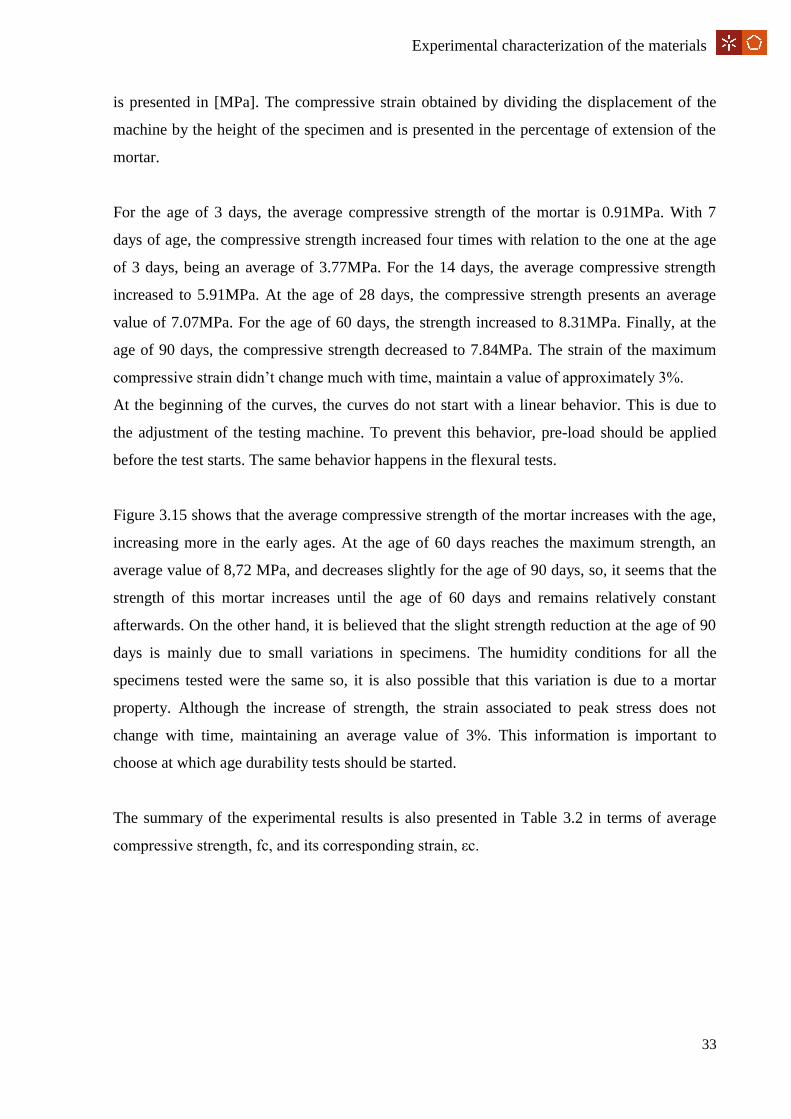
33
Experimental characterization of the materials
is presented in [MPa]. The compressive strain obtained by dividing the displacement of the
machine by the height of the specimen and is presented in the percentage of extension of the
mortar.
For the age of 3 days, the average compressive strength of the mortar is 0.91MPa. With 7
days of age, the compressive strength increased four times with relation to the one at the age
of 3 days, being an average of 3.77MPa. For the 14 days, the average compressive strength
increased to 5.91MPa. At the age of 28 days, the compressive strength presents an average
value of 7.07MPa. For the age of 60 days, the strength increased to 8.31MPa. Finally, at the
age of 90 days, the compressive strength decreased to 7.84MPa. The strain of the maximum
compressive strain didn’t change much with time, maintain a value of approximately 3%.
At the beginning of the curves, the curves do not start with a linear behavior. This is due to
the adjustment of the testing machine. To prevent this behavior, pre-load should be applied
before the test starts. The same behavior happens in the flexural tests.
Figure 3.15 shows that the average compressive strength of the mortar increases with the age,
increasing more in the early ages. At the age of 60 days reaches the maximum strength, an
average value of 8,72 MPa, and decreases slightly for the age of 90 days, so, it seems that the
strength of this mortar increases until the age of 60 days and remains relatively constant
afterwards. On the other hand, it is believed that the slight strength reduction at the age of 90
days is mainly due to small variations in specimens. The humidity conditions for all the
specimens tested were the same so, it is also possible that this variation is due to a mortar
property. Although the increase of strength, the strain associated to peak stress does not
change with time, maintaining an average value of 3%. This information is important to
choose at which age durability tests should be started.
The summary of the experimental results is also presented in Table 3.2 in terms of average
compressive strength, fc, and its corresponding strain, εc.

34
Compatible strengthening of masonry Structures based on the TRM technique
Figure 3.15 – Evolution of the average compressive strength of the mortar with time.
Table 3.2 - Evolution of the compressive strength of the mortar with time (average values).
Age fc εc Co.V.
(days) (MPa) (%) (%)
3 0,91 3,20 4,54
7 3,77 3,63 5,38
14 5,91 3,19 9,19
28 7,30 3,16 8,46
60 8,72 3,62 5,43
90 7,84 3,36 4,68
3.5.3. Flexural tests
Figure 3.16 shows the flexural test results of the mortar in terms of flexural stress vs. vertical
displacement at mid span. The flexural stress was calculated using the following equation:
ftf=3
2
Fl
bd2 (3.4)
Where F is the applied load, l is the distance between the two support points, b is the width of
the specimen and d the height.
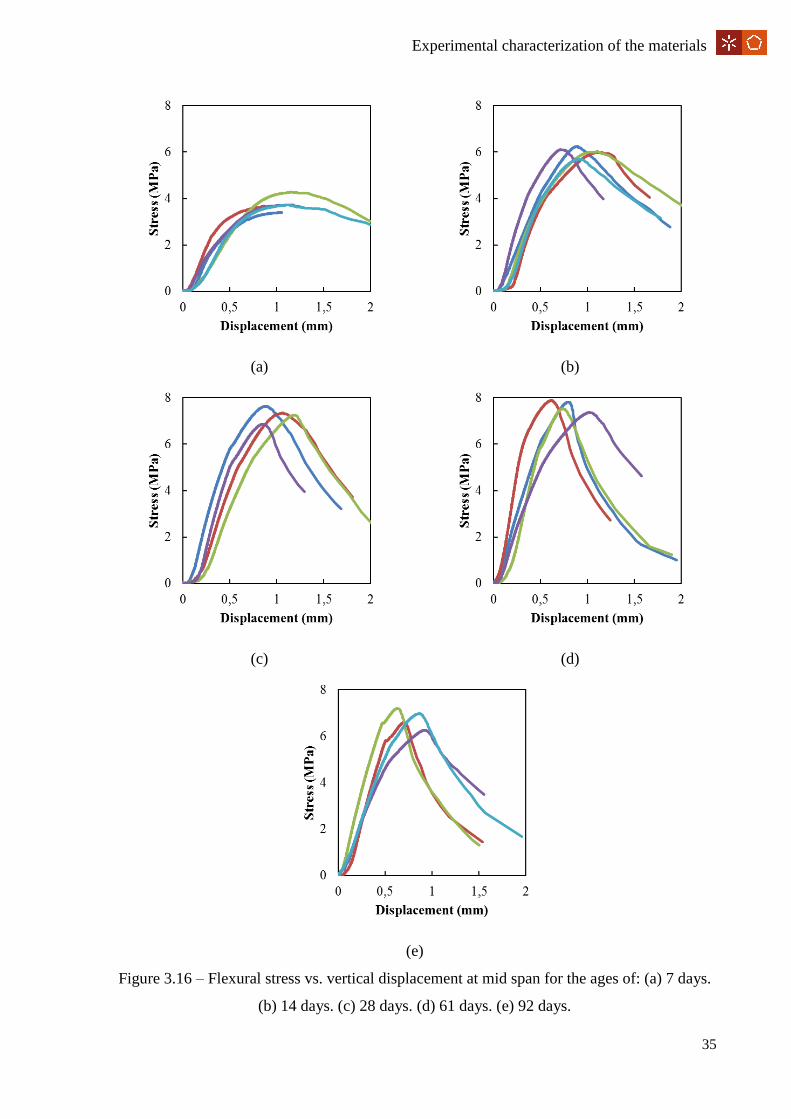
35
Experimental characterization of the materials
(a) (b)
(c) (d)
(e)
Figure 3.16 – Flexural stress vs. vertical displacement at mid span for the ages of: (a) 7 days.
(b) 14 days. (c) 28 days. (d) 61 days. (e) 92 days.
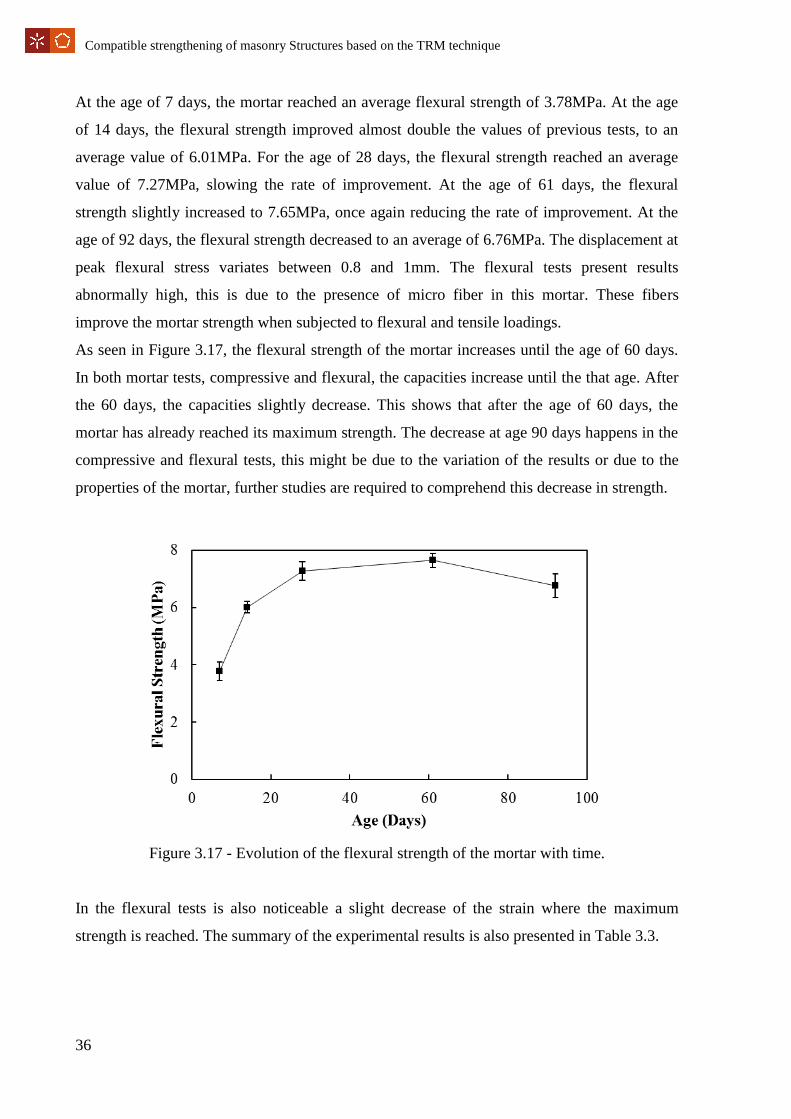
36
Compatible strengthening of masonry Structures based on the TRM technique
At the age of 7 days, the mortar reached an average flexural strength of 3.78MPa. At the age
of 14 days, the flexural strength improved almost double the values of previous tests, to an
average value of 6.01MPa. For the age of 28 days, the flexural strength reached an average
value of 7.27MPa, slowing the rate of improvement. At the age of 61 days, the flexural
strength slightly increased to 7.65MPa, once again reducing the rate of improvement. At the
age of 92 days, the flexural strength decreased to an average of 6.76MPa. The displacement at
peak flexural stress variates between 0.8 and 1mm. The flexural tests present results
abnormally high, this is due to the presence of micro fiber in this mortar. These fibers
improve the mortar strength when subjected to flexural and tensile loadings.
As seen in Figure 3.17, the flexural strength of the mortar increases until the age of 60 days.
In both mortar tests, compressive and flexural, the capacities increase until the that age. After
the 60 days, the capacities slightly decrease. This shows that after the age of 60 days, the
mortar has already reached its maximum strength. The decrease at age 90 days happens in the
compressive and flexural tests, this might be due to the variation of the results or due to the
properties of the mortar, further studies are required to comprehend this decrease in strength.
Figure 3.17 - Evolution of the flexural strength of the mortar with time.
In the flexural tests is also noticeable a slight decrease of the strain where the maximum
strength is reached. The summary of the experimental results is also presented in Table 3.3.
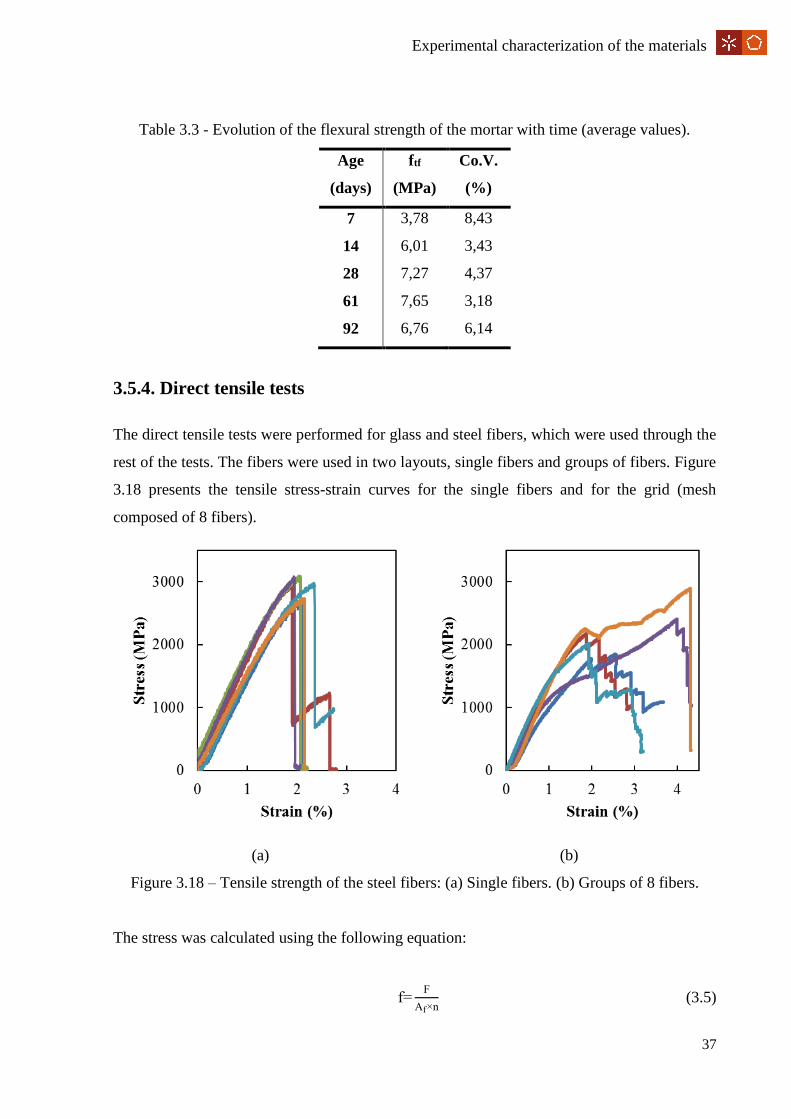
37
Experimental characterization of the materials
Table 3.3 - Evolution of the flexural strength of the mortar with time (average values).
Age ftf Co.V.
(days) (MPa) (%)
7 3,78 8,43
14 6,01 3,43
28 7,27 4,37
61 7,65 3,18
92 6,76 6,14
3.5.4. Direct tensile tests
The direct tensile tests were performed for glass and steel fibers, which were used through the
rest of the tests. The fibers were used in two layouts, single fibers and groups of fibers. Figure
3.18 presents the tensile stress-strain curves for the single fibers and for the grid (mesh
composed of 8 fibers).
(a) (b)
Figure 3.18 – Tensile strength of the steel fibers: (a) Single fibers. (b) Groups of 8 fibers.
The stress was calculated using the following equation:
f=F
Af×n (3.5)
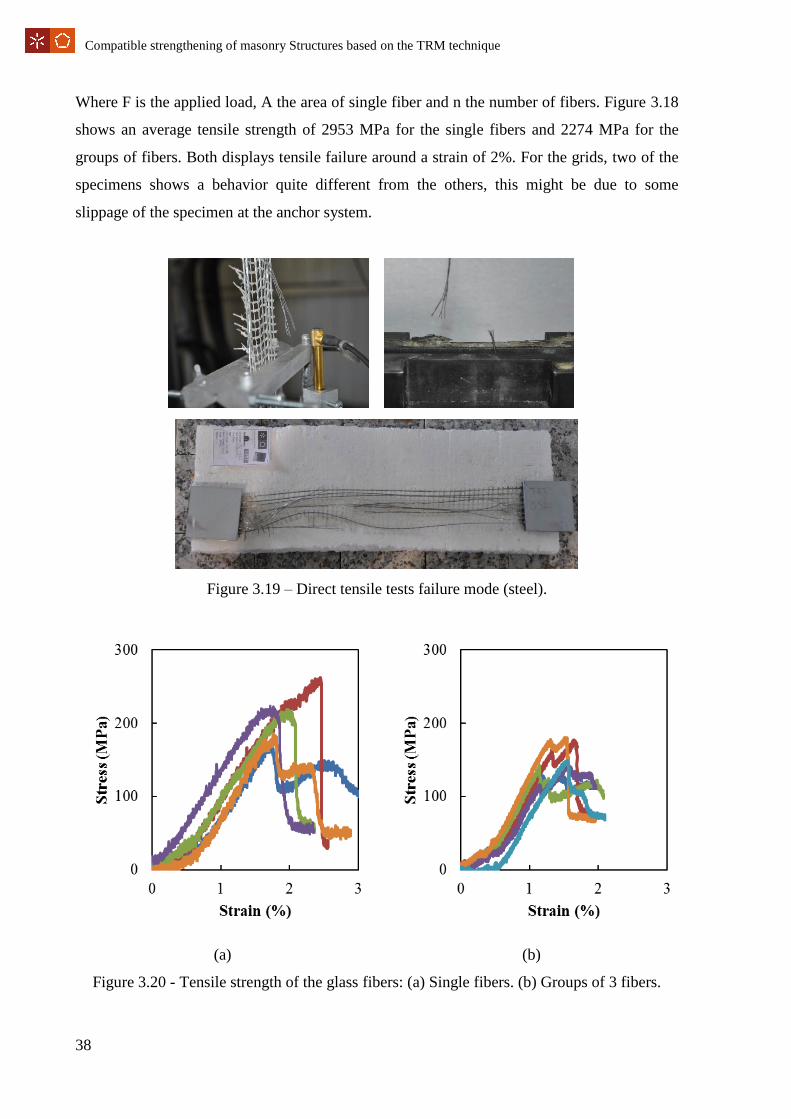
38
Compatible strengthening of masonry Structures based on the TRM technique
Where F is the applied load, A the area of single fiber and n the number of fibers. Figure 3.18
shows an average tensile strength of 2953 MPa for the single fibers and 2274 MPa for the
groups of fibers. Both displays tensile failure around a strain of 2%. For the grids, two of the
specimens shows a behavior quite different from the others, this might be due to some
slippage of the specimen at the anchor system.
Figure 3.19 – Direct tensile tests failure mode (steel).
(a) (b)
Figure 3.20 - Tensile strength of the glass fibers: (a) Single fibers. (b) Groups of 3 fibers.
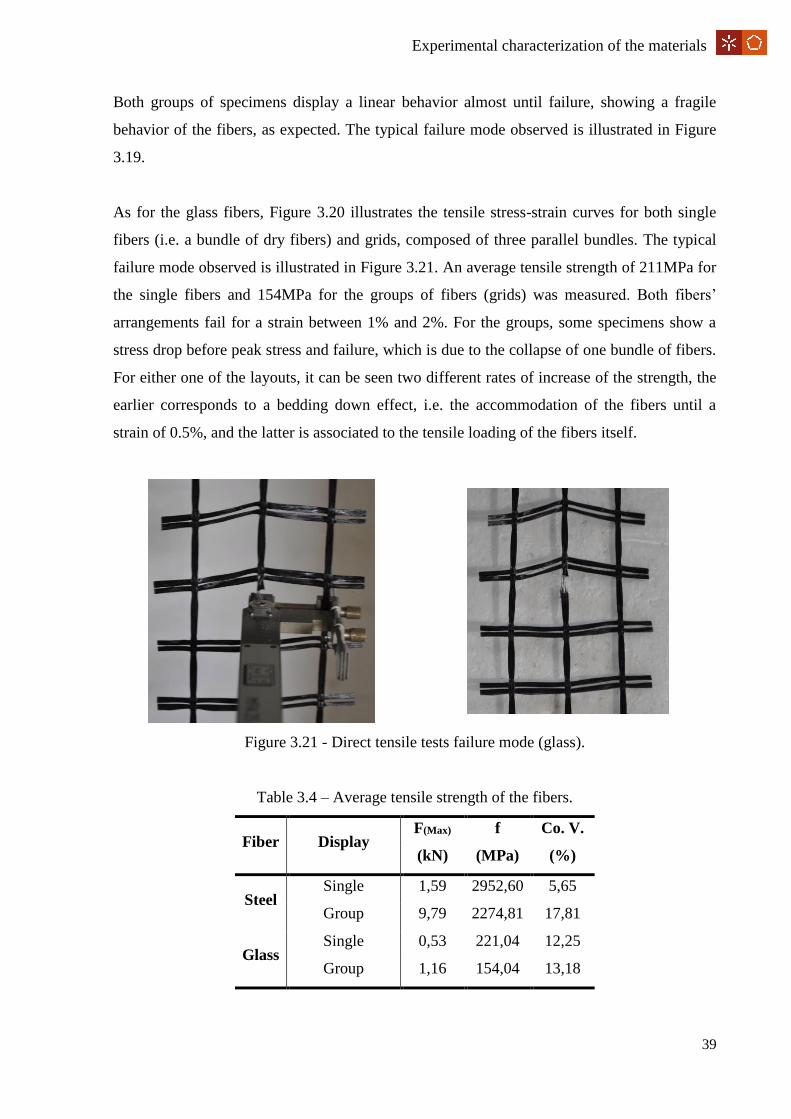
39
Experimental characterization of the materials
Both groups of specimens display a linear behavior almost until failure, showing a fragile
behavior of the fibers, as expected. The typical failure mode observed is illustrated in Figure
3.19.
As for the glass fibers, Figure 3.20 illustrates the tensile stress-strain curves for both single
fibers (i.e. a bundle of dry fibers) and grids, composed of three parallel bundles. The typical
failure mode observed is illustrated in Figure 3.21. An average tensile strength of 211MPa for
the single fibers and 154MPa for the groups of fibers (grids) was measured. Both fibers’
arrangements fail for a strain between 1% and 2%. For the groups, some specimens show a
stress drop before peak stress and failure, which is due to the collapse of one bundle of fibers.
For either one of the layouts, it can be seen two different rates of increase of the strength, the
earlier corresponds to a bedding down effect, i.e. the accommodation of the fibers until a
strain of 0.5%, and the latter is associated to the tensile loading of the fibers itself.
Figure 3.21 - Direct tensile tests failure mode (glass).
Table 3.4 – Average tensile strength of the fibers.
Fiber Display F(Max) f Co. V.
(kN) (MPa) (%)
Steel Single 1,59 2952,60 5,65
Group 9,79 2274,81 17,81
Glass Single 0,53 221,04 12,25
Group 1,16 154,04 13,18
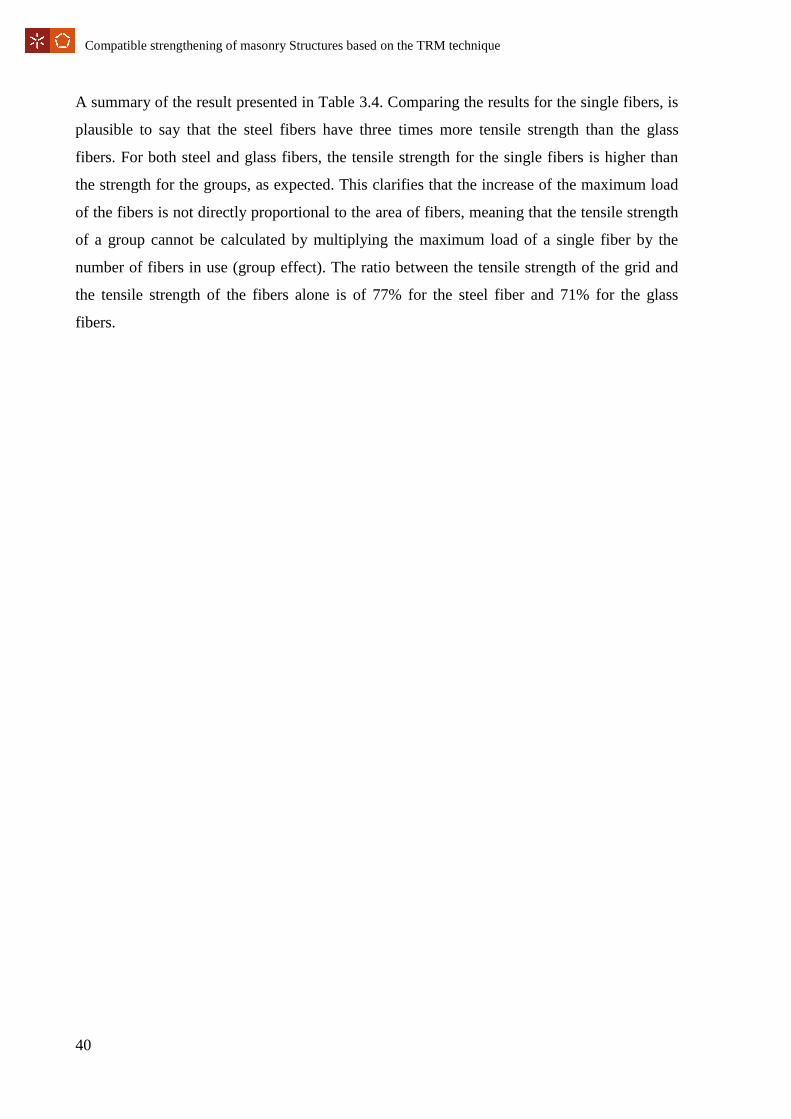
40
Compatible strengthening of masonry Structures based on the TRM technique
A summary of the result presented in Table 3.4. Comparing the results for the single fibers, is
plausible to say that the steel fibers have three times more tensile strength than the glass
fibers. For both steel and glass fibers, the tensile strength for the single fibers is higher than
the strength for the groups, as expected. This clarifies that the increase of the maximum load
of the fibers is not directly proportional to the area of fibers, meaning that the tensile strength
of a group cannot be calculated by multiplying the maximum load of a single fiber by the
number of fibers in use (group effect). The ratio between the tensile strength of the grid and
the tensile strength of the fibers alone is of 77% for the steel fiber and 71% for the glass
fibers.
41
Experimental characterization of the TRM reinforcement system
CHAPTER IV - EXPERIMENTAL CHARACTERIZATION OF
THE TRM REINFORCEMENT SYSTEM
4.1. Introduction
One fundamental part of this dissertation is the experimental characterization of the TRM
reinforcement system. The experimental program followed in this chapter is aimed at fully
characterization of TRMs to provide knowledge on their performance. In this experimental
campaign, fiber-to-mortar bond, TRM tensile and TRM-to-masonry bond tests were
performed. All the activities (including tests and specimens’ preparation) were done in LEST
and performed for steel and glass fibers and the results are compared.
The tensile tests show the TRM resistance to tensile forces. The pull-out test is a simple test
were the fibers are pulled out of the mortar. This test provides a better knowledge of the bond
between the fibers and the mortar. Two pull-out test campaigns were performed. The first one
was made using three different setups with the same fibers. Comparing the results, it was
possible to choose the test setup with the best performance. In the second campaign, the best
test setup was used for investigating the bond behavior in three different configurations:
(1) single fibers embedded in mortar, (2) single fibers with transverse fibers and (3) groups of
two fibers with the traverse fibers. Comparing the results, it was possible to comprehend the
influence of the transverse and the number of fibers on the bond behavior in the TRM
composites.
Single-lap tests were also performed to understand the shear bond behavior between the TRM
and the brick substrate (representative of the masonry system).
The tests were performed with three types of loadings, one monotonic load and two different
types of static cyclic loads. While the monotonic load shows the strength of the TRM, the
cyclic loads show the loss of capacity, when exposed to load repetitions (such as under
seismic actions).
4.2. Preparation of the specimens
Table 4.1 presents the number of specimens produced for each different test.

42
Compatible strengthening of masonry Structures based on the TRM technique
Table 4.1 – Number of specimens produced.
Test Configuration of the
fibers
Type of
fibers
Number of specimens
produced
Tensile (TT1) Group of 3 Glass 6
Group of 8 Steel 6
Tensile (TT2) Group of 3 Glass 11
Group of 8 Steel 11
Pull-out (Type 1)
Single
Glass
6
Single + Transverse 6
Group of 2 6
Single
Steel
12
Single + Transverse 6
Group of 2 6
Pull-out (Type 2) Single Steel 6
Pull-out
(Cylindrical) Single Steel 5
Single-lap
(monotonic)
Group of 3 fibers Glass 6
Group of 8 fibers Steel 6
Single-lap (cycle 1) Group of 3 fibers Glass 6
Group of 8 fibers Steel 6
Single-lap (cycle 2) Group of 3 fibers Glass 6
Group of 8 fibers Steel 6
4.2.1. Direct tensile tests
The specimens for the direct tensile tests were made with mortar and fibers (steel or glass).
The specimens had dimensions of 60x440x10 mm3. Two different types of specimens were
prepared, namely type 1 and type 2. In Type 1 specimens, a short length (50 mm) of dry
fibers were left out of the mortar at both ends for gripping during the mechanical tests (no
mortar in the griping area) and in type 2, the mortar was applied along all the specimens’
length. In these specimens, therefore, the gripping system was applied on the mortar during
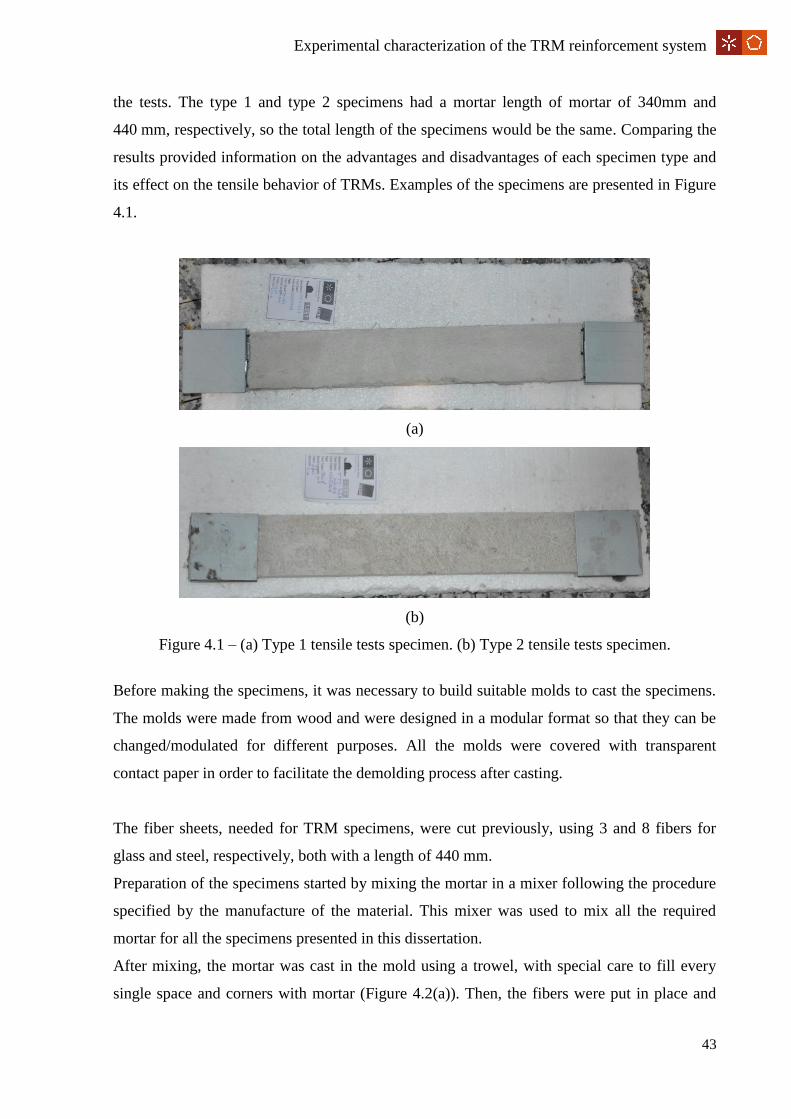
43
Experimental characterization of the TRM reinforcement system
the tests. The type 1 and type 2 specimens had a mortar length of mortar of 340mm and
440 mm, respectively, so the total length of the specimens would be the same. Comparing the
results provided information on the advantages and disadvantages of each specimen type and
its effect on the tensile behavior of TRMs. Examples of the specimens are presented in Figure
4.1.
(a)
(b)
Figure 4.1 – (a) Type 1 tensile tests specimen. (b) Type 2 tensile tests specimen.
Before making the specimens, it was necessary to build suitable molds to cast the specimens.
The molds were made from wood and were designed in a modular format so that they can be
changed/modulated for different purposes. All the molds were covered with transparent
contact paper in order to facilitate the demolding process after casting.
The fiber sheets, needed for TRM specimens, were cut previously, using 3 and 8 fibers for
glass and steel, respectively, both with a length of 440 mm.
Preparation of the specimens started by mixing the mortar in a mixer following the procedure
specified by the manufacture of the material. This mixer was used to mix all the required
mortar for all the specimens presented in this dissertation.
After mixing, the mortar was cast in the mold using a trowel, with special care to fill every
single space and corners with mortar (Figure 4.2(a)). Then, the fibers were put in place and
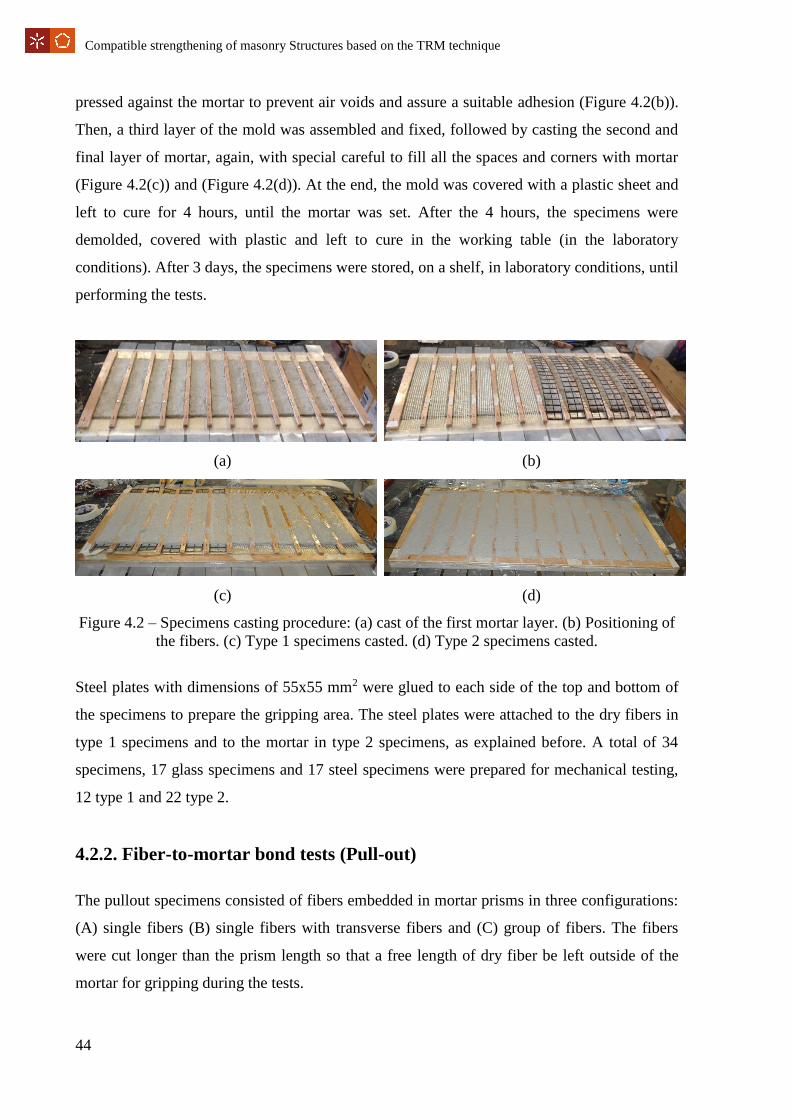
44
Compatible strengthening of masonry Structures based on the TRM technique
pressed against the mortar to prevent air voids and assure a suitable adhesion (Figure 4.2(b)).
Then, a third layer of the mold was assembled and fixed, followed by casting the second and
final layer of mortar, again, with special careful to fill all the spaces and corners with mortar
(Figure 4.2(c)) and (Figure 4.2(d)). At the end, the mold was covered with a plastic sheet and
left to cure for 4 hours, until the mortar was set. After the 4 hours, the specimens were
demolded, covered with plastic and left to cure in the working table (in the laboratory
conditions). After 3 days, the specimens were stored, on a shelf, in laboratory conditions, until
performing the tests.
(a) (b)
(c) (d)
Figure 4.2 – Specimens casting procedure: (a) cast of the first mortar layer. (b) Positioning of
the fibers. (c) Type 1 specimens casted. (d) Type 2 specimens casted.
Steel plates with dimensions of 55x55 mm2 were glued to each side of the top and bottom of
the specimens to prepare the gripping area. The steel plates were attached to the dry fibers in
type 1 specimens and to the mortar in type 2 specimens, as explained before. A total of 34
specimens, 17 glass specimens and 17 steel specimens were prepared for mechanical testing,
12 type 1 and 22 type 2.
4.2.2. Fiber-to-mortar bond tests (Pull-out)
The pullout specimens consisted of fibers embedded in mortar prisms in three configurations:
(A) single fibers (B) single fibers with transverse fibers and (C) group of fibers. The fibers
were cut longer than the prism length so that a free length of dry fiber be left outside of the
mortar for gripping during the tests.
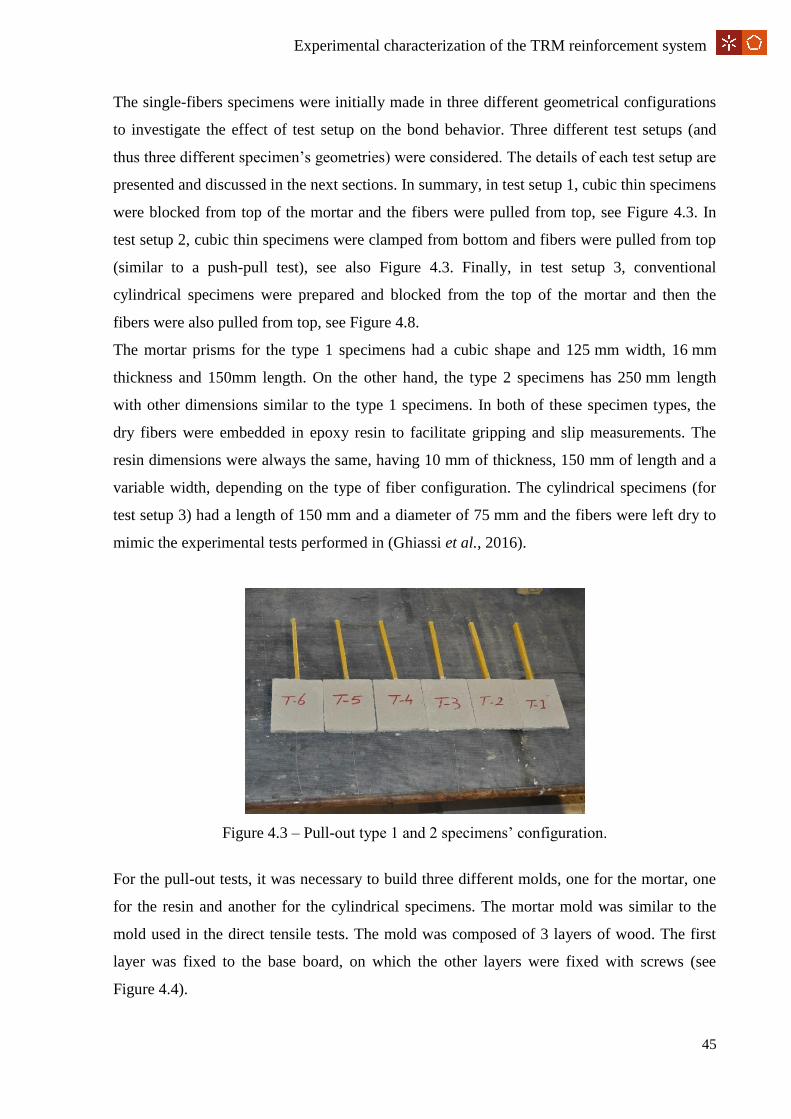
45
Experimental characterization of the TRM reinforcement system
The single-fibers specimens were initially made in three different geometrical configurations
to investigate the effect of test setup on the bond behavior. Three different test setups (and
thus three different specimen’s geometries) were considered. The details of each test setup are
presented and discussed in the next sections. In summary, in test setup 1, cubic thin specimens
were blocked from top of the mortar and the fibers were pulled from top, see Figure 4.3. In
test setup 2, cubic thin specimens were clamped from bottom and fibers were pulled from top
(similar to a push-pull test), see also Figure 4.3. Finally, in test setup 3, conventional
cylindrical specimens were prepared and blocked from the top of the mortar and then the
fibers were also pulled from top, see Figure 4.8.
The mortar prisms for the type 1 specimens had a cubic shape and 125 mm width, 16 mm
thickness and 150mm length. On the other hand, the type 2 specimens has 250 mm length
with other dimensions similar to the type 1 specimens. In both of these specimen types, the
dry fibers were embedded in epoxy resin to facilitate gripping and slip measurements. The
resin dimensions were always the same, having 10 mm of thickness, 150 mm of length and a
variable width, depending on the type of fiber configuration. The cylindrical specimens (for
test setup 3) had a length of 150 mm and a diameter of 75 mm and the fibers were left dry to
mimic the experimental tests performed in (Ghiassi et al., 2016).
Figure 4.3 – Pull-out type 1 and 2 specimens’ configuration.
For the pull-out tests, it was necessary to build three different molds, one for the mortar, one
for the resin and another for the cylindrical specimens. The mortar mold was similar to the
mold used in the direct tensile tests. The mold was composed of 3 layers of wood. The first
layer was fixed to the base board, on which the other layers were fixed with screws (see
Figure 4.4).
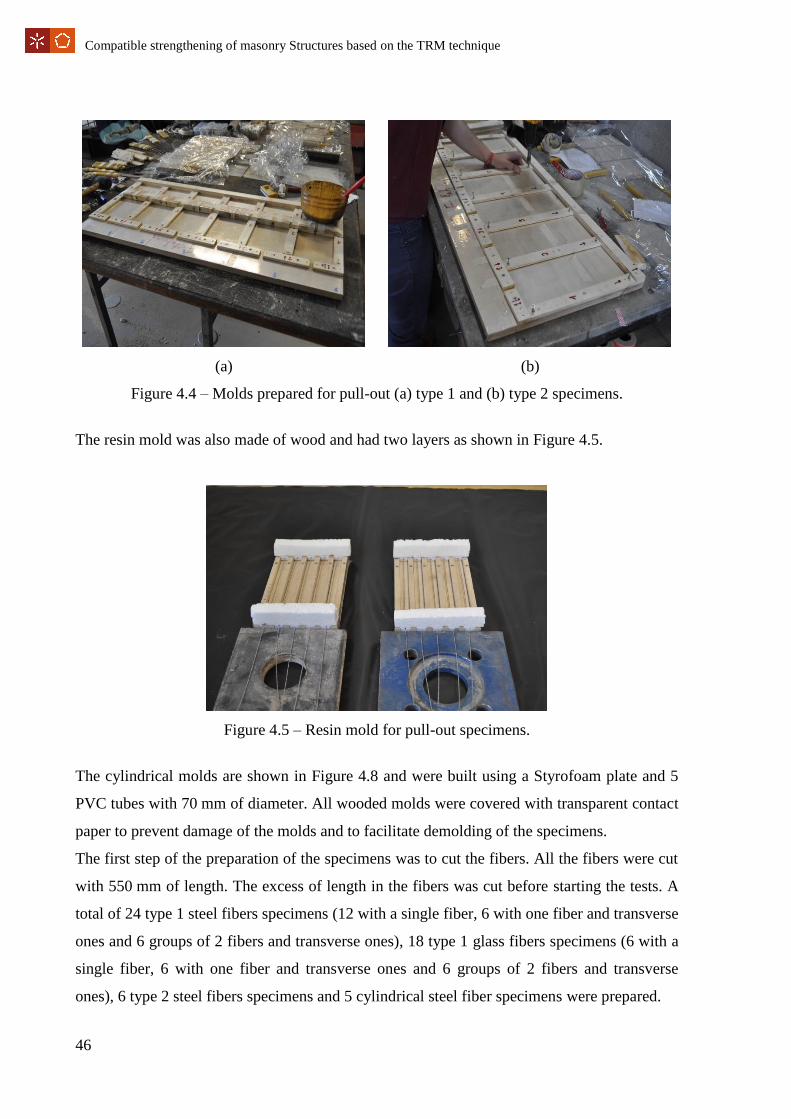
46
Compatible strengthening of masonry Structures based on the TRM technique
(a) (b)
Figure 4.4 – Molds prepared for pull-out (a) type 1 and (b) type 2 specimens.
The resin mold was also made of wood and had two layers as shown in Figure 4.5.
Figure 4.5 – Resin mold for pull-out specimens.
The cylindrical molds are shown in Figure 4.8 and were built using a Styrofoam plate and 5
PVC tubes with 70 mm of diameter. All wooded molds were covered with transparent contact
paper to prevent damage of the molds and to facilitate demolding of the specimens.
The first step of the preparation of the specimens was to cut the fibers. All the fibers were cut
with 550 mm of length. The excess of length in the fibers was cut before starting the tests. A
total of 24 type 1 steel fibers specimens (12 with a single fiber, 6 with one fiber and transverse
ones and 6 groups of 2 fibers and transverse ones), 18 type 1 glass fibers specimens (6 with a
single fiber, 6 with one fiber and transverse ones and 6 groups of 2 fibers and transverse
ones), 6 type 2 steel fibers specimens and 5 cylindrical steel fiber specimens were prepared.
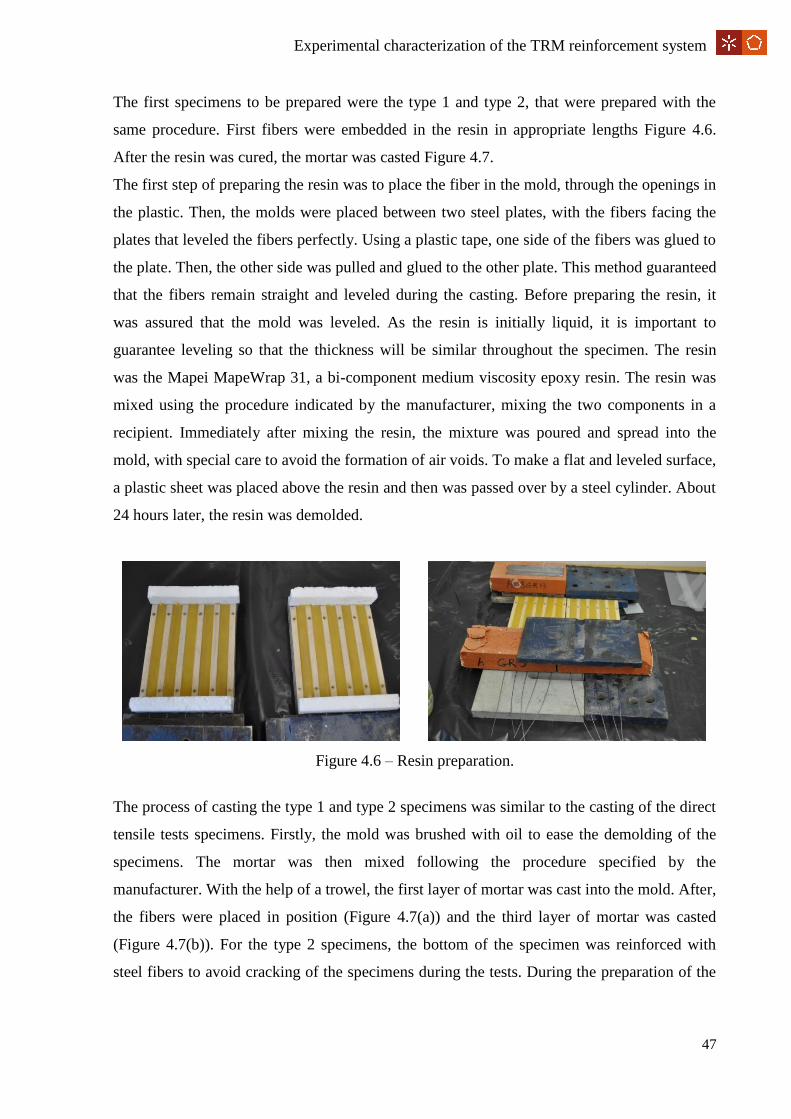
47
Experimental characterization of the TRM reinforcement system
The first specimens to be prepared were the type 1 and type 2, that were prepared with the
same procedure. First fibers were embedded in the resin in appropriate lengths Figure 4.6.
After the resin was cured, the mortar was casted Figure 4.7.
The first step of preparing the resin was to place the fiber in the mold, through the openings in
the plastic. Then, the molds were placed between two steel plates, with the fibers facing the
plates that leveled the fibers perfectly. Using a plastic tape, one side of the fibers was glued to
the plate. Then, the other side was pulled and glued to the other plate. This method guaranteed
that the fibers remain straight and leveled during the casting. Before preparing the resin, it
was assured that the mold was leveled. As the resin is initially liquid, it is important to
guarantee leveling so that the thickness will be similar throughout the specimen. The resin
was the Mapei MapeWrap 31, a bi-component medium viscosity epoxy resin. The resin was
mixed using the procedure indicated by the manufacturer, mixing the two components in a
recipient. Immediately after mixing the resin, the mixture was poured and spread into the
mold, with special care to avoid the formation of air voids. To make a flat and leveled surface,
a plastic sheet was placed above the resin and then was passed over by a steel cylinder. About
24 hours later, the resin was demolded.
Figure 4.6 – Resin preparation.
The process of casting the type 1 and type 2 specimens was similar to the casting of the direct
tensile tests specimens. Firstly, the mold was brushed with oil to ease the demolding of the
specimens. The mortar was then mixed following the procedure specified by the
manufacturer. With the help of a trowel, the first layer of mortar was cast into the mold. After,
the fibers were placed in position (Figure 4.7(a)) and the third layer of mortar was casted
(Figure 4.7(b)). For the type 2 specimens, the bottom of the specimen was reinforced with
steel fibers to avoid cracking of the specimens during the tests. During the preparation of the
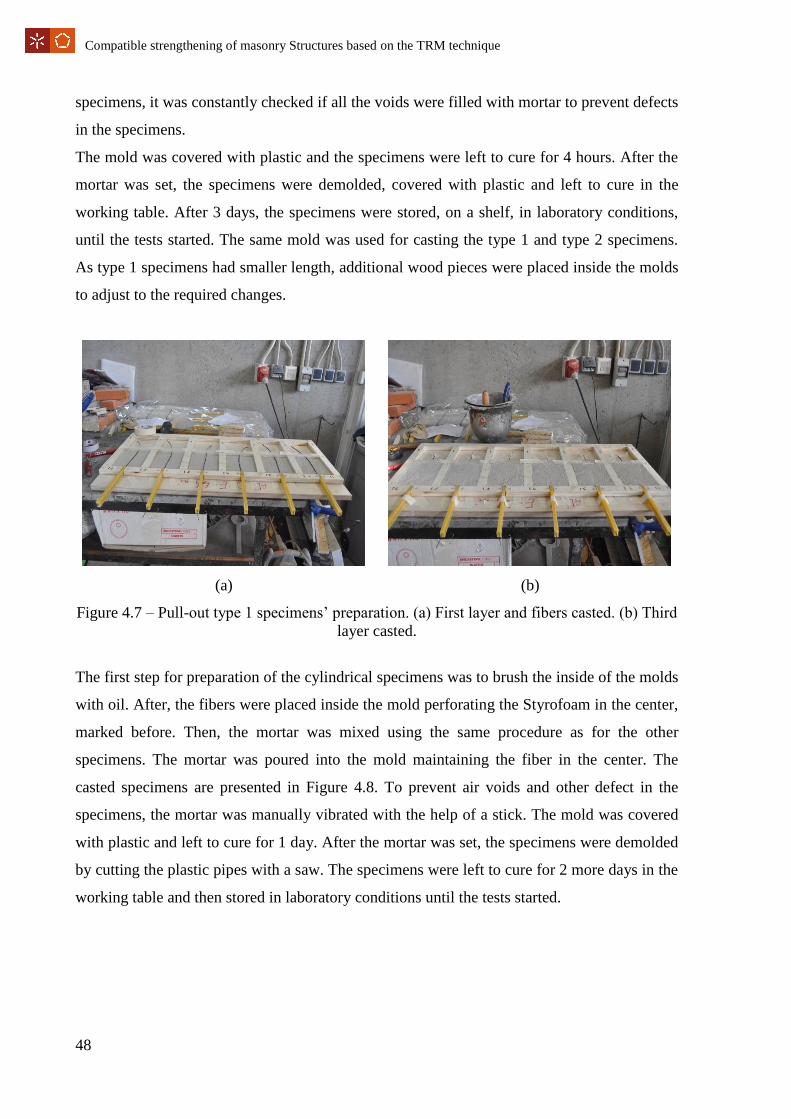
48
Compatible strengthening of masonry Structures based on the TRM technique
specimens, it was constantly checked if all the voids were filled with mortar to prevent defects
in the specimens.
The mold was covered with plastic and the specimens were left to cure for 4 hours. After the
mortar was set, the specimens were demolded, covered with plastic and left to cure in the
working table. After 3 days, the specimens were stored, on a shelf, in laboratory conditions,
until the tests started. The same mold was used for casting the type 1 and type 2 specimens.
As type 1 specimens had smaller length, additional wood pieces were placed inside the molds
to adjust to the required changes.
(a) (b)
Figure 4.7 – Pull-out type 1 specimens’ preparation. (a) First layer and fibers casted. (b) Third
layer casted.
The first step for preparation of the cylindrical specimens was to brush the inside of the molds
with oil. After, the fibers were placed inside the mold perforating the Styrofoam in the center,
marked before. Then, the mortar was mixed using the same procedure as for the other
specimens. The mortar was poured into the mold maintaining the fiber in the center. The
casted specimens are presented in Figure 4.8. To prevent air voids and other defect in the
specimens, the mortar was manually vibrated with the help of a stick. The mold was covered
with plastic and left to cure for 1 day. After the mortar was set, the specimens were demolded
by cutting the plastic pipes with a saw. The specimens were left to cure for 2 more days in the
working table and then stored in laboratory conditions until the tests started.

49
Experimental characterization of the TRM reinforcement system
Figure 4.8 – Pull-out cylindrical specimens’ casted.
4.2.3. Shear tests (Single-lap)
The single-lap specimens were composed of a standard brick, as the substrate, reinforced with
a TRM layer made of steel or glass fibers. The fibers were longer than the mortar to provide
free length to facilitate gripping during the tests. The mortar was applied over a 70x150 mm2
and with 10 mm thickness and a free length of fibers was around 280 mm, as presented in
Figure 4.9.
Figure 4.9 – Single-lap steel specimen.
The preparation for this tests started by cutting the fibers with the right dimensions, using 3
and 8 fibers for glass and steel fibers, respectively, and both with a length of 500 mm. After
cutting, the fibers were stored and protected to avoid being damaged.

50
Compatible strengthening of masonry Structures based on the TRM technique
After washing and cleaning the bricks, guide lines were marked on the bricks’ surfaces to
prevent mistakes in the dimensions and leveling of the application area. Then, the bricks were
immersed in water 24 hours prior to the TRM application.
A steel mold was made with the exact required length and width to use for application of the
mortar to the bricks’ surfaces. The molds consisted of a large steel plate with 5 mm thickness.
This plate had 7 cut-outs with 150 mm of length and 70 mm of width. Before being used, the
mold was cleaned and greased with oil.
The bricks were taken out of the water and placed on a working table (7 bricks at each time)
(Figure 4.10(a)). Then, the mold was placed above the bricks. The bricks were then
repositioned in a way that the guide-lines matched the cut-outs in the mold. After everything
was in the correct position, the bricks and mold were fixed to the working table using 3
clamps, (Figure 4.10(b)).
(a) (b) (c)
(d) (e) (f)
Figure 4.10 – Single-lap specimens’ preparation sequence.
The mortar was then mixed according to the technical datasheets. Then, the first layer of
mortar was cast in the mold using a trowel. The clamps were unfixed and the mold was taken
off (Figure 4.10(c)). Four little steel plates, with 5 mm thickness, were placed on top of each
brick and then the mold was put in place and fixed again. Before casting the second layer of
mortar, the fibers were placed in position using the guidelines made in the bricks (Figure
4.10(d)). A piece of wood, with 55 mm of thickness, was placed in the table to support the
part of fibers that was not inside if the mortar. It is important to press the fibers against the
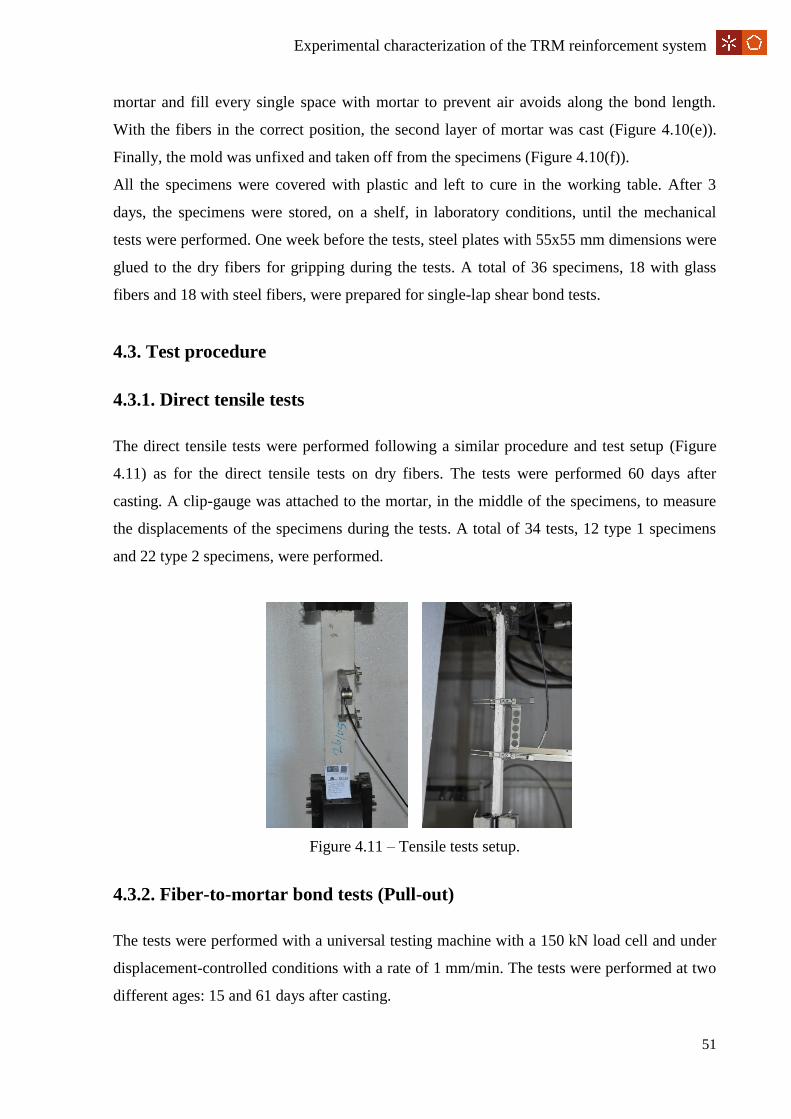
51
Experimental characterization of the TRM reinforcement system
mortar and fill every single space with mortar to prevent air avoids along the bond length.
With the fibers in the correct position, the second layer of mortar was cast (Figure 4.10(e)).
Finally, the mold was unfixed and taken off from the specimens (Figure 4.10(f)).
All the specimens were covered with plastic and left to cure in the working table. After 3
days, the specimens were stored, on a shelf, in laboratory conditions, until the mechanical
tests were performed. One week before the tests, steel plates with 55x55 mm dimensions were
glued to the dry fibers for gripping during the tests. A total of 36 specimens, 18 with glass
fibers and 18 with steel fibers, were prepared for single-lap shear bond tests.
4.3. Test procedure
4.3.1. Direct tensile tests
The direct tensile tests were performed following a similar procedure and test setup (Figure
4.11) as for the direct tensile tests on dry fibers. The tests were performed 60 days after
casting. A clip-gauge was attached to the mortar, in the middle of the specimens, to measure
the displacements of the specimens during the tests. A total of 34 tests, 12 type 1 specimens
and 22 type 2 specimens, were performed.
Figure 4.11 – Tensile tests setup.
4.3.2. Fiber-to-mortar bond tests (Pull-out)
The tests were performed with a universal testing machine with a 150 kN load cell and under
displacement-controlled conditions with a rate of 1 mm/min. The tests were performed at two
different ages: 15 and 61 days after casting.
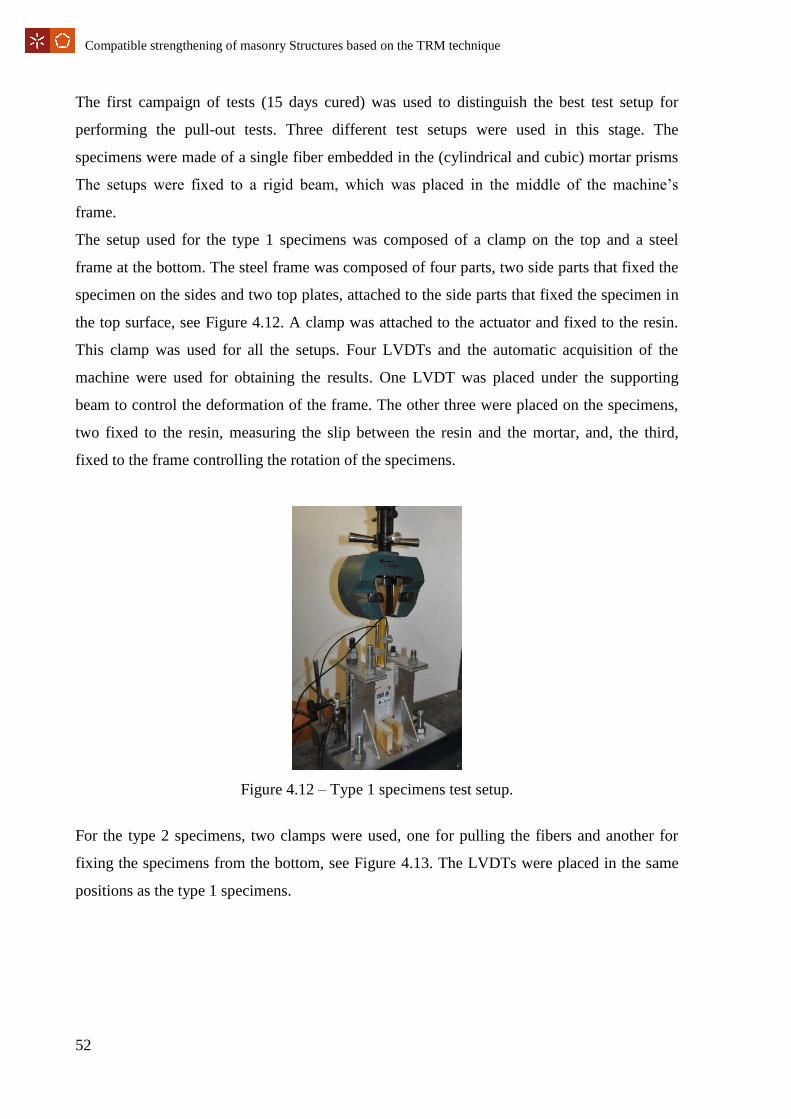
52
Compatible strengthening of masonry Structures based on the TRM technique
The first campaign of tests (15 days cured) was used to distinguish the best test setup for
performing the pull-out tests. Three different test setups were used in this stage. The
specimens were made of a single fiber embedded in the (cylindrical and cubic) mortar prisms
The setups were fixed to a rigid beam, which was placed in the middle of the machine’s
frame.
The setup used for the type 1 specimens was composed of a clamp on the top and a steel
frame at the bottom. The steel frame was composed of four parts, two side parts that fixed the
specimen on the sides and two top plates, attached to the side parts that fixed the specimen in
the top surface, see Figure 4.12. A clamp was attached to the actuator and fixed to the resin.
This clamp was used for all the setups. Four LVDTs and the automatic acquisition of the
machine were used for obtaining the results. One LVDT was placed under the supporting
beam to control the deformation of the frame. The other three were placed on the specimens,
two fixed to the resin, measuring the slip between the resin and the mortar, and, the third,
fixed to the frame controlling the rotation of the specimens.
Figure 4.12 – Type 1 specimens test setup.
For the type 2 specimens, two clamps were used, one for pulling the fibers and another for
fixing the specimens from the bottom, see Figure 4.13. The LVDTs were placed in the same
positions as the type 1 specimens.

53
Experimental characterization of the TRM reinforcement system
Figure 4.13 – Type 2 specimens test setup.
For the cylindrical specimens, a thick steel plate was placed above the cylinder mortar and
firmly fixed to the frame with 4 bolts. The steel plate had a hole in the center so that the fiber
could pass through it, see Figure 4.14. There were LVDTs placed in similar positions.
The results, to be presented in the next sections, showed that the type 1 test setup produced
the best results, and therefore it was used for the second campaign of the experimental tests.
Figure 4.14 – Cylindrical specimens test setup.
Tests preparation consisted of opening the clamps (depending on the test setup), putting the
specimens in the frame, using a level to assure a correct position and closing the frame or
clamp. Then, L-shaped steel plates were glued in appropriate positions as the base of the
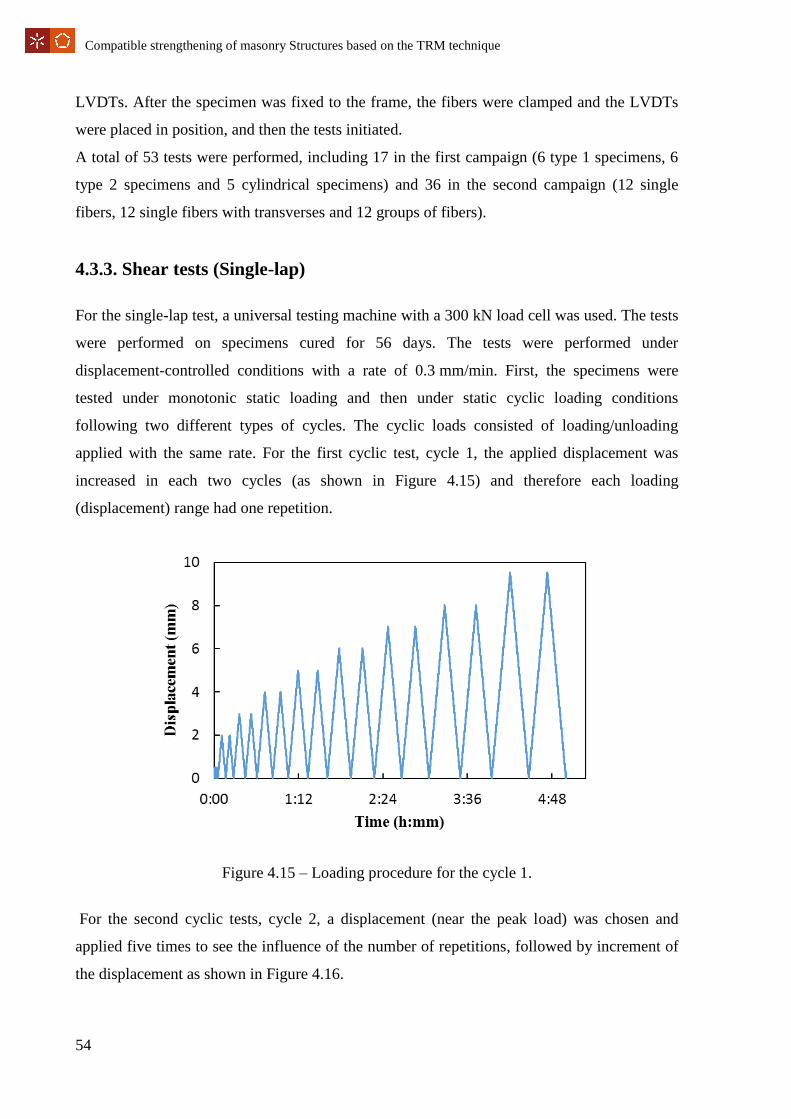
54
Compatible strengthening of masonry Structures based on the TRM technique
LVDTs. After the specimen was fixed to the frame, the fibers were clamped and the LVDTs
were placed in position, and then the tests initiated.
A total of 53 tests were performed, including 17 in the first campaign (6 type 1 specimens, 6
type 2 specimens and 5 cylindrical specimens) and 36 in the second campaign (12 single
fibers, 12 single fibers with transverses and 12 groups of fibers).
4.3.3. Shear tests (Single-lap)
For the single-lap test, a universal testing machine with a 300 kN load cell was used. The tests
were performed on specimens cured for 56 days. The tests were performed under
displacement-controlled conditions with a rate of 0.3 mm/min. First, the specimens were
tested under monotonic static loading and then under static cyclic loading conditions
following two different types of cycles. The cyclic loads consisted of loading/unloading
applied with the same rate. For the first cyclic test, cycle 1, the applied displacement was
increased in each two cycles (as shown in Figure 4.15) and therefore each loading
(displacement) range had one repetition.
Figure 4.15 – Loading procedure for the cycle 1.
For the second cyclic tests, cycle 2, a displacement (near the peak load) was chosen and
applied five times to see the influence of the number of repetitions, followed by increment of
the displacement as shown in Figure 4.16.
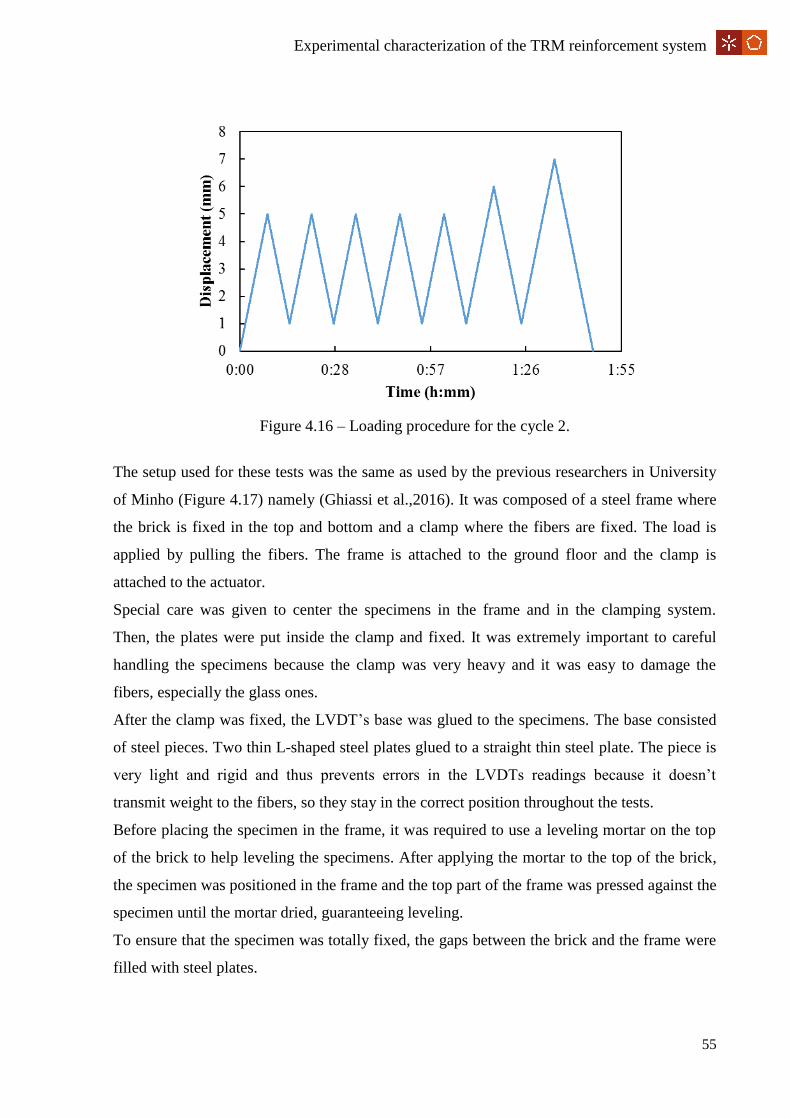
55
Experimental characterization of the TRM reinforcement system
Figure 4.16 – Loading procedure for the cycle 2.
The setup used for these tests was the same as used by the previous researchers in University
of Minho (Figure 4.17) namely (Ghiassi et al.,2016). It was composed of a steel frame where
the brick is fixed in the top and bottom and a clamp where the fibers are fixed. The load is
applied by pulling the fibers. The frame is attached to the ground floor and the clamp is
attached to the actuator.
Special care was given to center the specimens in the frame and in the clamping system.
Then, the plates were put inside the clamp and fixed. It was extremely important to careful
handling the specimens because the clamp was very heavy and it was easy to damage the
fibers, especially the glass ones.
After the clamp was fixed, the LVDT’s base was glued to the specimens. The base consisted
of steel pieces. Two thin L-shaped steel plates glued to a straight thin steel plate. The piece is
very light and rigid and thus prevents errors in the LVDTs readings because it doesn’t
transmit weight to the fibers, so they stay in the correct position throughout the tests.
Before placing the specimen in the frame, it was required to use a leveling mortar on the top
of the brick to help leveling the specimens. After applying the mortar to the top of the brick,
the specimen was positioned in the frame and the top part of the frame was pressed against the
specimen until the mortar dried, guaranteeing leveling.
To ensure that the specimen was totally fixed, the gaps between the brick and the frame were
filled with steel plates.

56
Compatible strengthening of masonry Structures based on the TRM technique
Afterwards, the clamp was fixed to the actuator with a pin. The pin is fixed to a joint that is
fixed to the jack, this allows the clamp to rotate and adjust during the tests. The two LVDTs
were fixed on each side of the brick, touching the steel pieces, previously glued, as close as
possible to the fibers. Four additional clamps were used to fix the specimens horizontally to
the frame.
(a) (b)
(a) (b) (c)
Figure 4.17 – Single-lap tests setup. (a) Specimens geometry (Ghiassi et al., 2016). (b) Test
setup (Ghiassi et al., 2016). (c) Side view. (d) Front view. (e) Clamping mechanism.
Before starting the tests, a pre-load was imposed to align the fibers and prevent mistakes in
LVDT readings. Without the pre-load, the tests could start with the fibers bent or not in the
correct position. For the specimens reinforced with steel and glass based TRMs, the pre-loads
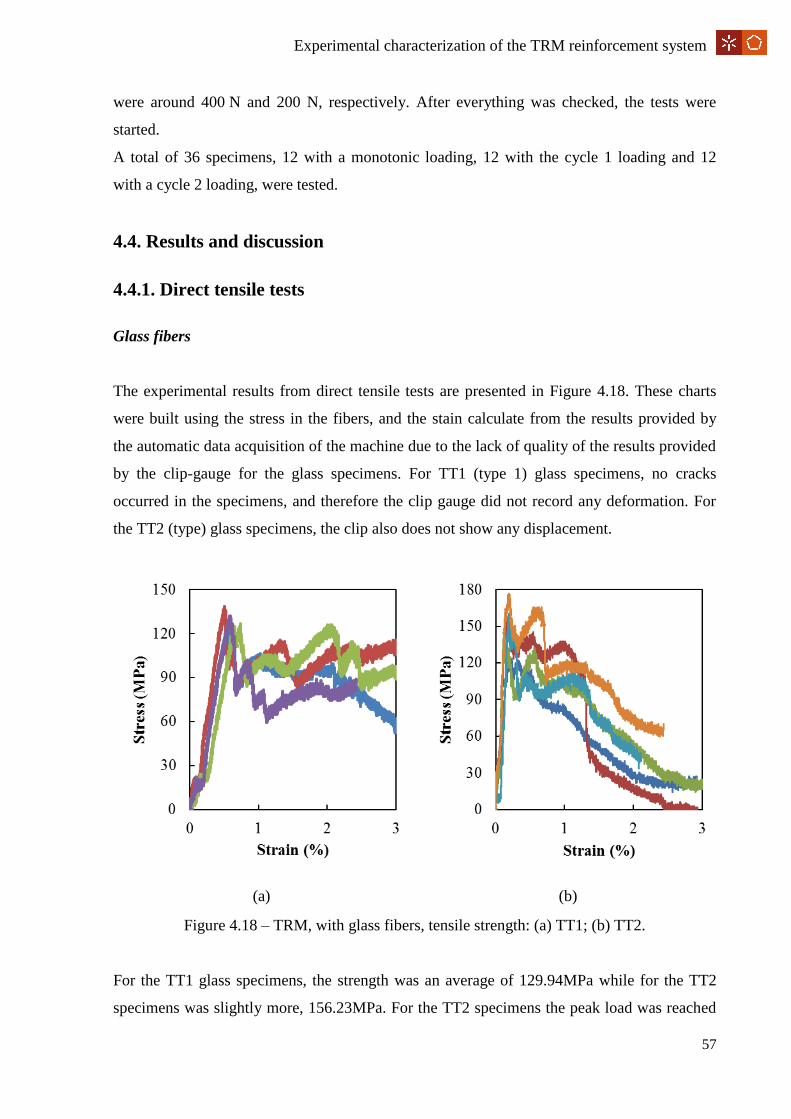
57
Experimental characterization of the TRM reinforcement system
were around 400 N and 200 N, respectively. After everything was checked, the tests were
started.
A total of 36 specimens, 12 with a monotonic loading, 12 with the cycle 1 loading and 12
with a cycle 2 loading, were tested.
4.4. Results and discussion
4.4.1. Direct tensile tests
Glass fibers
The experimental results from direct tensile tests are presented in Figure 4.18. These charts
were built using the stress in the fibers, and the stain calculate from the results provided by
the automatic data acquisition of the machine due to the lack of quality of the results provided
by the clip-gauge for the glass specimens. For TT1 (type 1) glass specimens, no cracks
occurred in the specimens, and therefore the clip gauge did not record any deformation. For
the TT2 (type) glass specimens, the clip also does not show any displacement.
(a) (b)
Figure 4.18 – TRM, with glass fibers, tensile strength: (a) TT1; (b) TT2.
For the TT1 glass specimens, the strength was an average of 129.94MPa while for the TT2
specimens was slightly more, 156.23MPa. For the TT2 specimens the peak load was reached
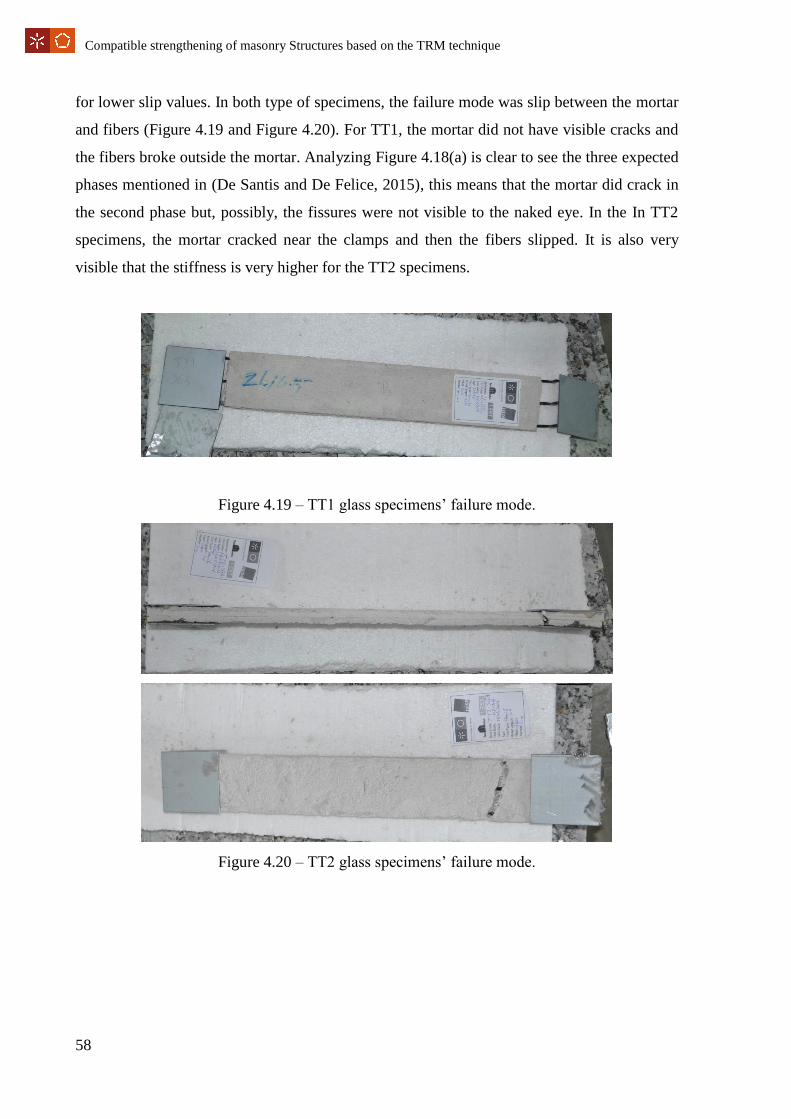
58
Compatible strengthening of masonry Structures based on the TRM technique
for lower slip values. In both type of specimens, the failure mode was slip between the mortar
and fibers (Figure 4.19 and Figure 4.20). For TT1, the mortar did not have visible cracks and
the fibers broke outside the mortar. Analyzing Figure 4.18(a) is clear to see the three expected
phases mentioned in (De Santis and De Felice, 2015), this means that the mortar did crack in
the second phase but, possibly, the fissures were not visible to the naked eye. In the In TT2
specimens, the mortar cracked near the clamps and then the fibers slipped. It is also very
visible that the stiffness is very higher for the TT2 specimens.
Figure 4.19 – TT1 glass specimens’ failure mode.
Figure 4.20 – TT2 glass specimens’ failure mode.
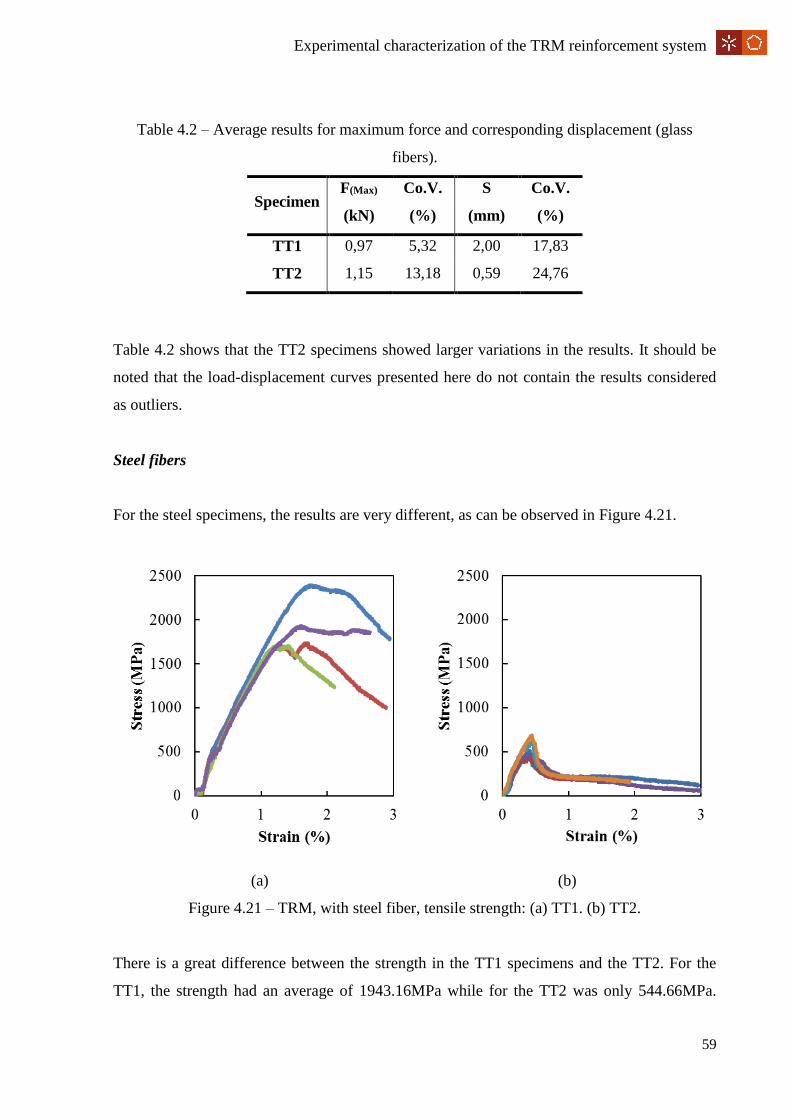
59
Experimental characterization of the TRM reinforcement system
Table 4.2 – Average results for maximum force and corresponding displacement (glass
fibers).
Specimen F(Max) Co.V. S Co.V.
(kN) (%) (mm) (%)
TT1 0,97 5,32 2,00 17,83
TT2 1,15 13,18 0,59 24,76
Table 4.2 shows that the TT2 specimens showed larger variations in the results. It should be
noted that the load-displacement curves presented here do not contain the results considered
as outliers.
Steel fibers
For the steel specimens, the results are very different, as can be observed in Figure 4.21.
(a) (b)
Figure 4.21 – TRM, with steel fiber, tensile strength: (a) TT1. (b) TT2.
There is a great difference between the strength in the TT1 specimens and the TT2. For the
TT1, the strength had an average of 1943.16MPa while for the TT2 was only 544.66MPa.

60
Compatible strengthening of masonry Structures based on the TRM technique
This means that the testing of TT2 specimens did not succeed to exploit at least the capacity
exhibited by TT1 specimens. The failure mode was the same as for the glass specimens, but
for the TT1 there were some cracks in the mortar (Figure 4.22 and Figure 4.23). This great
difference is due to the fact that for TT1, after the mortar is cracked, the fibers continue to be
pulled until the breaking point, while for the TT2, after the mortar is cracked, the fibers
eventually start to slip from the mortar.
Figure 4.22 – TT1 steel specimen after testing.

61
Experimental characterization of the TRM reinforcement system
Figure 4.23 – TT2 steel specimens after testing.
Table 4.3 shows that the TT2 specimens showed larger variations in the results regarding the
maximum load while TT1 specimens showed larger variation regarding the displacement at
the peak load.
The TT1 specimens seem to have better results since it is possible to see the three phases
expected in the results, the fibers are used to its full potential and there is no possibility of
damaging the mortar in the gripping area, on the other hand, the TT2 results show a different
type of curve, with more stiffness and the fibers slip inside the mortar. That might be the real
behavior of the TRM when used to reinforce a structure.
Table 4.3 - Average results for maximum force and corresponding slip values (steel fibers).
Specimen F(Max) Co.V. S Co.V.
(kN) (%) (mm) (%)
TT1 8,36 16,27 5,33 14,11
TT2 2,34 18,92 1,47 7,83
4.4.2. Fiber-to-mortar bond tests (Pull-out)
The results for the first campaign (evaluating the different test setups) can be seen in Figure
4.24.

62
Compatible strengthening of masonry Structures based on the TRM technique
(a) (b)
(c)
Figure 4.24 – Pull-out behavior between the mortar and steel fibers: (a) type 1 specimens; (b)
type 2 specimens; (c) cylindrical specimens.
In the type 2 specimens, the results show a low variation and only one specimen has a higher
load resistance compared to the others. For the type 1, the variation of the results is larger, but
still in an acceptable range of variation. The cylindrical specimens, however, show a large
variation in the results (mainly in terms of peak load).

63
Experimental characterization of the TRM reinforcement system
Table 4.4 – Average pull-out strength and associated slip between the mortar and the steel
fiber for different setups.
Specimens Fmax Co.V. SFmax Co.V.
(kN) (%) (mm) (%)
Type 1 0,76 26,91 3,91 22,76
Type 2 0,79 11,32 5,10 46,52
Cylindrical 0,86 34,66 3,51 38,44
The summary of the experimental results is presented in Table 4.4. The table shows that the
type of specimen with smaller variation in the maximum load is the type 2. The type with
smaller variation in the peak slip is the type 1 test setup. This leaves out the cylindrical setup
as a suitable option, also because it presents a large variation in maximum pull-out force.
Between the type 1 and type 2, the type 1 was chosen. The results variation was similar for
type one and type 2 specimens but cracking of the specimens in the type 2 test setup is more
probable. Type 1 specimens were also easier to cast which promotes better specimens,
therefore better results. Another key factor on the choice was the fact that the setup of type 1
specimens was easier to assemble and to level, while the type 2 specimens’ setup required
more time and caution. As the tests were to be carried out in glass fibers, which are very
fragile, type 1 was considered the best option.
Glass Specimens
Using the type 1 test setup, the second campaign of experimental tests, already described, was
performed and the results are presented in Figure 4.25.
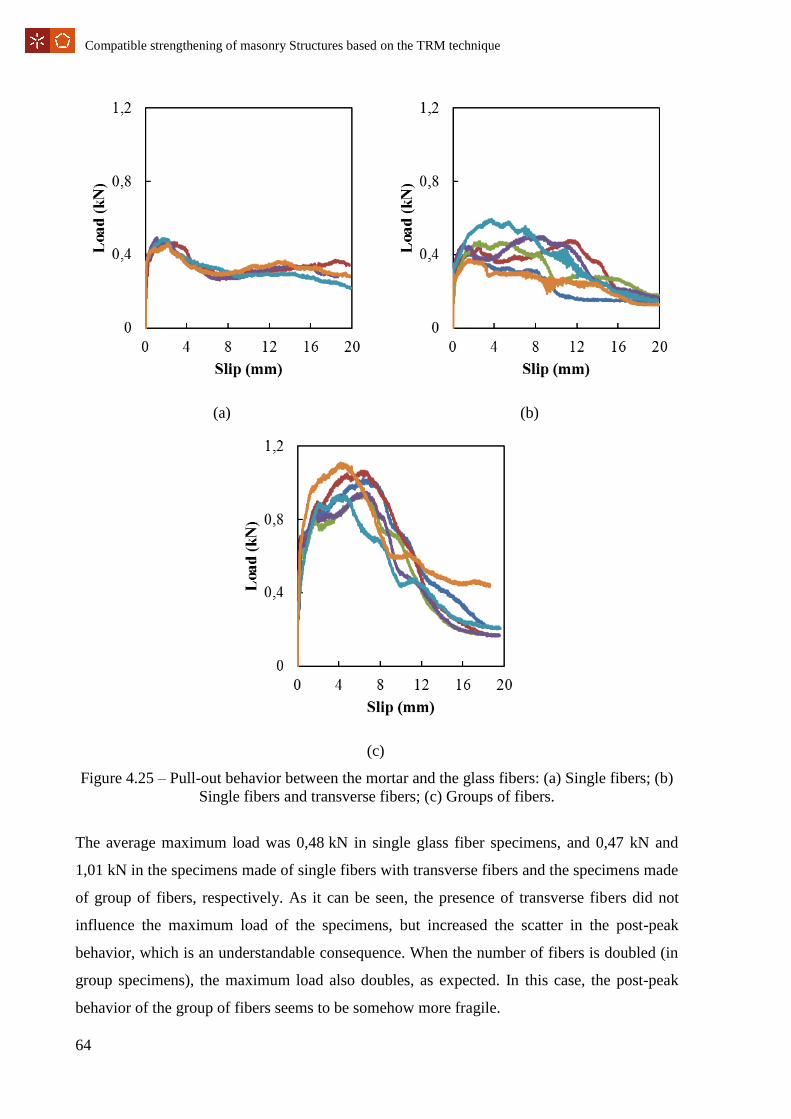
64
Compatible strengthening of masonry Structures based on the TRM technique
(a) (b)
(c)
Figure 4.25 – Pull-out behavior between the mortar and the glass fibers: (a) Single fibers; (b)
Single fibers and transverse fibers; (c) Groups of fibers.
The average maximum load was 0,48 kN in single glass fiber specimens, and 0,47 kN and
1,01 kN in the specimens made of single fibers with transverse fibers and the specimens made
of group of fibers, respectively. As it can be seen, the presence of transverse fibers did not
influence the maximum load of the specimens, but increased the scatter in the post-peak
behavior, which is an understandable consequence. When the number of fibers is doubled (in
group specimens), the maximum load also doubles, as expected. In this case, the post-peak
behavior of the group of fibers seems to be somehow more fragile.
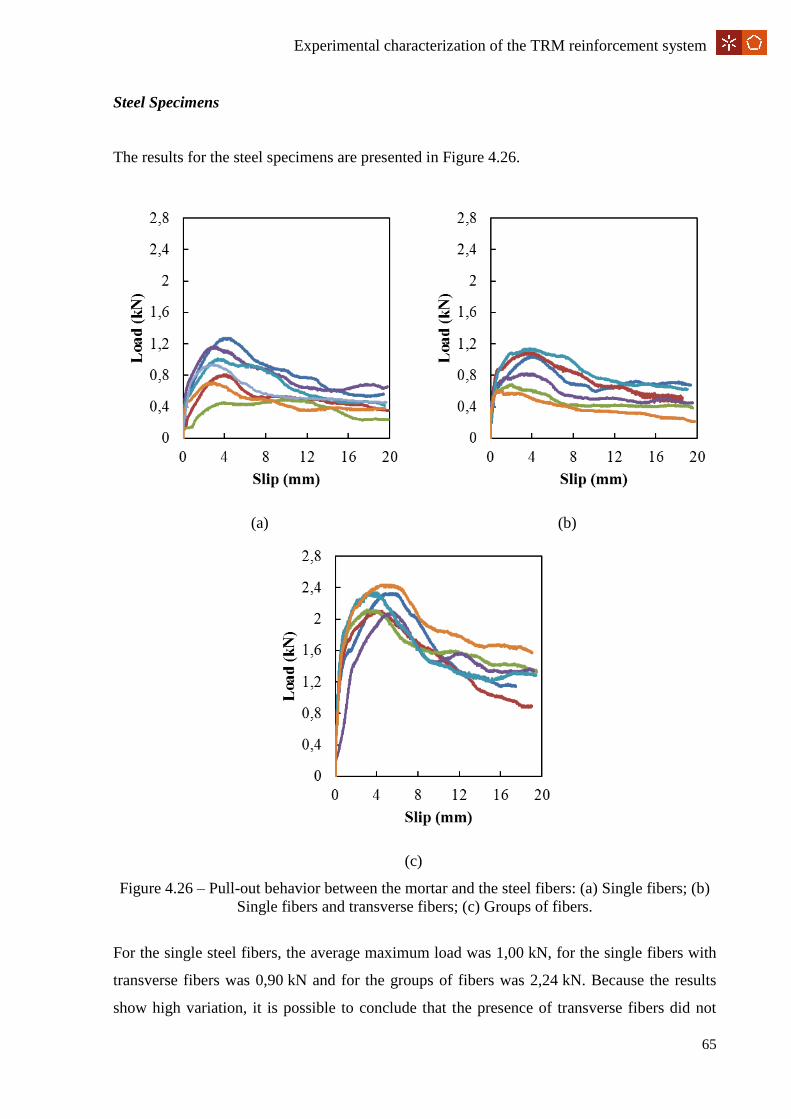
65
Experimental characterization of the TRM reinforcement system
Steel Specimens
The results for the steel specimens are presented in Figure 4.26.
(a) (b)
(c)
Figure 4.26 – Pull-out behavior between the mortar and the steel fibers: (a) Single fibers; (b)
Single fibers and transverse fibers; (c) Groups of fibers.
For the single steel fibers, the average maximum load was 1,00 kN, for the single fibers with
transverse fibers was 0,90 kN and for the groups of fibers was 2,24 kN. Because the results
show high variation, it is possible to conclude that the presence of transverse fibers did not
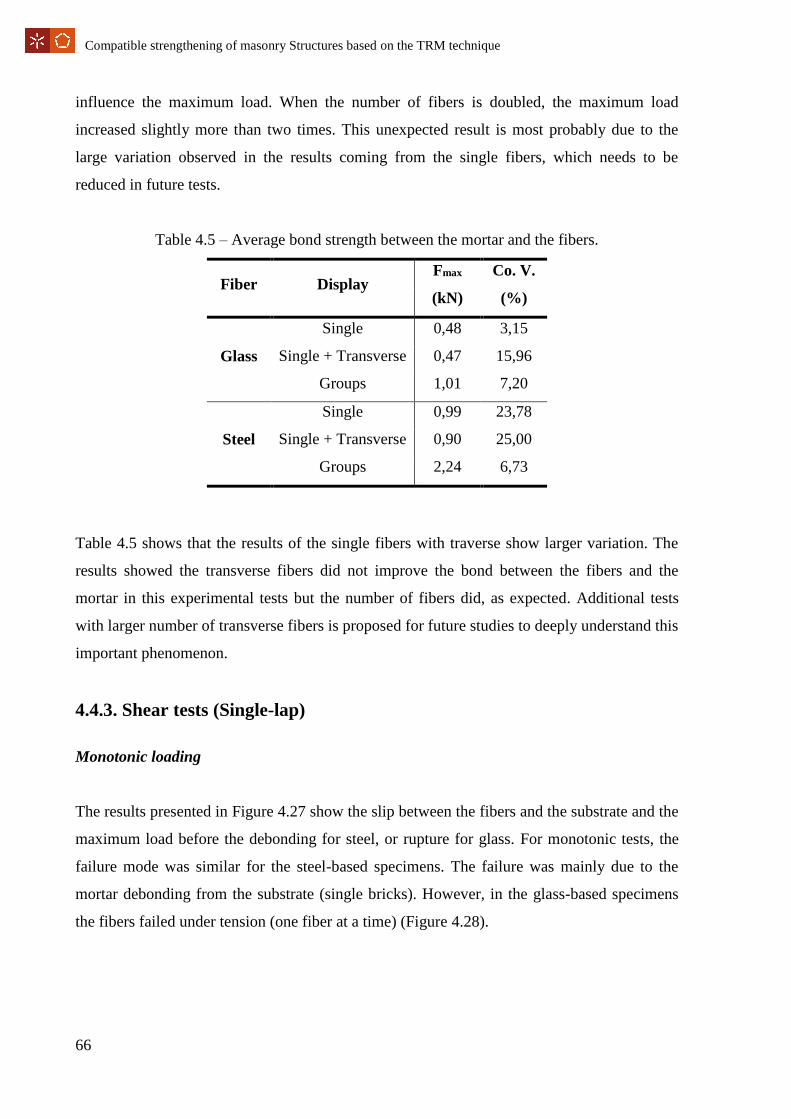
66
Compatible strengthening of masonry Structures based on the TRM technique
influence the maximum load. When the number of fibers is doubled, the maximum load
increased slightly more than two times. This unexpected result is most probably due to the
large variation observed in the results coming from the single fibers, which needs to be
reduced in future tests.
Table 4.5 – Average bond strength between the mortar and the fibers.
Fiber Display Fmax Co. V.
(kN) (%)
Glass
Single 0,48 3,15
Single + Transverse 0,47 15,96
Groups 1,01 7,20
Steel
Single 0,99 23,78
Single + Transverse 0,90 25,00
Groups 2,24 6,73
Table 4.5 shows that the results of the single fibers with traverse show larger variation. The
results showed the transverse fibers did not improve the bond between the fibers and the
mortar in this experimental tests but the number of fibers did, as expected. Additional tests
with larger number of transverse fibers is proposed for future studies to deeply understand this
important phenomenon.
4.4.3. Shear tests (Single-lap)
Monotonic loading
The results presented in Figure 4.27 show the slip between the fibers and the substrate and the
maximum load before the debonding for steel, or rupture for glass. For monotonic tests, the
failure mode was similar for the steel-based specimens. The failure was mainly due to the
mortar debonding from the substrate (single bricks). However, in the glass-based specimens
the fibers failed under tension (one fiber at a time) (Figure 4.28).

67
Experimental characterization of the TRM reinforcement system
(a) (b)
Figure 4.27 – Slip between the substrate and the fibers. (a) Glass fibers. (b) Steel fibers.
The results show that the maximum load is higher for steel fibers while the slip between the
substrate and the fibers is larger for the glass fibers. It was possible to see that some sliding
occurred between the fibers and the mortar, but it was not the failure mode. As illustrated in
Figure 4.29, the debonding between the mortar and the bricks occurs suddenly and in a very
brittle way, leaving several and very thin pieces of mortar in the brick and vice versa
(adhesive failure). A summary of the results is presented in Table 4.6.
Figure 4.28 – Single-lap glass specimens’ failure mode.

68
Compatible strengthening of masonry Structures based on the TRM technique
Figure 4.29 – Single-lap steel specimens’ failure mode.
Table 4.6 – Average maximum load slip between the mortar and fibers.
Specimen Fmax f' CoV. S CoV.
kN (MPa) (%) (mm) (%)
Steel 9,68 2248,90 3,02 0,96 25,73
Glass 1,68 224,57 23,54 1,44 58,98
Cyclic loadings
Cycle 1
For the cycle 1 loading, the individual results for the glass and steel specimens can be seen in
Figure 4.30. The slip values correspond to the average between the right and left side LVDT.
The failure mode of the specimens was the same as for the monotonic tests in the steel-based
reinforced specimens, debonding between the mortar and the substrate. However, in the glass
specimens, the fibers ruptured or partially ruptured near the steel plates where the clamp was
fixed.
With every loading, the residual slip between the mortar and the fibers increases which
provoked compressions of the fibers during the unloading. For future tests, this behavior can
be prevented by using force control instead of displacement control in the unloading part of
the cycles. Also, the load of the repetitions is always inferior to the load of the first loading
(strength degradation).
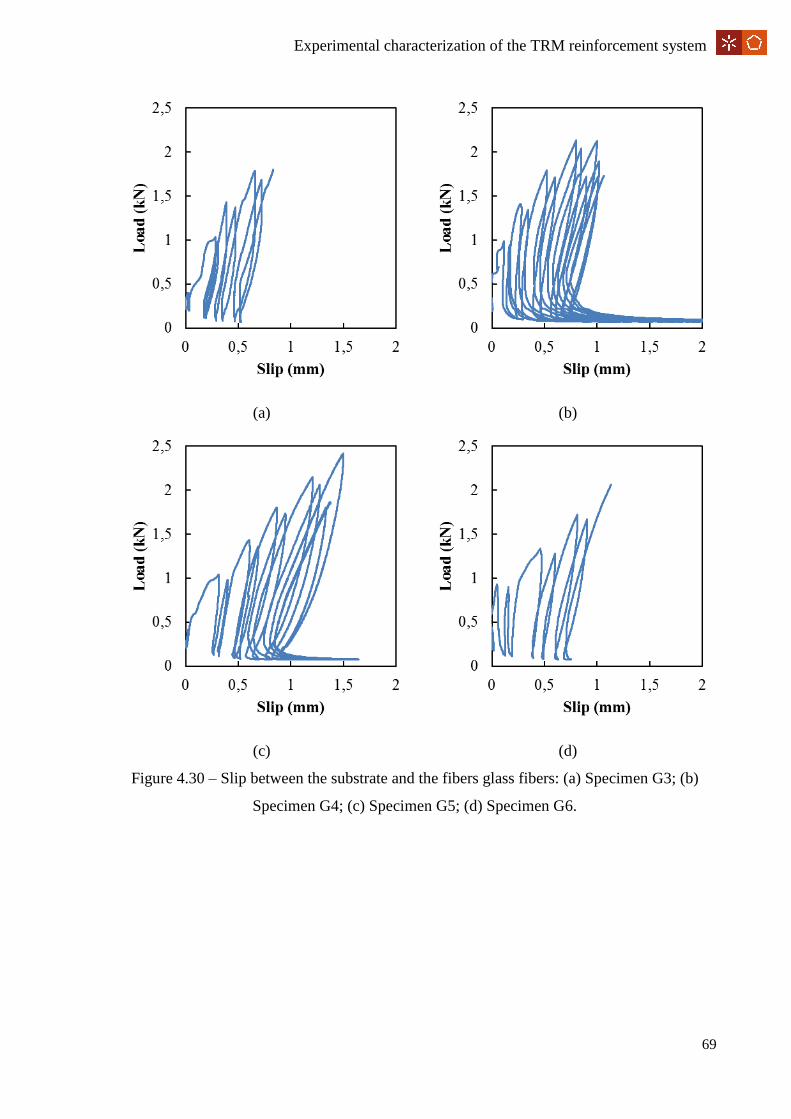
69
Experimental characterization of the TRM reinforcement system
(a) (b)
(c) (d)
Figure 4.30 – Slip between the substrate and the fibers glass fibers: (a) Specimen G3; (b)
Specimen G4; (c) Specimen G5; (d) Specimen G6.
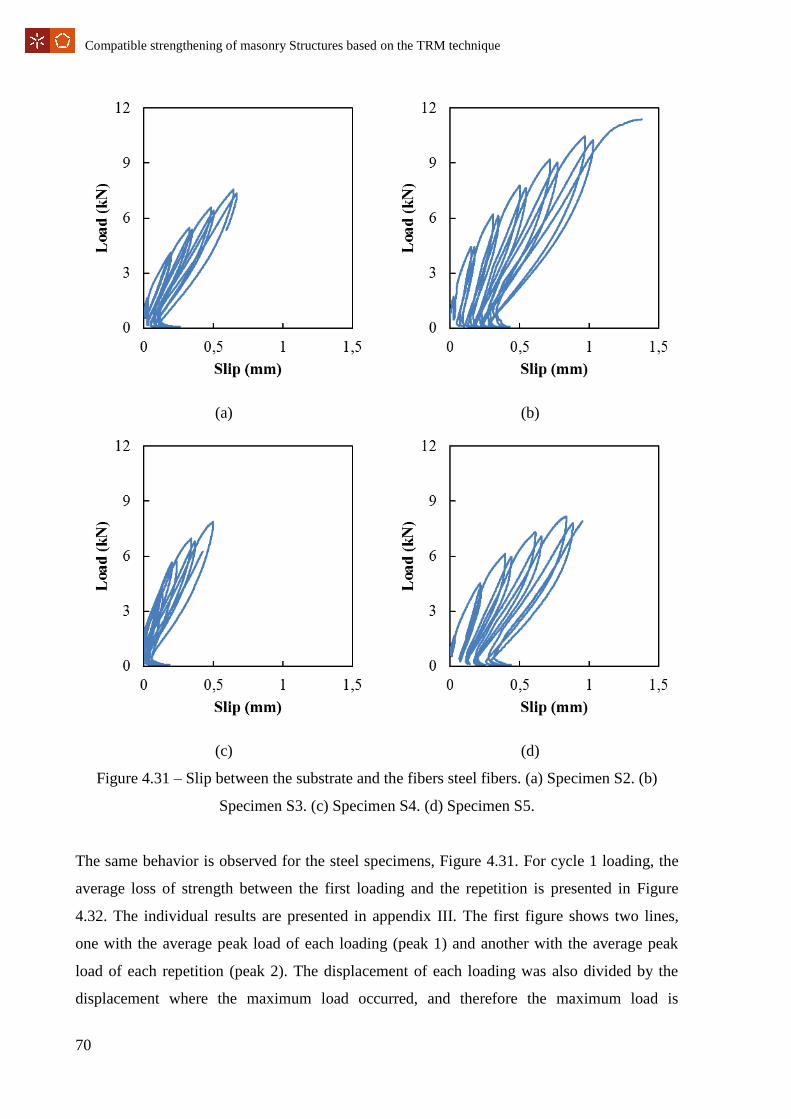
70
Compatible strengthening of masonry Structures based on the TRM technique
(a) (b)
(c) (d)
Figure 4.31 – Slip between the substrate and the fibers steel fibers. (a) Specimen S2. (b)
Specimen S3. (c) Specimen S4. (d) Specimen S5.
The same behavior is observed for the steel specimens, Figure 4.31. For cycle 1 loading, the
average loss of strength between the first loading and the repetition is presented in Figure
4.32. The individual results are presented in appendix III. The first figure shows two lines,
one with the average peak load of each loading (peak 1) and another with the average peak
load of each repetition (peak 2). The displacement of each loading was also divided by the
displacement where the maximum load occurred, and therefore the maximum load is

71
Experimental characterization of the TRM reinforcement system
presented when the xx axis has the value of 1. For these charts, it was used the displacement
of the machine. The numerical values are presented in Table 4.7.
(a) (b)
Figure 4.32 – Average peak loads for (a) glass specimens and (b) steel specimens.
Table 4.7 – Average difference between peaks of load.
Machine’s
displacement
(mm)
Peak1
(kN)
Peak2
(kN)
Difference
between
peaks
0,5 0,38 0,37 0,01
2,0 0,97 0,93 0,04
3,0 1,37 1,30 0,07
4,0 1,74 1,66 0,08
5,0 1,96 1,75 0,21
6,0 1,83 1,42 0,41
7,0 1,48 1,25 0,23
8,0 1,15 1,02 0,13
9,5 1,03 0,93 0,10
Results show that the difference between the peaks increases with the displacement until the
maximum load. After that, the difference seems to decrease. Also, for the glass specimens,
after the maximum load, the fibers are still capable of withstanding load.
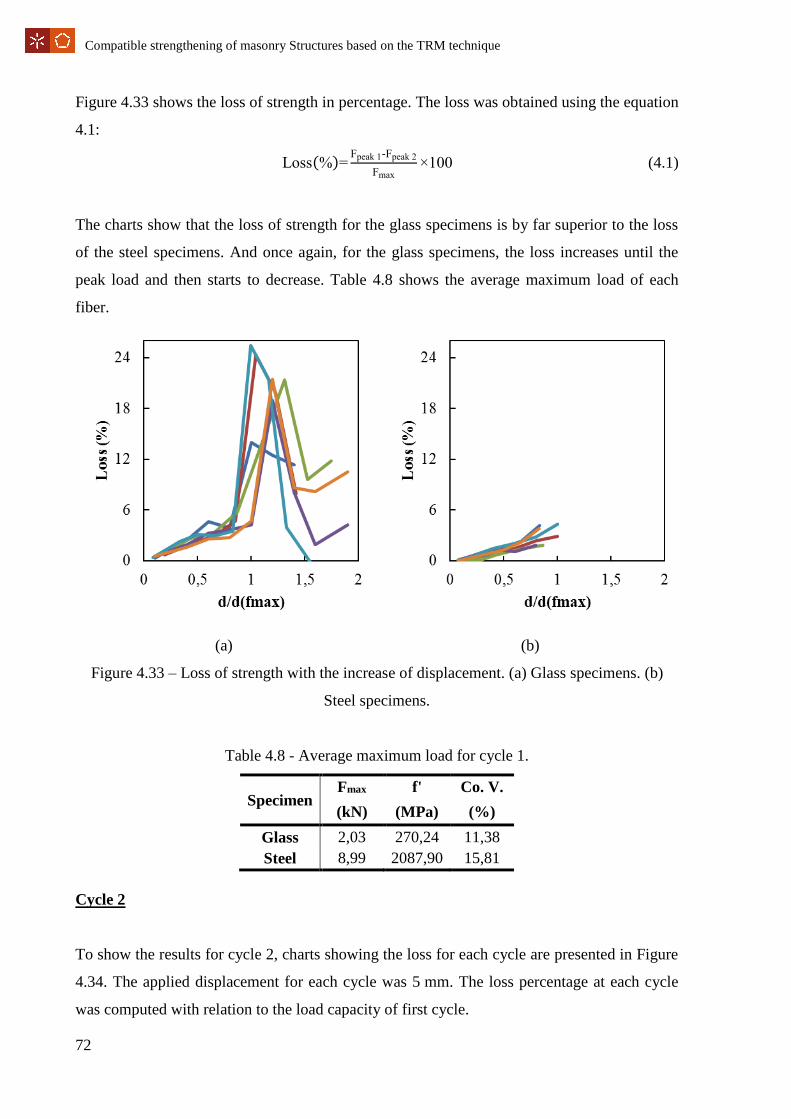
72
Compatible strengthening of masonry Structures based on the TRM technique
Figure 4.33 shows the loss of strength in percentage. The loss was obtained using the equation
4.1:
Loss(%)=Fpeak 1-Fpeak 2
Fmax×100 (4.1)
The charts show that the loss of strength for the glass specimens is by far superior to the loss
of the steel specimens. And once again, for the glass specimens, the loss increases until the
peak load and then starts to decrease. Table 4.8 shows the average maximum load of each
fiber.
(a) (b)
Figure 4.33 – Loss of strength with the increase of displacement. (a) Glass specimens. (b)
Steel specimens.
Table 4.8 - Average maximum load for cycle 1.
Specimen Fmax f' Co. V.
(kN) (MPa) (%)
Glass 2,03 270,24 11,38
Steel 8,99 2087,90 15,81
Cycle 2
To show the results for cycle 2, charts showing the loss for each cycle are presented in Figure
4.34. The applied displacement for each cycle was 5 mm. The loss percentage at each cycle
was computed with relation to the load capacity of first cycle.
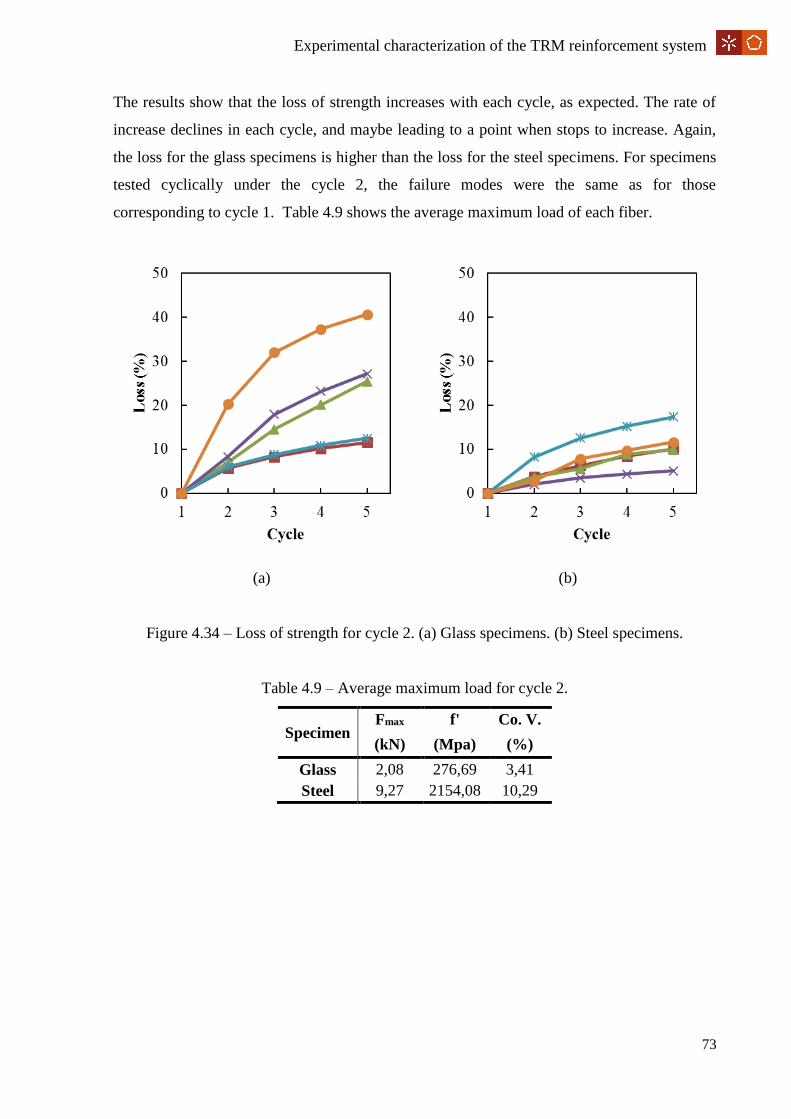
73
Experimental characterization of the TRM reinforcement system
The results show that the loss of strength increases with each cycle, as expected. The rate of
increase declines in each cycle, and maybe leading to a point when stops to increase. Again,
the loss for the glass specimens is higher than the loss for the steel specimens. For specimens
tested cyclically under the cycle 2, the failure modes were the same as for those
corresponding to cycle 1. Table 4.9 shows the average maximum load of each fiber.
(a) (b)
Figure 4.34 – Loss of strength for cycle 2. (a) Glass specimens. (b) Steel specimens.
Table 4.9 – Average maximum load for cycle 2.
Specimen Fmax f' Co. V.
(kN) (Mpa) (%)
Glass 2,08 276,69 3,41
Steel 9,27 2154,08 10,29

74
Compatible strengthening of masonry Structures based on the TRM technique

75
Conclusions and future work
CHAPTER V - CONCLUSIONS AND FUTURE WORK
5.1. Introduction
This chapter presents the main conclusions obtained from the experimental tests performed in
this thesis. From the results presented in Chapter II and IV it was possible to draw general
conclusions about the mortar compressive and flexural strength as well as its water absorption
capacity, about the tensile strength of the fibers and about the bond, shear and tensile behavior
and strength of the TRM system.
Proposals for future experimental works that can be done with the aim of deepening the
knowledge on this reinforcement method are also presented.
5.2. General conclusions
The first experimental part of this dissertation began by characterizing the materials involved
in the reinforcement system. From the results of the immersion tests, it can be concluded that
the age of the mortar does not seem to influence the absorbed water at saturation as the same
results were obtained for the ages of 31 and 92 days. Although the maximum absorption was
the same, the rate of absorption decreased slightly with the age of the mortar, which shows
that the mortar under study has a faster absorption rate at earlier ages. On the other hand, the
capillarity tests showed that the maximum water capillary absorption decreased with the age
of the specimen. This value dropped to half from the age of 43 days to the age of 92 days.
The compressive tests on the mortar showed that the mortar strength increased with the age
reaching a maximum at the age of 60 days, with the average value of 8.72 MPa. After 60
days, the strength was expected to stabilize, but, at the age of 90 days, the strength decreased.
This behavior can be the consequence of the variation of the results, but this behavior was
also observed in the flexural tests. Therefore, it is possible that this behavior is a characteristic
of the mortar. A deeper investigation of the main reasons for such an observation should be
performed in future studies.
In the flexural strength tests, the strength increased until the age of 60 days reaching the
maximum average value of 5.10 MPa. As stated above, the strength also decreased at the age
of 90 days, instead of stabilizing. To understand the reason for this behavior, it is necessary to
perform tests for ages above the 90 days, such as 120 and 150 days.

76
Compatible strengthening of masonry Structures based on the TRM technique
In the direct tensile tests of the steel fibers, for both single and group layouts, the curves are
approximately linear until failure showing a brittle behavior of the material, as expected. For
glass fibers, a similar behavior was observed. The steel fibers have three times larger strength
than the glass fibers. The strength of the groups of fibers was obtained smaller than the
strength of the singles fibers, for both materials, due to the group effect. The group effect can
occur mainly due to defects in leveling of the specimens during the tests or due to defects in
the fibers. These problems cause one of the fibers to break first instead of all at the same time,
creating the group effect. The ratio between the strength of the groups and the single fibers is
of 77% for steel specimens and 71% for glass specimens. These values are slightly lower than
expected.
The second experimental part of this dissertation consisted of characterization of the TRM
reinforcement system. The first results presented were of the direct tensile tests. In these tests
the effect of two different gripping systems were also investigated. The results showed that
TT1 specimens, in which the grips were applied on the dry fibers, the three expected phases
of the tensile response of TRMs were clearer. The TT1 system allows the TRM system to
work to its full extent until the fibers break, while the TT2 specimens allow the fibers to slip
from the mortar as demonstrated in the steel specimens. To avoid the slippage in the
specimens, grip would have to be stronger, but it could damage specimens before testing. The
TT2 specimens also showed a larger variation of the results. These facts make it possible to
conclude that the TT1 specimens is the best option for direct tensile tests on the TRM
reinforcement system.
For the pullout tests, it was concluded that the type 1 setup was the most viable option
because the results showed less variation, showing a less probability of damaging the
specimens before testing, and the casting and setup were easier. After this conclusion, further
tests were carried out to show the influence of the number of fibers and the presence of
transverse fibers in the results. The results showed that the presence of transverse fibers does
not influence the maximum loading, but it influences the post-peak result. A deeper
investigation on this topic is however necessary in future studies for better understand the
underlying mechanism.
The results for the monotonic loading on the single-lap tests showed that when glass fibers are
used, the fiber breaks before the TRM debonds from the substrate, while for the steel fibers
the debonding between the reinforcement and the substrate occurred first (at around 9.68 kN).
The cyclic tests showed a strength degradation when the fibers were subjected to cyclic
77
Conclusions and future work
loadings. This degradation was far superior in the glass specimens. The strength degradation
due to load repetition increased until the peak load. While the steel specimens debonded after
the peak load, the glass specimens partially failed and continued to bear load, but the strength
degradation between cycles decreased. Moreover, the cycle 2 results show that the loss of
strength increases with each repetition, but tends to stabilize, decreasing the rate of loss.
5.2. Future work
The following suggestions are given for future studies:
Regarding the material characterization tests, it would be relevant to carry out water
absorption tests for older and younger ages, to prove the conclusions obtained in the
tests performed in this dissertation for two ages;
Regarding the mechanical characterization tests of the mortar, namely the compressive
and flexural tests, it is important to carry out tests for ages superior to 90 days in order
to determinate whether the observed strength decrement is due to the natural scatter or
a property associated to the age of the specimens;
Regarding the compressive tests, it is important to perform tests on cylindrical
specimens, not only to compare and confirm the results in cubic specimens, but also to
obtain the elastic modulus of the mortar.
Regarding the direct tensile, the same tests should be carried out using different
measurement technics to better investigate the cracking behavior of the mortar,
especially in the glass specimens where the cracks were not easily seen. The use of
Digital Image Correlation (DIC) techniques is recommended.
Regarding the pull-out tests, more studies using different numbers of longitudinal
fibers and also, transverse fibers should be carried out to gain a better understanding of
the influence of these properties on the results.
Regarding the single-lap shear tests, performing static cyclic tests with more load
repetitions is recommended. For possible future cyclic tests, it is recommended that
for the unloading of the cycles to use load control instead of displacement control.
This will prevent the bending of the fibers when unloading and, therefore, helps in
obtaining better and more accurate results.
Finally, it would be important to perform cyclic loadings for tensile and pull-out tests,
to fully understand the behavior of the TRM reinforcement system when subjected to
these loading conditions.

78
Compatible strengthening of masonry Structures based on the TRM technique
79
Bibliography
BIBLIOGRAPHY
ALMEIDA, J.; PEREIRA, E.; BARROS, J. Assessment of overlay masonry strengthening
system under in-plane monotonic and cyclic loading using the diagonal tensile test
Construction and Building Materials, n. 94, p. 14, 2015.
ARBOLEDA, D. Fabric Reinforced Cementitious Matrix (FRCM) Composites for
Infrastructure Strengthening and Rehabilitation: Characterization Methods. 2014. 147 (Ph.D.,
Civil Engineering). University of Miami, Coral Gables, Florida.
ASCIONE, L.; DE FELICE, G.; DE SANTIS, S. A qualification method for externally
bonded Fibre Reinforced Cementitious Matrix (FRCM) strengthening systems. Composites,
v. Part B, n. 78, p. 10, 2015.
ASCIONE, L.; POGGI, C.; SAVOIA, M. Qualification of FRCMs. Compositi: 8 p. 2013.
ASTM International. Standard Test Method for Measurement of Rate of Absorption of Water
by Hydraulic - Cement Concretes. ASTM C 1585–04 2004.
ASTM International. Standard Test Method for Compressive Strength of Hydraulic Cement
Mortars (Using2-in. or [50-mm] Cube Specimens). C 109/C 109M–07 2007.
BABAEIDARABAD, S. Masonry Walls Strengthened with Fabric-Reinforced Cementitious
Matrix Composite Subjected to In-Plane and Out-of-Plane Load. 2013. 147 (Ph.D, Civil
Engineering). University of Miami, Coral Gables, Florida.
BAENA, M. et al. Bond behaviour between recycled aggregate concrete and glass fibre
reinforced polymer bars. Construction and Building Materials, n. 106, p. 12, 2016.
BANHOLZER, B. Bond of a strand in a cementitious matrix. Materials and Structures, n. 39,
p. 14, 2006.
80
Compatible strengthening of masonry Structures based on the TRM technique
BATIKHA, M.; ALKAM, F. The effect of mechanical properties of masonry on the behavior
of FRP-strengthened masonry-infilled RC frame under cyclic load. Composite Structures,
n.134, p. 9, 2015.
BHATTACHARYA, S.; NAYAK, S.; DUTTA, S. C. A critical review of retrofitting methods
for unreinforced masonry structures. International Journal of Disaster Risk Reduction, n.7,
p.17, 2014.
CARLONI, C. et al. Fiber Reinforced Composites with Cementitious (Inorganic) Matrix. In:
PELLEGRINO, C. and SENA-CRUZ, J. (Ed.). Design Procedures for the Use of Composites
in Strengthening of Reinforced Concrete Structures: Springer, v.19, 2016. cap. Chapter 9,
p.363-406. (RILEM State-of-the-Art Reports).
CARLONI, C. et al. Role of the Matrix Layers in the Stress-Transfer Mechanism of FRCM
Composites Bonded to a Concrete Substrate. Journal of Engineering Mechanics, v.141, n.6,
p.10, 2015.
CARLONI, C. et al. Experimental determination of FRP–concrete cohesive interface
properties under fatigue loading. Composite Structures, n.94, p.8, 2012.
CAROZZI, F. G.; MILANI, G.; POGGI, C. Mechanical properties and numerical modeling of
Fabric Reinforced Cementitious Matrix (FRCM) systems for strengthening of masonry
structures. Composite Structures, n.107, p.15, 2014.
CAROZZI, F. G.; POGGI, C. Mechanical properties and debonding strength of Fabric
Reinforced C ementitious Matrix (FRCM) systems for masonry strengthening. Composites,
v.B, n.70, p.15, 2015.
D'ANTINO, T. Bond Behavior in Fiber Reinforced Polymer Composites and Fiber
Reinforced Cementitious Matrix Composites. 2014. 148 (Ph.D., Civil Engineering). Civil
Engineering, Construction and environmental Department, University of Padua.
DE FELICE, G. et al. Mortar-based systems for externally bonded strengthening of masonry
Materials and Structures, n.47, p.16, 2014.
81
Bibliography
DE SANTIS, S.; DE FELICE, G. Steel reinforced grout systems for the strengthening of
masonry structures. Composite Structures, n.134, p.15, 2015.
D’ANTINO, T. et al. Matrix–fiber bond behavior in PBO FRCM composites: A fracture
mechanics approach. Engineering Fracture Mechanics, n.117, p.18, 2014.
D’ANTINO, T. et al. Fatigue and post-fatigue behavior of PBO FRCM-concrete joints.
International Journal of Fatigue, n.81, p.13, 2015.
D’ANTINO, T et al. Effect of the inherent eccentricity in single-lap direct-shear tests of PBO
FRCM-concrete joints. Composite Structures, n.142, p.13, 2016.
ELGAWADY, M.; LESTUZZI, P.; BADOUX, M. A Review of Conventional Seismic
Retrofitting Techniques for URM. 13th International Brick and Block Masonry Conference
Amsterdam: 10 p. 2004.
EN 1015-11, Methods of test for mortar for masonry. Determination of flexural and
compressive strength of hardened mortar. EN 1015-11 1999.
GHIASSI, B. et al. Multi-level characterization of steel reinforced mortars for strengthening
of masonry structures Materials and Design, n. 110, p. 10, 2016.
HENDRY, E. A. W. Masonry walls: materials and construction. Construction and Building
Materials, n. 15, p. 7, 2001.
JEWELL, R. B. et al. Interfacial Bond between Reinforcing Fibers and Calcium
Sulfoaluminate Cements: Fiber Pullout Characteristics ACI Materials Journal, p. 10, 2015.
LANAS, J. et al. Mechanical properties of natural hydraulic lime-based mortars. Cement and
Concrete Research, n. 34, p. 11, 2004.
LARRINAGA, P. et al. Experimental and numerical modeling of basalt textile reinforced
mortar behavior under uniaxial tensile stress Materials and Design, n. 55, p. 9, 2014.
82
Compatible strengthening of masonry Structures based on the TRM technique
LIN, Y. et al. Out-of-plane Testing of Unreinforced Masonry Walls Strengthened Using ECC
Shotcrete Structures, n. 7, p. 10, 2016.
LORENZ, E.; ORTLEPP, R. Bond Behavior of Textile Reinforcements - Development of a
Pull-Out Test and Modeling of the Respective Bond versus Slip Relation In: PARRA-
MONTESINOS , G. J.;REINHARDT , H. W., et al (Ed.). High Performance Fiber Reinforced
Cement Composites 6: Springer, v.6, 2012. p.6.
MARQUES, V. L. Reforço de alvenaria usando matrizes inorgânicas. 2014. 140 (Masters in
Civil Engineering). Engineering School, University of Minho.
MARTINS, A. P. Soluções de Reforço Sísmico de Paredes de Alvenaria de Enchimento.
2013. 173 (Masters in Civil Engineering). Engineering School, University of Minho.
MENDIS, W. S. W.; SILVA, S. D.; SILVA, S. D. Performance and Retrofitting of
Unreinforced Masonry Buildings against Natural Disasters – A Review Study Engineer, v.
XLVII, n. 03, p. 12, 2014.
NOOR-E-KHUDA, S.; DHANASEKAR, M.; THAMBIRATNAM, D. P. Out-of-plane
deformation and failure of masonry walls with various forms of reinforcement Composite
Structures, n. 140, p. 16, 2016.
PARISI, F. et al. In-plane behaviour of tuff masonry strengthened with inorganic matrix–grid
composites Composites, v. B, n. 45, p. 10, 2013.
PORTAL, N. W. et al. Pull-out of textile reinforcement in concrete. Construction and
Building Materials, n. 71, p. 9, 2014.
RAZAVIZADEH, A.; GHIASSI, B.; OLIVEIRA, D. V. Bond behavior of SRG-strengthened
masonry units: Testing and numerical modeling. Construction and Building Materials, n. 64,
p. 10, 2014.
83
Bibliography
RILEM and ASSOCOMPOSITI. Round-robin test on the bond performance of mortar-based
strengthening systems on masonry substrate. RILEM TC-250 CSM: 4 p. 2014a.
RILEM and ASSOCOMPOSITI. Round-robin test on the tensile behavior of mortar-based
strengthening systems. RILEM TC-250 CSM: 3 p. 2014b.
RILEM II-1, R. Saturation coefficient. RILEM 25-PEM: 2 p. 1980.
STIPO, G. Analisi del comportamento meccanico dei materiali compositi a matrice
cementizia nel rinforzo delle strutture murarie. 2013. 388 (Ph.D in Architecture Research).
DIDA - Department of Architecture, University of Florence
TETTA, Z. C.; KOUTAS, L. N.; BOURNAS, D. A. Textile-reinforced mortar (TRM) versus
fiber-reinforced polymers (FRP) in shear strengthening of concrete beams. Composites Part
B: Engineering, v. 77, p. 338-348, 2015.
TUYAN, M.; YAZICI, H. Pull-out behavior of single steel fiber from SIFCON matrix.
Construction and Building Materials, n. 35, p. 7, 2012.
VALLUZZI, M. R.; MODENA, C.; DE FELICE, G. Current practice and open issues in
strengthening historical buildings with composites. Materials and Structures, p. 15, 2014.
ZHANG, X. B.; ALJEWIFI, H.; LI, J. Failure behaviour investigation of continuous yarn
reinforced cementitious composites Construction and Building Materials, n. 47, p. 9, 2013.

84
Compatible strengthening of masonry Structures based on the TRM technique

85
Appendices
APPENDICES
Appendix I – Materials technical informaion
Figure A. 1 – Mortar technical data.

86
Compatible strengthening of masonry Structures based on the TRM technique
Figure A. 2 – Glass fibers technical data.
Figure A. 3 – Steel fibers technical data.
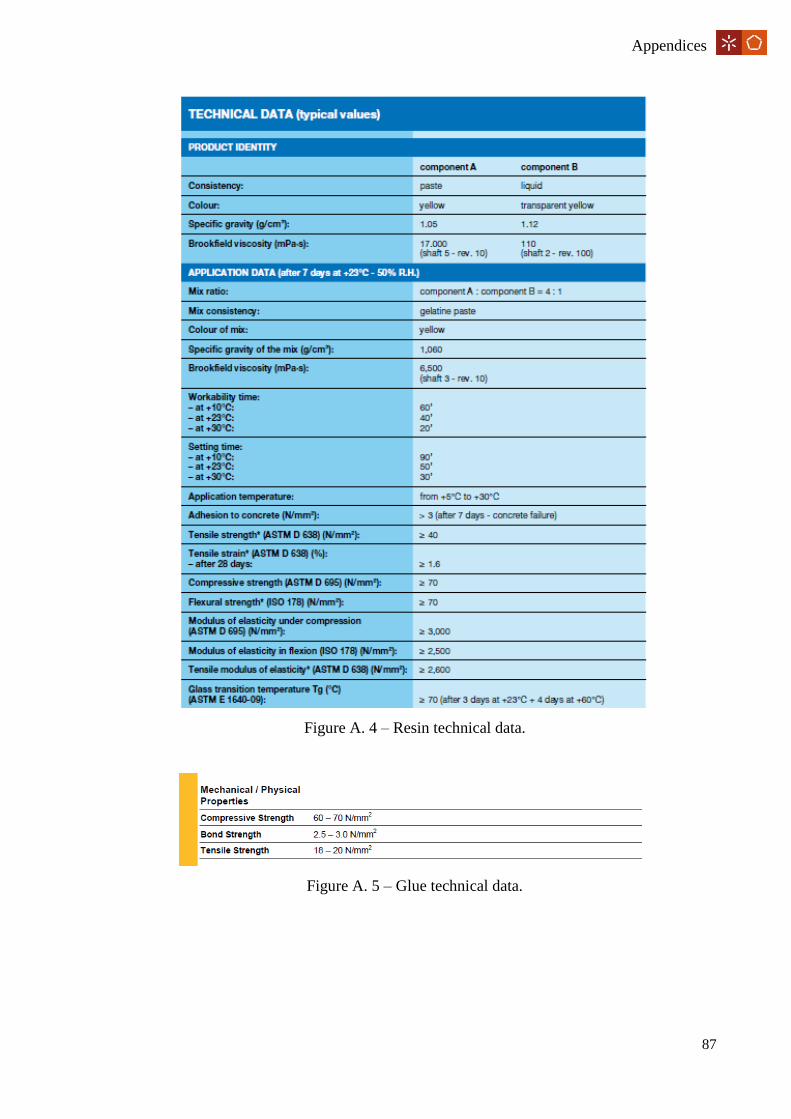
87
Appendices
Figure A. 4 – Resin technical data.
Figure A. 5 – Glue technical data.
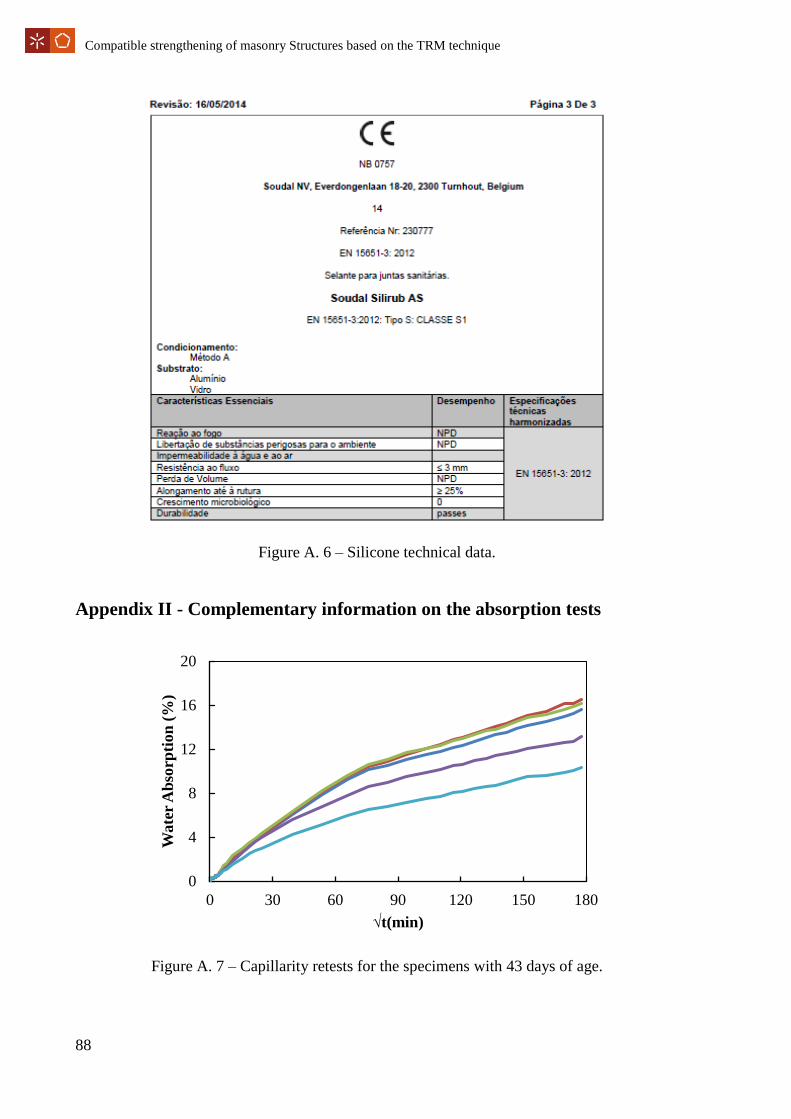
88
Compatible strengthening of masonry Structures based on the TRM technique
Figure A. 6 – Silicone technical data.
Appendix II - Complementary information on the absorption tests
Figure A. 7 – Capillarity retests for the specimens with 43 days of age.
0
4
8
12
16
20
0 30 60 90 120 150 180
Wate
r A
bso
rpti
on
(%
)
√t(min)
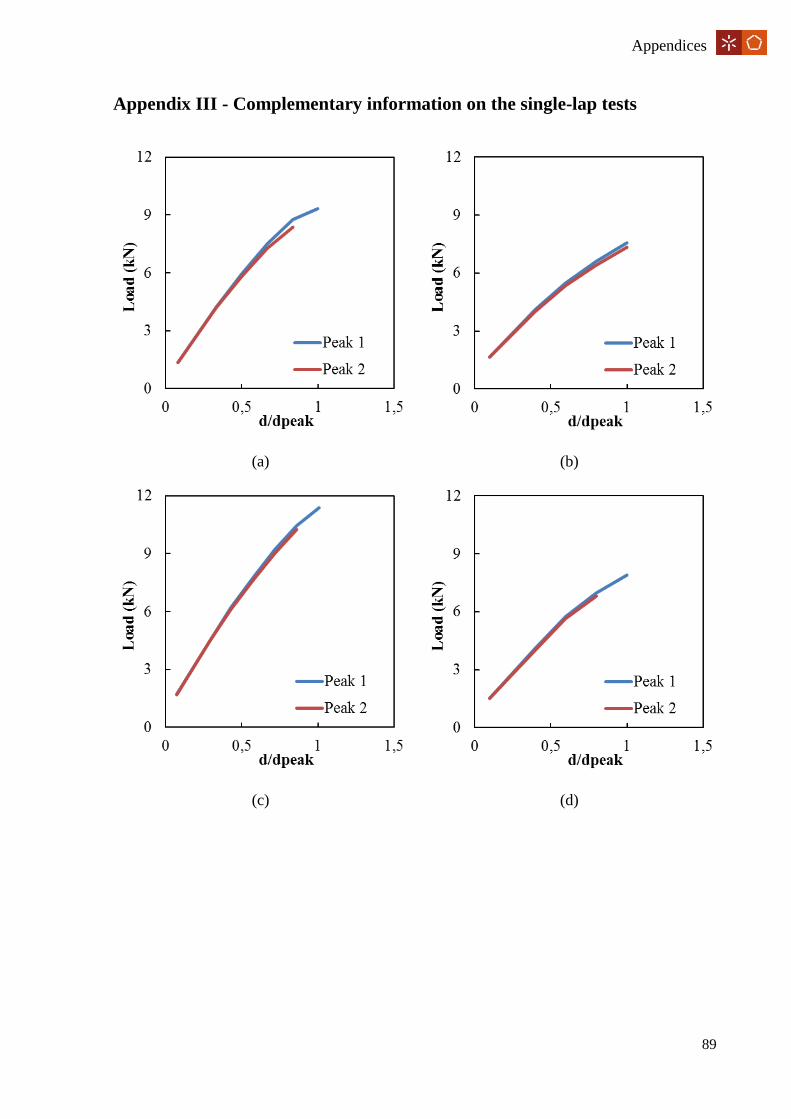
89
Appendices
Appendix III - Complementary information on the single-lap tests
(a) (b)
(c) (d)
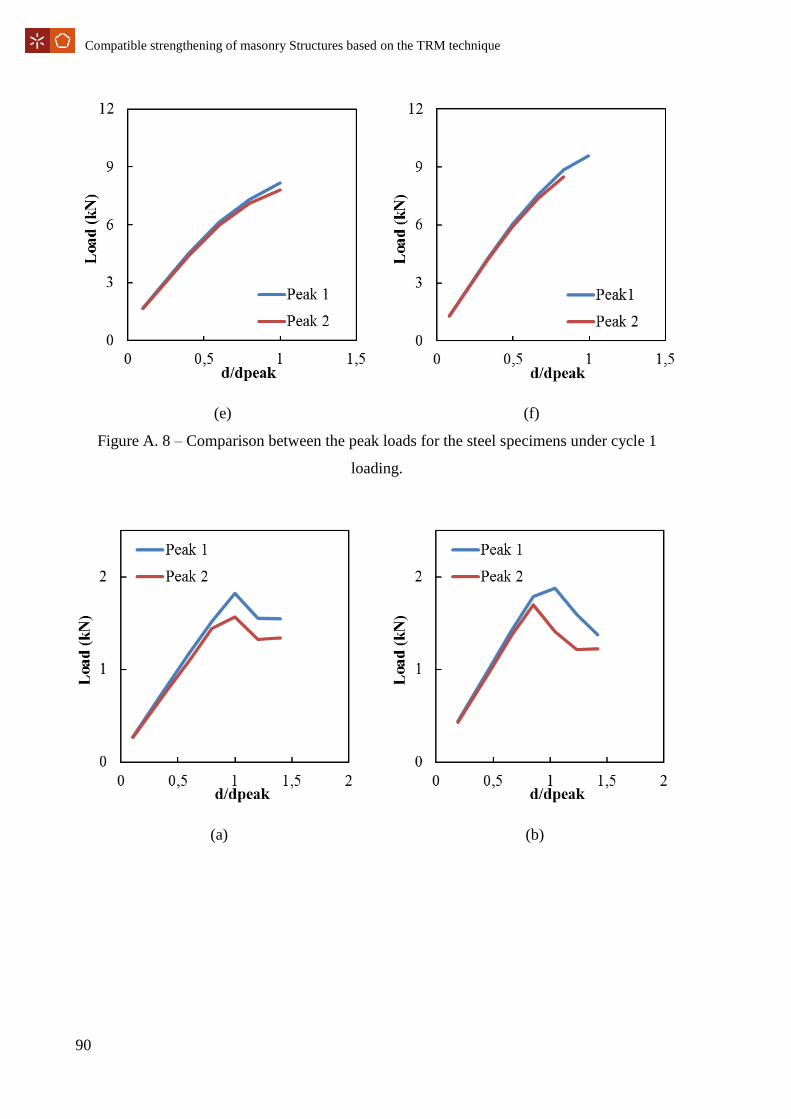
90
Compatible strengthening of masonry Structures based on the TRM technique
(e) (f)
Figure A. 8 – Comparison between the peak loads for the steel specimens under cycle 1
loading.
(a) (b)

91
Appendices
(c) (d)
(e) (f)
Figure A. 9 - Comparison between the peak loads for the glass specimens under cycle 1
loading.
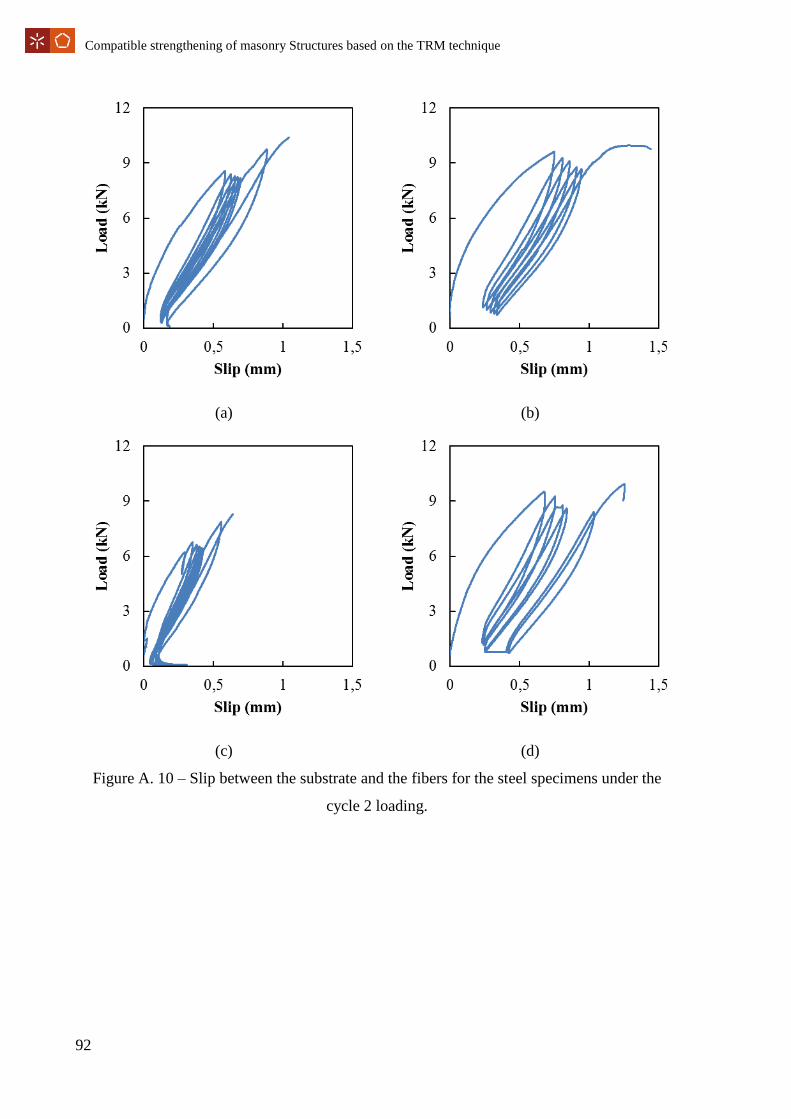
92
Compatible strengthening of masonry Structures based on the TRM technique
(a) (b)
(c) (d)
Figure A. 10 – Slip between the substrate and the fibers for the steel specimens under the
cycle 2 loading.

93
Appendices
(a) (b)
(c) (d)
Figure A. 11 - Slip between the substrate and the fibers for the glass specimens under the
cycle 2 loading.
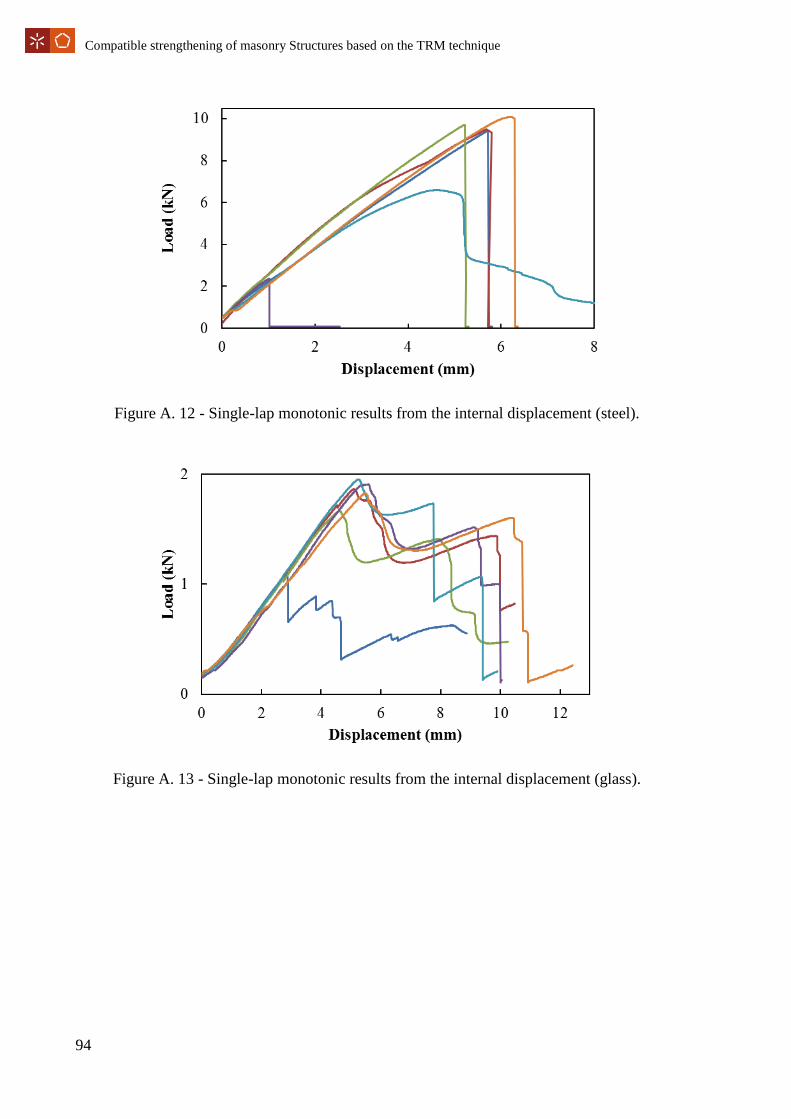
94
Compatible strengthening of masonry Structures based on the TRM technique
Figure A. 12 - Single-lap monotonic results from the internal displacement (steel).
Figure A. 13 - Single-lap monotonic results from the internal displacement (glass).

95
Appendices
Appendix IV - Complementary information on the direct tensile tests on
TRM
Figure A. 14 – Clip-gauge results from TT1 steel specimens.
Figure A. 15 – Clip-gauge results from TT2 steel specimens.


![Cardoso Dissertation[1]](https://static.fdocuments.us/doc/165x107/577d276c1a28ab4e1ea3e42b/cardoso-dissertation1.jpg)