AN X-RAY PHO TO ELEC TRON SPEC TROS COPY STUDY OF THE …
8
AN X-RAY PHOTOELECTRON SPECTROSCOPY STUDY OF THE PRODUCTS OF THE INTERACTION OF GASEOUS IrF 6 WITH FINE UO 2 F 2 by Vladimir N. PRUSAKOV 1 , Yury A. TETERIN 1 , Nikolai M. TROTSENKO 1 , Konstantin I. MASLAKOV 1 , Anton Yu. TETERIN 2 , Kirill E. IVANOV 1 , Filipp S. BOCHAGIN 1 , and Dmitry V. UTROBIN 1 Received on May 24, 2007; accepted on June 15, 2007 Nuclear fuel reprocessing by fluorination, a dry method of regeneration of spent nu- clear fuel, uses UO 2 F 2 for the separation of plutonium from gaseous mixtures. Since plutonium requires special treatment, IrF 6 was used as a thermodynamic model of PuF 6 . The model reaction of the interaction of gaseous IrF 6 with fine UO 2 F 2 in the sorption column revealed a change of color of the sorption column contents from pale-yellow to grey and black, indicating the formation of products of such an interac- tion. The X-ray photoelectron spectroscopy study showed that the interaction of gas- eous IrF 6 with fine UO 2 F 2 at 125 °C results in the formation of stable iridium com- pounds where the iridium oxidation state is close to Ir 3+ . The dependence of the elemental compositions of the layers in the sorption column on the penetration depth of IrF 6 was established. Key words: X-ray photoelectron spectroscopy, uranyl fluorite, iridium hexafluoride, technology of isolation of actinides from gas mixtures INTRODUCTION Nuclear fuel reprocessing by fluorination, a (dry) method of regeneration of spent nuclear fuel (SNF), uses uranyl fluorite (UO 2 F 2 ) for the separation of plutonium from gaseous mixtures [1]. The Gibbs energy (DG 0 298 ) of 74 kcal/mole for the suggested reactions of UO 2 F 2 with PuF 6 , unlike that of UO 2 F 2 with UF 6 (51 kcal/mole), in- dicates a possible PuF 6 selectivity from the mixture (PuF 6 , UF 6 , F 2 , N 2 , and volatile fluorides) [2]. It has to be noted that the F 2 concentration can reach up to 25 vol.%. Therefore, the optimal temperature regime for the PuF 6 extraction on UO 2 F 2 is, obviously, related to the F 2 - -UO 2 F 2 interaction (DG 0 298 = –59 kcal/mole [2]). Ex- periments with pure fluorine were performed in order to establish tem perature dependence on the UO 2 F 2 + 2F 2 « UF 6 + O 2 reaction rate. At 130 °C, the UO 2 F 2 fluorination was slow. Since plutonium requires special treatment, IrF 6 was used as a thermodynamic model of PuF 6 . This compound is as reactive and volatile as PuF 6 . Experi- ments on the interaction of PuF 6 with UO 2 F 2 have to be carried out and are scheduled for the nearest future. An X-ray photoelectron spectroscopy (XPS) study of the samples of the products of the interaction of gaseous IrF 6 and fine UO 2 F 2 was carried out in this work in order to study the possibility of the formation of stable compounds on the surface of uranyl fluoride granules, the distribution of these compounds along the sorption column and to determine iridium oxida- tion states. X-ray photoelectron spectroscopy is the most adequate method to solve these problems. It has been widely used to study compounds of various ele- ments, including actinides [3-6]. V. N. Prusakov, et al.: An X-Ray Photoelectron Spectroscopy Study of the Products of the Interaction ... 3 Scientific paper UDC: 543.428.3/.4:546.790 BIBLID: 1451-3994, 22 (2007), 1, pp. 3-10 DOI: 10.2298/NTRP0701003P Authors' addresses: 1 Russian Research Centre "Kurchatov Institute" 1, Kurchatov square, Moscow 123182, Russia 2 N. S. Kurnakov Institute of General and Inorganic Chemistry of RAS, GSP-1, 31, Leninsky Prospect, Moscow I-71, 119991, Russia E-mail address of corresponding author: [email protected] (V. N. Prusakov)
Transcript of AN X-RAY PHO TO ELEC TRON SPEC TROS COPY STUDY OF THE …

AN X-RAY PHO TO ELEC TRON SPEC TROS COPY STUDY OFTHE PROD UCTS OF THE IN TER AC TION OF
GAS EOUS IrF6 WITH FINE UO2F2
by
Vladi mir N. PRUSAKOV1, Yury A. TETERIN1, Nikolai M. TROTSENKO1,Konstantin I. MASLAKOV1, Anton Yu. TETERIN2, Kirill E. IVANOV1,
Filipp S. BOCHAGIN1, and Dmitry V. UTROBIN1
Re ceived on May 24, 2007; ac cepted on June 15, 2007
Nu clear fuel re pro cess ing by flu o ri na tion, a dry method of re gen er a tion of spent nu -clear fuel, uses UO2F2 for the sep a ra tion of plu to nium from gas eous mix tures. Sinceplu to nium re quires spe cial treat ment, IrF6 was used as a ther mo dy namic model ofPuF6. The model re ac tion of the in ter ac tion of gas eous IrF6 with fine UO2F2 in thesorp tion col umn re vealed a change of color of the sorp tion col umn con tents frompale-yel low to grey and black, in di cat ing the for ma tion of prod ucts of such an in ter ac -tion. The X-ray pho to elec tron spec tros copy study showed that the in ter ac tion of gas -eous IrF6 with fine UO2F2 at 125 °C re sults in the for ma tion of sta ble irid ium com -pounds where the irid ium ox i da tion state is close to Ir3+. The de pend ence of theel e men tal com po si tions of the lay ers in the sorp tion col umn on the pen e tra tion depthof IrF6 was es tab lished.
Key words: X-ray pho to elec tron spec tros copy, ura nyl flu o rite, irid ium hexafluoride,tech nol ogy of iso la tion of actinides from gas mix tures
IN TRO DUC TION
Nu clear fuel re pro cess ing by flu o ri na tion, a (dry)method of re gen er a tion of spent nu clear fuel (SNF), usesura nyl flu o rite (UO2F2) for the sep a ra tion of plu to niumfrom gas eous mix tures [1]. The Gibbs en ergy (DG0
298) of 74 kcal/mole for the sug gested re ac tions of UO2F2 withPuF6, un like that of UO2F2 with UF6 (51 kcal/mole), in -di cates a pos si ble PuF6 se lec tiv ity from the mix ture(PuF6, UF6, F2, N2, and vol a tile flu o rides) [2]. It has to be
noted that the F2 con cen tra tion can reach up to 25 vol.%.
There fore, the op ti mal tem per a ture re gime for the PuF6
ex trac tion on UO2F2 is, ob vi ously, re lated to the F2-
-UO2F2 in ter ac tion (DG0298 = –59 kcal/mole [2]). Ex -
per i ments with pure flu o rine were per formed in or der to
es tab lish tem per a ture de pend ence on the UO2F2 + 2F2 «
UF6 + O2 re ac tion rate. At 130 °C, the UO2F2 flu o ri na tion
was slow. Since plu to nium re quires spe cial treat ment,
IrF6 was used as a ther mo dy namic model of PuF6. This
com pound is as re ac tive and vol a tile as PuF6. Ex per i -
ments on the in ter ac tion of PuF6 with UO2F2 have to be
car ried out and are sched uled for the near est fu ture.An X-ray pho to elec tron spec tros copy (XPS)
study of the sam ples of the prod ucts of the in ter ac tion
of gas eous IrF6 and fine UO2F2 was car ried out in this
work in or der to study the pos si bil ity of the for ma tion
of sta ble com pounds on the sur face of ura nyl flu o ride
gran ules, the dis tri bu tion of these com pounds along
the sorp tion col umn and to de ter mine irid ium ox i da -
tion states. X-ray pho to elec tron spec tros copy is the
most ad e quate method to solve these prob lems. It has
been widely used to study com pounds of var i ous el e -
ments, in clud ing actinides [3-6].
V. N. Prusakov, et al.: An X-Ray Pho to elec tron Spec tros copy Study of the Prod ucts of the In ter ac tion ... 3
Sci en tific pa perUDC: 543.428.3/.4:546.790BIBLID: 1451-3994, 22 (2007), 1, pp. 3-10DOI: 10.2298/NTRP0701003P
Au thors' ad dresses:1 Rus sian Re search Cen tre "Kurchatov In sti tute"
1, Kurchatov square, Mos cow 123182, Rus sia2 N. S. Kurnakov In sti tute of General and In or ganic
Chem is try of RAS, GSP-1,31, Leninsky Pros pect, Mos cow I-71, 119991, Russia
E-mail ad dress of cor re spond ing au thor:[email protected] (V. N. Prusakov)

EX PER I MENT
Ura nyl flu o ride (UO2F2) was pre pared from thein ter ac tion of ura nium tri ox ide (UO3) with dry hy dro -gen flu o ride (HF) as reaction (1) (DH298
0 – stan dardenthalpy change of re ac tion):
UO 2HF UO F H O
H kcal mole3 2 2 2+ « +
= -D 2980 46 / (1)
in the tem per a ture range 100-150 °C. The di a gram ofthe de vice is shown in fig. 1.
The re ac tion pro ceeds at a sig nif i cant rate andwith prac ti cally 100% yield. The crys tal li za tion wa terwas re moved in vac uum at about 150 °C. The pho to -graph (fig. 2) shows UO2F2 af ter a long con tact withwa ter va pors (left) and af ter the re moval of wa ter
(right). The spe cific sur face of UO2F2 mea sured with“Sorbi” by Brunauer-Emmett-Teller was 2.08 m2/g ±±j0.07 m2/g. The po ros ity (e %) and mean con di tionalsize were mea sured by the pro gram “Surch” to be 39%and 0.940 mm, re spec tively.
Irid ium hexafluoride (IrF6) was syn the sizedfrom me tal lic irid ium by flu o ri na tion un der static con -di tions, ac cord ing to the re ac tion (2) (DH298
0 – stan -dard Gibbs en ergy of IrF6 for ma tion):
Ir F IrF G kcal/mole0+ « = -3 1102 6 298D (2)
IrF6 melt ing tem per a ture is 44.4 °C and boil ingtem per a ture is 53 °C. IrF6 sat u rated va por pres sure vs.tem per a ture is given in fig. 3. Solid IrF6 is pale-yel low, liq uid IrF6 turns brown-yel low.
Gas eous IrF6 was flown bot tom-up (from 5th to
1st layer, gen eral height 2 cm) through the fine (1 mm)
lay ers of UO2F2 gran ules in the ver ti cal col umn (28
cm high and 1.2 cm in ner di am e ter), at the rate of V =
= 2 cm/s at ~125 °C (see fig. 4).The in ter ac tion IrF6 with UO2F2 was sug gested
to be:
UO2F2 + 2IrF6 (gas) ® 2IrF4 + UF6 + O2 (3)
with the for ma tion of gas eous UF6 and O2 which vol a -til ized dur ing the ex per i ment. Af ter IrF6 went throughthe col umn, the col umn con tents were sep a rated byfive equal parts by height, so that five sam ples of IrF6 –UO2F2 in ter ac tion prod ucts were ob tained: TNM-1(grey pow der), TNM-2 (grey pow der with black in clu -sions), TNM-3 (grey pow der with many black in clu -sions), TNM-4 and TNM-5 (prac ti cally black pow -ders).
4 Nu clear Tech nol ogy & Ra di a tion Pro tec tion –1/2007
Fig ure 1. Di a gram of the de vice for the syn the sis of ura -nyl flu o ride1 – ar gon cyl in der; 2 – con tainer with hy dro gen flu o ride; 3 – fur nace with oil bath; 4 – tef lon (plat i num) cup with UO3; 5 – tef lon hood; 6 – cool ing trap; 7 – cool ing coal trap; 8 – pres -sure-and-vac uum gage; 9 – dif fer en tial ma nom e ter; 10 –buffer ca pac ity
Fig ure 2. The pho to graph of UO2F2 af ter a long con tactwith wa ter va pors (left) and af ter the re moval of wa ter(right)
Fig ure 3. Sat u rated va por pres sure of iridium hexafluoride[2]Be fore –1 °C – phase-crys tal II; from –0.2 to 44.4 °C –phase-crys tal I; above 44.4 °C – liq uid phase

XPS spec tra of the stud ied sam ples were mea -sured with elec tro static spec trom e ters MK II VG Sci -en tific, us ing non-monochromatized AlKa1,2 andMgKa ra di a tion un der 1.3×10⁻⁷ Pa at room tem per a -ture. The de vice res o lu tions mea sured as full width onthe half-max i mum (FWHM) of the Au4f7/2 line on thestan dard rect an gu lar golden plate was 1.2 eV. Elec tronbind ing en er gies Eb(eV) were mea sured rel a tively tothe bind ing en ergy of C1s elec trons from hy dro car -bons ab sorbed on the sam ple sur face, ac cepted to beequal to 285.0 eV. For the gold stan dard, cal i bra tionbind ing en er gies Eb(C1s) = 284.7 eV and Eb(Au4f7/2) = = 83.8 eV were used. The full widths at half max ima(FWHM) in the tab. 1 are given rel a tively to that of theC1s line of hy dro car bons, ac cepted to be equal to 1.3 eV for com par i son with the data of other stud ies.The un cer tainty in de ter mi na tion of elec tron bind ingen er gies were ±0.2 eV and that of the rel a tive line in -ten si ties was less than 10%.
The stud ied sam ples were pre pared as finely dis -persed pow ders pressed in in dium on ti ta nium sub strate(flat, thick lay ers with mir ror sur face). The pow derswere not ground to keep the sur face in tact. For all thesam ples, the va lence band (0-50 eV), U4f-5d, Ir4f, O1s, F1s, and C1s spec tra were mea sured. To avoid sam plecharg ing which can be re ally sig nif i cant (up to 12 eVand sta ble in time), the cal i bra tion was done for eachspec trum. It helped re duce the un cer tainty in the bind -ing en ergy de ter mi na tion down to 0.1 eV.
For all the sam ples, quan ti ta tive el e men tal andionic anal y sis was done. It was based on the fact thatthe spec tral in ten sity is pro por tional to the num ber ofcer tain at oms in the stud ied sam ple. The fol low ing ra -tio was used: ni/nj = (Si/Sj)(kj/ki), where ni/nj is the rel a -tive con cen tra tion of the stud ied at oms, Si/Sj – the rel a -tive core-shell spec tral in ten sity, and kj/ki – the rel a tiveex per i men tal sen si tiv ity co ef fi cient. The fol low ingco ef fi cients rel a tive to car bon were used in this work:1.00 (C1s), 2.64 (O1s), 4.00 (F1s), and 15.8 (Ir4f7/2)[6]. For ura nium, the co ef fi cients 26.51 (U4f7/2) and2.95 (U5d5/2) were ob tained tak ing into ac count theval ues for UO2F2, the o ret i cal photoemissioncross-sec tions [7], and ki netic bind ing en er gies.
RESULTS AND DISCUSSION
The XPS spec tra of the va lence and core elec -trons of UO2F2 (TNM-0) and five prod ucts ofUO2F2-IrF6 in ter ac tion (TNM-1, TNM-2. TNM-3,TNM-4, and TNM-5) were stud ied in the bind ing en -ergy range 0-1000 eV. Only peaks at trib uted to the in -cluded el e ments were ob served (fig. 5). This bind ing en -ergy range can be sub di vided into three subranges: outerva lence mo lec u lar orbitals (OVMO) range, 0-13 eV, in -ner va lence mo lec u lar orbitals (IVMO) range, 13-50 eV,and core elec tron range, 50-1000 eV [4]. Fine XPS struc -ture pa ram e ters were also used. Since these pa ram e terschar ac ter ize var i ous prop er ties of the com pounds, theyare used to gether with tra di tional pa ram e ters like elec -tron bind ing en er gies, chem i cal shifts and peak in ten si -ties [3, 4]. To sim plify the dis cus sion, both mo lec u lar and atomic terms are used in this work.
Low bind ing en ergy (0-50 eV) XPS. Va lenceelec tronic con fig u ra tions for the ba sic state of atomicU and Ir are: 92U6s26p65f36d7s2 5L6
0 and 77Ir5d76s2
4F4-1/2. One can see that ura nium and irid ium can ex -hibit dif fer ent ox i da tion states in com pounds. In deed,ura nium (UO2, UO2F2, etc.) and irid ium (K2IrCl6,K3IrCl6, etc.) com pounds of dif fer ent ox i da tion statesare known [3, 4].
V. N. Prusakov, et al.: An X-Ray Pho to elec tron Spec tros copy Study of the Prod ucts of the In ter ac tion ... 5
Fig ure 4. Sche matic di a gram of the sorp tion col umnfilled with fine UO2F2
Fig ure 5. Sur vey XPS from the TNM-5 sample

In the bind ing en ergy range 0-13 eV, the XPSfrom the stud ied sam ples (TNM-0 – TNM-5) ex hib its the struc ture at trib uted to the OVMO elec tronsformed from the U6p,5f,6d,7s, Ir5d,6s, O2s, and F2sva lence atomic shells (fig. 6). At the low bind ing en -ergy (Eb = 2.4 eV), an in tense Ir5d peak was ob servedas a shoul der. Its in ten sity is pro por tional to the irid -ium con cen tra tion on the sam ple sur face. This peak is ab sent in the XPS from UO2F2 (TNM-0). The Ir5drel a tive in ten sity mea sured as the ra tio of the in ten si -ties [I(Ir5d)/I(Ir4f7/2)] must be pro por tional to thenum ber of Ir5d elec trons not par tic i pat ing in thechem i cal bond and must char ac ter ize irid ium ox i da -tion state (va lency) in com pounds. How ever, this is atopic of a spe cial study and de vel op ment of a tech -nique for the de ter mi na tion of irid ium va lency incom pounds on the ba sis of Ir5d rel a tive in ten sity. Inthis work, the ra tio [I(Ir5d)/I(Ir4f7/2)] was mea suredto be 0.106 (con stant) for all the stud ied sam ples, asex pected. It in di cates that the irid ium ox i da tion statewas con stant. The cal cu lated [I(Ir5d)/I(Ir4f7/2)] was:0.144 for Ir2+, 0.125 for Ir3+, and 0.105 for Ir4+ [7].How ever, due to the high ex per i men tal un cer tainty,this ra tio can not unumbigously point out the irid iumox i da tion state (Ir3+ or Ir4+). Also, the Ir4f rel a tive in -ten si ties were mea sured [I(Ir4f)/I(Ir4f7/2)] to char ac -ter ize irid ium con tents in the sam ples (tab. 1). De -spite the high mea sure ment un cer tainty, these val uesagree qual i ta tively with those of irid ium con tents onthe ba sis of the [I(Ir5d)/I(Ir4f7/2)] ra tio (tab. 1).
The sec ond bind ing en ergy range (13-50 eV)ex hib its the struc ture at trib uted to the IVMO elec -trons re lated to the low bind ing en ergy filled U6pand O(F) shells. The pa ram e ters of this struc turecor re late with ura nium close en vi ron ment struc turepa ram e ters in UO2F2 (in ter atomic dis tance ura -nium-ligand in ax ial and equa to rial di rec tions) [4].The peaks at 14.9 and 20.1 eV (TNM-5) were at trib -uted not to the atomic U6p3/2 shells, but to the 16g7
–
and 9g9– IVMOs for the [(UO2)F6]10– (D6h) clus ter
[8] (see also tab. 1, fig. 6). The OVMO-core bind ingen ergy dif fer ences char ac ter ize the in ter atomic dis -tances, ura nium-ox y gen in the ax ial di rec tion andura nium-flu o rine in the equa to rial plane. For UO2F2
(TNM-0), these in ter atomic dis tances are: RU-O =0.174(2) nm and RU-F = 0.243(2) nm [4]. Also, itwas shown that the 16g7
– and 9g9– IVMO bind ing en -
ergy dif fer ences also cor re late with the in ter atomicdis tance in the ura nyl group UO2
2+ (see for ex am ple[4]). As a cer tain ap prox i ma tion, one can con siderthat, for ex am ple, the in crease in the 16g7
– and 9g9–
IVMO bind ing en ergy dif fer ences in di cates that thedis tance RU-O in the ura nyl group in UO2F2 de -creases.
The fol low ing em pir i cal ex pres sion based onO1s bind ing en ergy en ables us to eval u ate the in ter -atomic dis tance RU-O [9]:
RU-O = 2.27 (Eb - 519.4)–1 [nm] (4)
In deed, tak ing into ac count the O1s bind ing en -ergy 532.4 eV (tab. 1), one can eval u ate the ura -nium-ox y gen dis tance on the ba sis of expression (4) asRU-O = 0.175 nm, which agrees sat is fac to rily with thevalue 0.174(2) nm [4].
Core elec tron spec tra (50-1000 eV). The thirdbind ing en ergy range above 50 eV ex hib its the coreelec tron struc ture. Core elec trons par tic i pate weakly incore mo lec u lar orbitals (CMO) for ma tion. How ever,the struc ture re lated to the spin-or bit in ter ac tion (DEsl,eV), multiplet split ting (DEms, eV), many-body per tur -ba tion etc., can show up in this bind ing en ergy range[3-5]. These XPS struc ture pa ram e ters were taken intoac count.
El e men tal and ionic XPS quan ti ta tive anal y sisusu ally em ploys the most in tense peaks of the in cluded el e ments [3-6]. In this work, the fol low ing peaks werecho sen: U4f,5d, Ir4f, F1s, O1s, and C1s (tab. 1). TheU4f,5d and Ir4f peaks were ob served as spin-or bit split dou blets with DEsl = 10.8, 8.6, and 3.0 eV, re spec tively([3-5], figs. 7-9). The F1s, O1s, and C1s peaks wereob served sin gle and rel a tively sharp (figs. 10-12). TheIr4s,5s peaks at 95 eV and 691 eV, re spec tively, mustwiden as the num ber of the un cou pled elec trons on anirid ium ion grow (one ex tra un cou pled elec tron re sultsin an 1 eV FWHM in crease) due to multiplet split ting[4]. Un for tu nately, these peaks were not ob served inthis work be cause of the low in ten sity.
The O1s and F1s spec tra were al ways ob servedsin gle and sharp at Eb ~ 531.4 eV and 685.7 eV, re spec -tively (figs. 10 and 11). The C1s spec tra from all thestud ied sam ples, ex cept for TNM-4, were also ob served sin gle at Eb = 285.0 eV (fig. 12). The C1s spec trum from TNM-4 shows the CO3
2 -re lated peak at 288.2 eV. Thetab. 1 gives the cal i brated FWHMs.
Data com ing from other au thors were taken intoac count in the dis cus sion of the XPS from the stud ied
6 Nu clear Tech nol ogy & Ra di a tion Pro tec tion –1/2007
Fig ure 6. XPS of the va lence elec trons from the TNM-5sam ple

sam ples. Thus, for UO2, UF4, g-UO3 ,and UO2F2, theU4f7/2 bind ing en er gies are 380.9, 382.7, 382.4, and383.4 eV, re spec tively [4]. For Ir, IrCl3, K3IrCl6, and
K2IrCl6, the Ir4f7/2 bind ing en er gies are 60.3, 62.7,62.7, and 63.9 eV, re spec tively [3].
V. N. Prusakov, et al.: An X-Ray Pho to elec tron Spec tros copy Study of the Prod ucts of the In ter ac tion ... 7
Ta ble 1. Elec tron bind ing en er gies Eb (eV), peak full widths at half max ima (FWHM)(a) G (eV), rel a tive in ten si ties(b)
I(Ir5d)/I(U4f7/2), rel a tive con cen tra tions(c) C(Ir/U) and IVMO bind ing en ergy dif fer ences 16g7– – 9g9
– (DU6p3/2, eV)
Sample MO I(Ir5d/I(U4f7/2) C(Ir/U) DU6p3/2 U5f7/2 U5d5/2 Ir4f7/2 F1s O1s C1s
TNM-0(UO2F2)
5.9 (2.6)15.620.124.930.1
– – 4.5383.3(1.4)
99.2(1.4)
–685.3(1.1)
532.4(1.3)
285.0(1.3)
TNM-1
2.66.3 (2.1)
15.520.124.930.3
0.003 0.03 4.6383.8(1.3)
99.4(1.4)
62.4(1.3)
685.7(1.0)
532.6(1.3)
285.0(1.3)
TNM-2
2.66.0 (2.1)
15.320.025.030.2
0.006 0.10 4.7383.5(1.3)
99.2(1.2)
62.4(1.3)
685.7(0.8)
532.4(1.3)
285.0(1.3)
TNM-3
2.66.2 (2.2)
15.920.524.430.3
0.005 0.07 4.6383.6(1.4)
99.2(2.0)
62.4(1.2)
685.9(0.9)
532.4(1.3)
285.0(1.3)
TNM-4
2.66.2 (3.1)
16.220.224.830.2
0.014 0.23 4.0383.3(1.5)
98.9(1.7)
62.8(1.4)
685.7(1.6)
532.2(1.7)
285.0(1.3)288.2
TNM-5
2.45.7 (2.3)
15.920.124.229.7
0.007 0.11 4.2383.1(1.3)
98.8(1.3)
62.7(1.3)
685.1(0.9)
532.1(1.3)
285.0(1.3)
Ir [3, 5] 60.3
IrCl3 [3] 62.7
K3IrCl6 [3] 62.7
K2IrCl6 [3] 63.9
(a) FWHM are given in pa ren the ses; (b) rel a tive in ten si ties are given as the Ir5d/U4f7/2 in ten sity ra tios; (c) for com par i son, the atomic con cen tra tions Ir/U are given
Fig ure 7. The U4f XPS from the TNM-5 sample Fig ure 8. The U5d XPS from the TNM-5 sample

Sam ple UO2F2 (TNM-0). In UO2F2 (TNM-0)ura nium ion pres ents as U6+. In deed, the OVMO XPSdoes not ex hibit the U5f peak at zero bind ing en ergy.The U4f spec trum shows a dou blet of the two sharp
peaks (tab. 1), with out the shake up sat el lites. It can beex plained by the vi o lated long-range or der and the fact that the sat el lites at 3.5 eV on the higher bind ing en -ergy side are low in tense due to the re stricted spec -trom e ter res o lu tion. The 16g7
–-9g9– OVMO spec trum
ex hib its the two 4.5 eV dis tant peaks. A small amountof the sat u rated hy dro car bons was ob served on thesur face of the ini tial sam ple (tab. 1). It has to be notedthat pa ram e ters of all mea sured in this work XPS co in -cide with the data for UO2F2 [4].
Sam ple TNM-5. The XPS sur vey from theTNM-5 sam ple, be side the UO2F2 re lated peaks, ex -hib its irid ium peaks (fig. 5). The Ir5d peak was ob -served at Eb = 2.4 eV, the low in tense Ir5p3/2 peak – atEb » 50 eV and the Ir4f7/2 one – at 62.7 eV (figs. 6 and9). Spin-or bit split ting was DEsl(Ir4f) = 3.0 eV. Sincethe spin-or bit split ting is DEsl(Ir5p) »15 eV, the sec ondcom po nent – the Ir5p1/2 peak – overlapses with theIr4f peak (fig. 9). Go ing from UO2F2 (TNM-0) to theTNM-5, one can see a sig nif i cant nar row ing of thepeak in the F1s and F2s bind ing en ergy range (5g8
–
-15g7– IVMO), as well as the de crease of the 16g7
– and9g9
– IVMO bind ing en ergy dif fer ence (tab. 1, figs. 6and 10). This can be ex plained by the rise of the chem i -cal equiv a lence of flu o rine ions and the de crease of the U-O in ter atomic dis tance in the ura nyl group on thesur face. The XPS of other elec tronic shells did notchange sig nif i cantly (figs. 7, 8, and 11).
Sam ple TNM-4. Ir con cen tra tion in this sam ple is the high est. In deed, the Ir5d in ten sity for this sam ple is about twice as high and the 16g7
– - 9g9– IVMO bind ing
en ergy dif fer ence is no tice ably less than those in thespec tra from the TNM-5 sam ple (tab. 1). Un like theTNM-5, the TNM-4 sam ple con tains more ox y gen,flu o rine, irid ium, and car bon on the sur face (see the el -e men tal com po si tion).
Sam ples TNM-3, TNM-2, and TNM-1. Go ingfrom TNM-3 to TNM-2 and TNM-1, one can ob servethe in crease of ox y gen and flu o rine con cen tra tion anda de crease of irid ium con cen tra tion (see the el e men tal
8 Nu clear Tech nol ogy & Ra di a tion Pro tec tion –1/2007
Fig ure 9. The Ir4f XPS from the TNM-5 sample
Fig ure 10. The F1s XPS from the TNM-5 sample
Fig ure 11. The O1s XPS from the TNM-5 sample
Fig ure 12. The C1s XPS from the TNM-5 sam ple. Thesolid line is a re sult of a 5-point smooth ing of ex per i men -tal data ap plied 200 times
com po si tion). The Ir4f spec tra from the TNM-2 andTNM-3 sam ples at the lower bind ing en ergy ex hibit an ex tra com plex struc ture, pos si bly due to the over lap -ping with the irid ium-re lated dou blets. Since the sim i -lar ex tra struc ture was ob served in the XPS from ura -nium and other el e ments, it was at trib uted to thehet er o ge neous charg ing of the sam ples. Since thesesam ples con tained some black in clu sions (con glom er -ates), one can sug gest that they are re spon si ble fot thisef fect. Tak ing into ac count that the irid ium XPS fromthe TNM-1 sam ple ex hib its a nor mal struc ture, we didnot make any spe cial con clu sions on the ba sis of thepresense of irid ium in other ox i da tion states in theTNM-2 and TNM-3 sam ples.
Quan ti ta tive anal y sis re sults. The un cer tainty in peak in ten si ties dur ing the XPS quan ti ta tive el e men talanalisys of the stud ied sam ples was in creased due tothe multiplet split ting, many-body per tur ba tion andthe dy namic ef fect re lated ex tra struc ture. While themany-body per tur ba tion ef fect re sults in the shake upsat el lites on the higher bind ing en ergy side from theba sic peaks, the in ten sity of such sat el lites can be par -tially taken into ac count. The dy namic ef fect can notbe taken into ac count, but its in flu ence is neg li gi ble.All these ef fects can in crease the un cer tainty of theXPS quan ti ta tive anal y sis up to more than 10%. In thisap prox i ma tion, the quan ti ta tive XPS el e men tal andionic anal y sis of the sur face (~5 nm) of the stud iedsam ples rel a tive to one ura nium atom yielded the fol -low ing:
U1.00O1.97F2.33C0.41 (TNM-0)
U1.00O2.09F2.17Ir0.03C0.69 (TNM-1)
U1.00O1.85F2.11Ir0.10C0.28 (TNM-2)
U1.00O1.61F1.90Ir0.07C0.37 (TNM-3)
U1.00O2.90F2.53Ir0.23C0.91+0.14 (TNM-4)
U1.00O2.14F1.95Ir0.11C0.63 (TNM-5)
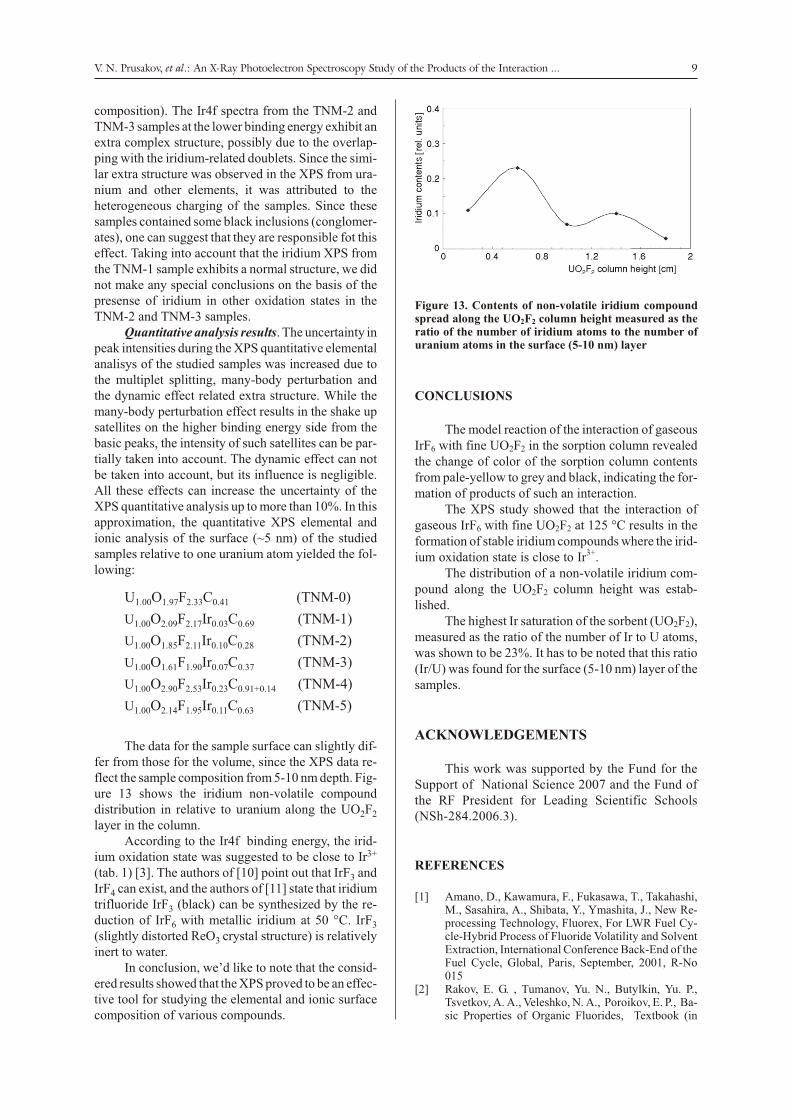
The data for the sam ple sur face can slightly dif -fer from those for the vol ume, since the XPS data re -flect the sam ple com po si tion from 5-10 nm depth. Fig -ure 13 shows the irid ium non-vol a tile com pounddis tri bu tion in rel a tive to ura nium along the UO2F2
layer in the col umn.Ac cord ing to the Ir4f bind ing en ergy, the irid -
ium ox i da tion state was sug gested to be close to Ir3+
(tab. 1) [3]. The au thors of [10] point out that IrF3 andIrF4 can ex ist, and the au thors of [11] state that irid iumtri fluor ide IrF3 (black) can be syn the sized by the re -duc tion of IrF6 with me tal lic irid ium at 50 °C. IrF3
(slightly dis torted ReO3 crys tal struc ture) is rel a tivelyin ert to wa ter.
In con clu sion, we’d like to note that the con sid -ered re sults showed that the XPS proved to be an ef fec -tive tool for study ing the el e men tal and ionic sur facecom po si tion of var i ous com pounds.
CONCLUSIONS
The model re ac tion of the in ter ac tion of gas eousIrF6 with fine UO2F2 in the sorp tion col umn re vealedthe change of color of the sorp tion col umn con tentsfrom pale-yel low to grey and black, in di cat ing the for -ma tion of prod ucts of such an in ter ac tion.
The XPS study showed that the in ter ac tion ofgas eous IrF6 with fine UO2F2 at 125 °C re sults in thefor ma tion of sta ble irid ium com pounds where the irid -ium ox i da tion state is close to Ir3+.
The dis tri bu tion of a non-vol a tile irid ium com -pound along the UO2F2 col umn height was es tab -lished.
The high est Ir sat u ra tion of the sorbent (UO2F2),mea sured as the ra tio of the num ber of Ir to U at oms,was shown to be 23%. It has to be noted that this ra tio(Ir/U) was found for the sur face (5-10 nm) layer of thesam ples.
ACKNOWLEDGEMENTS
This work was sup ported by the Fund for theSup port of Na tional Sci ence 2007 and the Fund ofthe RF Pres i dent for Lead ing Sci en tific Schools(NSh-284.2006.3).
REFERENCES
[1] Amano, D., Kawamura, F., Fukasawa, T., Takahashi,M., Sasahira, A., Shibata, Y., Ymashita, J., New Re -pro cess ing Tech nol ogy, Fluorex, For LWR Fuel Cy -cle-Hy brid Pro cess of Flu o ride Vol a til ity and Sol ventEx trac tion, In ter na tional Con fer ence Back-End of the Fuel Cy cle, Global, Paris, Sep tem ber, 2001, R-No015
[2] Rakov, E. G. , Tumanov, Yu. N., Butylkin, Yu. P.,Tsvetkov, A. A., Veleshko, N. A., Poroikov, E. P., Ba -sic Prop er ties of Or ganic Flu o rides, Text book (in
V. N. Prusakov, et al.: An X-Ray Pho to elec tron Spec tros copy Study of the Prod ucts of the In ter ac tion ... 9
Fig ure 13. Con tents of non-volatile irid ium com poundspread along the UO2F2 col umn height mea sured as thera tio of the num ber of irid ium at oms to the num ber ofura nium at oms in the sur face (5-10 nm) layer

Rus sian), (Ed. by N. P. Galkin), Atomizdat, Mos cow,1975
[3] Nefedov, V. I., X-Ray Pho to elec tron Spec tros copy ofChem i cal Com pounds (in Rus sian), Khimiya, Mos cow, 1984
[4] Teterin, Yu. A., Teterin, A. Yu., The Struc ture of X-Ray Pho to elec tron Spec tra of Light Ac ti nide Com pounds,Rus sian Chem i cal Re views, 73 (2004), 6, pp. 541-580
[5] Fuggle, J. C., Martensson, N., Core-Lev els Bind ingEn er gies in Met als, J. Electr. Spectr. Relat. Phenom.,21 (1980), pp. 275-281
[6] ***, Prac ti cal Sur face Anal y sis by Au ger and X-RayPho to elec tron Spec tros copy (Eds. D. Briggs, M. P.Seah), John Wiley & Sons Ltd., New York, 1983
[7] Band, I. M., Kharitonov, Yu. I., Trzhaskovskaya, M.B., Photoionization Cross Sec tion and Pho to elec tronAn gu lar Dis tri bu tions for X-Ray Line En er gies in the
Range 0.132-4.509 keV, Tar gets: 1£ Z £ 100, AtomicData and Nu clear Data Ta bles, 23 (1979), pp.443-705.
[8] Utkin, I. O., Teterin, Yu. A., Terehov, V. D., Ryzhkov,M. V., Teterin, A. Yu., Vukchevich, L., X-Ray Spec -tral Stud ies of the Elec tronic Struc ture of Ura nyl Flu -o rite UO2F2, Nu clear Tech nol ogy & Ra di a tion Pro tec -tion, 19 (2002), 2, pp.15-23
[9] Sosulnikov, M. I., Teterin, Yu. A., XPS Study of Cal -cium, Strontium, Bar ium and Their Ox ides (in Rus -sian), DAN SSSR, 317 (1991), 2, pp. 418-421
[10] Wells, A., Struc tural In or ganic Chem is try (in Rus -sian) (Ed. M. A. Poray-Koshts), Mir, Mos cow, 1987
[11] Cot ton, F., Wilkinson, G., Ad vanced In or ganic Chem -is try (in Rus sian) (Ed. M. E. Dyatkina), Mir, Mos cow, 1969
10 Nu clear Tech nol ogy & Ra di a tion Pro tec tion –1/2007
Vladimir N. PRUSAKOV, Jurij A. TETERIN, Nikolaj M. TROCENKO,Konstantin I. MASLAKOV, Anton. J. TETERIN, Kiril E. IVANOV,
Filip S. BO^AGIN, Dmitrij V. UTROBIN
ISTRA@IVAWE RENDGEN-INDUKOVANOMFOTOELEKTRONSKOM SPEKTROSKOPIJOM PROIZVODA
INTERAKCIJE GASOVITOG IrF6 SA ^ISTIM UO2F2
Pri reprocesirawu nuklearnog goriva fluorizacijom, suvim metodom regeneracijeislu`enog nuklearnog goriva, za separaciju plutonijuma iz gasovite sme{e upotrebqava seuranilfluorit (UO2F2). Po{to plutonijum zahteva poseban postupak, kao termodinami~ki modelplutonijumheksafluorida (PuF6) koristi se iridijumheksafluorid (IrF6). Modelovanainterakcija gasovitog IrF6 sa ~istim UO2F2 u sorpcionoj koloni ukazala je na promenu boje sadr`ajasorpcione kolone od `ute do sive i crne, nazna~uju}i nastajawe proizvoda takve interakcije.Istra`ivawe rendgen-indukovanom fotoelektronskom spektroskopijom pokazuje da interakcijagasovitog IrF6 sa ~istim UO2F2 na 125 °C dovodi do nastajawa stabilnih iridijumskih jediwewa ukojima je stawe iridijumske oksidacije blisko Ir3+. Ustanovqena je zavisnost elementarnog sastavaslojeva u sorpcionoj koloni od debqine prodirawa IrF6.
Kqu~ne re~i: rendgen-indukovana fotoelektronska spektroskopija, uranilfluorit, jjjjjjjjjjjjjjjjjjjjjjjjiridijumheksafluorid, tehnologija izdvajawa aktinida iz gasne sme{e