An update on Viable Vision Discovery & Learning update on Viable Vision Discovery & Learning...
66
An update on Viable Vision Discovery & Learning Presented by Bimlendra Jha Program Managers: Henning du Preez Avneesh Gupta 5 th November 2007
Transcript of An update on Viable Vision Discovery & Learning update on Viable Vision Discovery & Learning...
An update on Viable VisionDiscovery & Learning
Presented by
Bimlendra Jha
Program Managers:Henning du Preez Avneesh Gupta
5th November 2007

Welcome to the
World of Steel
Welcome to the
World of Steel
Where the journey is the destination
Where the journey is the destination
TOCICO Annual Conference Nov 2007
Viable Vision @ Tata Steel
About Tata Group – People Before Profits
-Developing Improvement Philosophy at Tata steel
-VV Template for Tata Steel – What’s different?-Learning
About Tata Steel

TOCICO Annual Conference Nov 2007
Tata Group
TOCICO Annual Conference Nov 2007
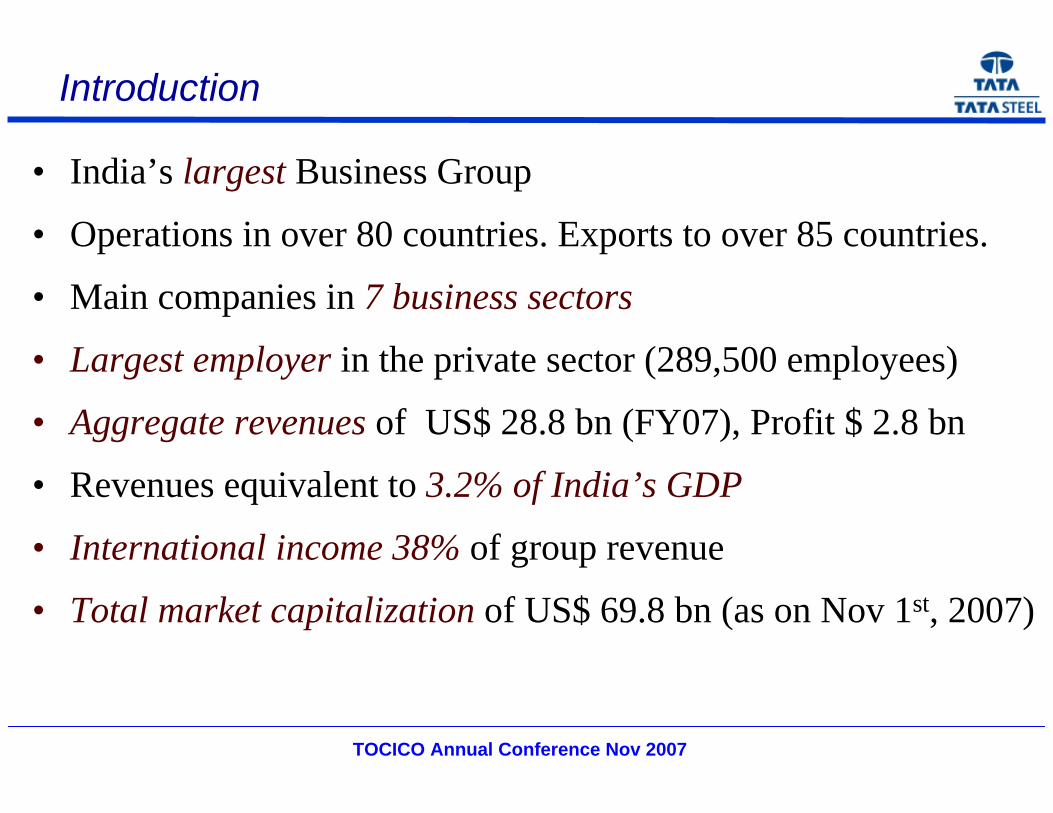
• India’s largest Business Group
• Operations in over 80 countries. Exports to over 85 countries.
• Main companies in 7 business sectors
• Largest employer in the private sector (289,500 employees)
• Aggregate revenues of US$ 28.8 bn (FY07), Profit $ 2.8 bn
• Revenues equivalent to 3.2% of India’s GDP
• International income 38% of group revenue
• Total market capitalization of US$ 69.8 bn (as on Nov 1st, 2007)
Introduction
TOCICO Annual Conference Nov 2007
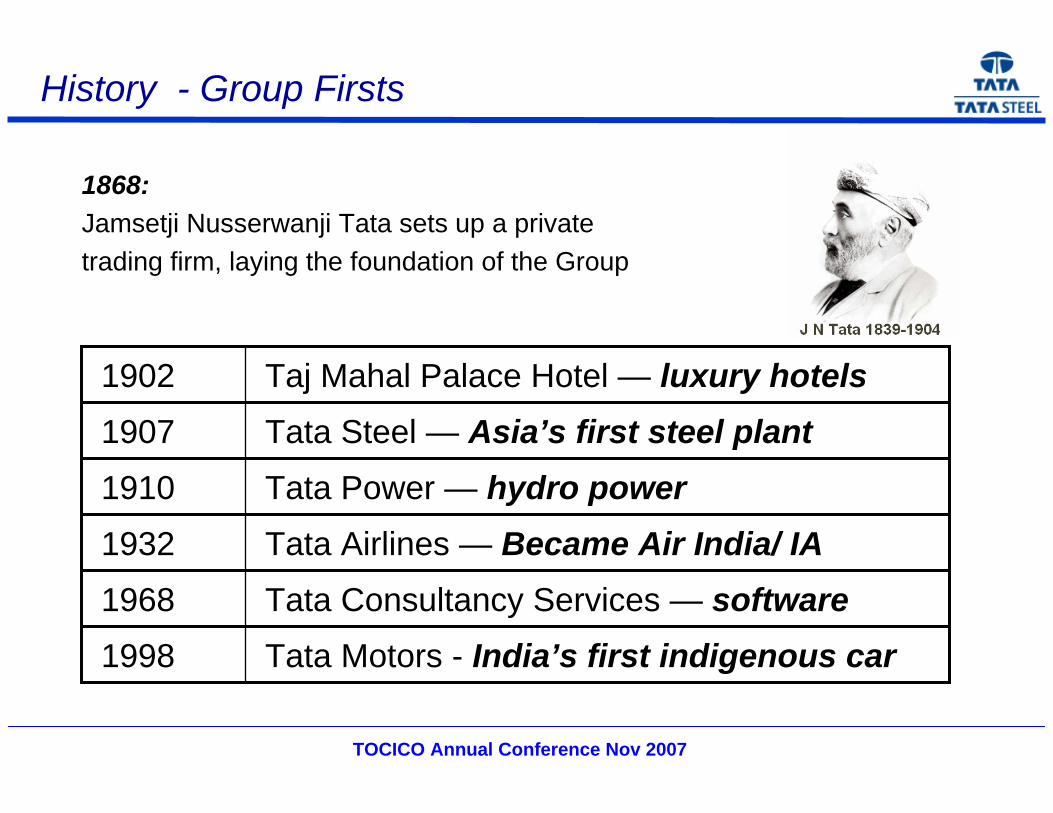
History - Group Firsts
Tata Motors - India’s first indigenous car1998
Tata Consultancy Services — software1968
Tata Airlines — Became Air India/ IA1932
Tata Power — hydro power1910
Tata Steel — Asia’s first steel plant1907
Taj Mahal Palace Hotel — luxury hotels1902
1868: Jamsetji Nusserwanji Tata sets up a private trading firm, laying the foundation of the Group

TOCICO Annual Conference Nov 2007
Steel
HotelsInsurance & Asset ManagementInternational Trade
BeveragesWatchesRetailing
AutomobilesAuto ComponentsAir-Conditioning
Basic ChemicalsFertiliserPesticides
Power
Services (9%)
Materials (23%) Energy(7%)
Chemicals (4%)
Engineering(32%)Consumer
Products (5%)
SoftwareTelecom ServicesAutomation & Control Systems
Information System and Communications (20%)
Group Today - 7 Business Sectors
96 Operating companies ; 246,000 employees
NOTE: The numbers within the brackets indicate % contribution to total group revenues (2005 –’06)

TOCICO Annual Conference Nov 2007
Group Corporate Centre Provides Strategic Direction
Finance/HR/M&As/Brand/Legal and Assurance/TQMS
Group Structure
Shareholding in main operating companies
66% Public Trusts
3% Family
13% Tata Companies
18% External Shareholder
29% Tata Sons
19% Jardine Matheson Group
52% Other Tata Companies
Promotes Group entry into new businesses
PROMOTER COMPANIES OwnershipActivity
Tata Sons
Tata Industries
Group Structure
TOCICO Annual Conference Nov 2007
The TATA Group – Purpose
Our purpose in Tata is to improve quality of life of the communities we serve
through Leadership in sectors of national economic significance.
TOCICO Annual Conference Nov 2007
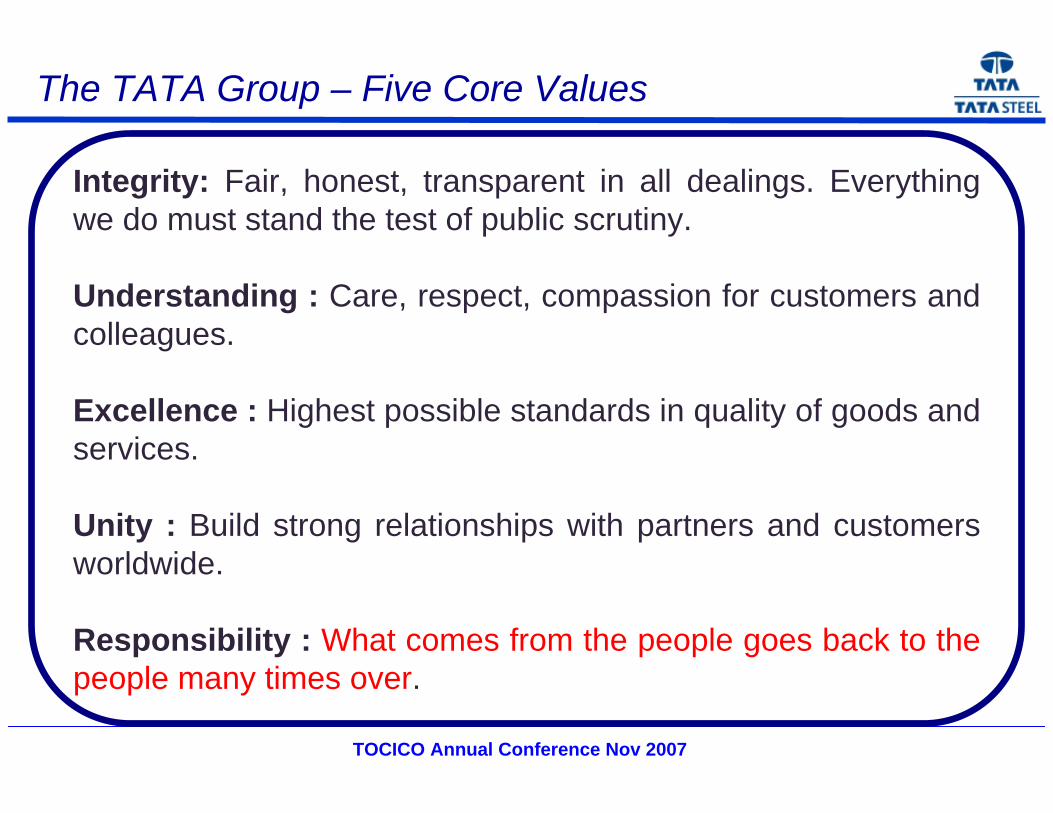
The TATA Group – Five Core Values
Integrity: Fair, honest, transparent in all dealings. Everything we do must stand the test of public scrutiny.
Understanding : Care, respect, compassion for customers and colleagues.
Excellence : Highest possible standards in quality of goods and services.
Unity : Build strong relationships with partners and customers worldwide.
Responsibility : What comes from the people goes back to the people many times over.

TOCICO Annual Conference Nov 2007
National Institutions built by Tata
. Indian Institute of Science.
. Tata Institute of Social Sciences
. Tata Memorial Hospital for Cancer Research
. Tata Institute of Fundamental Research
. National Centre for the Performing Arts.

TOCICO Annual Conference Nov 2007
Viable Vision @ Tata Steel
About Tata Group – People Before Profits
-Developing Improvement Philosophy at Tata steel
-VV Template for Tata Steel – What’s different?-Learning
About Tata Steel
TOCICO Annual Conference Nov 2007
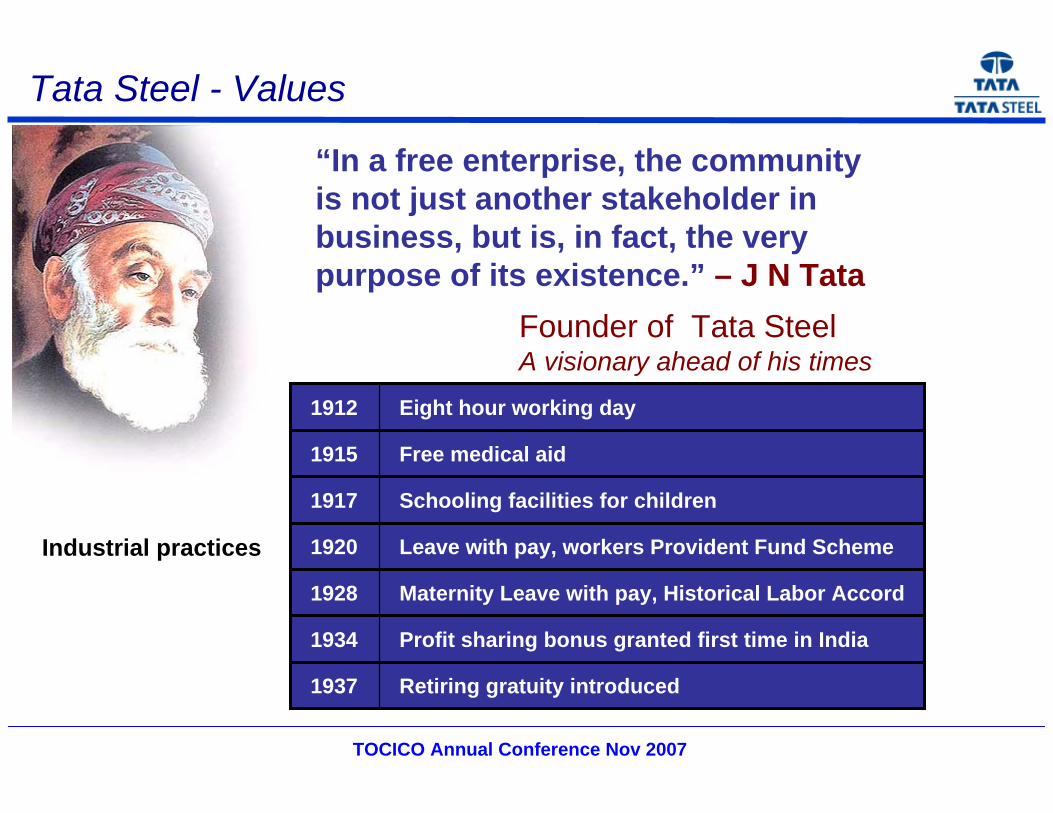
Tata Steel - Values
“In a free enterprise, the communityis not just another stakeholder in business, but is, in fact, the verypurpose of its existence.” – J N Tata
Profit sharing bonus granted first time in India1934
Maternity Leave with pay, Historical Labor Accord1928
Retiring gratuity introduced1937
Leave with pay, workers Provident Fund Scheme1920
Schooling facilities for children1917
Free medical aid1915
Eight hour working day1912
Industrial practices
Founder of Tata SteelA visionary ahead of his times
TOCICO Annual Conference Nov 2007
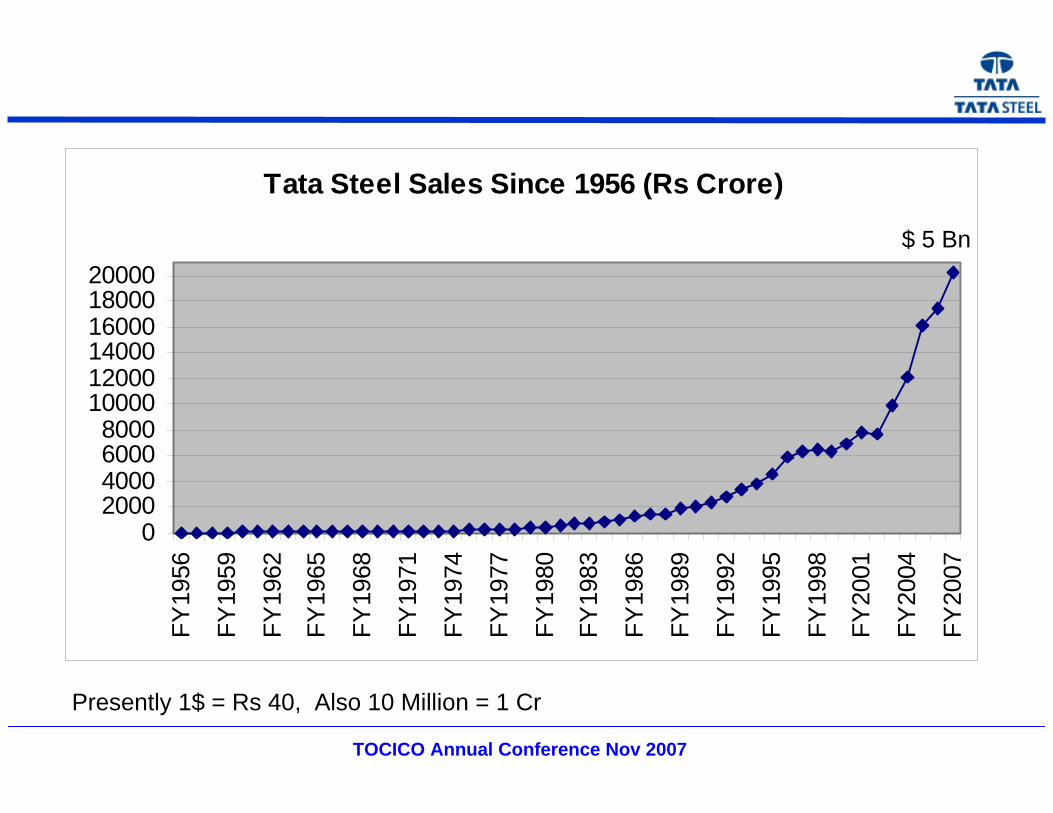
Tata Steel Sales Since 1956 (Rs Crore)
02000400060008000
100001200014000160001800020000
FY19
56
FY19
59
FY19
62
FY19
65
FY19
68
FY19
71
FY19
74
FY19
77
FY19
80
FY19
83
FY19
86
FY19
89
FY19
92
FY19
95
FY19
98
FY20
01
FY20
04
FY20
07
Presently 1$ = Rs 40, Also 10 Million = 1 Cr
$ 5 Bn

TOCICO Annual Conference Nov 2007
Tata Steel PBT Since 1956 (Rs Crore)
01000200030004000500060007000
FY19
56
FY19
59
FY19
62
FY19
65
FY19
68
FY19
71
FY19
74
FY19
77
FY19
80
FY19
83
FY19
86
FY19
89
FY19
92
FY19
95
FY19
98
FY20
01
FY20
04
FY20
07
Presently 1$ = Rs 40, Also 10 Million = 1 Cr
$ 1.565 Bn

TOCICO Annual Conference Nov 2007
Tata Steel PBT/ Sales Since 1956 (%)
0%5%
10%15%20%25%30%35%40%
FY19
56
FY19
59
FY19
62
FY19
65
FY19
68
FY19
71
FY19
74
FY19
77
FY19
80
FY19
83
FY19
86
FY19
89
FY19
92
FY19
95
FY19
98
FY20
01
FY20
04
FY20
07

TOCICO Annual Conference Nov 2007
You are taking the responsibility at a historic moment.
Tata Steel is going to turn 100 years during your tenure.
Internal Communication Document 2002
TOCICO Annual Conference Nov 2007
Internal Communication Document 2002
• Tata Steel has lived for 95 years
• We can make it live for another 100 years, at least.
• What will allow Tata Steel to survive so many years?
Survival
TOCICO Annual Conference Nov 2007
Internal Communication Document 2002
• Sensitive to the environment
• Cohesion and identity
• Tolerance to different view points
• Conservative Financials
The Key characteristics of companies that live long years:

TOCICO Annual Conference Nov 2007
At different points in time in our long History, we have focused on different Stakeholders:
Employees, Society & Community
Customer
Supplier
Investor
1907 1995 1999 2002
Internal Communication Document 2002
TOCICO Annual Conference Nov 2007
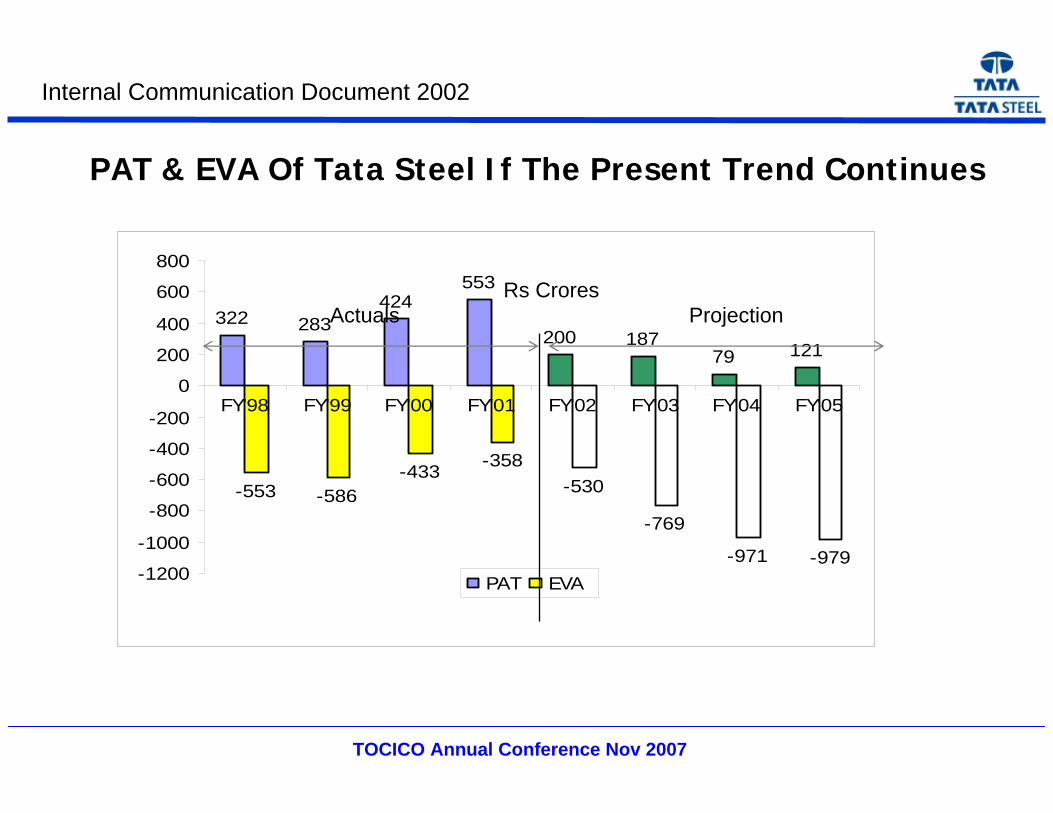
PAT & EVA Of Tata Steel If The Present Trend Continues
322 283424
553
200 18779 121
-553 -586-433
-358-530
-769
-971 -979-1200
-1000
-800
-600
-400
-200
0
200
400
600
800
FY'98 FY'99 FY'00 FY'01 FY'02 FY'03 FY'04 FY'05
PAT EVA
Actuals ProjectionRs Crores
Internal Communication Document 2002
TOCICO Annual Conference Nov 2007
Internal Communication Document 2002
Our New Vision Focuses on building value for the Investor
without losing our aspiration of improving the quality of
life of our employees and the Communities we serve
Vision Focus

TOCICO Annual Conference Nov 2007
Tata Steel – Vision Articulated as in 2002
TOCICO Annual Conference Nov 2007
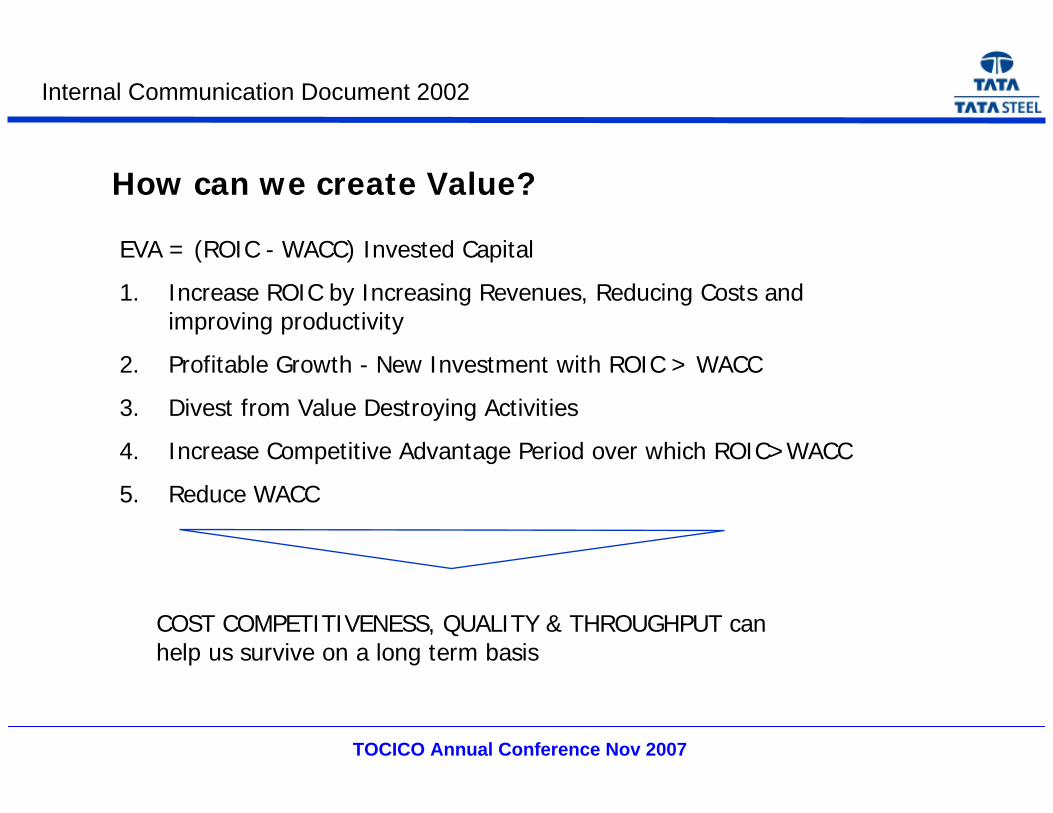
How can we create Value?
EVA = (ROIC - WACC) Invested Capital
1. Increase ROIC by Increasing Revenues, Reducing Costs and improving productivity
2. Profitable Growth - New Investment with ROIC > WACC
3. Divest from Value Destroying Activities
4. Increase Competitive Advantage Period over which ROIC>WACC
5. Reduce WACC
COST COMPETITIVENESS, QUALITY & THROUGHPUT can help us survive on a long term basis
Internal Communication Document 2002

TOCICO Annual Conference Nov 2007
Internal Communication Document 2002
How can we create Value?
Improving Competitive Advantage Period
1. Customer Satisfaction
2. Products & Service Quality
3. Employee Safety
4. Efficiency & Productivity
5. Employee Satisfaction
6. Market Share
7. Process Improvement, Innovation & Re-engineering
8. Employee Development & Training
9. New Product Development
EVA means conducting our business better
TOCICO Annual Conference Nov 2007
Viable Vision @ Tata Steel
About Tata Group – People Before Profits
-Developing Improvement Philosophy at Tata steel
-VV Template for Tata Steel – What’s different?-Learning
About Tata Steel

TOCICO Annual Conference Nov 2007
MUSTERINGRESOURCES
SELF CONFIDENCE
DETERMINATION
ACHIEVEMENT
It is essential for the top management to set out aspiration that creates, by design, a chasm between ambition and resources.
© C K Prahlad
ASPIRE Philosophy
© Dr. T Mukherjee

TOCICO Annual Conference Nov 2007
History of Improvement Initiatives 1990-2003
0
4000
8000
12000
16000
2003
QIP
B’ mkgTOP
TPM
KM
PEP6 Sigma
Aspire
TOP in Mktg.
TOCICO Annual Conference Nov 2007
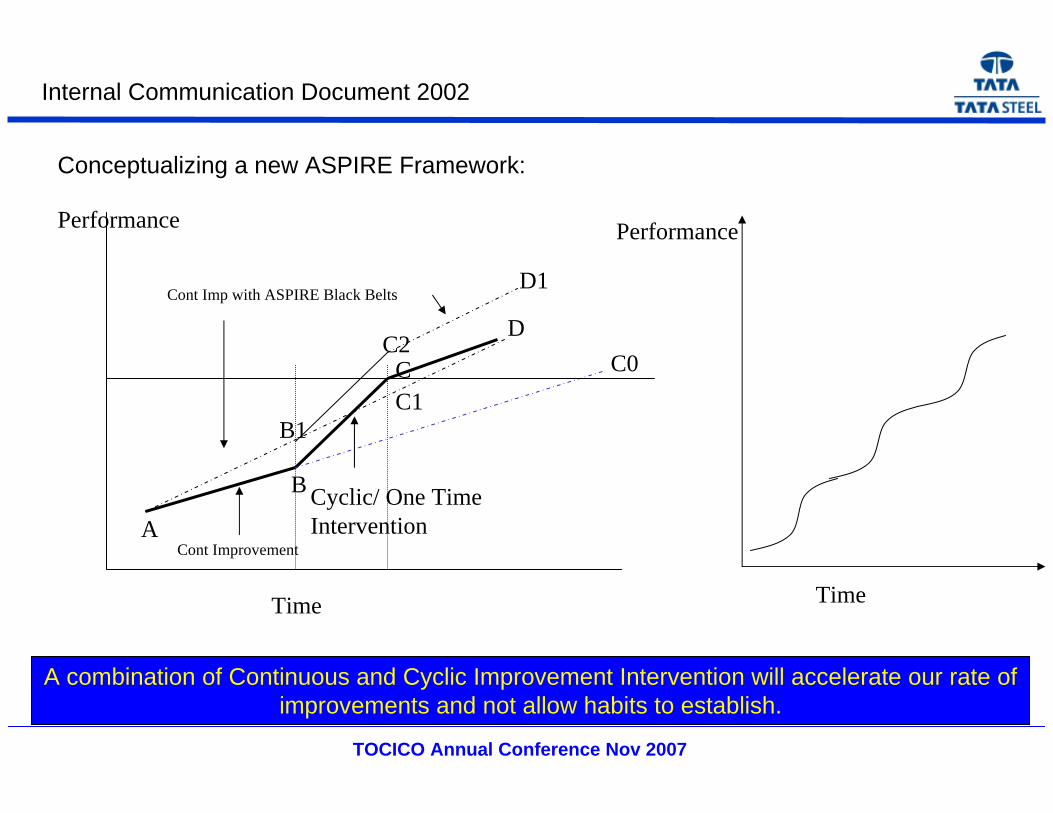
Time
Performance
Cont Imp with ASPIRE Black Belts
Cyclic/ One TimeInterventionA
B
C
D
B1C1
C2
D1
C0
Cont Improvement
Internal Communication Document 2002
Conceptualizing a new ASPIRE Framework:
Performance
Time
A combination of Continuous and Cyclic Improvement Intervention will accelerate our rate of improvements and not allow habits to establish.

TOCICO Annual Conference Nov 2007
QUALITY SYSTEMS / ISO
Abnormalities
Minor Issues
Major IssuesNeeds focused, structured & time bound approach to solve.
Objective: Breakthrough Improvement
DM
AIC
/ CVM
/ RVM
/ SVM
TPM
/QC
s
Space for all to choose his own area to excel.
Needs Focused, structured approach to solve.
Objective: Sustenance thru’people involvement.
Self
initi
ated
pr
ojec
tsPr
iorit
y pr
ojec
ts
Vision 2007
ASPIRE Before Viable Vision
Supplier
Customer
Process
SVM
DMAIC/SIP/TPM
CVM/RVM
Knowledge Management
Missing links: Envisioning, Value Innovation & Systems Approach

TOCICO Annual Conference Nov 2007
Systems Approach for Improvement Project Selection
Strategic Intent
CTQ/CTC/CTP Prioritized
Process Priority
Prioritized Strategic objectives
Stakeholderinputs
AspirationalGoal Setting
Performance Review Inputs
Strategy workshop
Criteria:BLI+EOI+Gap
Criteria:Impact on SO
Criteria:Gap
Cause(s)/ Solution
Kaizen/ Suggestions/ QC
DMAIC
SIP
Unknown/ Complex
Known/ Cross-functional
Low complexity/Local issues
© Bimlendra Jha
BLI= Bottom Line ImpactEOI= Ease of ImplementationQC = Quality CircleSO = Strategic ObjectiveSIP= Self Initiated Projects

TOCICO Annual Conference Nov 2007
POWER OF PRODUCT AND MARKET MIX
$200
$250
$300
$350
$400
$450
$500
Base Grade Mid Range High End Managing the MixIllustrative
• Product Mix• Technology
Improvement
• Customer Mix• Price Contracts• Branded Products
• Channel Management
• Customer Value Management
Years
Rea
lisat
ion

TOCICO Annual Conference Nov 2007
IMPACT OF MIX ON OPERATING PROFIT
2,302342
421
1,154
253
132 1,707
1,000
1,250
1,500
1,750
2,000
2,250
2,500
FY'96 FY'01 FY'03
Rs
Cro
res
Operating Profit
Volume
Mix
TOCICO Annual Conference Nov 2007
“Godrej has been working closely with Tata Steel since early 2003….. Company executives claim that association with Tata Steel has helped the supplier understand the need for steel that is dent resistant and so on. Godrej claims an improvement of 20-25% in steel inventory after these initiatives took shape.”
Business Standard25th November, 2003
GODREJ ON TATA STEEL
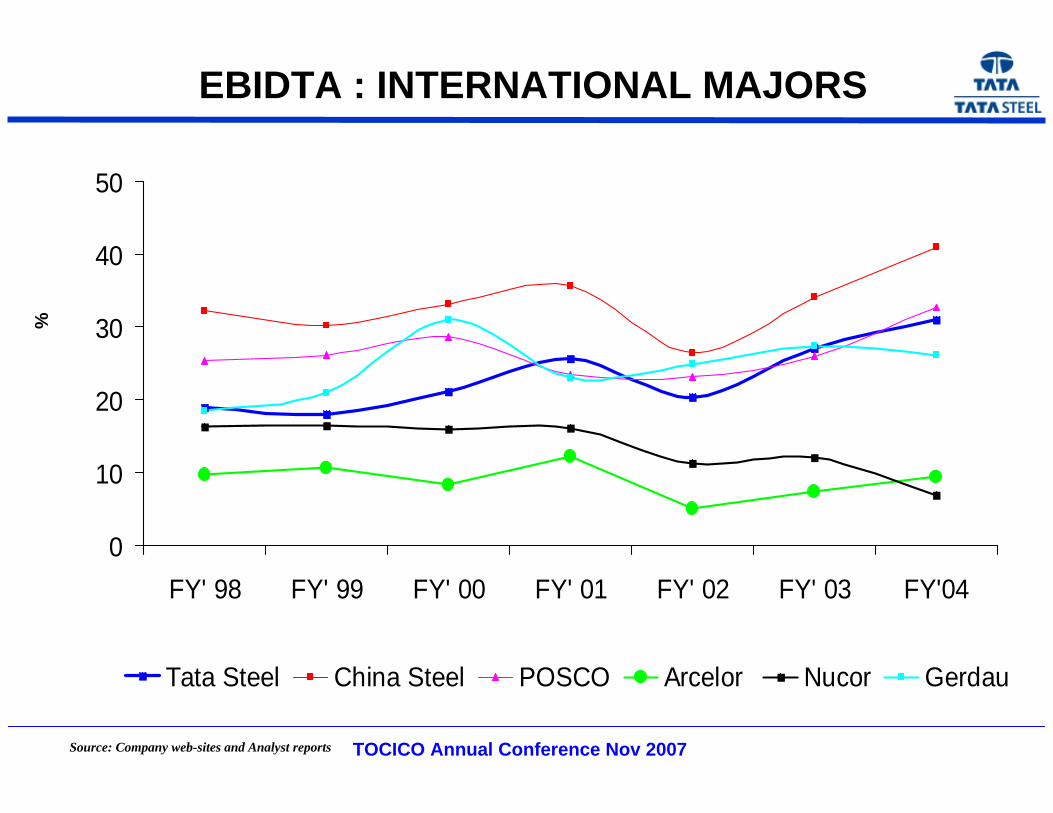
EBIDTA : INTERNATIONAL MAJORS
Source: Company web-sites and Analyst reports
0
10
20
30
40
50
FY' 98 FY' 99 FY' 00 FY' 01 FY' 02 FY' 03 FY'04
Tata Steel China Steel POSCO Arcelor Nucor Gerdau
Net Profit % of Net Sales
%
TOCICO Annual Conference Nov 2007
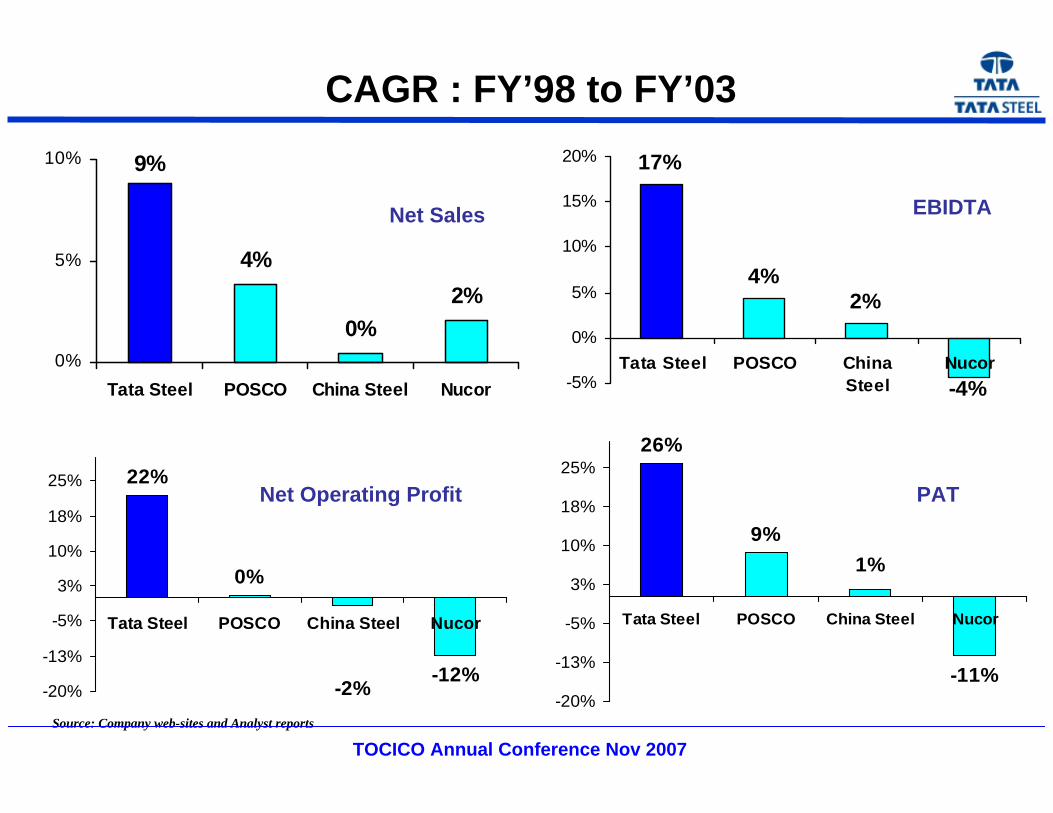
9%
4%
0%2%
0%
5%
10%
Tata Steel POSCO China Steel Nucor
17%
4%2%
-4%-5%
0%
5%
10%
15%
20%
Tata Steel POSCO ChinaSteel
Nucor
EBIDTA
CAGR : FY’98 to FY’03
26%
9%
-11%
1%
-20%
-13%
-5%
3%
10%
18%
25%
Tata Steel POSCO China Steel Nucor
22%
0%
-12%-2%-20%
-13%
-5%
3%
10%
18%
25%
Tata Steel POSCO China Steel Nucor
Source: Company web-sites and Analyst reports
Net Sales
Net Operating Profit PAT
TOCICO Annual Conference Nov 2007
TOCICO Annual Conference Nov 2007
ASPIRE After Viable Vision: Focus on T3ASPIRE After Viable Vision: Focus on T3

TOCICO Annual Conference Nov 2007
Viable Vision @ Tata Steel
About Tata Group – People Before Profits
-Developing Improvement Philosophy at Tata steel
-VV Template for Tata Steel – What’s different?-Learning
About Tata Steel
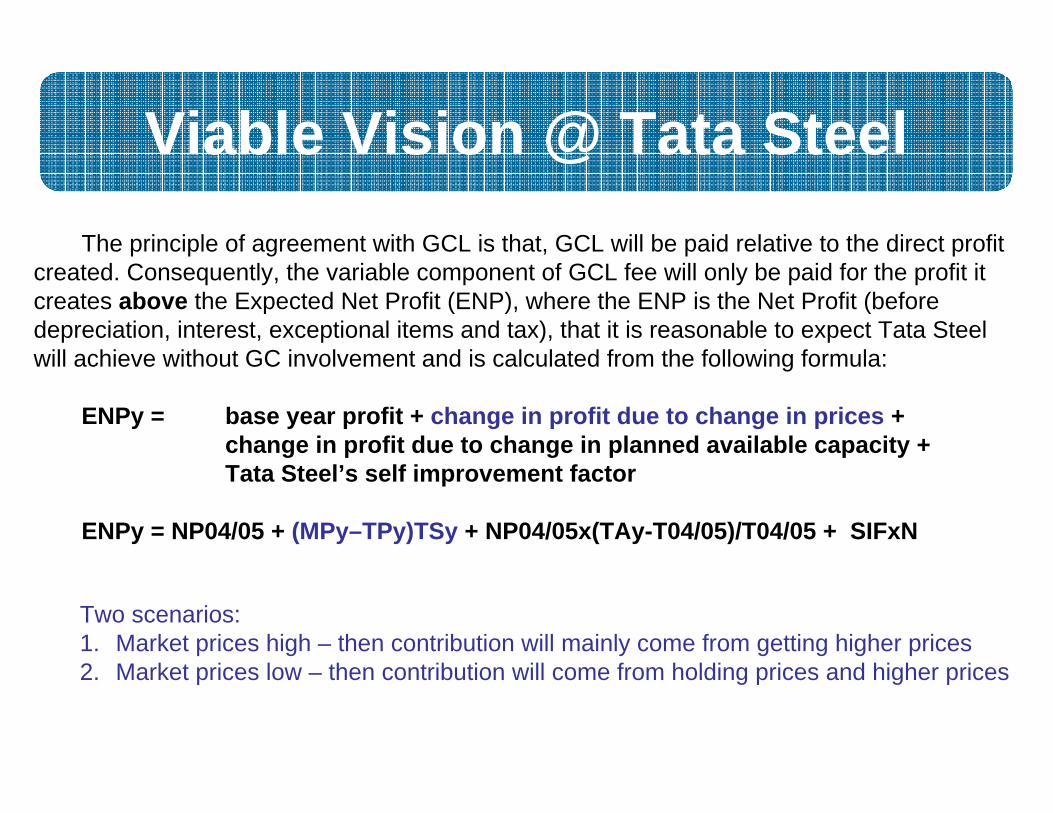
The principle of agreement with GCL is that, GCL will be paid relative to the direct profit created. Consequently, the variable component of GCL fee will only be paid for the profit it creates above the Expected Net Profit (ENP), where the ENP is the Net Profit (before depreciation, interest, exceptional items and tax), that it is reasonable to expect Tata Steel will achieve without GC involvement and is calculated from the following formula:
ENPy = base year profit + change in profit due to change in prices + change in profit due to change in planned available capacity + Tata Steel’s self improvement factor
ENPy = NP04/05 + (MPy–TPy)TSy + NP04/05x(TAy-T04/05)/T04/05 + SIFxN
Viable Vision @ Tata Steel
Two scenarios:1. Market prices high – then contribution will mainly come from getting higher prices2. Market prices low – then contribution will come from holding prices and higher prices
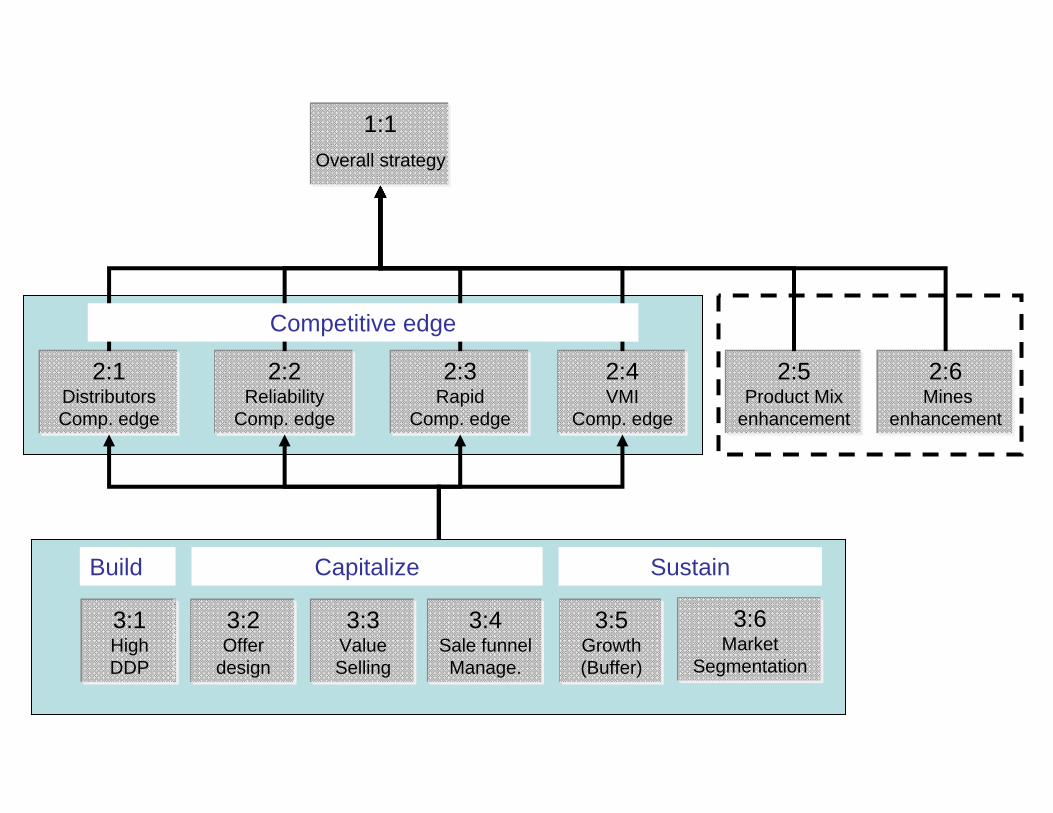
1:1
2:5Product Mix
enhancement
2:6Mines
enhancement
Overall strategy
2:2Reliability
Comp. edge
2:4VMI
Comp. edge
2:1Distributors Comp. edge
2:3Rapid
Comp. edge
Competitive edge
3:5Growth(Buffer)
3:4Sale funnel
Manage.
3:3ValueSelling
3:2Offer
design
3:1High DDP
Build SustainCapitalize
3:6Market
Segmentation

- The way to have a decisive competitive edge is to satisfy a client’s significant need to an extent that no significant competitor can. -Different clients have different significant needs. -Not all the current customers will fit nicely into selected competitive edges
1:1
Strategy
Parallel assumptions
Tactic
Sufficient assumptions
(The Company is solidly on POOGI (Process Of OnGoing Improvement))
The aggressive growth of Tata Steel is (almost) not effected by market price oscillations.
- To ensure aggressive growth (also in profit and ROI) Tata Steel’s T (Throughput*) must grow, and continue to grow, faster than OE (Fixed cost). *Throughput = Sales – Variable Cost
- A competitive edge that is not based on low prices enables a company to hold its prices against cheaper offers.
- Exhausting the Company 's resources and/or taking too high risks severely endangers the chance of reaching the strategy.
Build a decisive competitive edge (which is not based on low prices) and the capabilities to capitalize on it, on big enough markets without exhausting Tata Steel’s resources and without taking too high risks.
TOCICO Annual Conference Nov 2007
Viable Vision @ Tata Steel
About Tata Group – People Before Profits
-Developing Improvement Philosophy at Tata steel
-VV Template for Tata Steel – What’s different?-Learning
About Tata Steel

Process of institutionalisation
• Process:1. TOC implementation plan is part of ABP finalisation process2. Roll-out through cross functional teams3. Full time task force for ensuring implementation rigor, training and removing implementation
issues
• Training: 1. TOC fundamental training2. TOC supply chain training3. TOC SFS/Value selling training4. TOC training to distributors5. TRD Training6. TOC operations training
• Reviews:1. Review by Sr. VV team: Monthly 2. Apex TQM review: Quarterly3. Daily management through war rooms and concerto status review: Daily4. IT status review: Fortnightly / Monthly5. COMS review: Fortnightly
Mini Jonah by Henning: 10 persons (CSI & Steel Making)‘S-DBR’ by Eli Schragenheim: 65 personsCCPM Application experts by Dr. James Holt: 30 persons6 week Application Expert program by Goldratt Schools: 34 persons certified by TOCICO as ‘Certified Practitioners’ in Supply-Chain and LogisticsTRD Training: 200 officers

TOC in Mining

TOC MINING OBJECTIVES1. IMPROVE THE THROUGHPUT
Ensuring right quality
Improving reliability of dispatches
Improving volumes to meet demand
Reducing cost/t w/o compromising above
2. IMPROVE THE MINE LIFE
Maximizing mineral recovery
Improving yield
IMPROVE FLOW
Life of the mine is the maximum value that can be recovered now and in future from all its mineral reserves given to us by the nature.

PlannedYield: 39%
Unknown
10% Plant effectiveness
5% Contamination
5% Liberation
6% Fines3.6% Other
70% Production
Starvation
Blockage
Own Problems
Average – 8000t
Belt problem
Mechanical Breakdown
De-watering problem
Leakages
Ultra fines
Product bunkers Full
Ropeway not available
Chute / Plough jamming
Raw Coal not available
Raw coal quality is poor
Feed pumps breakdown
IDENTIFYING FACTORS IMPEDING FLOW
Washing PlantProcess Yield
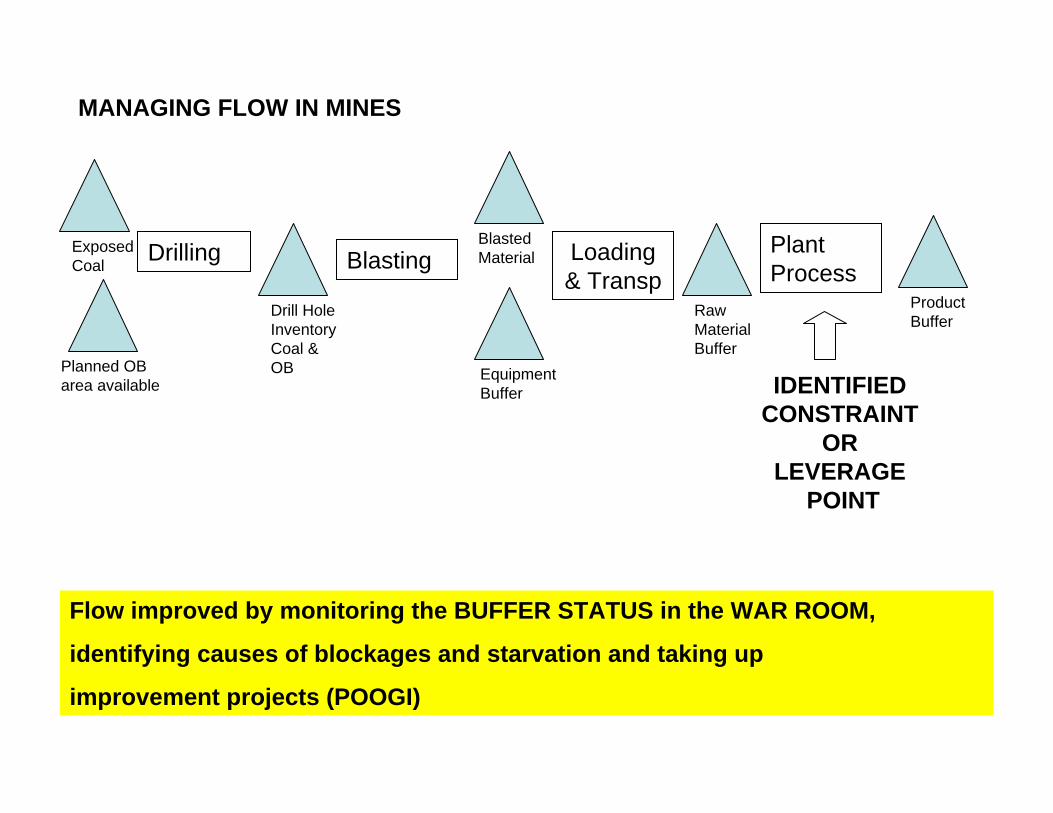
MANAGING FLOW IN MINES
Drilling Blasting Loading & Transp
Plant Process
Exposed Coal
Planned OB area available
Drill Hole InventoryCoal &OB
Blasted Material
Equipment Buffer
RawMaterialBuffer
Product Buffer
IDENTIFIED CONSTRAINT
OR LEVERAGE
POINT
Flow improved by monitoring the BUFFER STATUS in the WAR ROOM,
identifying causes of blockages and starvation and taking up
improvement projects (POOGI)
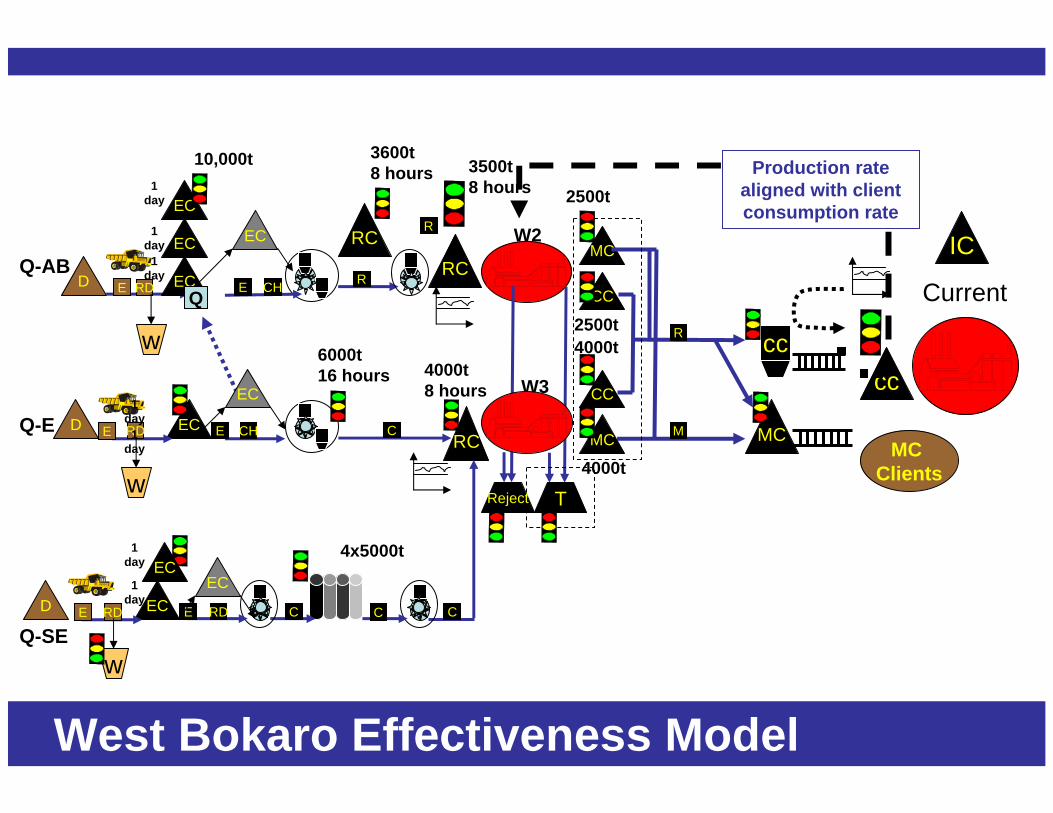
West Bokaro Effectiveness Model
R
IC
cc
MC
cc
M
W3
W2
MC
CC
MC
CC
MC Clients
C
RCC
C
RCR
Q-AB
Q-SE
Q-E
C
T
EC RD
EC CH
CH
D RD
D RD
D RDE E
E E
EE
w
w
w
Current
10,000t
EC
EC
EC
Q
1 day
1 day
1 day EC R
3500t8 hours
3600t8 hours
RC
4000t
4000t
2500t Production rate
aligned with client consumption rate
2500t
4x5000t
4000t8 hours
6000t16 hours
1 day
1 day
1 day
1 day
Reject
ECEC
EC

MAJOR ACTIONS AND ACHIEVEMENTS
1. Increase in the plant capacity from 400 tph to 450 tph
2. Increase in plant run hours by 5%.
3. Reduction in fines generation in W#3 by 5%, improves yield.
Providing resources for quick change over from one type of feed to other.Providing extra resources for continuous plant operations.Providing resources for quick analysis of samples for taking corrective actionProviding pre-screening facility to reduce fines overloading
2AchievementActionstep

MAJOR ACTIONS AND ACHIEVEMENTS
1. Reduction in s.d of ash in the raw coal feed.
2. Reduction in coal dilution improves yield
3. Longer campaign size for a given batch improving yield.
4. Mines buffer compliance improving by more than 30%.
5. Higher flexibility to mining equipments improves utilization
6. Increase in quantity of feed processed by the plant by almost 6 LT.
Feeding coal in uniform batches of atleast 9000 TProviding coring facility in mines for better quality controlDecoupling mining from plant by putting appropriate buffers and assigning responsibility to mines for buffer maintenance.CCPM done on ropeway shutdown to improve its availability and reduce constraint blockageProviding extra resources and incentives to downstream transportation facilities of products to reduce blockageIncreased coordination between mine, plant & ropeway planned maintenance
3AchievementActionstep

MAJOR ACTIONS AND ACHIEVEMENTS
1. Increase in the plant capacity2. Increase in Alumina content in the
slimes from 5.5% to 7%.
Providing resources for quick change over from one type of feed to other.Providing extra resources for transport and dry processing of soft lumpy ore.
2
1. Reduction in Al in fines ore from 2.12 to 2.0%
2. Increase in feed alumina from 2.3% to 2.6% thus increasing mine life
3. Improving s.d of Al from 0.11 to 0.05.
4. Eliminating slime coating of lumps5. Higher flexibility to mining
equipments improves utilization
Batch processing of soft hard ore, friable ore and hard lumpy oreDecoupling mining from plant by putting appropriate buffers
3
AchievementActionstep

CCPM
Maintenance & Sustenance ProjectsMaintenance & Sustenance Projects
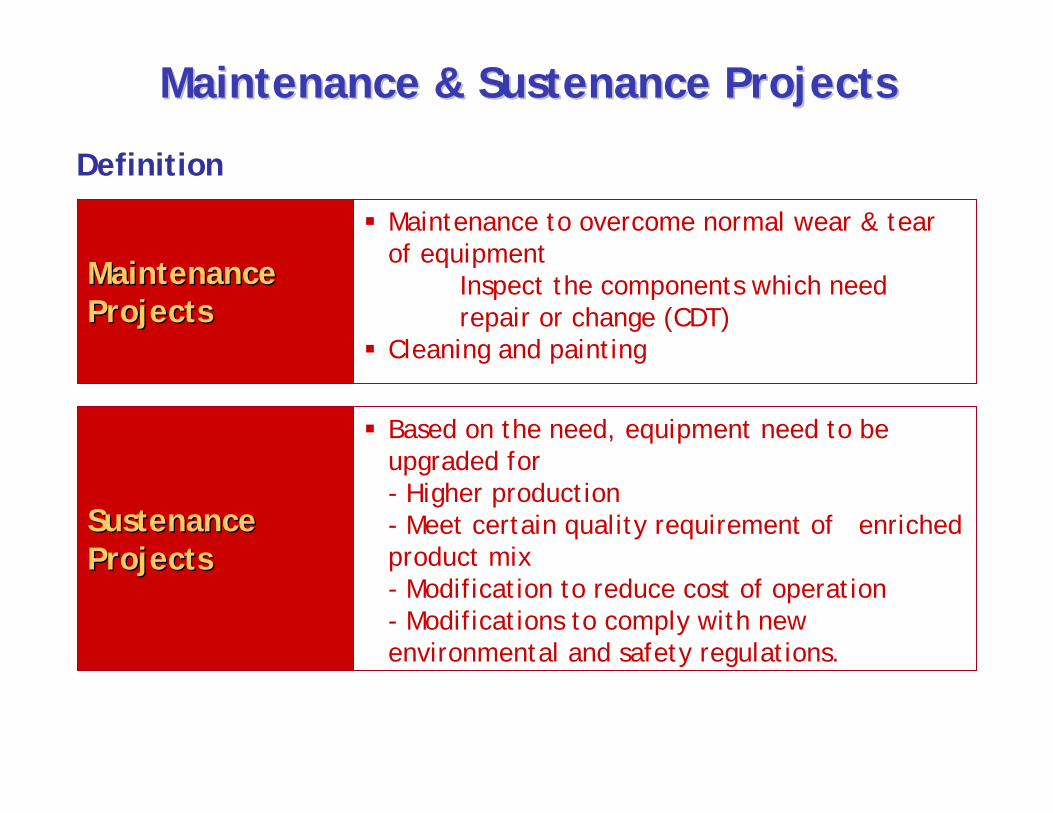
Definition
Maintenance Maintenance ProjectsProjects
Maintenance to overcome normal wear & tear of equipment
Inspect the components which need repair or change (CDT)
Cleaning and painting
Sustenance Sustenance ProjectsProjects
Based on the need, equipment need to be upgraded for- Higher production- Meet certain quality requirement of enriched product mix- Modification to reduce cost of operation- Modifications to comply with new environmental and safety regulations.
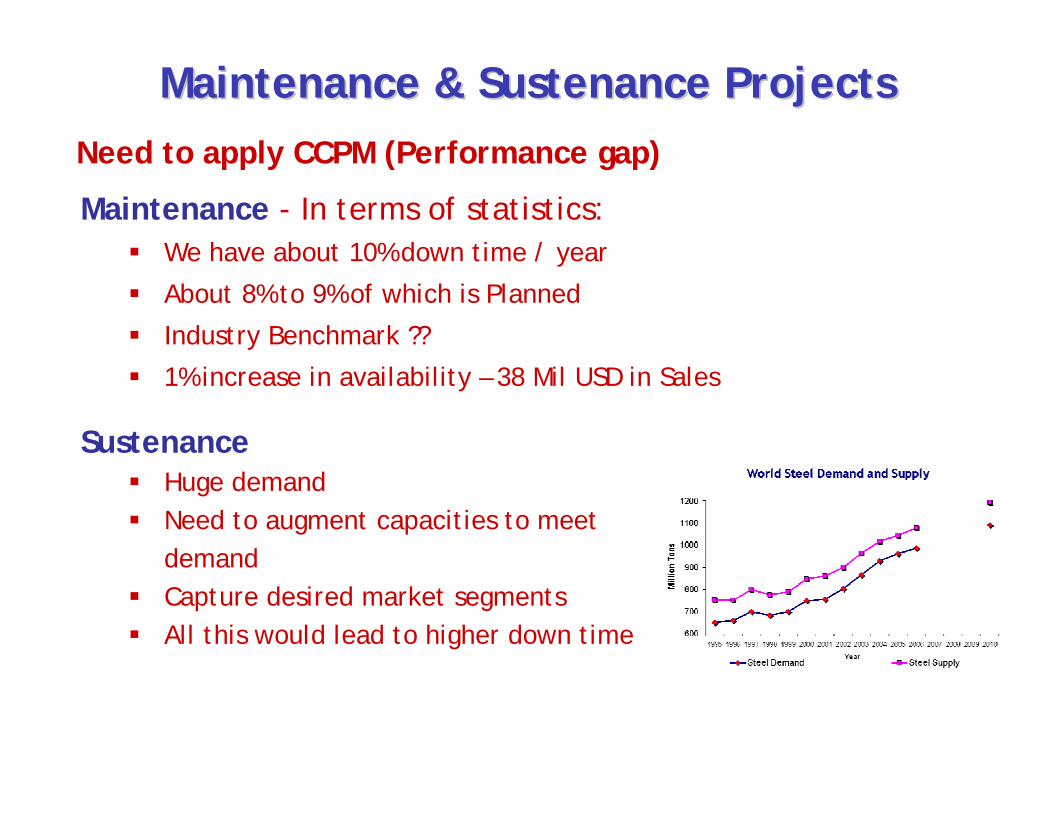
Maintenance & Sustenance ProjectsMaintenance & Sustenance ProjectsNeed to apply CCPM (Performance gap)
Maintenance - In terms of statistics: We have about 10% down time / year
About 8% to 9% of which is Planned
Industry Benchmark ??
1% increase in availability – 38 Mil USD in Sales
SustenanceHuge demandNeed to augment capacities to meet demandCapture desired market segmentsAll this would lead to higher down time
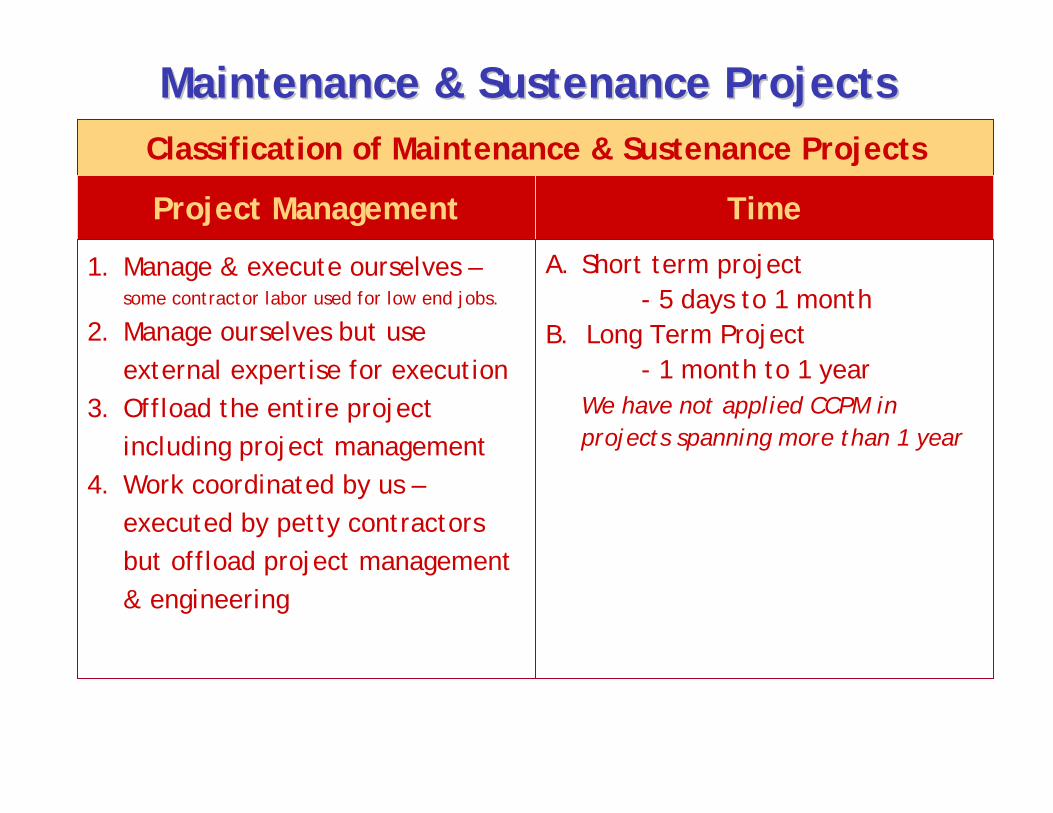
Maintenance & Sustenance ProjectsMaintenance & Sustenance ProjectsClassification of Maintenance & Sustenance Projects
Project Management Time
1. Manage & execute ourselves –some contractor labor used for low end jobs.
2. Manage ourselves but use external expertise for execution
3. Offload the entire project including project management
4. Work coordinated by us –executed by petty contractors but offload project management & engineering
A. Short term project- 5 days to 1 month
B. Long Term Project- 1 month to 1 year
We have not applied CCPM in projects spanning more than 1 year

Results AchievedResults AchievedSummary of Results - Fy’07 (year ending 31st March 07)
• CCPM adopted as a process of planning, executing most maintenance projects (14) & some sustenance project (4).
• Project durations were reduce from 10% to 32% of time in maintenance projects.
• Project duration reduced for 7 to 15 % of time for sustenance projects.
• Savings Rs 35 Crs (US $ 8.7 Mil)
Summary of Results - Fy’08 Q1 (year ending 31st March 08)• CCPM applied in all maintenance (10) & sustenance projects (4). • Project durations were reduce from 5% to 27% of time in maintenance
projects.
• Project duration reduced for 18 to 25 % of time for sustenance projects.
• Savings (cost accounting) Rs 19 Crs (US $ 4.7 Mil)
Building High DDP

2630353952
5080
303
326
264
229
243 239
118
0
50
100
150
200
250
300
350
400
1.9.0
61.1
0.06
1.11.
061.1
2.06
1.1.0
7
1.2.0
7
1.3.0
7
1.4.0
71.0
5.07
1.06.
071.0
7.07
1.08.
071.0
9.07
1.10.
07
Indexed TRDBaseline
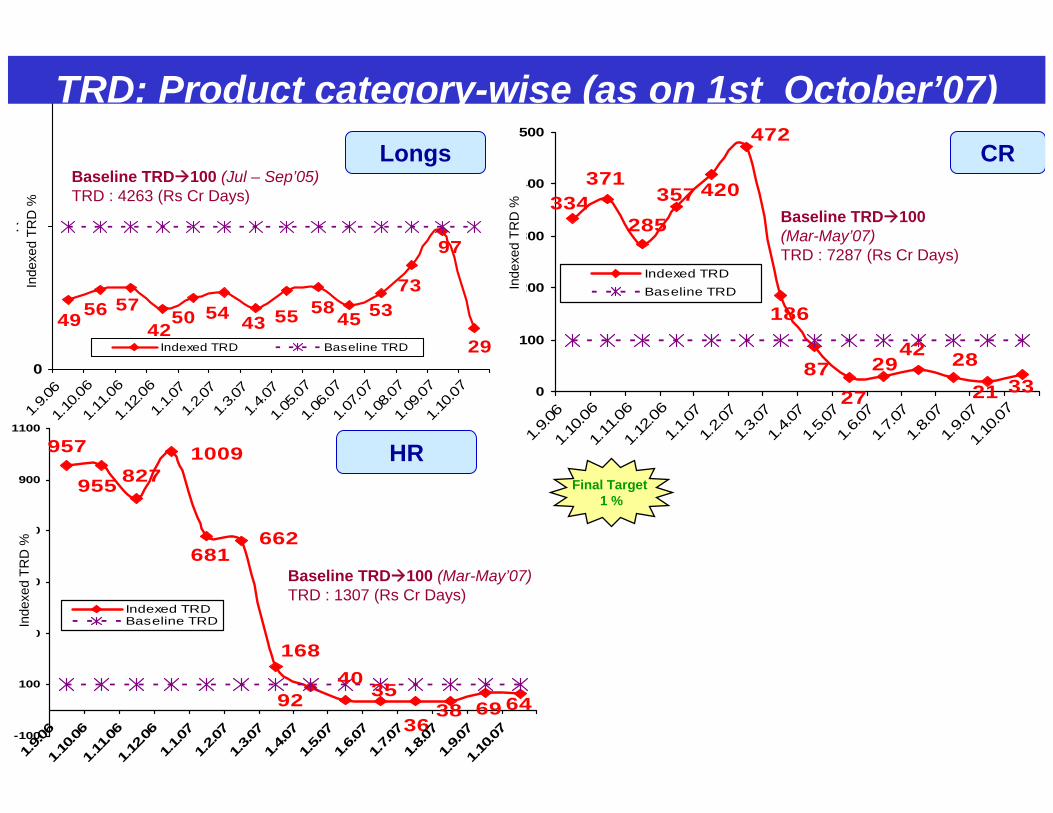
Baseline 100TRD : 28435 (Rs Cr Days)
TRD Indexed TRD % of Baseline* (as on 1st October’07)
Final Target 1 %
Inde
xed
TRD
%
*Baseline Period
CR & HR: Mar-May ’07, Longs & Tubes: Jul-Sep’05, Wires: Dec’06-Feb’07
29
97
7353455855435450
42575649
0
100
200
1.9.06
1.10.0
61.1
1.06
1.12.0
61.1
.071.2
.071.3
.071.4
.071.0
5.07
1.06.0
71.0
7.07
1.08.0
71.0
9.07
1.10.0
7
Indexed TRD Baseline TRD
Baseline TRD 100 (Jul – Sep’05)TRD : 4263 (Rs Cr Days)
Longs
3328
21
4229
2787
186
472
420357285
371334
0
100
200
300
400
500
1.9.0
61.
10.0
61.
11.0
61.
12.0
61.
1.07
1.2.0
71.
3.07
1.4.0
71.
5.07
1.6.0
71.
7.07
1.8.0
71.
9.07
1.10
.07
Indexed TRDBaseline TRD
Baseline TRD 100 (Mar-May’07)TRD : 7287 (Rs Cr Days)
CR
Inde
xed
TRD
%
6438 6936
354092
168
662681
1009827955
957
-100
100
300
500
700
900
1100
1.9.06
1.10.0
61.1
1.06
1.12.0
61.1
.071.2
.071.3
.071.4
.071.5
.071.6
.071.7
.071.8
.071.9
.071.1
0.07
Indexed TRDBaseline TRD
Baseline TRD 100 (Mar-May’07)TRD : 1307 (Rs Cr Days)
HR
Inde
xed
TRD
%In
dexe
d TR
D %
Final Target 1 %
TRD: Product category-wise (as on 1st October’07)

Wires
1410152251
648497108
150125
0
100
200
1.12
.06
1.1.0
7
1.2.0
7
1.3.0
7
1.4.0
7
1.5.0
7
1.6.0
7
1.7.0
7
1.8.0
7
1.9.0
71.
10.0
7
Inde
xed
TRD
Indexed TRD Baseline TRD
TRD: Product category-wise (as on 1st October’07)
Good
Baseline 100 (Dec ’06 – Feb’07)TRD : 11134 (Rs Cr Days)
Tubes
2958 2364
101
455
354
312635444344460
250
500
1.9.06
1.10.0
61.1
1.06
1.12.0
61.1
.071.2
.071.3
.071.4
.071.5
.071.6
.071.7
.071.8
.071.9
.071.1
0.07
Inde
xed
TRD
Indexed TRD Baseline TRD
GoodTRD calculation includes quantity, which
was not there earlier. The baseline remains unchanged.
Baseline 100 (Jul-Sep’05)TRD : 4445 (Rs Cr Days)
Final Target 1 %
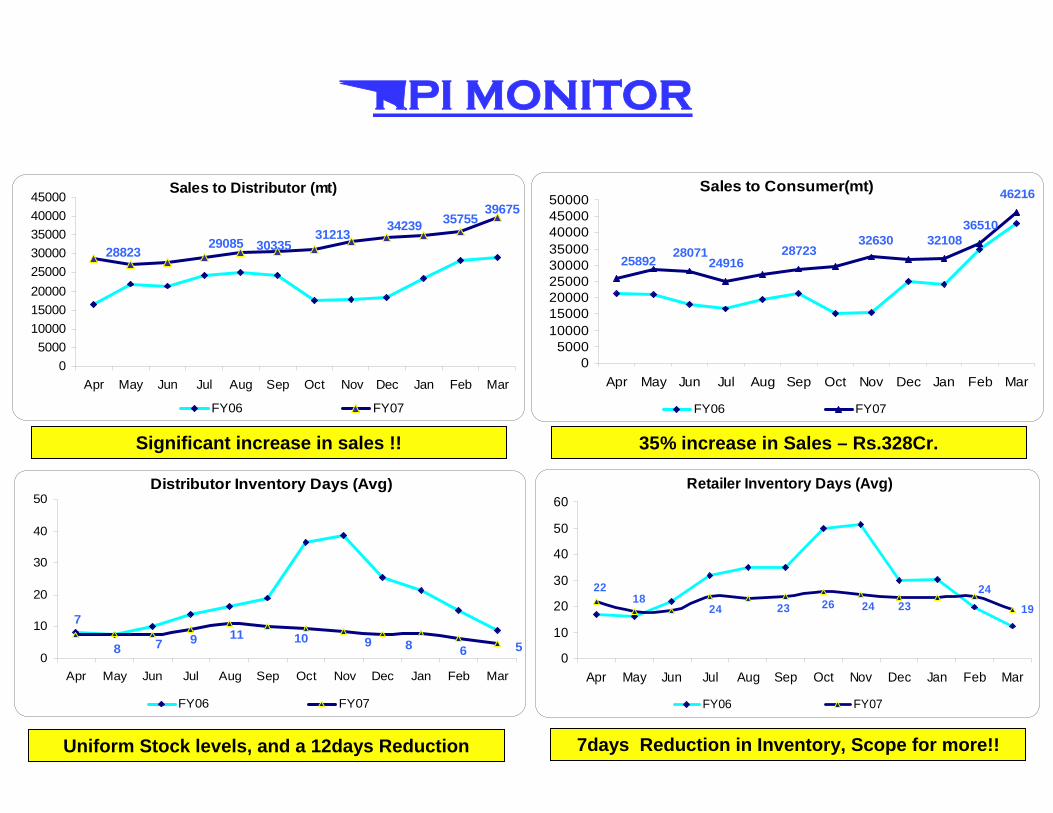
KPI MONITOR
Sales to Distributor (mt)39675
357553423929085
28823 3033531213
05000
1000015000200002500030000350004000045000
Apr May Jun Jul Aug Sep Oct Nov Dec Jan Feb Mar
FY06 FY07
Sales to Consumer(mt)
24916
36510
287232807132630 32108
46216
25892
05000
100001500020000250003000035000400004500050000
Apr May Jun Jul Aug Sep Oct Nov Dec Jan Feb Mar
FY06 FY07
Distributor Inventory Days (Avg)
56891011978
7
0
10
20
30
40
50
Apr May Jun Jul Aug Sep Oct Nov Dec Jan Feb Mar
FY06 FY07
Retailer Inventory Days (Avg)
192418
22
23 26 24 2324
0
10
20
30
40
50
60
Apr May Jun Jul Aug Sep Oct Nov Dec Jan Feb Mar
FY06 FY07
Uniform Stock levels, and a 12days Reduction 7days Reduction in Inventory, Scope for more!!
35% increase in Sales – Rs.328Cr.Significant increase in sales !!
Discussion
“Did we get the desired results?”
“W W W / W W W”

Discussion
“This is the way steel has to be sold”
“It is such a joy to implement the TOC concepts in our Distribution. Why do you
spoil the show by asking for money?”
TOCICO Annual Conference Nov 2007
I have missed more than 9,000 shots in my career. I have lost almost 300 games.
On 26 occasions I have been entrusted to take the game winning shot...
and I missed.
I have failed over and over and over again in my life. And that's precisely why I succeed.
Michael Jordan (1993-, American Basketball Player, Actor)
Freedom to Fail…

Thank You