An Update on National Antibiotic Stewardship Activities...stewardship programs. The Joint Commission...
55
National Center for Emerging and Zoonotic Infectious Diseases An Update on National Antibiotic Stewardship Activities CAPT Arjun Srinivasan, MD [email protected]
Transcript of An Update on National Antibiotic Stewardship Activities...stewardship programs. The Joint Commission...

National Center for Emerging and Zoonotic Infectious Diseases
An Update on National Antibiotic Stewardship Activities
CAPT Arjun Srinivasan, [email protected]

Objectives and Disclosure
Objectives Describe current efforts to monitor antibiotic use in US hospitals
List important improvement opportunities for improving antibiotic use in US hospitals
Disclosure None

It’s a Matter of Patient Safety—it is more than just about antibiotic resistance
What if something bad happens without an antibiotic? What is the number needed to treat?
– Complications to common respiratory infections are very rare
– Over 4400 patients with colds need to be treated to prevent 1 case of pneumonia
What if something bad happens with an antibiotic? What is the number needed to harm?
– Antibiotic adverse events can be severe
• Life-threatening allergic reactions (e.g., anaphylaxis)
• Antibiotic-associated diarrhea (e.g., C. difficile infection)
• 1 in 1000 antibiotic prescriptions leads to an ER visit for an adverse event (~200,000 estimated ER visits/year in U.S.)
– Antibiotic adverse events have long-term consequences for chronic disease: disruption of microbiota and microbiome linked to chronic disease
Petersen et al. British Medical Journal. 2007;335(7627): 982. Shehab, et al. Clin Infect Dis. 2008 Sep 15;47(6):735-43. 3. Shehab et al. JAMA 2016:316:2115-25. 4. Bourgeois, et al. Pediatrics. 2009;124(4):e744-50. 5. Vangay, et al. Cell host & microbe 2015; 17(5): 553-564.

Adverse Events from Hospital Antibiotics• In a review of 1488 hospitalized patients given antibiotics.
• 20% of patients experienced at least 1 antibiotic-associated adverse event.
– 4% of all patients got C. difficile, 6% got an MDRO infection
• 20% of non-indicated antibiotic regiments were associated with an adverse
event, including 7 cases of C. difficile.
• Every 10 days of antibiotics was associated with a 3% increased risk of an
adverse event.
• Most common in 1st 30 days:
– GI (diarrhea, nausea, vomiting): 42%
– Renal (>1.5 times rise in creatinine): 24%
– Hematologic (anemia, leukopenia, thrombocytopenia): 15%Tamma et al. JAMA Intern Med, 2017

Adverse Events from Hospital Antibiotics
97% of antibiotic adverse events resulted in additional testing and/or additional medical care (prolonged or new hospitalization or clinic and/or ED visit).

Increased Risk of Sepsis After Antibiotic Exposure
Disruption of the gut microbiome increases the risk of sepsis in animal models.
Retrospective study of ~9 million patients discharged without sepsis in 473 US hospitals.
0.6% were readmitted with sepsis in 90 days.
Exposure to broad spectrum antibiotics during hospitalization was independently associated with risk of sepsis:
– OR=1.50 95% CI:1.47-1.53
Baggs, J. et al. Clin Infect Dis 2017

Major Policy Developments for Antibiotic Stewardship:No Longer “Whether” but “How”
CMS issued a final rule requiring nursing homes to have antibiotic stewardship programs.
CMS issued a proposed rule requiring hospitals to have antibiotic stewardship programs.
The Joint Commission issued a standard requiring all accredited hospitals to have stewardship programs
– Enforcement began in January of 2017.
The Federal Office of Rural Health Policy added a requirement for stewardship programs for critical access hospitals to receive FLEX funding in 2018.

Major Policy Developments for Antibiotic Stewardship: No Longer “Whether” but “How”
Outpatient stewardship is part of the new payment program for outpatient providers, the Merit Based Incentive Payment System (MIPS).
Providers have to earn “points” in 4 domains to maximize reimbursement.
Stewardship is in 2 of the 4.
Quality- providers can reports on one or more of several antibiotic prescribing quality measures (e.g. avoiding antibiotics in adults with sinusitis, using amox or amox/clav to treat adult sinusitis).
Improvement- providers can show they are implementing outpatient stewardship programs and can take the CDC on-line stewardship course.


Update on Core Element Uptake: 2016 NHSN Annual Hospital Survey

0
500
1,000
1,500
2,000
2,500
3,000
3,500
4,000
4,500
5,000
2014 2015 2016
n=4,184 n=4,569 n=4,781
Meeting all 7 Not meeting all 7
Number of facilities responding to NHSN Annual Hospital Surveys 2014-2016: Number and percentage meeting all 7 Core Elements
48.1% 64.1%40.9%


43.0%
58.1%
69.5%73.9%
46.0%
69.0%
81.5%
58.5%
76.3%
0%
10%
20%
30%
40%
50%
60%
70%
80%
90%
100%
Criticalaccess
hospital
Surgicalhospital
Generalacute care
hospital
Children'shospital
≤50 beds 51 - 200beds
>200 beds Non-teaching
Majorteaching
Facility Type Bed Size Teaching Status
Percentage of U.S. acute care hospitals reporting uptake of all 7 CDC Core Elements, by facility demographic,
National Healthcare Safety Network, 2016 (N=4,781)

627.6
713.6
595.4
0
100
200
300
400
500
600
700
800
≤25 beds 26-50 beds >50 beds
Mea
n r
ates
(D
OT/
1,0
00
day
s p
rese
nt)
Mean Rates of Total Antibiotic Use
Critical Access Hospitals Use Antibiotics About As Much As Larger Hospitals

Implementing Core Elements in CAHs Input from CAHs in several states (in green below)
Developed in collaboration with: Federal Office of Rural Health Policy, The American Hospital Association, The Pew Charitable Trusts
https://www.cdc.gov/getsmart/healthcare/implementation/core-elements-small-critical.html

Incentivizing Stewardship Implementation in Critical Access Hospitals
Medicare Beneficiary Quality Improvement Program (MBQIP) is seeking to expand stewardship programs in CAHs.
– 99% of CAHs participate in MBQIP
– Hospitals are supported by state Flex grantees
Implementation of the CDC Core Elements is now a Core/Required Element of MBQIP (2018-2021).

Measuring Antibiotic Use
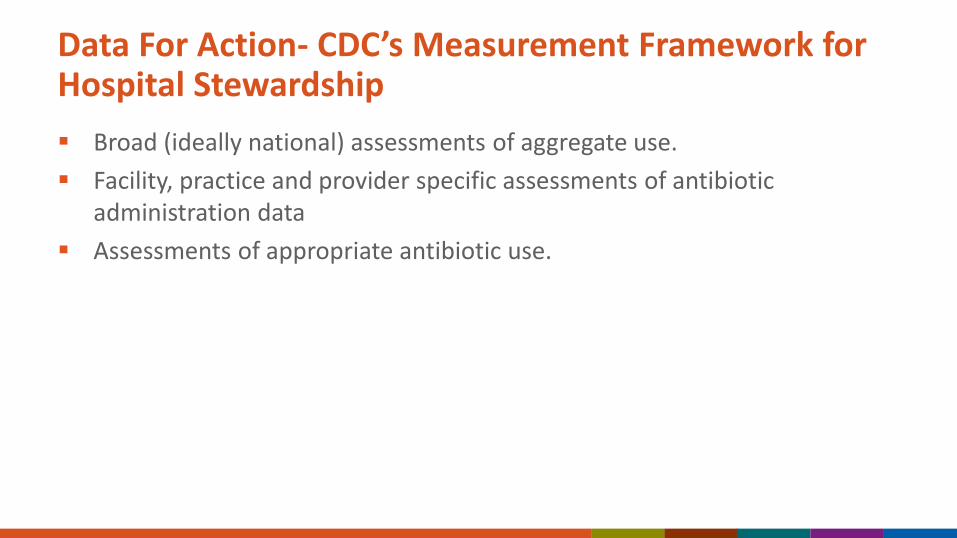
Data For Action- CDC’s Measurement Framework for Hospital Stewardship
Broad (ideally national) assessments of aggregate use.
Facility, practice and provider specific assessments of antibiotic administration data
Assessments of appropriate antibiotic use.

National Healthcare Safety Network Antibiotic Use Option
Captures electronic data on antibiotics administered, along with
admission/discharge/transfer data.
Calculates rates of administration for use:
By facilities to monitor interventions on single units or facility wide
To collect aggregate information on antibiotic use at a regional and
national level
To create antibiotic use benchmarks.

Yearly Submission into the AU Option*
0
100
200
300
400
500
600
700
800
900
2012 2013 2014 2015 2016 2017 2018
No. of
Facilities
Reporting or
that have
Reported
AU Data
*As of April 1, 2018

Submission Metrics*
776 facilities submitted at least one month of data
– From 49 states (+AE & DC)
– Bed size
• Average = 217
• Median = 171
• Min/Max = 6, 1455
– Teaching status
• Teaching: 65%
– (of all Teaching) Major teaching: 47%
*As of April 1, 2018

Standardized Antibiotic Administration Ratio (SAAR)
CDC’s 1st attempt at developing a risk-adjusted benchmarking
measure for hospital antibiotic use.
SAAR expresses observed antibiotic use compared to predicted
use.
Predicted use is calculated with risk adjusted models
CDC worked with many partners to develop the SAAR
measure to try and make it most useful for stewardship.
Endorsed by The National Quality Forum in 2016 for
performance improvement.

Standardized Antibiotic Administration Ratio (SAAR) Categories- 2016-2018 Broad spectrum agents predominantly used for hospital-onset/multi-drug
resistant bacteria.
Broad spectrum agents predominantly used for community-acquired
infection.
Anti-MRSA agents.
Agents predominantly used for surgical site infection prophylaxis.
All antibacterial agents.
SAAR categories are calculated separately for different patient care
locations
– ICU and Ward
– Pediatrics and Adult

Revisions to the SAAR Categories
Now that many more facilities are reporting, CDC is re-doing the SAAR values to produce measures of expected use that are based on more data.
It also gave us the opportunity to talk with experts who are using the NHSN Antibiotic Use option to get their thoughts on changes we should make.
We have enough data to produce SAAR values for some new location types:
– Step-down units
– General oncology units
Goal is to have the new SAARs in the January 2019 release of NHSN.

Some Suggestions About the SAAR
Pull out “last resort” agents (like colistin) into a different category.
Change the “surgical prophylaxis” category to a “narrow spectrum beta-lactam” category.
Add a SAAR with agents that pose the highest risks for C. difficile.
Add a SAAR for anti-fungals to focus on agents to treat candiemia.
Add an azithromycin only SAAR for pediatrics.
Develop SAARs for NICUs, distinct from pediatrics.
– Developmental work underway in partnership with The Vermont Oxford Network.

Key Questions About the SAAR
Does the SAAR help point to locations and/or agents where there are meaningful opportunities to improve antibiotic use?
How would additional data for risk-adjustment impact the SAAR?
Will the SAAR values change if antibiotic use is improved?

Using NHSN AU Data to Focus Stewardship Efforts
Courtesy of Eddie Stenehjem

SAAR Values Before And After A Stewardship Intervention
Infect Control Hosp Epidemiol. 2017 Jun;38(6):721-723.

Assessing the SAAR Risk Adjustment:Facility Level vs. Patient Level Data
Collaboration with Kaiser of Southern California looking at risk adjusted benchmarks using a variety of patient level data (DRG, case-mix, diagnosis codes, WBC, Charlson etc) in addition to facility level data.
– NHSN AU currently only gets facility level data.
Comparing these benchmark values (KP ratio) to SAARs.
– Slides courtesy of Kalvin Yu, Jason Jones, Liz Moisan
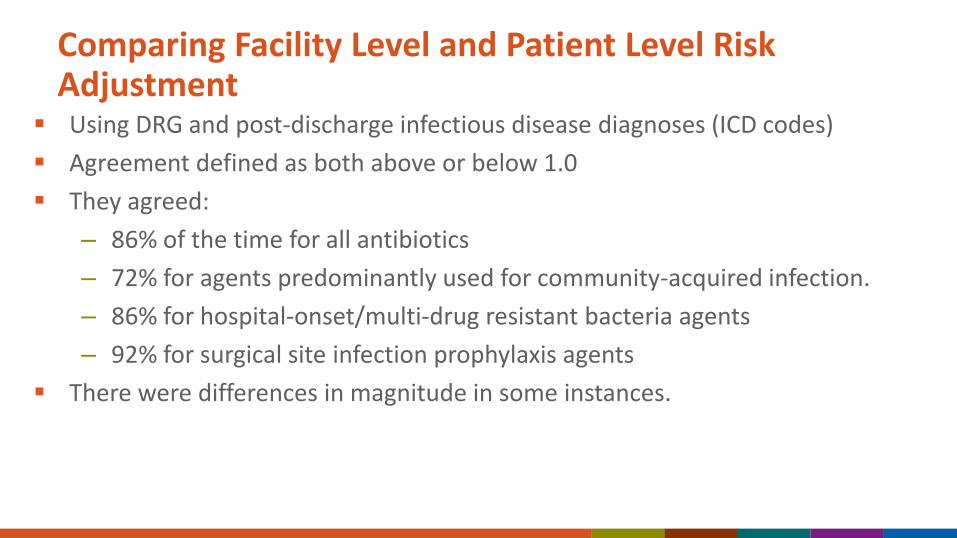
Comparing Facility Level and Patient Level Risk Adjustment
Using DRG and post-discharge infectious disease diagnoses (ICD codes)
Agreement defined as both above or below 1.0
They agreed:
– 86% of the time for all antibiotics
– 72% for agents predominantly used for community-acquired infection.
– 86% for hospital-onset/multi-drug resistant bacteria agents
– 92% for surgical site infection prophylaxis agents
There were differences in magnitude in some instances.

Next Steps for the SAAR Measure
More work on exploring and refining risk adjustment.
More work on assessing application of the SAAR for stewardship.
– Duke Antimicrobial Stewardship Outreach Network working on a project to
• Enroll a group of hospitals in NHSN AU
• Implement or expand stewardship core elements
• Assess the impact on SAAR measures

What About Measuring Prescribing Quality in Hospitals?
Simply looking at discharge diagnoses does not usually help assess if antibiotic use was appropriate.
– Which antibiotics are for which diagnoses?
Most inappropriate use in hospitals occurs in patients who are either misdiagnosed with an infection or who have an infection, but are treated incorrectly.
192 187
94
0
50
100
150
200
250
Duration of TherapyLonger than Necessary
Noninfectious orNonbacterial Syndrome
Treatment of Colonizationor Contamination
Da
ys
of
Th
era
py
Hecker MT et al. Arch Intern Med. 2003;163:972-978.

Measuring Prescribing Quality in Hospitals
When this has been done, it has involved detailed chart reviews.
– Expert clinicians- often infectious disease, often a panel
– Non-clinician applying an algorithm
Both are (very) labor intensive.
The former has the advantage of being able to assess use in all cases, the latter has the advantage of being more standardized and reproducible.
In the US, we are taking the latter approach to attempt a national assessment of appropriate use.
United States Point Prevalence Survey of Hospital Prescribing Quality
In 2015, CDC conducted a point prevalence survey of healthcare associated infections and antibiotic use in about 180 hospitals in 10 states.
– Follow up from a 2011 survey, similar methods to EU surveys
The 2015 survey also abstracted data to look at quality prescribing for:
– Vancomycin
– Quinolones
– Urinary tract infections
– Community acquired pneumonia
Algorithms will be used to assess prescribing quality.

Pilot-Vancomycin Prescribing Quality in 36 Hospitals
MMWR March 7, 2014 / 63(09);194-200

Advancing Assessments of Appropriate Use in Hospitals
Exploring ways to use electronic health information to assess appropriate antibiotic use.
Outpatient/community measures are already extracted electronically in many instances.
– How can we make that data available in real time?
Some hospital assessments of prescribing quality also seem amenable to electronic surveillance.
– Vancomycin use
– Unnecessary duplicate antibiotic therapy
– Bug-drug mismatch

Opportunities for Hospital Stewardship

Engaging Beside Nurses in Antibiotic Stewardship
What roles can bedside nurses play in improving antibiotic use in hospitals?
– Preliminary allergy assessments?
– Prompting time out reviews?
– Leading IV-PO switch?
On-going collaborations with American Nurses Association and some work at Columbia University.
What more could we do here?

Improving Stewardship at Transitions of Care
Average duration of therapy for community acquired pneumonia is 3-5 days longer than guidelines recommend.
Data from studies of community acquired pneumonia show that more than half of the days of therapy occur after discharge.
How can we improve prescribing at time of discharge to make durations of therapy for community acquired pneumonia more guideline concordant?
How Can We Best Evaluate Stewardship Programs?
The Joint Commission has an accreditation standard for antibiotic stewardship.
What should surveyors be looking for and asking about to try and assess the effectiveness of a hospital stewardship program?
– What processes?
– What outcomes?
How can we use the survey process to try and inform improvements in stewardship programs?
Collaboration with TJC, National Quality Forum, Pew Charitable Trusts and The American Hospital Association. .

Antibiotic Stewardship in Outpatients and Nursing Homes

Percent of U.S. Nursing Homes Reporting Implementation of All CDC Core Elements on 2016 Annual NHSN Survey*
0 13
5
9
15
24
42
0
5
10
15
20
25
30
35
40
45
0 1 2 3 4 5 6 7
Pe
rce
nt
Number of Core Elements Fulfilled
*Preliminary results courtesy of Danielle Palms, adapted from presentation at SHEA Spring Conference 2017; St. Louis, MO. Abstract 9026 Please do not reproduce without permission

Clinicians Face Unique Challenges Related to Antibiotic Prescribing in Nursing Homes.1
Older adults may not express the classic signs and symptoms of infection
Availability of diagnostic tests
The decision to initiate antibiotics is frequently made offsite and influenced by family preferences and nursing staff communication
– Many antibiotic prescriptions (66% in one study2) are started by telephone orders without a physician examination
Documentation of the assessment and the decision making process is sometimes limited
– Key prescribing information was not documented for 38% of antibiotic
courses administered3
1. Crnich et al. Drugs Aging. 2015 Sep;32(9):699-716.2. Richards et al, J Am Med Dir Assoc. 2005 Mar-Apr;6(2):109-12.3. Thompson et al. J Am Med Dir Assoc. 2016 Dec 1;17(12):1151-1153.
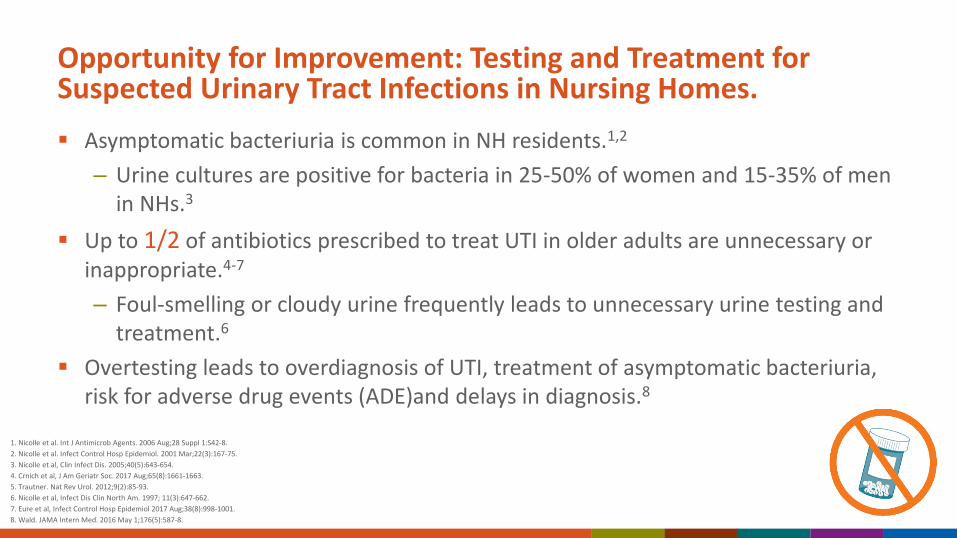
Opportunity for Improvement: Testing and Treatment for Suspected Urinary Tract Infections in Nursing Homes.
Asymptomatic bacteriuria is common in NH residents.1,2
– Urine cultures are positive for bacteria in 25-50% of women and 15-35% of men in NHs.3
Up to 1/2 of antibiotics prescribed to treat UTI in older adults are unnecessary or inappropriate.4-7
– Foul-smelling or cloudy urine frequently leads to unnecessary urine testing and treatment.6
Overtesting leads to overdiagnosis of UTI, treatment of asymptomatic bacteriuria, risk for adverse drug events (ADE)and delays in diagnosis.8
1. Nicolle et al. Int J Antimicrob Agents. 2006 Aug;28 Suppl 1:S42-8.
2. Nicolle et al. Infect Control Hosp Epidemiol. 2001 Mar;22(3):167-75.
3. Nicolle et al, Clin Infect Dis. 2005;40(5):643-654.
4. Crnich et al, J Am Geriatr Soc. 2017 Aug;65(8):1661-1663.
5. Trautner. Nat Rev Urol. 2012;9(2):85-93.
6. Nicolle et al, Infect Dis Clin North Am. 1997; 11(3):647-662.
7. Eure et al, Infect Control Hosp Epidemiol 2017 Aug;38(8):998-1001.
8. Wald. JAMA Intern Med. 2016 May 1;176(5):587-8.

Action: Implementing Practices that Improve Testing and Treatment for Suspected Urinary Tract Infections.
Implementing protocols for appropriate urine testing can help avoid diagnosing and treating asymptomatic bacteriuria
– 17 MA LTC facilities implemented tools promoting urine testing based on specific evaluation and indications• Urine cultures decreased by 1/4, UTI diagnosis decreased by 1/3 and CDI decreased by ~1/2
Treating residents with clear signs and symptoms of a UTI
– Multifaceted intervention focused on a diagnostic and treatment algorithm for UTI implemented in 12 NH in Canada led to fewer courses of antibiotics for UTI without increase in mortality or hospital admission • 1.17 v 1.59 courses; weighted mean difference -0.49, 95% confidence intervals -0.93 to -0.06
1. Doron et al, Abstract presented at ID week 2014 https://idsa.confex.com/idsa/2014/webprogram/Paper46381.html.2. Loeb et al, BMJ 2005;331(7518):669

Action: Implementing Practices that Improve Communication:Communicating with Offsite Providers.
Assess residents for any infection using standardized tools and criteria
– Standardized assessment and communication tools will ensure that important clinical information is:• Collected when there is a change in the resident’s clinical condition or when an infection is
suspected
• Documented in the medical chart
• Communicated with the offsite provider
– One example is the SBAR (Situation, Background, Assessment input and Request)1
• A quasi-experimental trial assessing a quality improvement program that
included tools to improve nurse-provider communication was conducted.
– The number of antibiotic prescriptions decreased significantly (adjusted incidence rate ratio = 0.86, 95% confidence interval = 0.79-0.95).2
1. https://www.ahrq.gov/sites/default/files/wysiwyg/nhguide/4_TK1_T1-SBAR_UTI_Final.pdf2. Shrestha et al. Infect Control Hosp Epidemiol. 2012 Apr;33(4):401-4
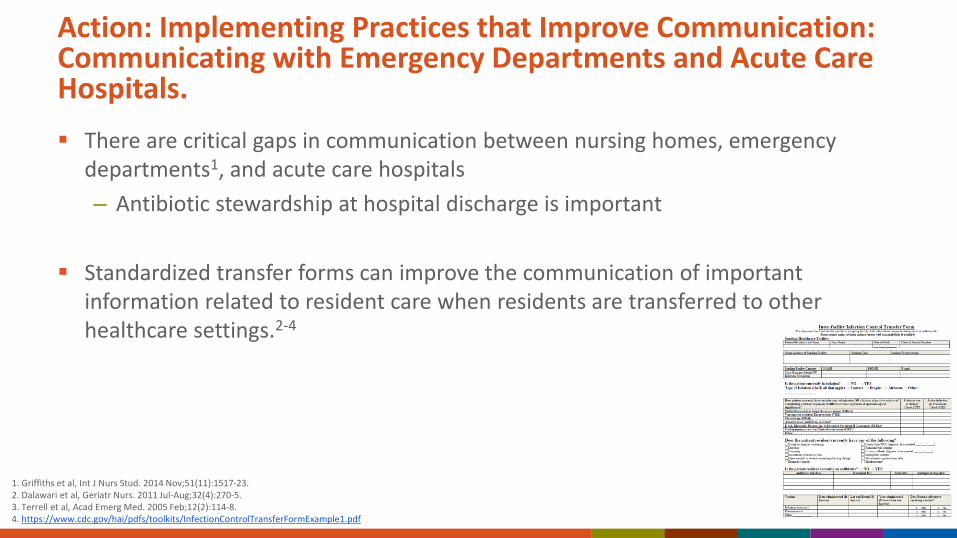
Action: Implementing Practices that Improve Communication:Communicating with Emergency Departments and Acute Care Hospitals.
1. Griffiths et al, Int J Nurs Stud. 2014 Nov;51(11):1517-23.2. Dalawari et al, Geriatr Nurs. 2011 Jul-Aug;32(4):270-5.3. Terrell et al, Acad Emerg Med. 2005 Feb;12(2):114-8. 4. https://www.cdc.gov/hai/pdfs/toolkits/InfectionControlTransferFormExample1.pdf
There are critical gaps in communication between nursing homes, emergency departments1, and acute care hospitals
– Antibiotic stewardship at hospital discharge is important
Standardized transfer forms can improve the communication of important information related to resident care when residents are transferred to other healthcare settings.2-4

Outpatient Prescribing Quality in the United States
47 million unnecessary antibiotic prescriptions per year
“Prescribing of first-line antibiotics ranged from a low of 37% (95% CI, 32%-43%) for adult patients with sinusitis and pharyngitis to a high of 67% (95% CI, 63%-71%) for pediatric patients with otitis media. For all 3 conditions overall, use of first-line agents was 52% (95% CI, 49%-55%).” JAMA Intern Med. 2016;176(12):1870-1872
For adults with sinusitis: “The median duration of therapy was 10.0 days (interquartile range, 7.0-10.0 days), and 69.6% (95% CI, 63.7%-75.4%) of therapies were prescribed for 10 days or longer.” JAMA Intern Med. Published online March 26, 2018

4949
Have We Made Progress in Reducing Inappropriate Antibiotic Use?
IQVIA pharmacy dispensing data
gis.cdc.gov/grasp/PSA/indexAU.html
Outpatient antibiotic prescribing rates to children decreased by 13%
Outpatient antibiotic prescribing rates to adults have been stable

Outpatient Stewardship Implementation
CMS Quality Innovation Network and Quality Improvement Organizations (QIN-QIOs) helping outpatient facilities to implement CDC’s Core Elements.
– ~7000 outpatient practices are participating
– CDC hosting educational webinars to support effective implementation.
CDC funding University of Utah to implement and evaluate CDC’s Core Elements of Outpatient Antibiotic Stewardship
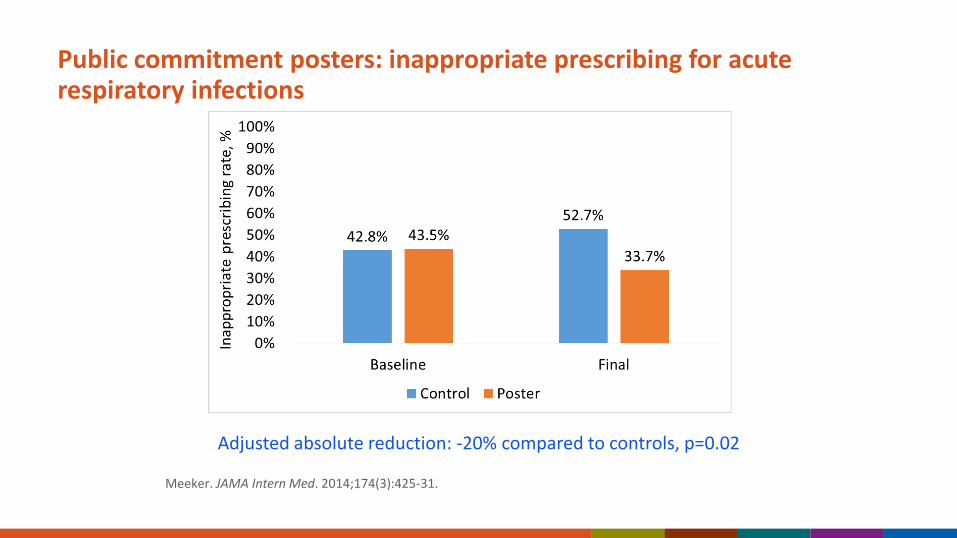
Public commitment posters: inappropriate prescribing for acute respiratory infections
Adjusted absolute reduction: -20% compared to controls, p=0.02
Meeker. JAMA Intern Med. 2014;174(3):425-31.

Peer Comparison to Top Performers
“You are a Top Performer:You are in the top 10% of clinicians. You wrote 0 prescriptions out of 21 acute respiratory infection cases that did not warrant antibiotics. ”
“You are not a Top Performer:Your inappropriate antibiotic prescribing rate is 15%. Top performers' rate is 0%. You wrote 3 prescriptions out of 20 acute respiratory infection cases that did not warrant antibiotics.”
Mean antibiotic prescribing for antibiotic-inappropriate diagnoses decreased from 19.9% to 3.7% (-16.3%)
– Statistically significant versus controls
Slide courtesy of Jeff LinderMeeker, Linder, et al. JAMA 2016;315(6): 562-570.

53
A new educational effort to improve antibiotic prescribing and use.
CDC launched Be Antibiotics Aware during U.S. Antibiotic Awareness Week in November 2017.
Be Antibiotics Awarewww.cdc.gov/antibiotic-use

There is a misperception that efforts to improve sepsis care and stewardship are in conflict.
They should be complimentary.
Getting patients with suspected sepsis on the right antibiotic quickly is good stewardship.
Working with the stewardship team to determine how to optimize early identification of potentially septic patients and what the best antibiotics are is good sepsis care.

Conclusions
The question now is not “if stewardship”, but “how stewardship”.
There is a lot going on here in Nebraska, which we are about to learn more about.
More important- how to do most efficiently and effectively?
– Speed is of the essence
We count on you to find the answers to those questions.
What can we do to help?