An Understanding of Reservoir Souring and Management
59
An Understanding of Reservoir Souring and Management Institute of Corrosion : ICorr Technical Event 1 Tuesday 29 th October 2019 Matt Streets Senior Project Officer [email protected]
Transcript of An Understanding of Reservoir Souring and Management
An Understanding of Reservoir Souring and Management
Institute of Corrosion : ICorr Technical Event
1
Tuesday 29th October 2019
Matt Streets
Senior Project Officer

Overview
1. Introduction to Oilfield Reservoir Souring• What is it and why does it matter?
2. Development of Souring in the Field• The importance of souring forecasting
3. Souring Control and Mitigation• What options are available to Operators?
4. Case Study• From Laboratory to Field
5. Conclusions
2
Figure 1. Sample Collection in Pressurised Bioreactor Suite

1. Introduction to Oilfield Reservoir Souring
Definition of Souring
An increasing mass of hydrogen sulphide(H2S) in the total produced fluids, in excessof 3ppmv in the gas phase at StandardTemperature and Pressure (STP)
3
But what is the origin of this sour gas?
Figure 2. Typical Souring Forecasting Profile

1. Introduction to Oilfield Reservoir Souring
• In order to continue production, water is often introduced to maintain downhole operating pressure
• Historically, the origin of sour gas production had been linked with secondary recovery
• In the 1980s, many oil operators had associated injection water breakthrough with observations of souring
4
Figure 3. Secondary Recovery through Waterfloodinghttp://www.amerexco.com/recovery.html

1. Introduction to Oilfield Reservoir Souring
• In the summer of 1987, the Oilfield Reservoir Souring Programme was launched
• Aim to review ideas and developments in souring, and to resolve the microbiological/geochemical souring debate
• First programme in the world to identify the critical role which microbiology plays in oilfield reservoir souring
5
Figure 4. The Oilfield Reservoir Souring Programmehttp://www.hse.gov.uk/research/othpdf/200-399/oth385.pdf

6
1. Introduction to Microbiological Oilfield Reservoir Souring
Top 5 Requirements
• Sulphate-Reducing Microorganisms
• Water
• Sulphate
• Anoxic Conditions
• Organic Food Source

7
1. Introduction to Microbiological Oilfield Reservoir Souring
Top 5 Requirements
• Sulphate-Reducing Microorganisms
• Water
• Sulphate
• Anoxic Conditions
• Organic Food Source
Figure 5. SRM recovered from the Thistle Fieldhttp://www.hse.gov.uk/research/othpdf/200-399/oth385.pdf

8
1. Introduction to Microbiological Oilfield Reservoir Souring
Top 5 Requirements
• Sulphate-Reducing Microorganisms
• Water
• Sulphate
• Anoxic Conditions
• Organic Food Source
Figure 6. Seawater in the Strait of Malaccahttps://en.wikipedia.org/wiki/Seawater

9
1. Introduction to Microbiological Oilfield Reservoir Souring
Top 5 Requirements
• Sulphate-Reducing Microorganisms
• Water
• Sulphate
• Anoxic Conditions
• Organic Food Source
Figure 6. Seawater in the Strait of Malaccahttps://en.wikipedia.org/wiki/Seawater
10
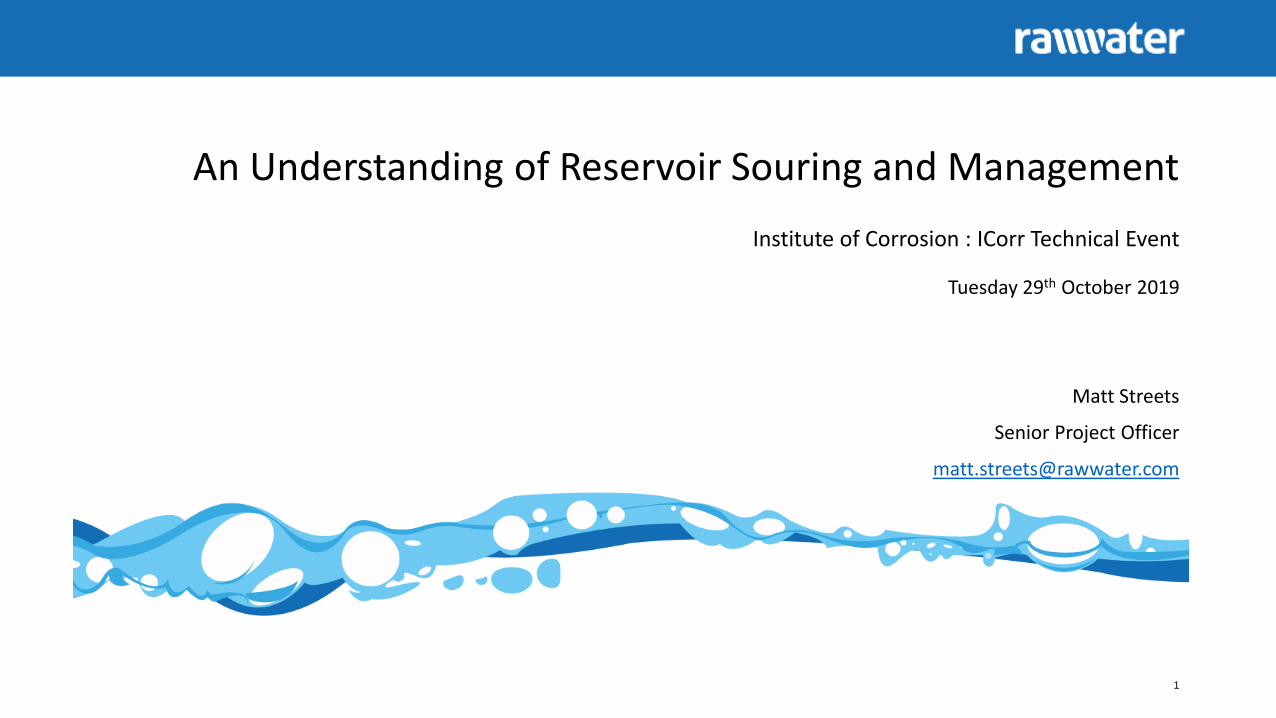
1. Introduction to Microbiological Oilfield Reservoir Souring
Top 5 Requirements
• Sulphate-Reducing Microorganisms
• Water
• Sulphate
• Anoxic Conditions
• Organic Food Source
Figure 6. Seawater in the Strait of Malaccahttps://en.wikipedia.org/wiki/Seawater
11
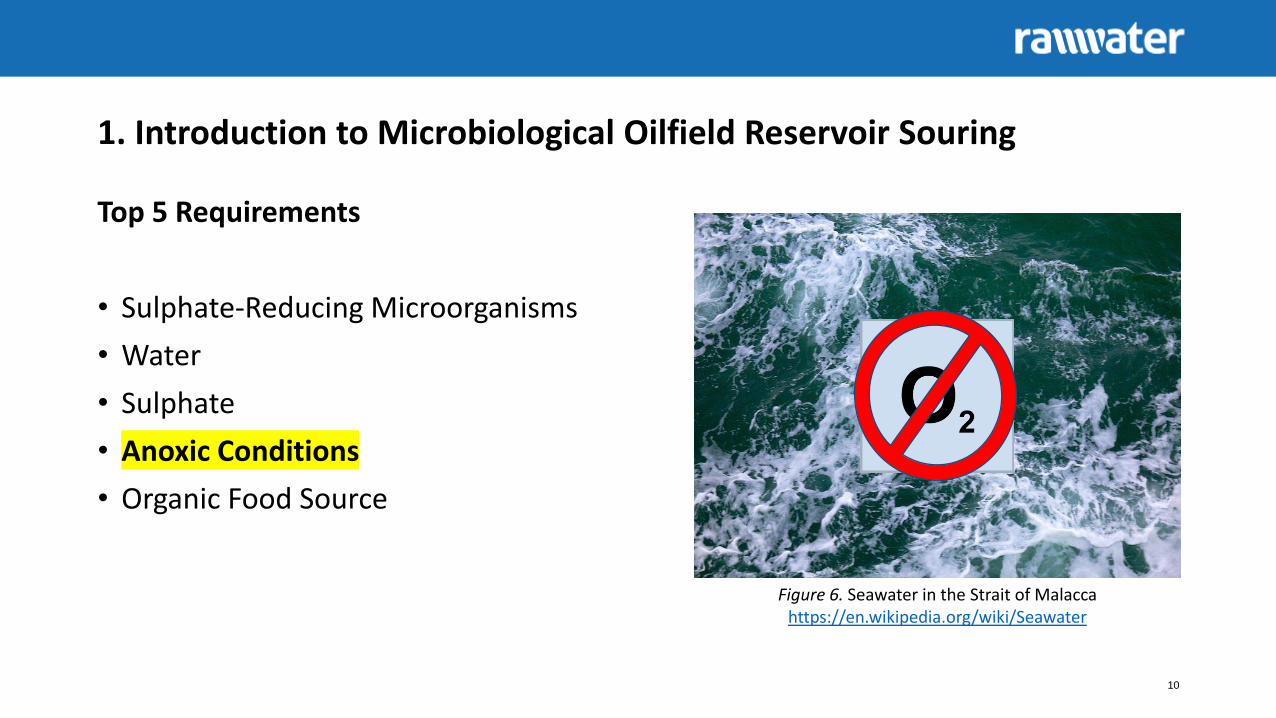
1. Introduction to Microbiological Oilfield Reservoir Souring
Top 5 Requirements
• Sulphate-Reducing Microorganisms
• Water
• Sulphate
• Anoxic Conditions
• Organic Food Source
Figure 7. Crude Oil Souring Propensity Bottle Test

12
1. Introduction to Microbiological Oilfield Reservoir Souring
Top 5 Requirements
• Sulphate-Reducing Microorganisms
• Water
• Sulphate
• Anoxic Conditions
• Organic Food Source
Reservoir Factors
• Water Physiochemistry
• Temperature
• Pressure
• Product Inhibition
• Natural Sulphide Scavengers
CH3COO- + SO42- → 2HCO3 + HS-
Acetic Acid + Sulphate → Bicarbonate + Bisulphide

13
1. Introduction to Microbiological Oilfield Reservoir Souring
Water Physiochemistry
• pH 4 to 9
➢Seawater = 8.3
• Salinity 0 to 475,000 TDS
➢Seawater = 35,000 TDS
• Redox below -100mV
➢Reservoir = -230mV
Figure 8. pH Scalehttps://www.pinterest.com/pin/486459197220981014/

14
1. Introduction to Microbiological Oilfield Reservoir Souring
Temperature
• General Microorganisms
-10oC to +150oC
• SRM
• mSRM 10oC to 45oC
• tSRM 50oC to 80oC
• SRA 80oC to 120oC
SRA
tSRM
mSRM
Figure 9. Temperature Growth Ranges

15
1. Introduction to Microbiological Oilfield Reservoir Souring
Pressure
• SRM• mSRM 1atm to 500atm• tSRM 1atm to 500atm• SRA tolerate slightly
higher pressures
• SRM can survive high pressure environments
Figure 10. Pressure Maintenance in Pressurised Bioreactor Suite
16
1. Introduction to Microbiological Oilfield Reservoir Souring
Product Inhibition
• High concentrations of H2S can be toxic to SRM
• mSRM ~700mg/L
• tSRM ~200mg/L
• SRA ~ 50mg/LFigure 11. Hydrogen Sulphide Warning Signhttp://www.blakelycc.com/news/know-the-facts-about-hydrogen-sulfide/

17
1. Introduction to Microbiological Oilfield Reservoir Souring
Natural Sulphide Scavengers
• The downhole mineralogy can have a significant sulphide scavenging capacity
Beneficial Scenario
• High Siderite %
• Low Pyrite %Figure 12. The ‘Siderite Shield’http://www.hse.gov.uk/research/othpdf/200-399/oth385.pdf

18
1. Introduction to Microbiological Oilfield Reservoir Souring
Why Does it Matter?
• Highly flammable and toxic gas
• Pungent (rotten egg smell)
• Irritation of eyes, nose and throat
• Workplace Exposure Limits (WELs)
• 5ppmv for 8-hour time weight average
• 10ppmv for 15-minute time weighted averageFigure 13. Pungent H2S smell
https://www.stevejenkins.com/blog/2015/02/fix-rotten-egg-smell-in-your-water/

19
1. Introduction to Microbiological Oilfield Reservoir Souring
Why Does it Matter?
Figure 14. H2S Gas Phase Concentrations and Symptomshttps://www.biologicalwasteexpert.com/blog/hydrogen-sulfide-can-rapidly-go-from-nuisance-odors-to-danger
Further information can be found here:http://www.hse.gov.uk/offshore/infosheets/is6-2009.htmhttp://www.hse.gov.uk/pubns/guidance/oce6.pdf

20
1. Introduction to Microbiological Oilfield Reservoir Souring
Why Does it Matter?
Figure 16. Cracking of Steel Pipeline
Figure 15. Cracking of Pre-Heater Tubehttps://www.met-tech.com/images/preheater-tube-failure-3.jpg
Figure 17. Cracking of Steel Pipelinehttps://www.slideshare.net/hsupouway/nace-32427380

1. Introduction to Microbiological Oilfield Reservoir Souring
Schematic of Hydrogen Cracking
Figure 18. Schematic of Hydrogen Cracking
Fe2+
H2S
HS-
HS-
HS-
Fe2+
H2
e- H+
H+
H+ H2S
H2S
e-
e-
e-
H2
Steel Corrosion Deposit Fluid Stream

22
NACE MR175 for Corrosion Resistant Alloys for Sulphide Service
Figure 19. NACE MR0175 / ISO15156https://www.drillingcontractor.org/research-expands-as-sour-gas-
completion-challenges-increase-19044

23

During secondary recovery, the cold water introduced into the downhole formation creates a cool zone, known as the Thermal Viability Shell (TVS)
The size of the downhole TVS is dynamic, changing overtime based on field operations
The TVS can be thought of as a ‘downhole bioreactor’, supporting the growth of the SRM within the formation
24
2. Development of Souring in the Field
Figure 20. Oil Platform
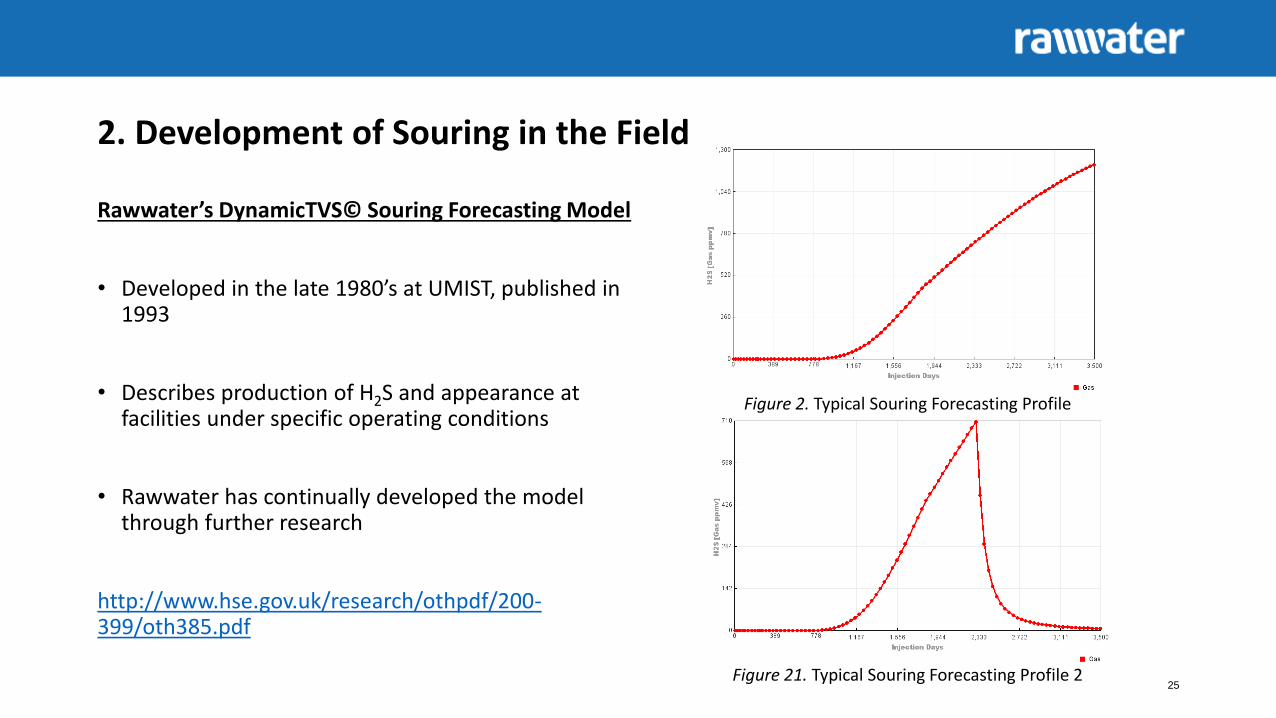
Rawwater’s DynamicTVS© Souring Forecasting Model
• Developed in the late 1980’s at UMIST, published in 1993
• Describes production of H2S and appearance at facilities under specific operating conditions
• Rawwater has continually developed the model through further research
http://www.hse.gov.uk/research/othpdf/200-399/oth385.pdf
25
2. Development of Souring in the Field
Figure 2. Typical Souring Forecasting Profile
Figure 21. Typical Souring Forecasting Profile 2

26
2. Development of Souring in the Field
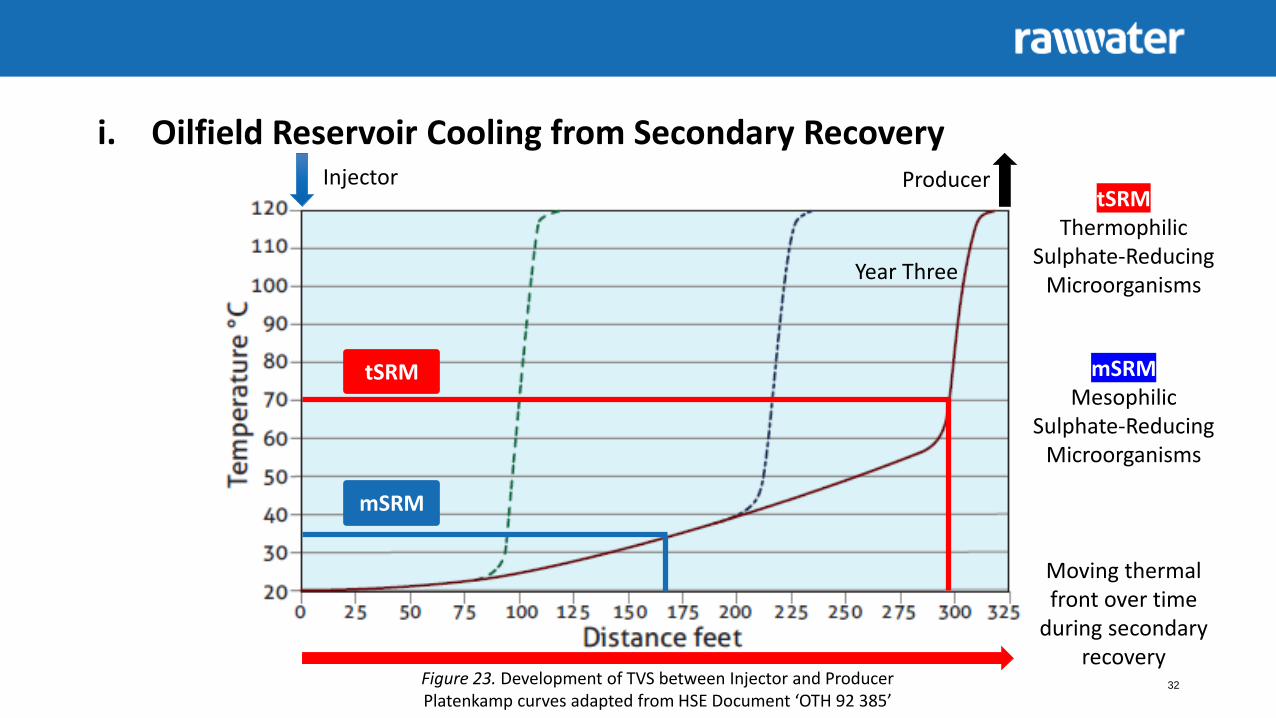
i. Oilfield Reservoir Cooling from Secondary Recovery
ii. Growth of Sulphate-Reducing Microorganisms (SRM)
iii. Transport of H2S to the Producer
iv. Partitioning of H2S from the water to the oil and gas phases at specified conditions

27
2. Development of Souring in the Field
i. Oilfield Reservoir Cooling from Secondary Recovery
• Temperature
• Flow Rate

28
20oC 120oC
Figure 22. Secondary Recovery through Waterfloodinghttps://www.resilience.org/stories/2017-08-09/this-is-the-drilling-method-for-most-us-oil-but-regulators-offer-almost-no-oversight/
What is the Temperature Gradient?
20oC 120oC

29
Moving thermal front over time
during secondary recovery
Injector Producer
Year One Year Two Year Three
i. Oilfield Reservoir Cooling from Secondary Recovery
Figure 23. Development of TVS between Injector and ProducerPlatenkamp curves adapted from HSE Document ‘OTH 92 385’

30
Moving thermal front over time
during secondary recovery
Injector Producer
mSRM
tSRM
tSRMThermophilic
Sulphate-Reducing Microorganisms
mSRMMesophilic
Sulphate-Reducing Microorganisms
Year One
i. Oilfield Reservoir Cooling from Secondary Recovery
Figure 23. Development of TVS between Injector and ProducerPlatenkamp curves adapted from HSE Document ‘OTH 92 385’

31
Moving thermal front over time
during secondary recovery
Injector Producer
mSRM
tSRM
tSRMThermophilic
Sulphate-Reducing Microorganisms
mSRMMesophilic
Sulphate-Reducing Microorganisms
Year Two
i. Oilfield Reservoir Cooling from Secondary Recovery
Figure 23. Development of TVS between Injector and ProducerPlatenkamp curves adapted from HSE Document ‘OTH 92 385’
32
Moving thermal front over time
during secondary recovery
Injector Producer
mSRM
tSRM
tSRMThermophilic
Sulphate-Reducing Microorganisms
mSRMMesophilic
Sulphate-Reducing Microorganisms
Year Three
i. Oilfield Reservoir Cooling from Secondary Recovery
Figure 23. Development of TVS between Injector and ProducerPlatenkamp curves adapted from HSE Document ‘OTH 92 385’

Radial Flood of Injected Water
33
Representative flow of injectionwater from injector to producer
mSRM
tSRM
Figure 24. Model Illustrating Radial Flood of Injection WaterAdapted from HSE Document ‘OTH 92 385’

“Pie Slice” Flood of Injected Water
34
Simplified flow of injectionwater from injector to producer
mSRM
tSRM
Figure 25. Model Illustrating Injection Water Swept into a Single ‘Pie Slice’Adapted from HSE Document ‘OTH 92 385’

35
2. Development of Souring in the Field
ii. Growth of Sulphate-Reducing Microorganisms
• Pressure / Temperature Conditions
• Surface Area

36
mSRM tSRM
ii. Growth of Sulphate-Reducing Microorganisms
Figure 26. Pressure vs. Temperature Growth Domains for mSRM and tSRM CulturesAdapted from HSE Document ‘OTH 92 385’

• Permeability: The ease with which a fluid can move through rock
37
ii. Growth of Sulphate-Reducing Microorganisms
HIGH LOW
2d 200md 20md
Figure 27. Varying Rock Formations and Permeabilitieshttps://blogs.egu.eu/network/water-underground/2015/09/03/how-easily-does-our-
understanding-of-crustal-permeability-flow-a-new-geofluids-special-edition/

• Fracturing
In addition to natural fractures, there are two key modes of fracturing from Operations:
1. Thermally-Induced Fracturing (TIF)
2. Pressure-Induced Fracturing (PIF)
Higher degree of fracturing Greater Surface Area for Microbial Colonisation38
ii. Growth of Sulphate-Reducing Microorganisms
Figure 28. Varying Rock Formations and Permeabilitieshttps://www.researchgate.net/figure/The-double-porosity-model-
proposed-by-Warren-and-Root_fig1_316772637

39
2. Development of Souring in the Field
i. Oilfield Reservoir Cooling from Secondary Recovery
ii. Growth of Sulphate-Reducing Microorganisms (SRM)
iii. Transport of H2S to the Producer
iv. Partitioning of H2S from the water to the oil and gas phases at specified conditions

40
2. Development of Souring in the Field
Figure 2. Typical Souring Forecasting Profile

NACE MR0175 Standard
41
Figure 19. NACE MR0175 / ISO15156https://www.drillingcontractor.org/research-expands-as-sour-gas-
completion-challenges-increase-19044

Benefits of Forecasting
• Provides insight for implementing mitigation plans
• Vital for optimised, cost-effective treatment of sour gas fluid management
42
Figure 2. Typical Souring Forecasting Profile
Figure 21. Typical Souring Forecasting Profile 2
2. Development of Souring in the Field

3. Souring Control and Mitigation
‘Tried-and-tested’ methods of mitigating issues associated with sour gas production in the O&G industry are limited.
• Water Injection Management
• Production Water Management
43
Sulphate Hydrogen SulphideSO4
2- H2S
Sulphate-Reducing Microorganism (SRM)

3. Souring Control and Mitigation; Water Injection Management
Sulphate Removal from Injection Water
• Historically for scale control
• Significantly reduces biogenic souring
• Enhanced oil recovery benefits
• Expensive
• Removal of sulphate from producedwater (PW) not currently possible
44
Sulphate Hydrogen SulphideSO4
2- H2S
Sulphate-Reducing Microorganism (SRM)

3. Souring Control and Mitigation; Water Injection Management
Nitrate Dosing in Injection Water
• Microorganisms preferentially reduce nitrate
• Nitrogen production rather than sulphides
• Continued growth of downhole microbiology
• Remediation of sour field possible, butdelayed response
45
Nitrate NitrogenNO3
- N2
Sulphate Hydrogen SulphideSO4
2- H2S
SRM
NRM

3. Souring Control and Mitigation; Water Injection Management
Biocide Dosing in Injection Water
• Beneficial in maintaining downhole injectivity
• Demonstrates effective facilities souring control
• No enhanced growth of downhole microbiology
• Downhole reservoir souring control is stillunproven
46
Sulphate Hydrogen SulphideSO4
2- H2S
Sulphate-Reducing Microorganism (SRM)
3. Souring Control and Mitigation; Production Water Management
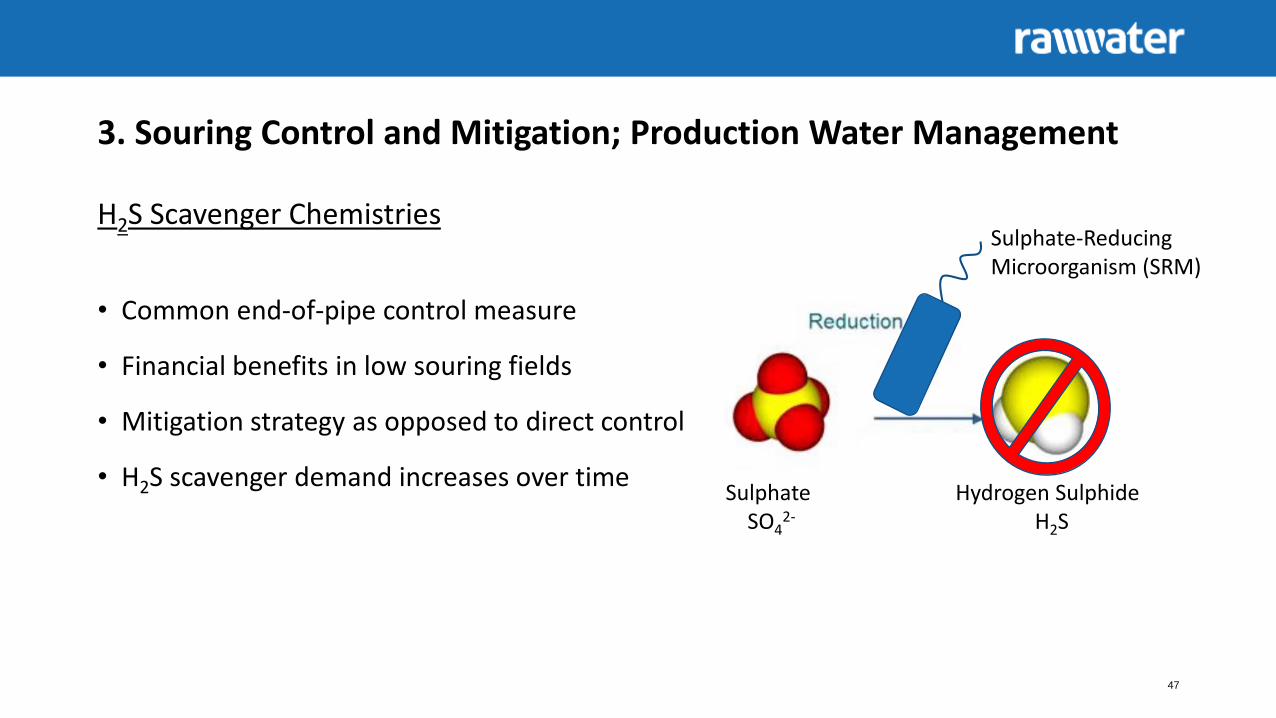
H2S Scavenger Chemistries
• Common end-of-pipe control measure
• Financial benefits in low souring fields
• Mitigation strategy as opposed to direct control
• H2S scavenger demand increases over time
47
Sulphate Hydrogen SulphideSO4
2- H2S
Sulphate-Reducing Microorganism (SRM)

3. Souring Control and Mitigation; Production Water Management
Each injector / producer pair is unique inits souring propensity
• Field economics
• Field logistics
• Geographical location
• Efficacy of treatment
Combined treatments are often implemented48
Sulphate Hydrogen SulphideSO4
2- H2S
Sulphate-Reducing Microorganism (SRM)

4. Case Study: A ‘Typical’ Souring Profile
49
• 4,000psig• 70oC• High injected bwpd
Figure 2. Typical Souring Forecasting Profile
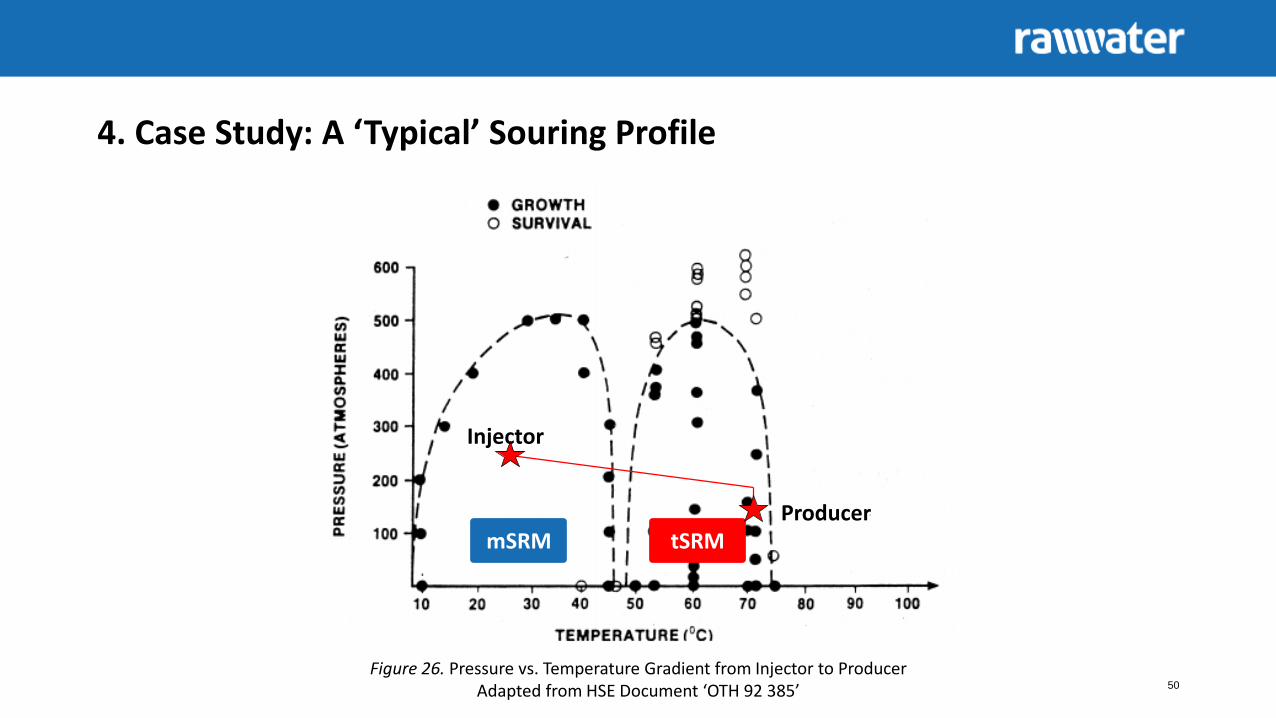
4. Case Study: A ‘Typical’ Souring Profile
50
mSRM tSRM
Injector
Producer
Figure 26. Pressure vs. Temperature Gradient from Injector to ProducerAdapted from HSE Document ‘OTH 92 385’
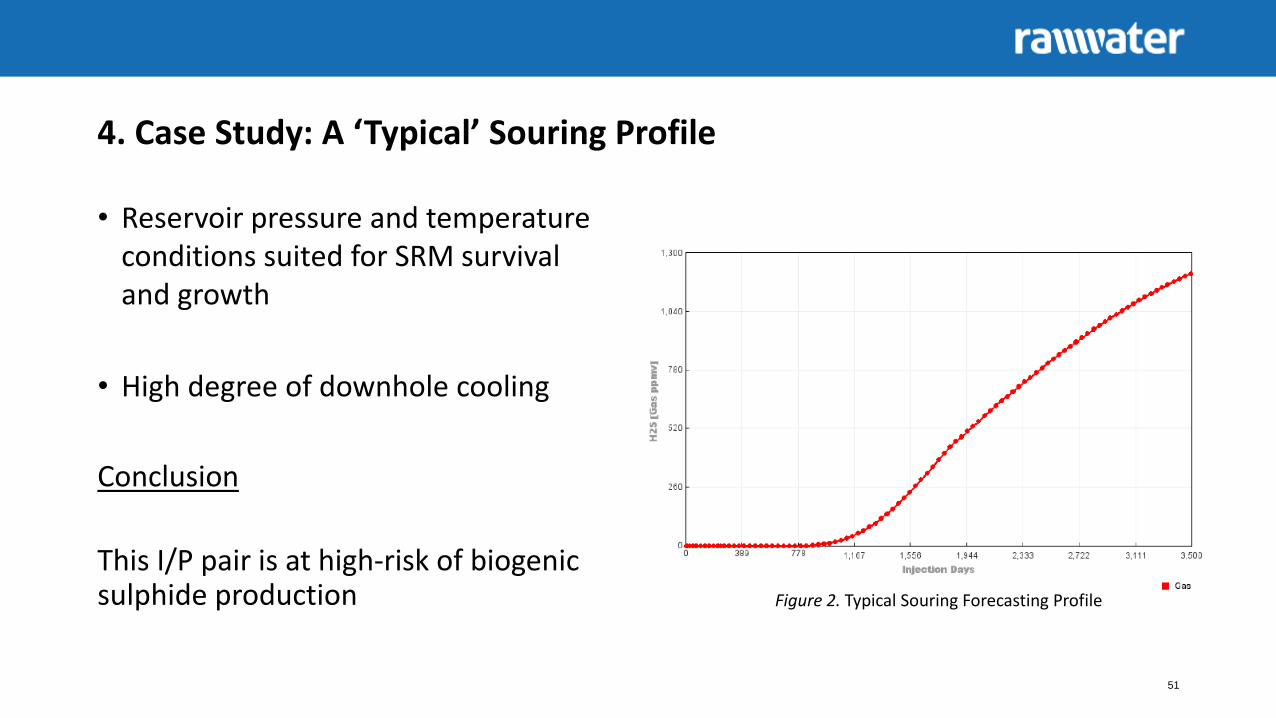
4. Case Study: A ‘Typical’ Souring Profile
• Reservoir pressure and temperature conditions suited for SRM survival and growth
• High degree of downhole cooling
Conclusion
This I/P pair is at high-risk of biogenic sulphide production
51
Figure 2. Typical Souring Forecasting Profile

4. Case Study: Ghanaian Souring Forecast
• Ghanaian Oilfield
• Offshore
• 7,500psig
• 110oC
• Low injected bwpd
• Possible low souring potential
52
Figure 29. Map of Ghanahttps://blog.continentalcurrency.ca/ghana-travel/

4. Case Study: Ghanaian Souring Forecast
53Figure 30. [Total Sulphide] Dataset from Pressurised Bioreactor Study

4. Case Study: Ghanaian Souring Forecast
54
• 7,500psig• 100oC• Low injected bwpd
Figure 31. Ghanaian Souring Forecasting Profile
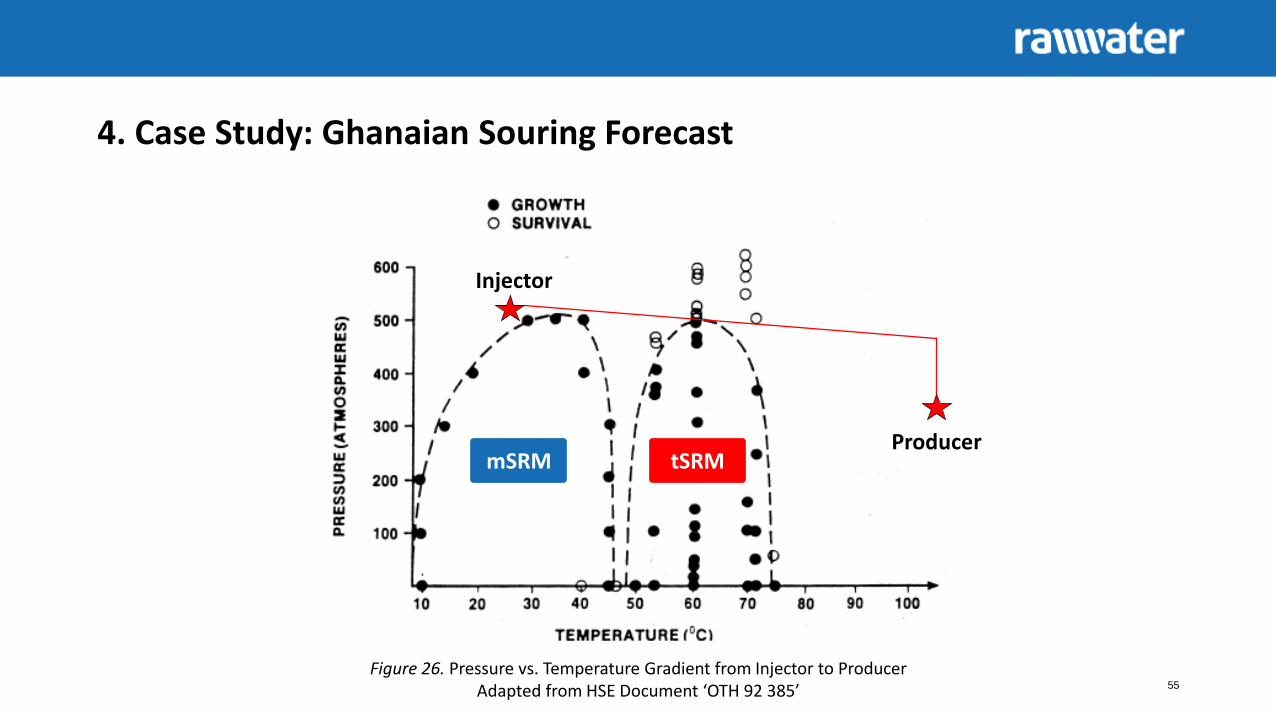
4. Case Study: Ghanaian Souring Forecast
55
mSRM tSRM
Injector
Producer
Figure 26. Pressure vs. Temperature Gradient from Injector to ProducerAdapted from HSE Document ‘OTH 92 385’

4. Case Study: Ghanaian Souring Forecast
• Relatively high reservoir pressure and temperature conditions
• Low degree of downhole cooling
Conclusion
Despite souring crude, no significant souring at PTQ
56
Figure 31. Ghanaian Souring Forecasting Profile
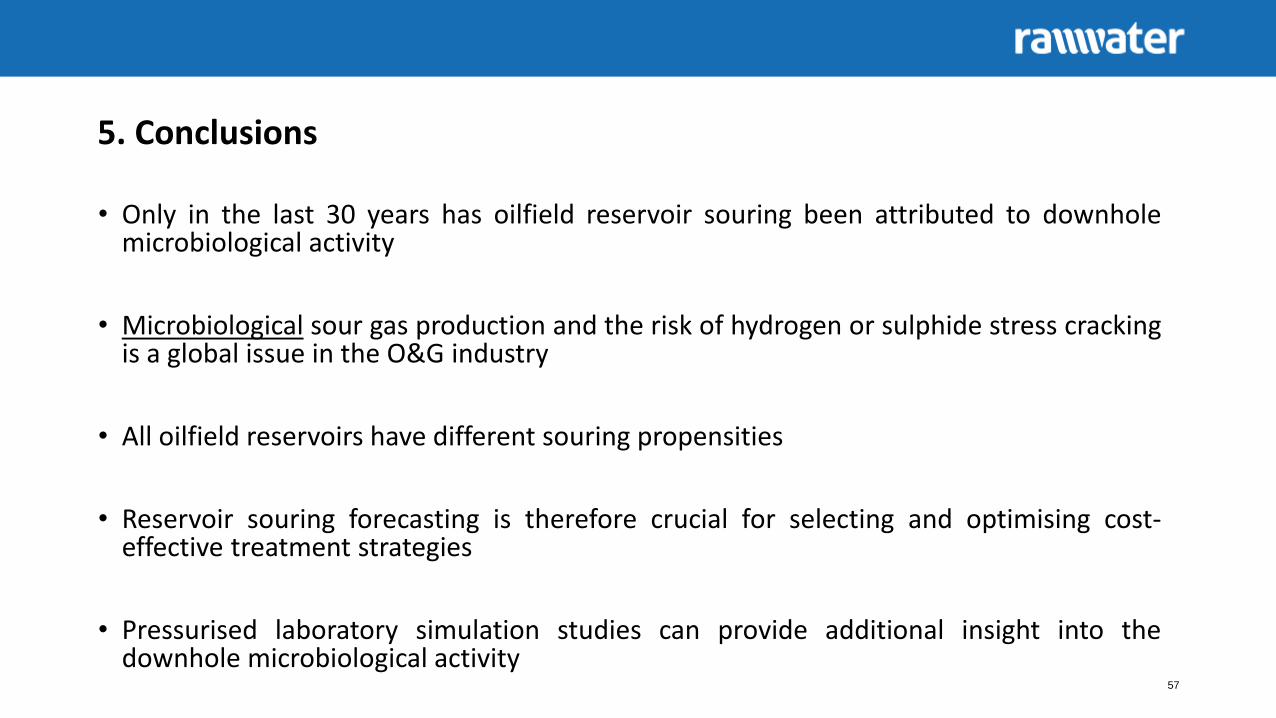
5. Conclusions
• Only in the last 30 years has oilfield reservoir souring been attributed to downholemicrobiological activity
• Microbiological sour gas production and the risk of hydrogen or sulphide stress crackingis a global issue in the O&G industry
• All oilfield reservoirs have different souring propensities
• Reservoir souring forecasting is therefore crucial for selecting and optimising cost-effective treatment strategies
• Pressurised laboratory simulation studies can provide additional insight into thedownhole microbiological activity
57

This presentation, the associated media, and the content contained within are the sole property of Rawwater Engineering Company Limited, part of the Rawwater Group, and are covered by copyright and intellectual property legislation. Reproduction, redistribution, or modification of this document either in part or whole is not permitted without prior written consent from Rawwater Engineering Company Limited.
If you have received this presentation in error you must inform Rawwater Engineering Company Limited using the contact information on the last slide and then destroy your copy.
Failure to comply with the above may result in legal action.
58

RAWWATER ENGINEERING COMPANY LIMITEDCULCHETH ENTERPRISE CENTRE
WITHINGTON AVENUECULCHETH
WA3 4JE
T: +44 (0) 1925 768910E: [email protected]
WWW.RAWWATER.COM
59