An SVG Based Tool for Plane Geometry and Mathematics Education
17
An SVG Based Tool for Plane Geometry and Mathematics Education 1 Xun Lai and Paul Wang Department of Computer Science Kent State University [email protected] Abstract Geometry is an important part of mathematics. Described is a Scalable Vector Graphics (SVG) based system for teaching and learning geometry and mathematics. The work is part of the WME project for enhancing mathematics education using Web technologies. An SVG library for both diagramming and interactive geometry learning is created. Building on this library, a Web-based authoring tool, GeoSVG, makes creating interactive geometry and other mathematics lessons simple has been developed. GeoSite is a website that supports publishing manipulatives authored using GeoSVG. Teachers and other experts can easily create and share interoperable geometry- based experiments to illustrate mathematical concepts. GeoSVG and GeoSite combine to provide a complete authoring, teaching, and learning environment with plane geometry manipulatives. Key Words: Dynamic Geometry Software (DGS), Geometry, GeoSite, GeoSVG, Mathematics Education, Manipulative, SVG, WME, 1. Introduction At the Institute for Computational Mathematics (ICM/Kent), we are developing WME (Web- based Mathematics Education) as a distributed system for supporting, enhancing, and delivering mathematics education at all levels. A pilot project puts WME to in-class trials at Kimpton Middle School (Munroe Falls, Ohio) [9]. Among the many features and advantages of WME [8], hands-on learning with interactive manipulatives, specifically tailored for individual concepts and skills being taught, remains critically important. To support diagramming, interactive learning, and easy authoring of geometrical manipulatives, we created a system called GeoSVG. Simply put, the purpose of GeoSVG is to enable anyone, from specialists to school teachers, to easily create, share, modify, and deploy geometry-based interactive manipulatives to teach students mathematical concepts. Developed as part of the entire WME system, GeoSVG also can be used independently. Scalable Vector Graphics (SVG) is a W3C standard for describing two-dimensional vector graphics in XML. It contains two parts: an XML-based file format and a programming API for graphical applications [1]. Key features include shapes, text, and embedded raster graphics with many different painting styles. It supports scripting through languages such as ECMAScript which accesses SVG Document Object Model (SVGDOM) and has comprehensive support for animation. Web browsers such as Netscape, Mozilla, and Firefox are starting to incorporate native 1 Work reported herein has been supported in part by the National Science Foundation under Grant CCR-0201772 and in part by an Ohio Board of Regents Research Challenge Grant. Any opinions, findings, and conclusions or recommendations expressed in this material are those of the authors and do not necessarily reflect the views of any funding agency.
Transcript of An SVG Based Tool for Plane Geometry and Mathematics Education

An SVG Based Tool for Plane Geometry and
Mathematics Education1
Xun Lai and Paul Wang Department of Computer Science
Kent State University [email protected]
Abstract
Geometry is an important part of mathematics. Described is a Scalable Vector Graphics (SVG) based system for teaching and learning geometry and mathematics. The work is part of the WME project for enhancing mathematics education using Web technologies. An SVG library for both diagramming and interactive geometry learning is created. Building on this library, a Web-based authoring tool, GeoSVG, makes creating interactive geometry and other mathematics lessons simple has been developed. GeoSite is a website that supports publishing manipulatives authored using GeoSVG. Teachers and other experts can easily create and share interoperable geometry-based experiments to illustrate mathematical concepts. GeoSVG and GeoSite combine to provide a complete authoring, teaching, and learning environment with plane geometry manipulatives. Key Words: Dynamic Geometry Software (DGS), Geometry, GeoSite, GeoSVG, Mathematics Education, Manipulative, SVG, WME, 1. Introduction At the Institute for Computational Mathematics (ICM/Kent), we are developing WME (Web-based Mathematics Education) as a distributed system for supporting, enhancing, and delivering mathematics education at all levels. A pilot project puts WME to in-class trials at Kimpton Middle School (Munroe Falls, Ohio) [9]. Among the many features and advantages of WME [8], hands-on learning with interactive manipulatives, specifically tailored for individual concepts and skills being taught, remains critically important. To support diagramming, interactive learning, and easy authoring of geometrical manipulatives, we created a system called GeoSVG. Simply put, the purpose of GeoSVG is to enable anyone, from specialists to school teachers, to easily create, share, modify, and deploy geometry-based interactive manipulatives to teach students mathematical concepts. Developed as part of the entire WME system, GeoSVG also can be used independently. Scalable Vector Graphics (SVG) is a W3C standard for describing two-dimensional vector graphics in XML. It contains two parts: an XML-based file format and a programming API for graphical applications [1]. Key features include shapes, text, and embedded raster graphics with many different painting styles. It supports scripting through languages such as ECMAScript which accesses SVG Document Object Model (SVGDOM) and has comprehensive support for animation. Web browsers such as Netscape, Mozilla, and Firefox are starting to incorporate native 1 Work reported herein has been supported in part by the National Science Foundation under Grant CCR-0201772 and in part by an Ohio Board of Regents Research Challenge Grant. Any opinions, findings, and conclusions or recommendations expressed in this material are those of the authors and do not necessarily reflect the views of any funding agency.

support for SVG, but before this integration is stabilized, most browsers currently rely on the Adobe SVG Viewer plug-in to display SVG. Since 1980, Dynamic Geometry Software (DGS) packages such as Cabri Geometry II [3], Geometer’s SketchPad [4], Cinderella [5], and Euclides [6], have been widely used in schools and colleges all over the world [2][16][17][18][19]. Such DGS packages, however, are stand-alone applications requiring installation and updates on each individual computer that uses the software. Another problem with these systems is sharing or reusing the manipulatives that had been created. Without systematic Web-based support, manipulatives are difficult to find and requires a particular DGS to execute and display. Furthermore, students are forced to use the DGS with many complicated authoring features that obscure and distract from the primary purpose of learning. JavaSketchPad is an effort to make SketchPad more Internet oriented (section 4.3). However, limitations remain. For example, authors still need to obtain Web space and understand how to embed and publish Java applets in Web pages. GeoSVG and GeoSite use a new approach to solve the above difficulties. GeoSVG is designed as a complete Web-based DGS. An author runs the authoring environment online, and saves the constructed manipulative on the GeoSite. Publishing a manipulative onto GeoSite is transparent to the user. Other users can immediately visit the newly constructed manipulative and either build upon it, use it, or learn from it. The SVG-based manipulatives can be easily included in educational Web pages, such as those in WME, and delivered via Web browsers to students in classrooms. GeoSVG manipulative support normally enables interactive manipulation excluding authoring features to help focus students on learning. All manipulatives created are saved on the GeoSite and organized on a virtual hard disk. A search function helps users locate manipulatives for different purposes. GeoSVG also works closely with WME, whose pilot site [7][8][9][10] already deploys many manipulatives generated by GeoSVG. WME delivers classroom-ready lessons that are well-prepared, interesting, effective, and interoperable. Lesson pages contain easy-to-use special-purpose manipulatives that help students understand and explore mathematical concepts and skills through hands-on activities. Manipulatives are parameterized for easy customization and object-oriented for interoperability [8]. GeoSVG makes it easy to generate configurable manipulatives for WME. 2. Goals of GeoSVG GeoSVG aims to be a robust, efficient, easy-to-use, Web-oriented, and standards-based tool for creating geometry manipulatives. The tool must support the drawing and hands-on manipulation of lines, curves, and other geometric objects for mathematics education. The generated manipulatives must be simple to incorporate into educational pages, such as WME lessons, interoperable with other Web page components, and customizable by users. The authoring and learning environments must be equivalent or exceed those of existing DGS systems. This section will discuss concepts and designs that help GeoSVG realize these goals. 2.1 Comprehensive Authoring Support A history of DGS is given in [11]. Characteristic features of DGS are presented in [12][13][14][15]. Many researchers have studied how DGS packages are used in teaching and how they affect students [2][16][17][18][19]. Generally, a good DGS system is expected to have the following authoring supports:
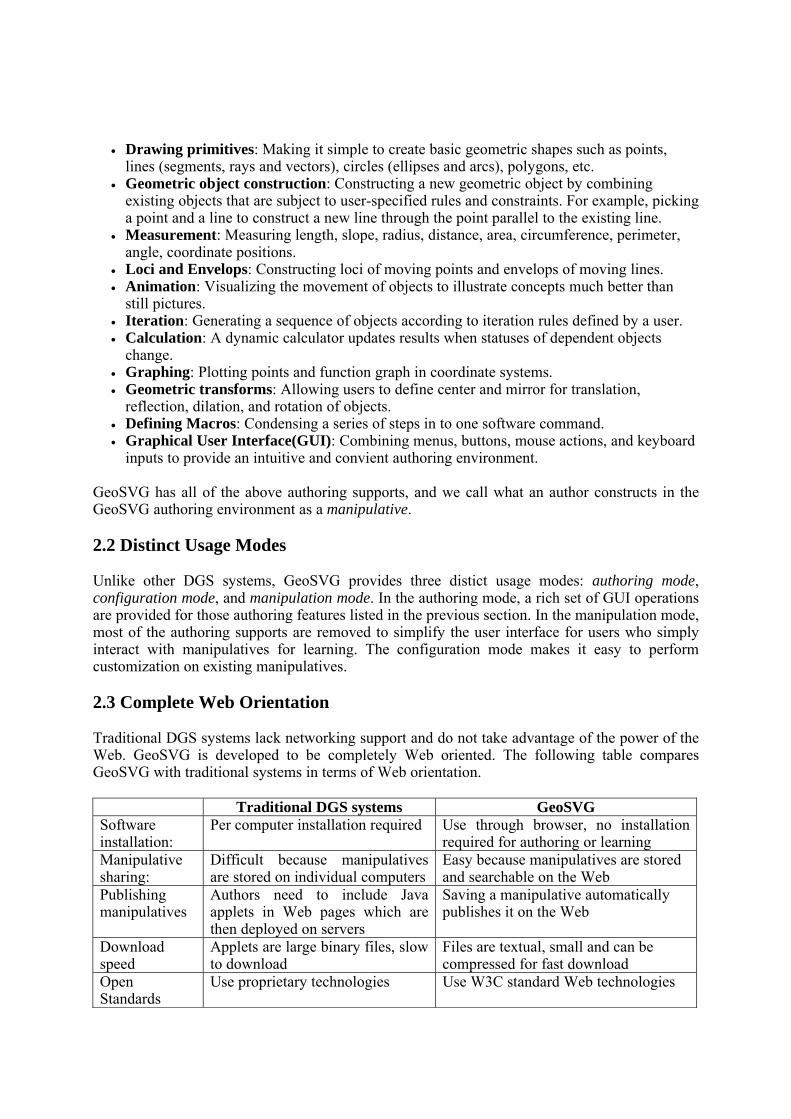
• Drawing primitives: Making it simple to create basic geometric shapes such as points, lines (segments, rays and vectors), circles (ellipses and arcs), polygons, etc.
• Geometric object construction: Constructing a new geometric object by combining existing objects that are subject to user-specified rules and constraints. For example, picking a point and a line to construct a new line through the point parallel to the existing line.
• Measurement: Measuring length, slope, radius, distance, area, circumference, perimeter, angle, coordinate positions.
• Loci and Envelops: Constructing loci of moving points and envelops of moving lines. • Animation: Visualizing the movement of objects to illustrate concepts much better than
still pictures. • Iteration: Generating a sequence of objects according to iteration rules defined by a user. • Calculation: A dynamic calculator updates results when statuses of dependent objects
change. • Graphing: Plotting points and function graph in coordinate systems. • Geometric transforms: Allowing users to define center and mirror for translation,
reflection, dilation, and rotation of objects. • Defining Macros: Condensing a series of steps in to one software command. • Graphical User Interface(GUI): Combining menus, buttons, mouse actions, and keyboard
inputs to provide an intuitive and convient authoring environment. GeoSVG has all of the above authoring supports, and we call what an author constructs in the GeoSVG authoring environment as a manipulative. 2.2 Distinct Usage Modes Unlike other DGS systems, GeoSVG provides three distict usage modes: authoring mode, configuration mode, and manipulation mode. In the authoring mode, a rich set of GUI operations are provided for those authoring features listed in the previous section. In the manipulation mode, most of the authoring supports are removed to simplify the user interface for users who simply interact with manipulatives for learning. The configuration mode makes it easy to perform customization on existing manipulatives. 2.3 Complete Web Orientation Traditional DGS systems lack networking support and do not take advantage of the power of the Web. GeoSVG is developed to be completely Web oriented. The following table compares GeoSVG with traditional systems in terms of Web orientation. Traditional DGS systems GeoSVG Software installation:
Per computer installation required Use through browser, no installation required for authoring or learning
Manipulative sharing:
Difficult because manipulatives are stored on individual computers
Easy because manipulatives are stored and searchable on the Web
Publishing manipulatives
Authors need to include Java applets in Web pages which are then deployed on servers
Saving a manipulative automatically publishes it on the Web
Download speed
Applets are large binary files, slow to download
Files are textual, small and can be compressed for fast download
Open Standards
Use proprietary technologies Use W3C standard Web technologies
2.4 Additional Features • Authoring assistance such as built-in functions for duplicating a group of objects • Incorporating foreign manipulatives with GeoSVG operations and objects. This ability can
help in constructing more sophisticated manipulatives. • Additional features include support for multiple coordinate systems, rulers and protractors
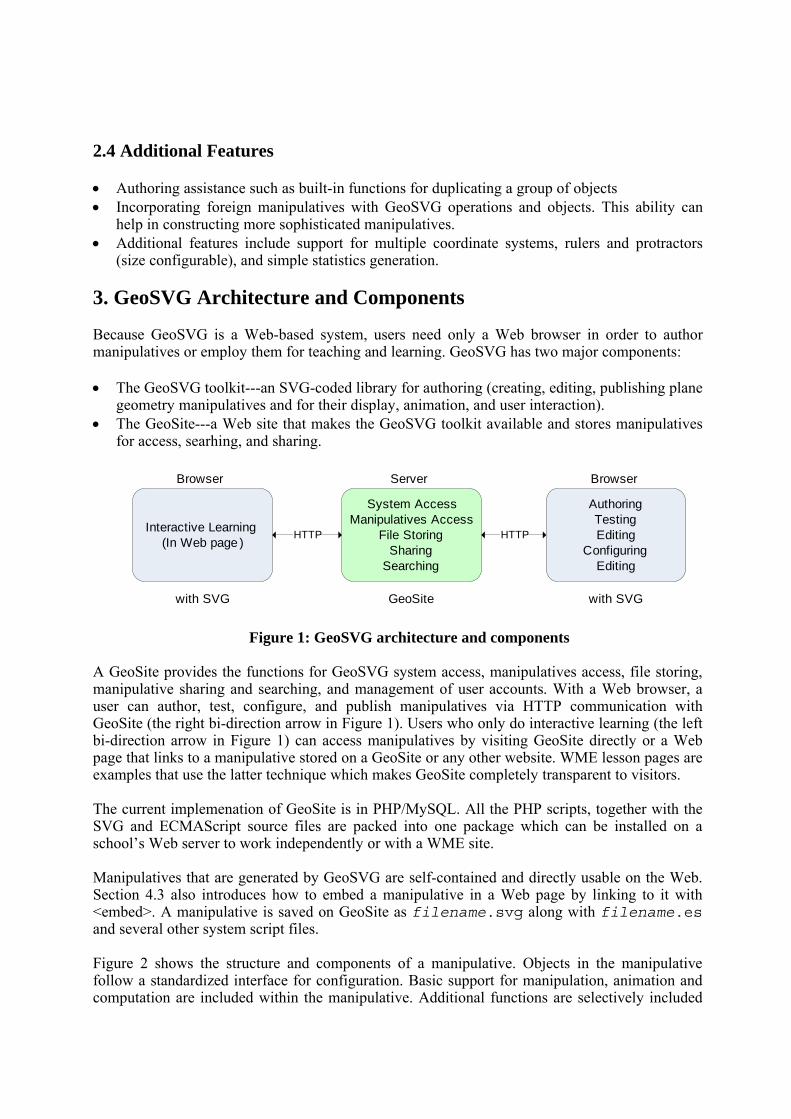
(size configurable), and simple statistics generation. 3. GeoSVG Architecture and Components Because GeoSVG is a Web-based system, users need only a Web browser in order to author manipulatives or employ them for teaching and learning. GeoSVG has two major components: • The GeoSVG toolkit---an SVG-coded library for authoring (creating, editing, publishing plane
geometry manipulatives and for their display, animation, and user interaction). • The GeoSite---a Web site that makes the GeoSVG toolkit available and stores manipulatives
for access, searhing, and sharing.
Interactive Learning(In Web page )
Browser
with SVG
System AccessManipulatives Access
File StoringSharing
Searching
Server
GeoSite
AuthoringTestingEditing
ConfiguringEditing
Browser
with SVG
HTTP HTTP
Figure 1: GeoSVG architecture and components A GeoSite provides the functions for GeoSVG system access, manipulatives access, file storing, manipulative sharing and searching, and management of user accounts. With a Web browser, a user can author, test, configure, and publish manipulatives via HTTP communication with GeoSite (the right bi-direction arrow in Figure 1). Users who only do interactive learning (the left bi-direction arrow in Figure 1) can access manipulatives by visiting GeoSite directly or a Web page that links to a manipulative stored on a GeoSite or any other website. WME lesson pages are examples that use the latter technique which makes GeoSite completely transparent to visitors. The current implemenation of GeoSite is in PHP/MySQL. All the PHP scripts, together with the SVG and ECMAScript source files are packed into one package which can be installed on a school’s Web server to work independently or with a WME site. Manipulatives that are generated by GeoSVG are self-contained and directly usable on the Web. Section 4.3 also introduces how to embed a manipulative in a Web page by linking to it with <embed>. A manipulative is saved on GeoSite as filename.svg along with filename.es and several other system script files. Figure 2 shows the structure and components of a manipulative. Objects in the manipulative follow a standardized interface for configuration. Basic support for manipulation, animation and computation are included within the manipulative. Additional functions are selectively included
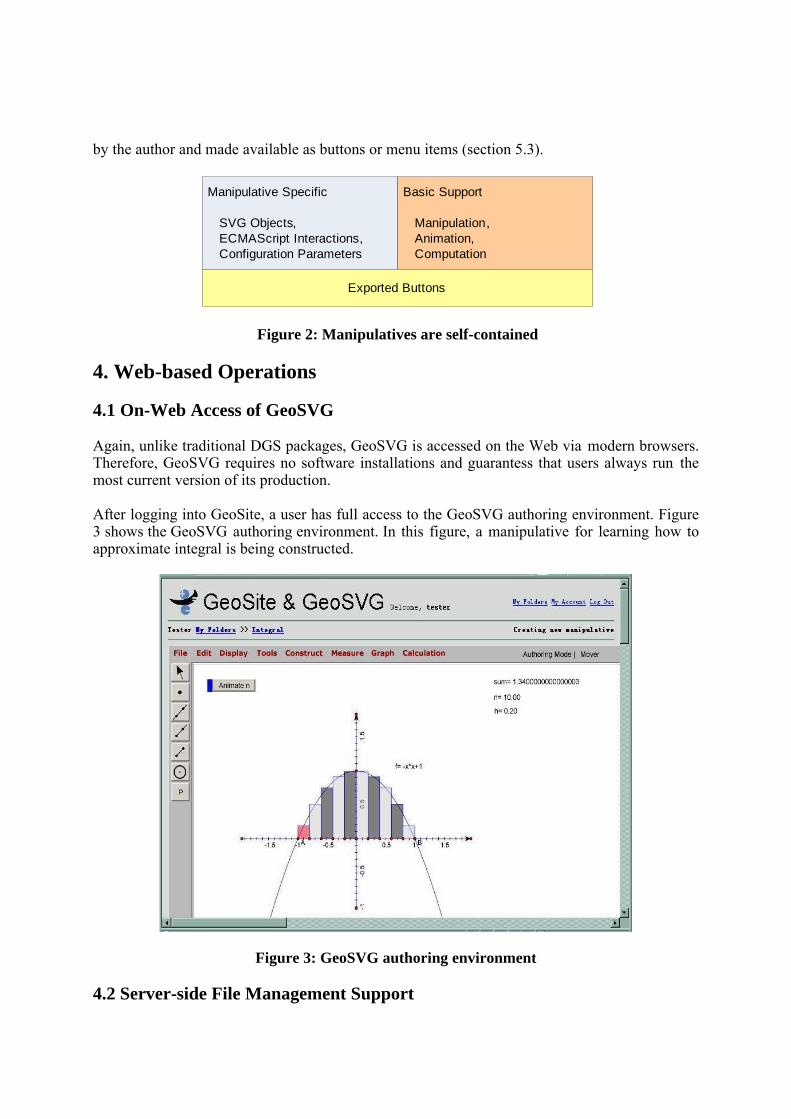
by the author and made available as buttons or menu items (section 5.3).
Manipulative Specific
SVG Objects, ECMAScript Interactions, Configuration Parameters
Basic Support
Manipulation, Animation, Computation
Exported Buttons
Figure 2: Manipulatives are self-contained
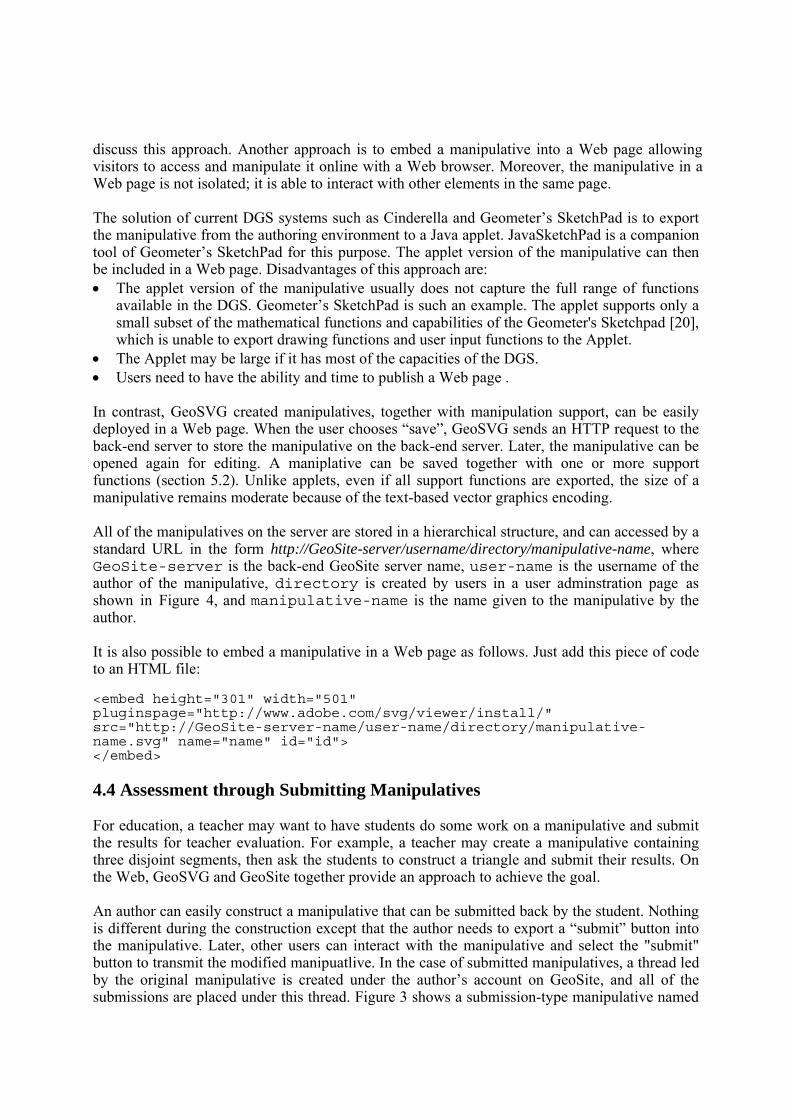
4. Web-based Operations 4.1 On-Web Access of GeoSVG Again, unlike traditional DGS packages, GeoSVG is accessed on the Web via modern browsers. Therefore, GeoSVG requires no software installations and guarantess that users always run the most current version of its production. After logging into GeoSite, a user has full access to the GeoSVG authoring environment. Figure 3 shows the GeoSVG authoring environment. In this figure, a manipulative for learning how to approximate integral is being constructed.
Figure 3: GeoSVG authoring environment 4.2 Server-side File Management Support

Published manipulatives are stored on a GeoSite for easy access and use in educational pages. After login, a user can create new folders and new manipulatives under his/her account, edit and configure (secion 5.3) existing manipulatives, move manipulatives to different folders, browse folders of any user, and copy or link to manipulatives that were constructed by others. Figure 4 shows the extended root directory belonging to the user, tester. An author can protect his/her files and folders with the following designations: • Private: Only the author can view the manipulative • Viewable: Other users can view and manipulate the manipulative • Copyable: Other users can copy the manipulative to their own folders Convenient search is important for file sharing. Search is performed on the following information. • Manipulative classification (Algebra, Fractions, Geometry, ..., 7th Grade, 8th Grade, ...)
indicated by the author. • Keywords assigned by the author. • Text within each manipulative.
Figure 4: GeoSite – directory for user “tester” 4.3 Direct Online Publishing of Manipulatives Consider the process of publishing a DGS generated manipulative online. This can be done in two ways. A basic approach is just to make the manipulative available for downloading. Users run it with their own installed DGS systems. In this way, nothing can be viewed online, so we will not
discuss this approach. Another approach is to embed a manipulative into a Web page allowing visitors to access and manipulate it online with a Web browser. Moreover, the manipulative in a Web page is not isolated; it is able to interact with other elements in the same page. The solution of current DGS systems such as Cinderella and Geometer’s SketchPad is to export the manipulative from the authoring environment to a Java applet. JavaSketchPad is a companion tool of Geometer’s SketchPad for this purpose. The applet version of the manipulative can then be included in a Web page. Disadvantages of this approach are: • The applet version of the manipulative usually does not capture the full range of functions
available in the DGS. Geometer’s SketchPad is such an example. The applet supports only a small subset of the mathematical functions and capabilities of the Geometer's Sketchpad [20], which is unable to export drawing functions and user input functions to the Applet.
• The Applet may be large if it has most of the capacities of the DGS. • Users need to have the ability and time to publish a Web page .
In contrast, GeoSVG created manipulatives, together with manipulation support, can be easily deployed in a Web page. When the user chooses “save”, GeoSVG sends an HTTP request to the back-end server to store the manipulative on the back-end server. Later, the manipulative can be opened again for editing. A maniplative can be saved together with one or more support functions (section 5.2). Unlike applets, even if all support functions are exported, the size of a manipulative remains moderate because of the text-based vector graphics encoding. All of the manipulatives on the server are stored in a hierarchical structure, and can accessed by a standard URL in the form http://GeoSite-server/username/directory/manipulative-name, where GeoSite-server is the back-end GeoSite server name, user-name is the username of the author of the manipulative, directory is created by users in a user adminstration page as shown in Figure 4, and manipulative-name is the name given to the manipulative by the author. It is also possible to embed a manipulative in a Web page as follows. Just add this piece of code to an HTML file: <embed height="301" width="501" pluginspage="http://www.adobe.com/svg/viewer/install/" src="http://GeoSite-server-name/user-name/directory/manipulative-name.svg" name="name" id="id"> </embed> 4.4 Assessment through Submitting Manipulatives For education, a teacher may want to have students do some work on a manipulative and submit the results for teacher evaluation. For example, a teacher may create a manipulative containing three disjoint segments, then ask the students to construct a triangle and submit their results. On the Web, GeoSVG and GeoSite together provide an approach to achieve the goal. An author can easily construct a manipulative that can be submitted back by the student. Nothing is different during the construction except that the author needs to export a “submit” button into the manipulative. Later, other users can interact with the manipulative and select the "submit" button to transmit the modified manipuatlive. In the case of submitted manipulatives, a thread led by the original manipulative is created under the author’s account on GeoSite, and all of the submissions are placed under this thread. Figure 3 shows a submission-type manipulative named

“Construct a triangle”, which is followed by two submissions from user tester2 and tester3. 5. GUI Views for Different Operational Modes 5.1 Why Three Modes? Logically, the usage of a DGS system should be divided into three modes: authoring mode, configuration mode, and manipulation mode. From the view of a school, users of these three modes correspond to three groups of users in a school: teachers who are very familar with the software, other teachers who want to use the manipulative, and students respectively. Unfortunately, traditional DGS systems do not explicitly define these three modes. Since traditional DGS systems are not Web-oriented, three modes are all under the same software environment, and have full capability of the software. Consequently, three groups of users all need to know how to use the software to some extent. However, a teacher may just want to simply configure a pre-made manipulative without necessarily having to understand the complexities of GeoSVG. Another example: If all of the authoring features are exported along with the manipulative, a student may become more interested in their usage rather than the lesson at hand. 5.2 Authoring mode of GeoSVG In the authoring mode, a user who is familiar with the software can construct the manipulative from scratch. GeoSVG provides comprehensive authoring supports listed in setcion 2.1. A rich set of GUI operations makes authoring intuitive and convenient. Such operations include selecting drawing primitives from the toolbar, selecting operations from the menu, placing buttons and user inputs on the canvas, moving a coordinate system, stretching an axis and so on. 5.3 Manipulation mode of GeoSVG The mainpulation mode is for users who simply interact with manipulatives for teaching and learning. We must remove the authoring supports from the GUI lest they obscure and distract from the learning experience. Thus, in the manipulation mode, authoring related operations such as the menu and toolbar are removed. Basic interactive manipulations such as object dragging and data entry remain available. This way, students have no chance to be deviated from learning. This does not mean that the manipulation mode has less tools than the authoring mode. In case some authoring mode operations are needed for a manipulative, the author can select them for inclusion very simply. In the authoring mode, an author may choose to export any of the menu functions as a menu or a button to a manipulative. Thus, an author can include none, some, or all authoring environment capabilities in a particular manipulative. For example, a teacher wants students to understand triangles. If the students knows nothing about the software, the teacher can draw a triangle in advance in the authoring mode, and ask the the students to drag the vertices or edges in the manipulation mode. If the students understands more, the teacher can export the functions of drawing points and lines to the manipulative, and ask the students to draw a triangle themselves. 5.4 Configuration mode of GeoSVG
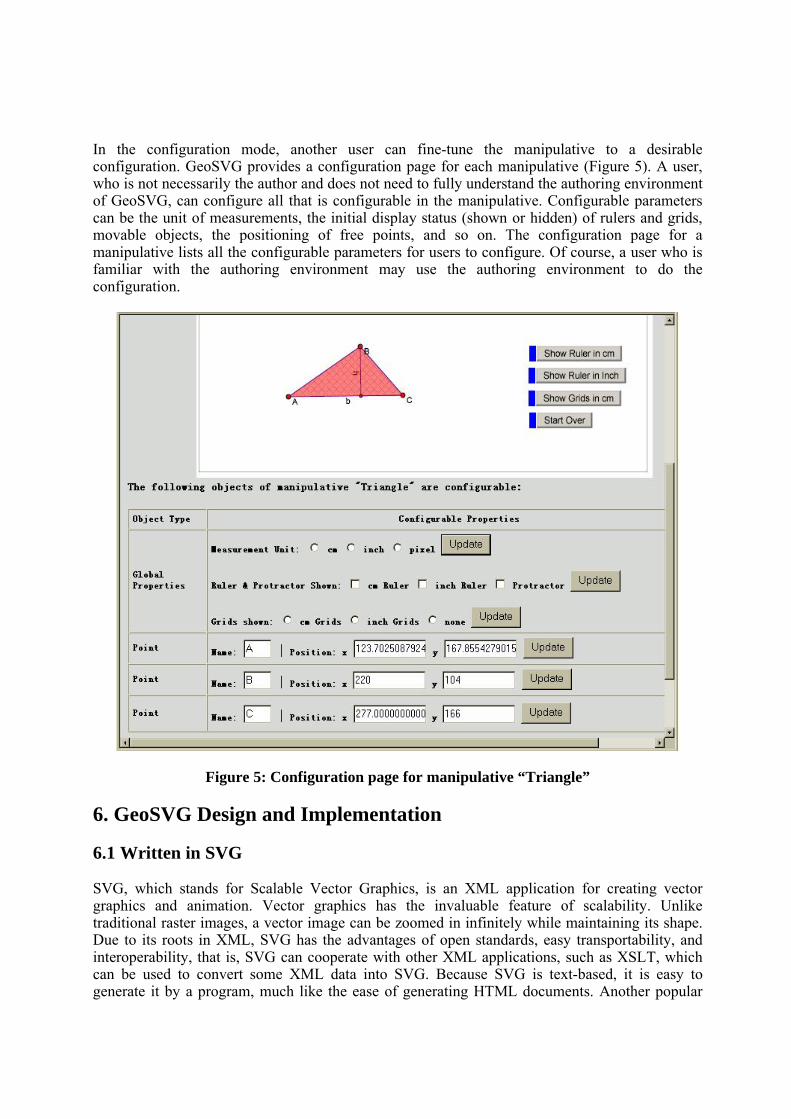
In the configuration mode, another user can fine-tune the manipulative to a desirable configuration. GeoSVG provides a configuration page for each manipulative (Figure 5). A user, who is not necessarily the author and does not need to fully understand the authoring environment of GeoSVG, can configure all that is configurable in the manipulative. Configurable parameters can be the unit of measurements, the initial display status (shown or hidden) of rulers and grids, movable objects, the positioning of free points, and so on. The configuration page for a manipulative lists all the configurable parameters for users to configure. Of course, a user who is familiar with the authoring environment may use the authoring environment to do the configuration.
Figure 5: Configuration page for manipulative “Triangle” 6. GeoSVG Design and Implementation 6.1 Written in SVG SVG, which stands for Scalable Vector Graphics, is an XML application for creating vector graphics and animation. Vector graphics has the invaluable feature of scalability. Unlike traditional raster images, a vector image can be zoomed in infinitely while maintaining its shape. Due to its roots in XML, SVG has the advantages of open standards, easy transportability, and interoperability, that is, SVG can cooperate with other XML applications, such as XSLT, which can be used to convert some XML data into SVG. Because SVG is text-based, it is easy to generate it by a program, much like the ease of generating HTML documents. Another popular

vector graphics format, Flash, which is in binary format, has inherent difficuties for providing these supports. SVG provides sophisticated coordinate transformation functions. SVG elements can also be grouped together, and transformations such as translate, scale, rotate, and skew can be applied to the entire group. Relative coordinates between objects in the same group do not change. This is an outstanding convenience in terms of programming. The animation features of SVG are based on the SMIL2 (Synchronized Multimedia Integration Language Level 2) specification. Almost any attribribute of any element can be animated. 6.2 Object-oriented Design and Implementation The source code of GeoSVG can be decomposed into seven object-oriented components: 1) The classes MyMenu, MyButtonBar, MyButton, MyInput, MySelect, etc. to support a set of
GUI widgets (SVG does not have these built-in widgets). These widgets are used in the authoring environment, the property dialog box, and the calculator.
......... .........
Figure 6: Class GeoObject and its subclasses
GeoObjectg: SVGElement id: text parents: Array of GeoObjects children: Array of GeoObjects valid: bool visible: bool highlighted: bool d: integer BFSOrderIndex: integer
M updateData() redraw()
M
Point Line Circle Measurement Action-Button
LogicPolygon User- Input
FreePoint PointOnObject IntersectionPoint TransformPoint PlotPoint
MidPoint VectorSumPoint PerpendicularPoint PivotPoint CopyPoint
AnglePoint UnitPoint AxisPositiveEndPoint AxisNegativeEndPoint
Irregular

2) The class GeoObject and its subclasses whose instances represent the objects an author creates on the canvas. Figure 6 shows the hierarchical organization of these classes. The superclass GeoObject defines the common properties and methods. Its direct subclasses, Point, Line, Circle, Polygon, Measurement, Logic, ActionButton, UserInput, and Irregular represent nine types of objects an author can create on the canvas. These classes may be inherited again for different types of objects. As shown in Figure 6, the class Point has serveral subclasses, which in turn may have subclasses.
3) The class Canvas whose instance represents a bounded area on which a user can create and
manipulate objects. 4) The class System which provides many useful utilities. 5) The class EventHandler which handles mouse and keyboard events. 6) The classes Property, TabGroup and Tab for display and configuration of properties of an
object. Each subclass of GeoObject has at least one instance of class Tab as static variable. One instance of Tab corresponds to one tab page in the property dialog box of an object. An interface language is defined to initialize the data in the tab page, and to update an object after the tab page is changed. Figure 7 shows an example how to set an axis to rotate 45 degrees. This can be done via the property dialog box. We can see a tab named “angle” in the property dialog box. By clicking the button “calculator” to invoke the calculator, an author can set the rotation angle of the axis. The calculator can use numbers as well as any Measurement and UserInput objects as operands.
Figure 7: Example of a property tab

This property tab that sets the rotation angle is defined by the following interface language: <tab name=”angle” > <!-- defines the tab name --> <text text=”The angle at which the axis rotates:” x=”0” y=”1” />
<!-- shows static text --> <valueSrc x=”0” y=”3” prehandler=”Axis.anglePrehandler()”
posthandler=”Axis.anglePosthandler()” /> <!-- property defined by the calculator -->
</tab>
Elements inside a pair of opening and closing “tab” elements define the controls to be rendered in a tab page. Each control has x and y values to define its position, and two callback functions prehandler and posthandler to initialize the value of the control and update the object after value of the control is changed. ValueSrc in the example defines a special control which corresponds to a computation defined by the dynamic calculator. This interface language is also used for incorporating foreign manipulatives.
7) The class Calculator which supports dynamic calculation. A global variable refers to an
instance of the class Calculator. The calculator can be used to create measurement objects, set properties of an object based on other objects, define parameters, and define functions.
Figure 8 shows how the GeoSVG system integrates these components:
Menu Items and Toolbar
Canvas
Create new objects
Event HandlerMouse events invoke
Create new objectsUpdate old objects
GeoObject
Property Tab
DisplayProperty
ConfigureObject Interface Language
CalculatorInvoke
Return result
1
*
Figure 8: Integration of components in GeoSVG 7. Case Usage Example
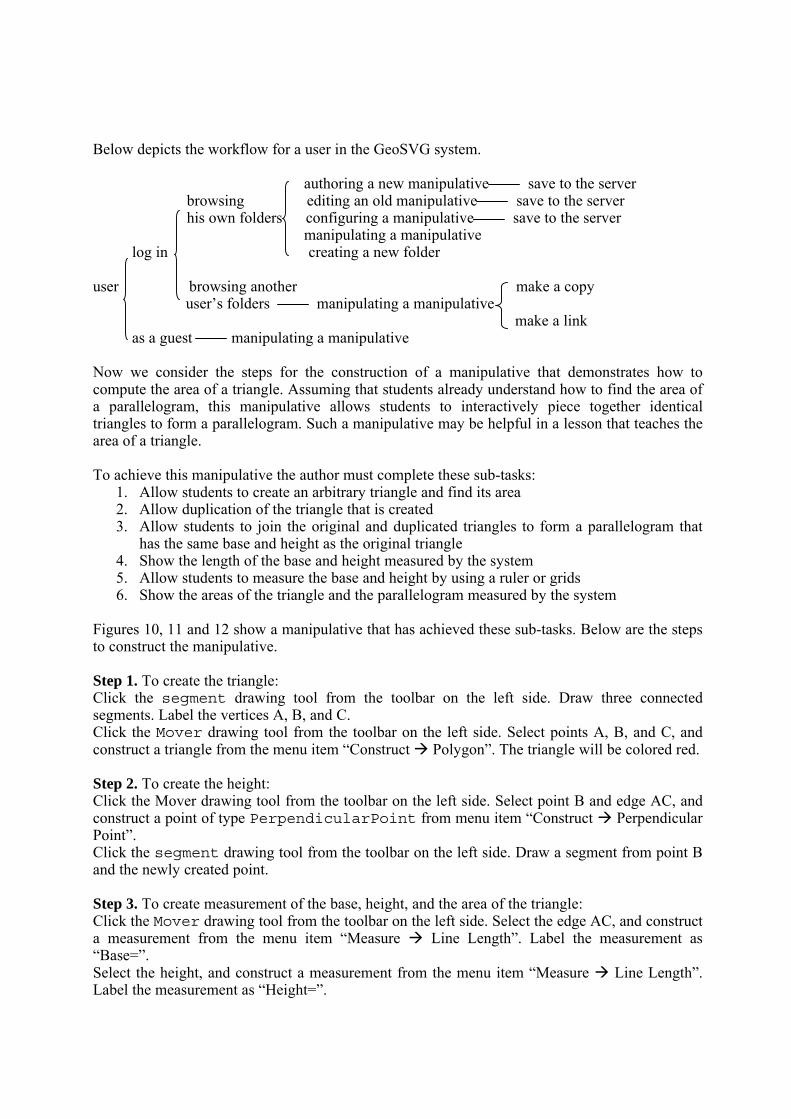
Below depicts the workflow for a user in the GeoSVG system. authoring a new manipulative save to the server browsing editing an old manipulative save to the server his own folders configuring a manipulative save to the server manipulating a manipulative log in creating a new folder user browsing another make a copy
user’s folders manipulating a manipulative make a link as a guest manipulating a manipulative Now we consider the steps for the construction of a manipulative that demonstrates how to compute the area of a triangle. Assuming that students already understand how to find the area of a parallelogram, this manipulative allows students to interactively piece together identical triangles to form a parallelogram. Such a manipulative may be helpful in a lesson that teaches the area of a triangle. To achieve this manipulative the author must complete these sub-tasks:
1. Allow students to create an arbitrary triangle and find its area 2. Allow duplication of the triangle that is created 3. Allow students to join the original and duplicated triangles to form a parallelogram that
has the same base and height as the original triangle 4. Show the length of the base and height measured by the system 5. Allow students to measure the base and height by using a ruler or grids 6. Show the areas of the triangle and the parallelogram measured by the system
Figures 10, 11 and 12 show a manipulative that has achieved these sub-tasks. Below are the steps to construct the manipulative. Step 1. To create the triangle: Click the segment drawing tool from the toolbar on the left side. Draw three connected segments. Label the vertices A, B, and C. Click the Mover drawing tool from the toolbar on the left side. Select points A, B, and C, and construct a triangle from the menu item “Construct Polygon”. The triangle will be colored red. Step 2. To create the height: Click the Mover drawing tool from the toolbar on the left side. Select point B and edge AC, and construct a point of type PerpendicularPoint from menu item “Construct Perpendicular Point”. Click the segment drawing tool from the toolbar on the left side. Draw a segment from point B and the newly created point. Step 3. To create measurement of the base, height, and the area of the triangle: Click the Mover drawing tool from the toolbar on the left side. Select the edge AC, and construct a measurement from the menu item “Measure Line Length”. Label the measurement as “Base=”. Select the height, and construct a measurement from the menu item “Measure Line Length”. Label the measurement as “Height=”.

Select the triangle, and construct a measurement from the menu item “Measure Polygon Area”. Label the measurement as “Area of the Triangle=”. Step 4. To duplicate the triangle: Select the triangle, and construct a duplicated triangle from the menu item “Duplicate a Polygon (rotatable)”. The duplicated triangle can be rotated around one vertex. Step 5. To create the movement buttons “Join” and “Join the Other Way” If you want point B’ moves to point C, and point C’ moves to point B as in Figure 9, select B’, C, C’, and B in order, then construct an Action Button Movement from the menu item “Edit
Action Button Movement”. Label the button “Join”. Create another button in the same way, and Label the button “Join the Other Way”.
Figure 9: Join two triangles
Step 6. To create the “Show Ruler in cm” button. We need to export an menu item as a button here. Select the menu item “Edit Export Menu Function”. Nothing happens when you select it. But next time when you select a menu item, it won’t be executed as usual. Instead that menu item will be exported as a button. So now select the menu item “Display Show Ruler in cm”. A button with label “Show Ruler in cm” will be placed on the canvas. Step 7. To create the button “Copy the Triangle” We want the duplicated triangle and the two buttons “Join” and “Join the other way” to be hidden initially. And they will be shown up after the “Copy the Triangle” button is clicked. Select the two buttons, and the duplicated triangle and its vertices and edges, and construct an Action Button Show from the menu item “Edit Action Button Show”. Label the button “Copy the Triangle”. Select the two buttons “Join” and “Join the other way”, and the duplicated triangle and its vertices and edges again, and hide them by clicking the menu item “Display Hide Object(s)”. Step 8. To set manipulable objects The triangles along with their vertices and edges should be manipulable. The user should not move buttons and measurements. An author can configure this through the property dialog box or from the menu item “Display Set Object(s) Manipulable”. Figure 10 shows a property dialog box that allows the author to set the property of individual object. Here shows the property of the triangle whose manipulable property is checked. Step 9. To save the manipulative Now the authoring of the manipulative is done. Save the manipulative to the server by clicking the menu item “File Save”. A window will pop up to ask the author to give a name to the manipulative. Below is a summary of how to construct the manipulative, to save it, and to use it in a WME page.
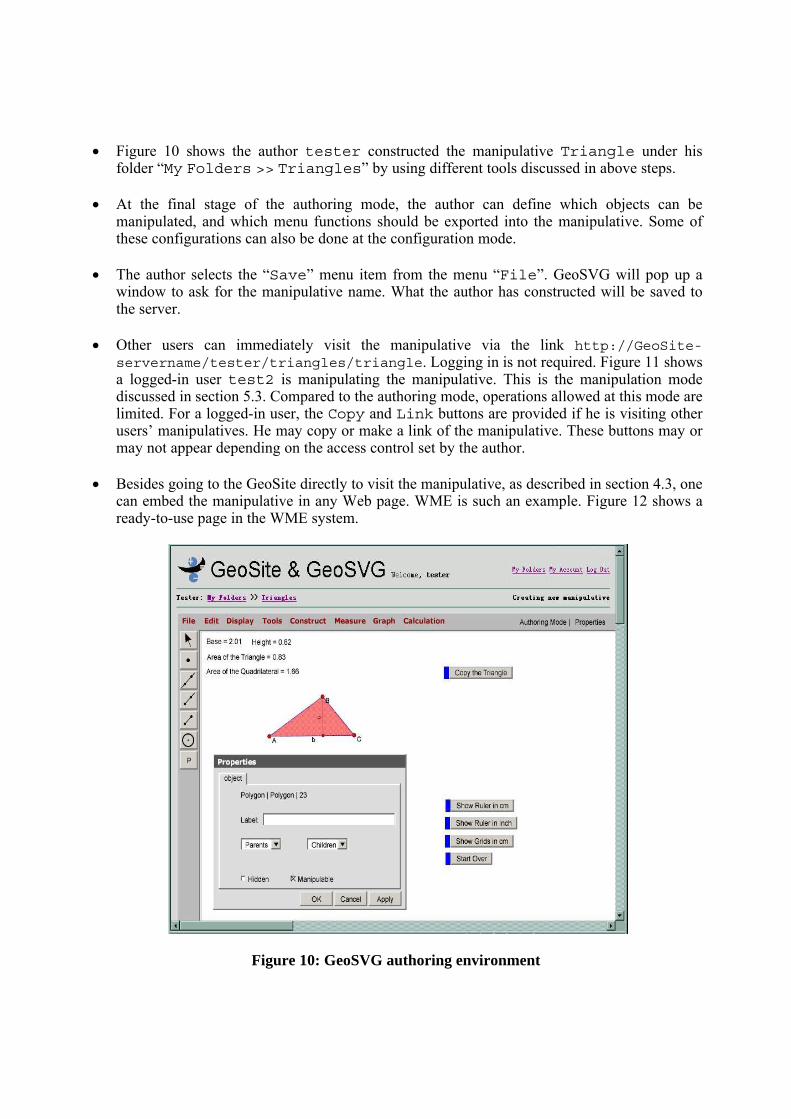
• Figure 10 shows the author tester constructed the manipulative Triangle under his folder “My Folders >> Triangles” by using different tools discussed in above steps.
• At the final stage of the authoring mode, the author can define which objects can be
manipulated, and which menu functions should be exported into the manipulative. Some of these configurations can also be done at the configuration mode.
• The author selects the “Save” menu item from the menu “File”. GeoSVG will pop up a
window to ask for the manipulative name. What the author has constructed will be saved to the server.
• Other users can immediately visit the manipulative via the link http://GeoSite-
servername/tester/triangles/triangle. Logging in is not required. Figure 11 shows a logged-in user test2 is manipulating the manipulative. This is the manipulation mode discussed in section 5.3. Compared to the authoring mode, operations allowed at this mode are limited. For a logged-in user, the Copy and Link buttons are provided if he is visiting other users’ manipulatives. He may copy or make a link of the manipulative. These buttons may or may not appear depending on the access control set by the author.
• Besides going to the GeoSite directly to visit the manipulative, as described in section 4.3, one
can embed the manipulative in any Web page. WME is such an example. Figure 12 shows a ready-to-use page in the WME system.
Figure 10: GeoSVG authoring environment
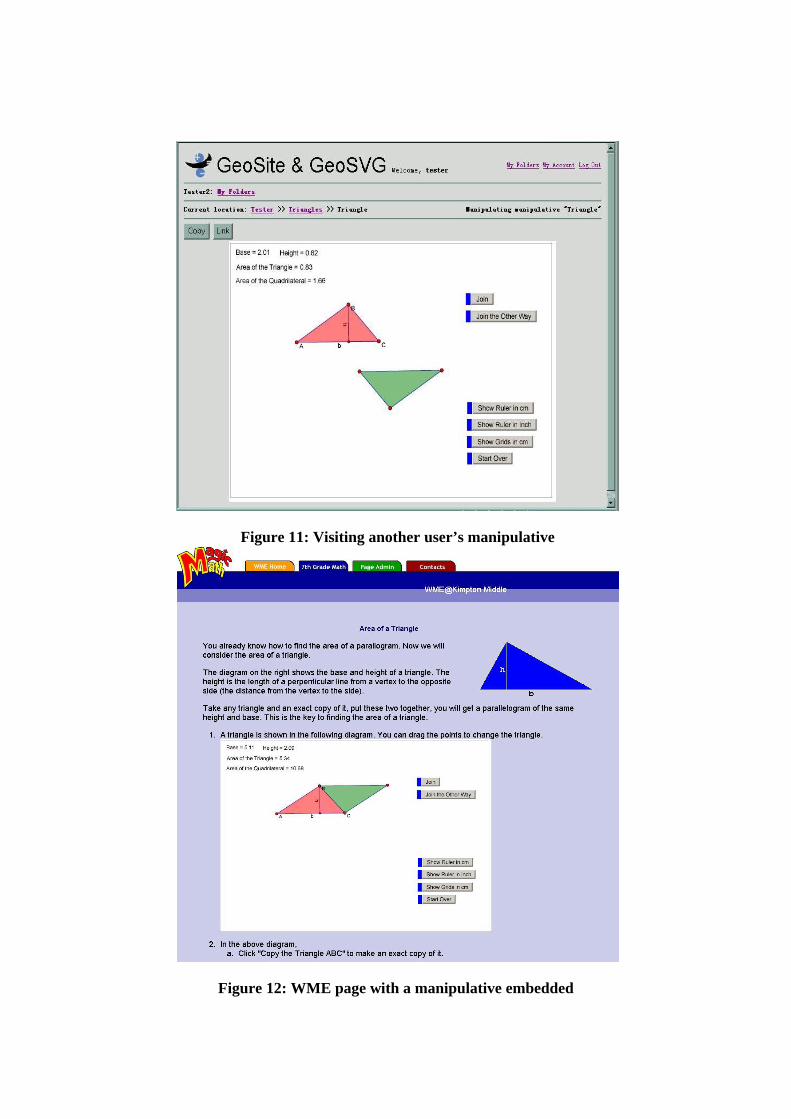
Figure 11: Visiting another user’s manipulative
Figure 12: WME page with a manipulative embedded

8. Future Work Compared to existing DGS systems, which are stand-alone applications, the response delay of GeoSVG is not as efficient when a manipulative consists of hundreds of objects. There are two main reasons. One is the algorithms GeoSVG is using. Another is that, unlike stand-alone application, there are too many layers between the GeoSVG and the operating system. A manipulation operation by the user goes through GeoSVG, the SVG viewer embedded in the browser, the browser, and the operating system. We are considering optimization of the GeoSVG algorithms. The interface language to integrate third party objects is still under testing. More experiments are needed to have a good solution. References [1] Jon Ferraiolo, Fujisawa Jun, and Dean Jackson, editors. Scalable Vector Graphics (SVG) 1.1 Specification, www.w3.org/TR/SVG/ W3C Recommendation 14 January 2003. [2] Adrian Oldknow, Dynamic geometry software - a powerful tool for teaching mathematics, not just geometry, The Third International Conference on Technology in Mathematics Teaching, Universität in Koblenz, Deutschland, Sept. 29-Oct. 2, 1997 [3] Cabri Geometry II [Computer software], http://www-cabri.imag.fr/cabri2/accueil-e.php [4] Jackiw, N., (1995). The Geometer’s Sketchpad, [Computer software], Emeryville, CA: Key Curriculum Press. [5] Cinderella [Computer software], http://www.cinderella.de/tiki-index.php [6] Euclides [Computer software], http://www.euklides.hu/eng/euklides.htm [7] WME Pilot Project, http://wme.cs.kent.edu/, Department of Computer Science, Kent State University [8] P. S. Wang, M. Mikusa, S. Al-shomrani, D. Chiu, X. Lai, and X. Zou. Features and Advantages of WME: a Web-based Mathematics Education System, Proceedings of the IEEE Southeast Conference, IEEE, Ft. Lauderdale, FL, April 8-10 2005, pp. 621-629. [9] Michael Mikusa, Paul S. Wang, David Chiu, Xun Lai, Xiao Zou. Web-based Mathematics Education Pilot Project, Conference on Information Technology in Education, Elizabethtown College Elizabethtown, PA, September 18, 2004. [10] Paul S. Wang, Yi Zhou and Xiao Zou. Web-based Mathematics Education: MeML Design and Implementation, Proceedings of IEEE/ITCC’2004, April 5-7 2004, Las Vegas, Nevada, pp. 169-175 [11] Daniel Scher, Lifting the Curtain: The Evolution of The Geometer's Sketchpad, Mathematics Educator, Vol. 10, Num 2, pp. 42-48 [12] Rudolf Sträßer, Research on Dynamic Geometry Software (DGS) - an introduction, International Reviews on Mathematical Education, Vol. 34 Num. 3, June 2002 [13] Ferdinando Arzarello; Federica Olivero; Domingo Paola; Ornella Robutti, A cognitive analysis of dragging practises in Cabri environments, International Reviews on Mathematical Education, Vol. 34 Num. 3, June 2002 [14] Gert Kadunz, Macros and Modules in Geometry, International Reviews on Mathematical Education, Vol. 34 Num. 3, June 2002 [15] Ana Paula Jahn, "Locus" and "Trace" in Cabri-géomètre: relationships between geometric and functional aspects in a study of transformations, International Reviews on Mathematical Education, Vol. 34 Num. 3, June 2002 [16] Thomas Gawlick, Towards a Theory of Visualization by Dynamic Geometry Software Paradigms, Phenomena, Principles, TSG 16: Visualisation in the teaching and learning of mathematics, http://www.icme-organisers.dk/tsg16/ [17] Işıl Üstün and Behiye Ubuz, Student’s Development of Geometrical Concepts Through a Dynamic Learning Environment, TSG 16: Visualisation in the teaching and learning of mathematics, http://www.icme-organisers.dk/tsg16/ [18] Kent D. Steen, Analyzing the impact of Web-based geometry applets on first grade students, Dissertation, University of Nebraska, Lincoln, Nebraska, 2002 [19] Alex Sandro Gomes and Gerard Vergnaud, On the Learning of geometric concepts using Dynamic Geometry Software, http://www.cinted.ufrgs.br/renote/mar2004/artigos/40-alexGomes.pdf, Interdisciplinary Center of New Technology in Education [20] Major Differences between JavaSketchpad and Desktop Sketchpad, http://www.keypress.com/sketchpad/javasketchpad/differences.php [21] Andrew H. Watt, Chris Lilley, SVG Unleashed, Sams; 1st edition