An Overview of Student Achievement Data - … Overview of Student Achievement Data ... • We...
55
12/05/2010 An Overview of Student Achievement Data Rhinebeck Central School District 2008-09 Prepared by Marvin Kreps Director of Curriculum and Instruction
Transcript of An Overview of Student Achievement Data - … Overview of Student Achievement Data ... • We...

12/05/2010
An Overview of Student Achievement Data
Rhinebeck Central School District
2008-09 Prepared by Marvin Kreps
Director of Curriculum and Instruction

12/05/2010
Our Mission The Rhinebeck Central School
District is an educational community that provides an
excellent learning environment and is dedicated to the development of every student’s generosity of spirit,
passion for learning, and ultimate success.

12/05/2010
Our Vision • The Rhinebeck Central School District meets the changing
needs of our community with courageous programming consistent with state standards and mindful of best learning practices.
• Each student enjoys an enriching experience while
mastering the skills and knowledge to reach their maximum potential.
• We educate our students to become self-directed learners,
complex thinkers, collaborative workers, quality producers, community contributors, and ethical decision-makers.

12/05/2010
Our Values • Safety and Health: Students and staff need a healthy and safe environment. • Resources: A successful education program requires appropriate facilities, equipment, and
materials. • Respect: We respect and honor the dignity and worth of ourselves, others, and our environment. • Responsibility: Each person is responsible for what he or she says and does. • Courage: Courage is required to grow, change, take risks, and make commitments. • Integrity: Personal integrity develops as one attends to and becomes increasingly ethical in one’s
speech and actions. Adults model this process. • Whole Child: In order for students to be successful, their emotional, social, physical, and
academic needs must be met. • Collaboration: The education of our students is a process involving the entire educational
community: students, teachers, administrators, non-instructional staff, Board of Education, families, and the community at large.
• Student Achievement: Continuous growth and improvement occur when there is use of best
practices, an articulated/aligned curriculum and pertinent data. • Recognition: Acknowledging and celebrating successes, large and small, nurtures growth and a
sense of community.

12/05/2010
What is Educational Assessment?
• It is a special kind of evidentiary argument. • Assessment is about reasoning from a handful of
particular things students say, do, or make, to more broadly cast valid and reliable inferences about what they know, have accomplished, or are apt to do in the future.

12/05/2010
Why we assess: • To guide the process of improving and changing education • To determine success of:
Individuals Programs Instruction Identified Groups
• Accountability: Summative Assessment • Information to guide intervention and policy decision-making • District and school level information about achievements,
improvement with respect to specific goals, and areas needing improvement: Formative Assessment
• Individual student information about achievement with respect to various goals set by the district

12/05/2010
New York State Assessments Elementary Percent Proficient
2001-02 2002-03 2003-04 2004-05 2005-06 2006-07 2007-08 2008-09
English Language
Arts 63% 80% 68% 78%
3: 73% 4: 80% 5: 79%
3: 82% 4: 82% 5: 82%
3: 73% 4: 80% 5: 92%
3: 85% 4: 78% 5: 94%
Mathematics 62% 88% 84% 91% 3: 88% 4: 85% 5: 73%
3: 93% 4: 92% 5: 79%
3: 92% 4: 90% 5: 92%
3: 96% 4: 88% 5: 91%
Science Grade 4
97% 92% 81% 82% 95% 99% 97% 95%
Social Studies Grade 5
99% 88% 86% 86% 94% 91% 95% 94%
*Percentage may not total 100 due to rounding.

12/05/2010
New York State Assessments ELA Grade 3-8
2008-09
Student Performance
Level Grade 3 Grade 4 Grade 5 Grade 6 Grade 7 Grade 8
Level 4 16 20% 10 11% 13 13% 4 5% 8 8% 6 6%
Level 3 53 65% 62 67% 79 81% 75 88% 82 81% 73 74%
Level 2 10 12% 18 20% 6 6% 6 7% 9 9% 18 18%
Level 1 2 2% 2 2% 0 0% 0 0% 2 2% 1 1%
% Proficient 85% 78% 94% 93% 89% 81%
Students Tested 81 92 98 85 101 98
*Percentage may not total 100 due to rounding.
12/05/2010
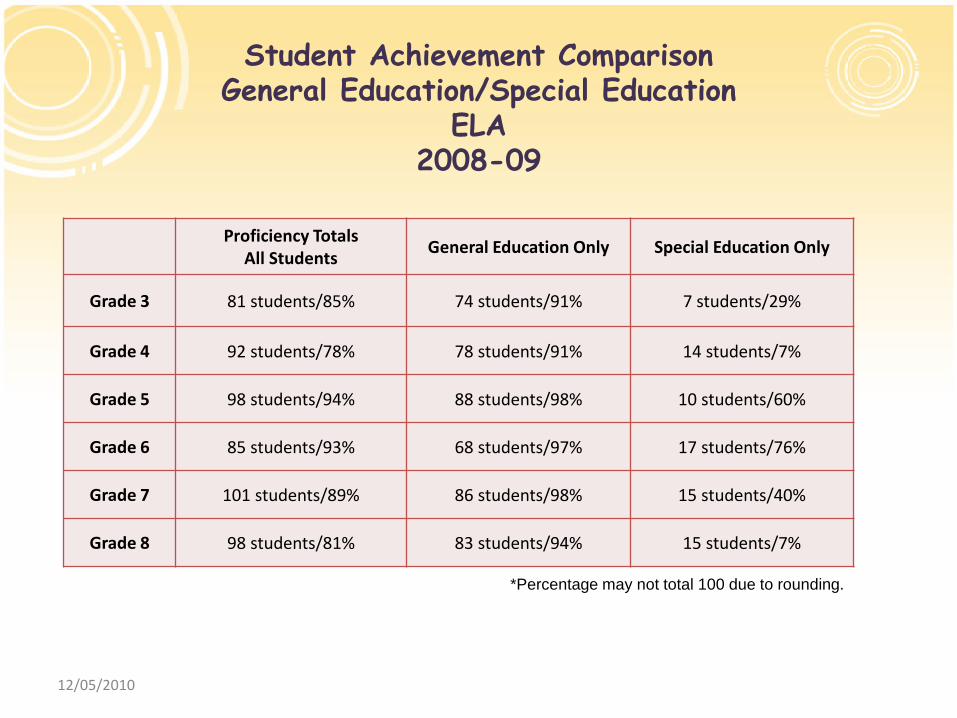
Student Achievement Comparison General Education/Special Education
ELA 2008-09
Proficiency Totals All Students General Education Only Special Education Only
Grade 3 81 students/85% 74 students/91% 7 students/29%
Grade 4 92 students/78% 78 students/91% 14 students/7%
Grade 5 98 students/94% 88 students/98% 10 students/60%
Grade 6 85 students/93% 68 students/97% 17 students/76%
Grade 7 101 students/89% 86 students/98% 15 students/40%
Grade 8 98 students/81% 83 students/94% 15 students/7%
*Percentage may not total 100 due to rounding.

12/05/2010
Trend Analysis - Grade Proficiency ELA Grades 3-8
*Percentage may not total 100 due to rounding.
12/05/2010
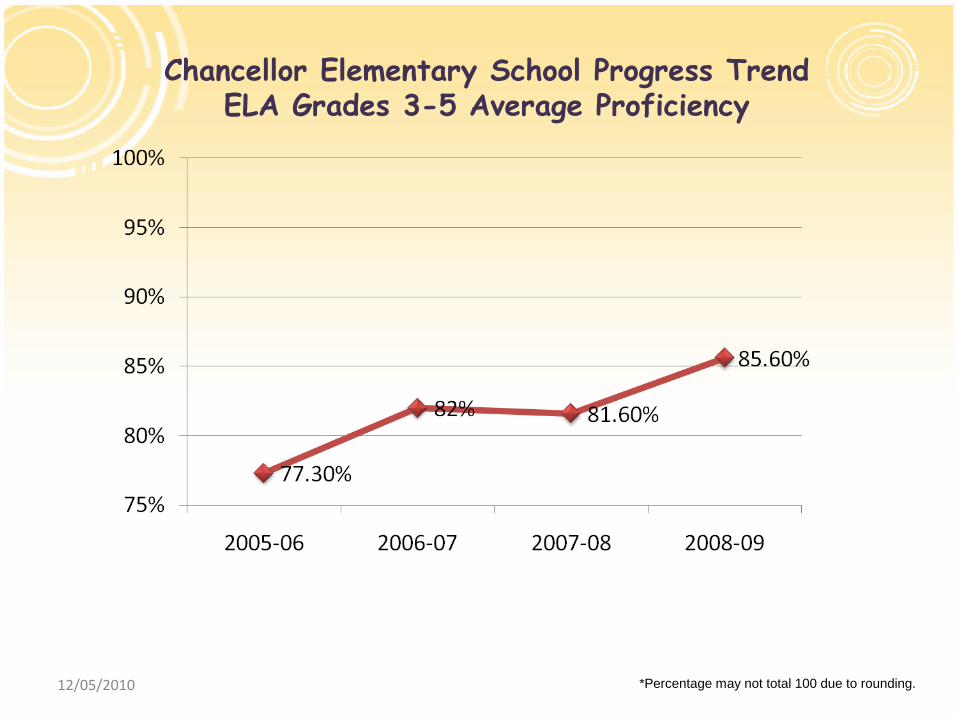
Chancellor Elementary School Progress Trend ELA Grades 3-5 Average Proficiency
*Percentage may not total 100 due to rounding.

12/05/2010
Grade Proficiency - ELA Grades 3-8
*Percentage may not total 100 due to rounding.
Grade 3 Grade 4 Grade 5 Grade 6 Grade 7 Grade 8
2005-06 73% 80% 79% 76% 74% 70%
2006-07 82% 82% 83% 82% 72% 78%
2007-08 73% 80% 92% 84% 86% 72%
2008-09 85% 78% 94% 93% 89% 81%
Cohort 2007 Cohort 2011
Cohort 2008 Cohort 2012
Cohort 2009 Cohort 2013
Cohort 2010 Cohort 2014

12/05/2010
Cohort Trend Analysis – ELA Grades 3-8
*Percentage may not total 100 due to rounding.

12/05/2010
Annual Measurable Objectives Using Performance Index ELA Grades 3-5
12/05/2010
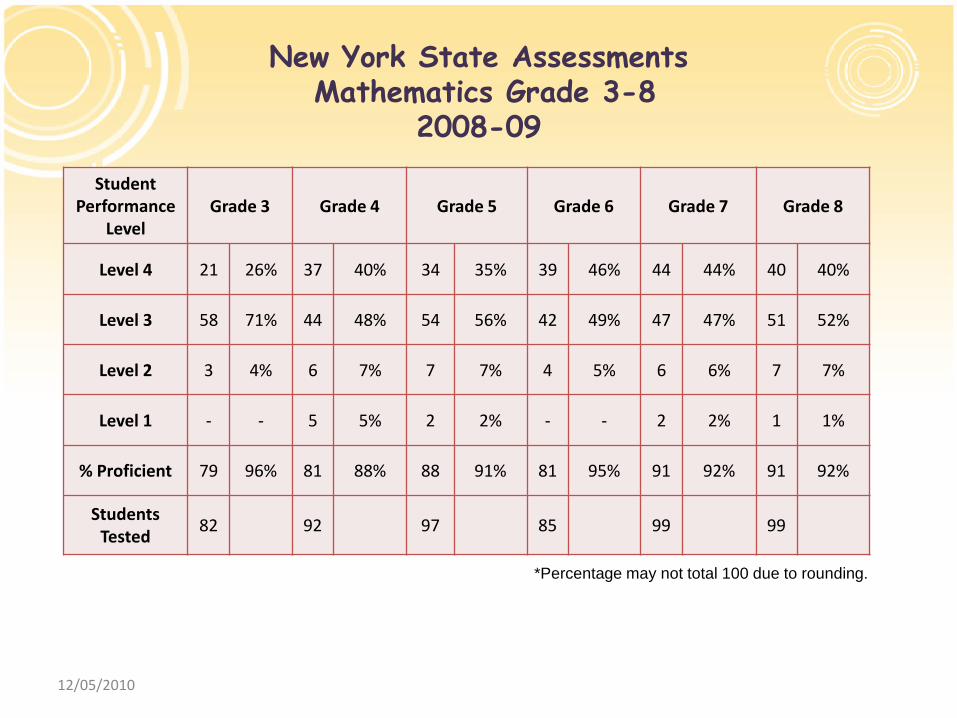
New York State Assessments Mathematics Grade 3-8
2008-09
Student Performance
Level Grade 3 Grade 4 Grade 5 Grade 6 Grade 7 Grade 8
Level 4 21 26% 37 40% 34 35% 39 46% 44 44% 40 40%
Level 3 58 71% 44 48% 54 56% 42 49% 47 47% 51 52%
Level 2 3 4% 6 7% 7 7% 4 5% 6 6% 7 7%
Level 1 - - 5 5% 2 2% - - 2 2% 1 1%
% Proficient 79 96% 81 88% 88 91% 81 95% 91 92% 91 92%
Students Tested 82 92 97 85 99 99
*Percentage may not total 100 due to rounding.

12/05/2010
Student Achievement Comparison General Education/Special Education
Mathematics 2008-09
Proficiency Totals All Students General Education Only Special Education Only
Grade 3 82 students/96% 75 students/99% 7 students/71%
Grade 4 92 students/88% 78 students/99% 14 students/29%
Grade 5 97 students/91% 87 students/95% 10 students/50%
Grade 6 85 students/95% 68 students/97% 17 students/88%
Grade 7 99 students/92% 84 students/100% 15 students/47%
Grade 8 99 students/92% 84 students/100% 15 students/47%
*Percentage may not total 100 due to rounding.

12/05/2010
Trend Analysis - Grade Proficiency Mathematics Grades 3-8
*Percentage may not total 100 due to rounding.
12/05/2010
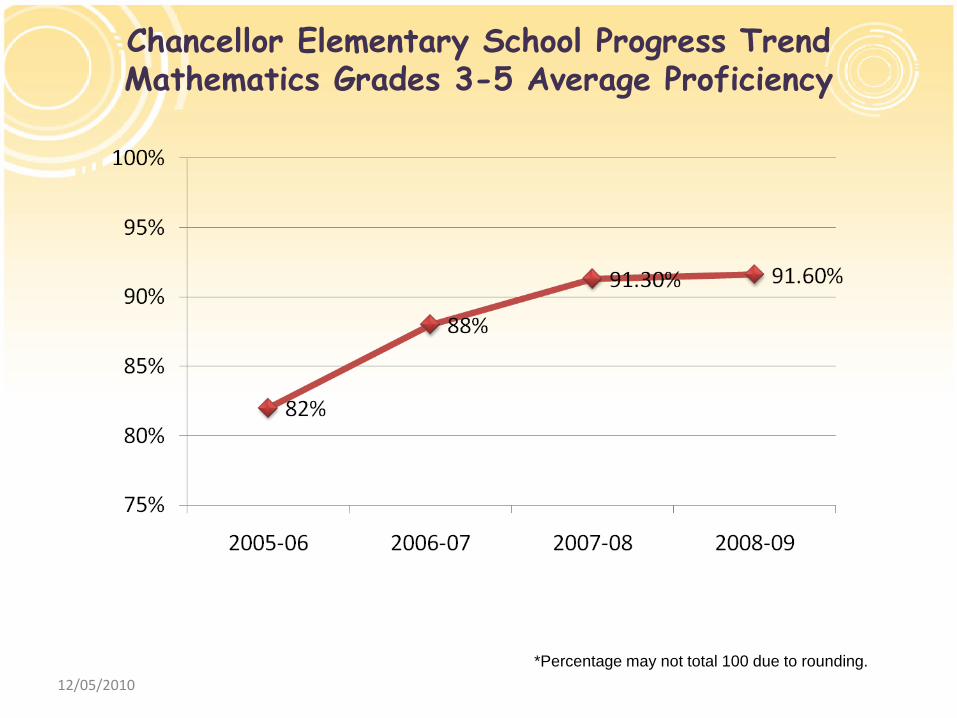
Chancellor Elementary School Progress Trend Mathematics Grades 3-5 Average Proficiency
*Percentage may not total 100 due to rounding.

12/05/2010
Grade Proficiency - Mathematics Grades 3-8
*Percentage may not total 100 due to rounding.
Grade 3 Grade 4 Grade 5 Grade 6 Grade 7 Grade 8
2005-06 88% 85% 73% 73% 82% 68%
2006-07 93% 92% 80% 87% 86% 86%
2007-08 92% 90% 92% 88% 95% 89%
2008-09 96% 88% 91% 95% 92% 92%
Cohort 2007 Cohort 2011
Cohort 2008 Cohort 2012
Cohort 2009 Cohort 2013
Cohort 2010 Cohort 2014

12/05/2010
Cohort Trend Analysis – Mathematics Grades 3-8
*Percentage may not total 100 due to rounding.

12/05/2010
Annual Measurable Objectives Using Performance Index Mathematics Grade 3-5
12/05/2010
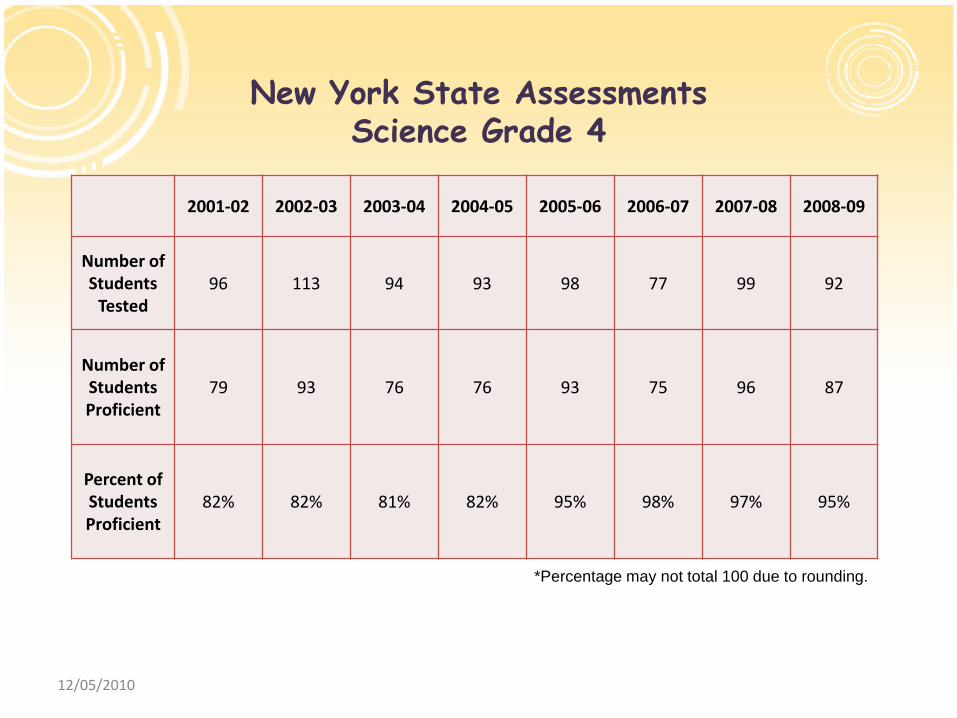
New York State Assessments Science Grade 4
*Percentage may not total 100 due to rounding.
2001-02 2002-03 2003-04 2004-05 2005-06 2006-07 2007-08 2008-09
Number of Students
Tested 96 113 94 93 98 77 99 92
Number of Students Proficient
79 93 76 76 93 75 96 87
Percent of Students Proficient
82% 82% 81% 82% 95% 98% 97% 95%

12/05/2010
Trend Analysis - Grade Proficiency Science Grade 4
*Percentage may not total 100 due to rounding.

12/05/2010
New York State Assessments Social Studies Grade 5
*Percentage may not total 100 due to rounding.
Student Performance
Level
2002- 2003
2003- 2004
2004- 2005
2005-2006
2006- 2007
2007-2008
2008-2009
Level 4 16 17% 55 46% 33 36% 46 47% 40 41% 25 32% 56 57%
Level 3 67 71% 47 40% 46 50% 46 47% 48 49% 50 63% 36 37%
Level 2 7 7% 9 8% 4 4% 4 4% 6 7% 4 5% 5 5%
Level 1 4 4% 6 5% 9 10% 2 2% 3 3% 0 0% 1 1%
% Proficient
(level 3 + 4) 83 88% 102 86% 79 86% 92 94% 88 91% 79 95% 92 94%

12/05/2010
Trend Analysis - Grade Proficiency Social Studies Grade 5
*Percentage may not total 100 due to rounding.

12/05/2010
New York State Assessments Elementary 100% Proficiency Gap
2009 Gap 2013-2014
English Language Arts 3: 85% 4: 78% 5: 94%
-15% -22% -6%
100%
Math
3: 96% 4: 88% 5: 91%
-4% -12% -9%
100%
Science - Grade 4
95%
-5%
100%
Social Studies - Grade 5
94%
-6%
100%
12/05/2010
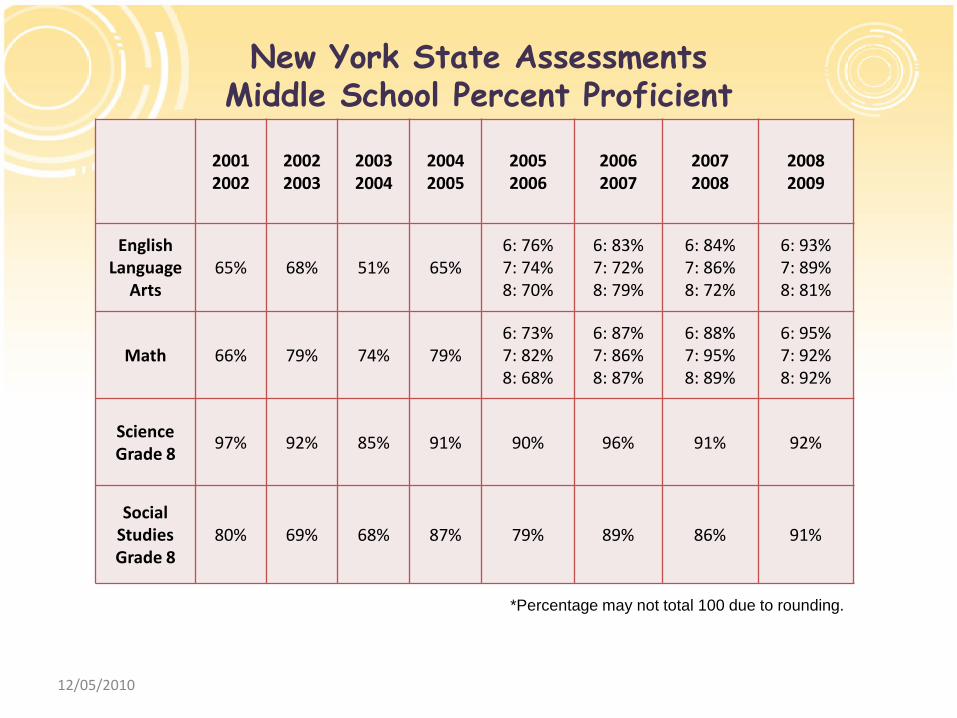
New York State Assessments Middle School Percent Proficient
*Percentage may not total 100 due to rounding.
2001 2002
2002 2003
2003 2004
2004 2005
2005 2006
2006 2007
2007 2008
2008 2009
English Language
Arts 65% 68% 51% 65%
6: 76% 7: 74% 8: 70%
6: 83% 7: 72% 8: 79%
6: 84% 7: 86% 8: 72%
6: 93% 7: 89% 8: 81%
Math 66% 79% 74% 79% 6: 73% 7: 82% 8: 68%
6: 87% 7: 86% 8: 87%
6: 88% 7: 95% 8: 89%
6: 95% 7: 92% 8: 92%
Science Grade 8 97% 92% 85% 91% 90% 96% 91% 92%
Social Studies Grade 8
80% 69% 68% 87% 79% 89% 86% 91%
12/05/2010
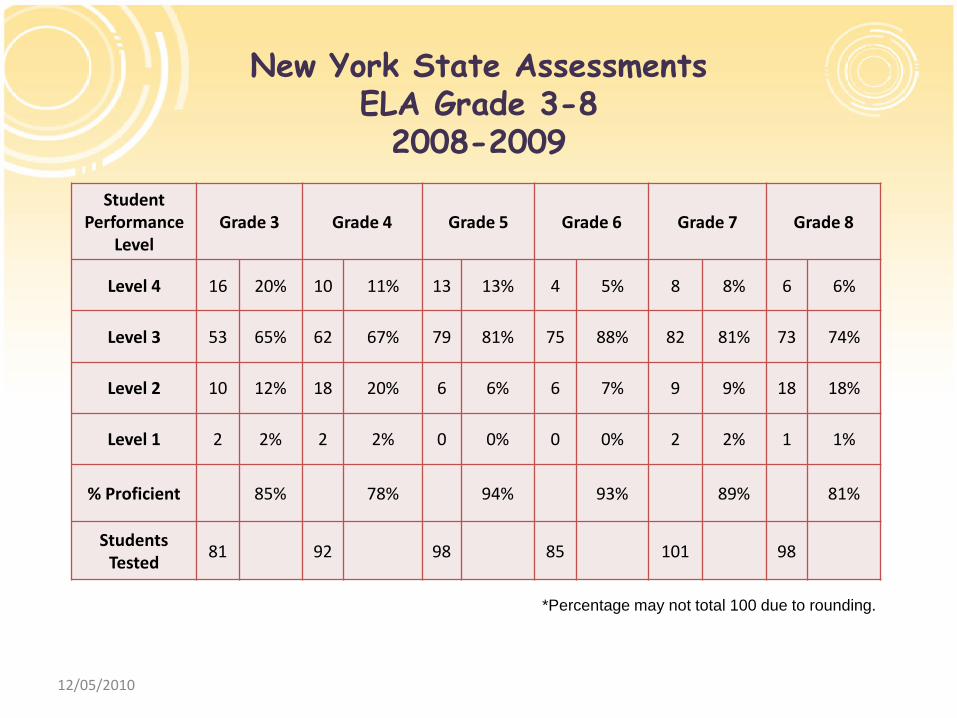
New York State Assessments ELA Grade 3-8
2008-2009
*Percentage may not total 100 due to rounding.
Student Performance
Level Grade 3 Grade 4 Grade 5 Grade 6 Grade 7 Grade 8
Level 4 16 20% 10 11% 13 13% 4 5% 8 8% 6 6%
Level 3 53 65% 62 67% 79 81% 75 88% 82 81% 73 74%
Level 2 10 12% 18 20% 6 6% 6 7% 9 9% 18 18%
Level 1 2 2% 2 2% 0 0% 0 0% 2 2% 1 1%
% Proficient 85% 78% 94% 93% 89% 81%
Students Tested 81 92 98 85 101 98
12/05/2010
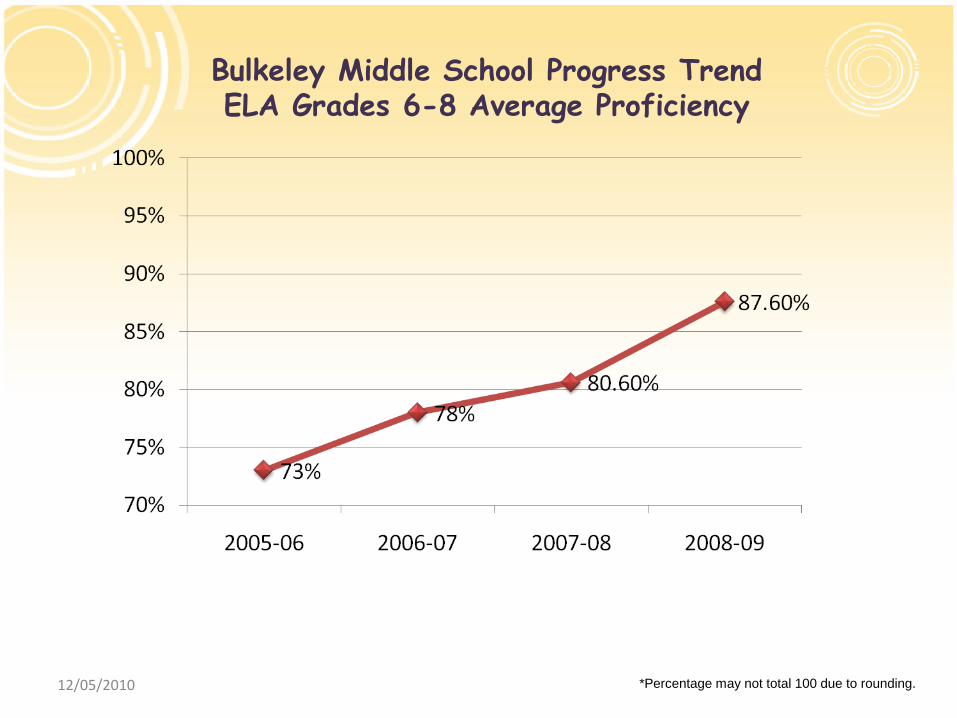
Bulkeley Middle School Progress Trend ELA Grades 6-8 Average Proficiency
*Percentage may not total 100 due to rounding.
12/05/2010
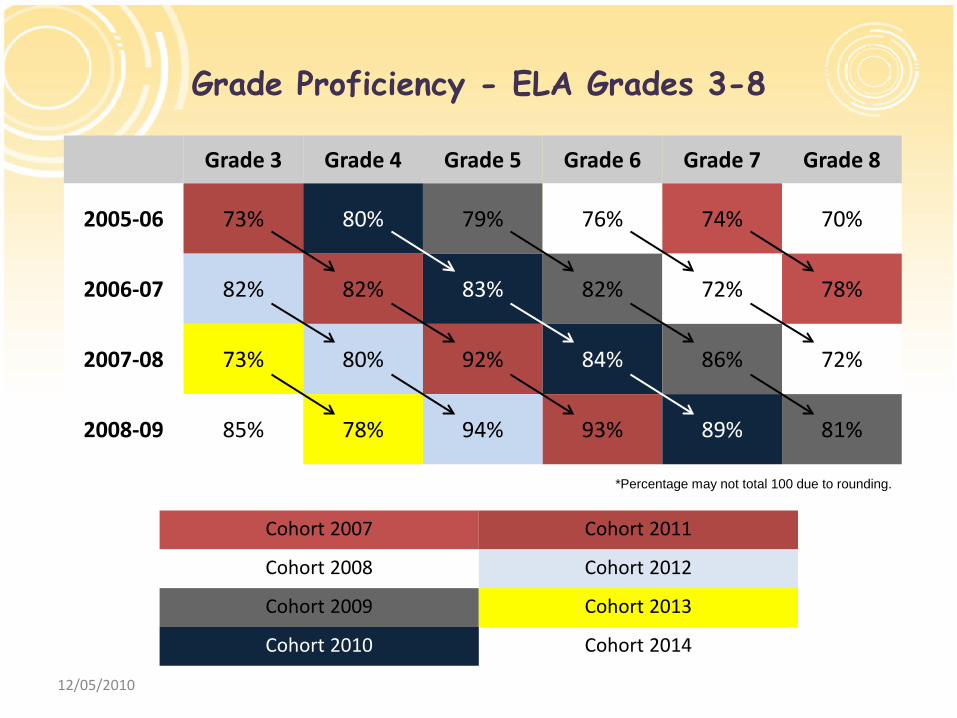
Grade Proficiency - ELA Grades 3-8
*Percentage may not total 100 due to rounding.
Grade 3 Grade 4 Grade 5 Grade 6 Grade 7 Grade 8
2005-06 73% 80% 79% 76% 74% 70%
2006-07 82% 82% 83% 82% 72% 78%
2007-08 73% 80% 92% 84% 86% 72%
2008-09 85% 78% 94% 93% 89% 81%
Cohort 2007 Cohort 2011
Cohort 2008 Cohort 2012
Cohort 2009 Cohort 2013
Cohort 2010 Cohort 2014

12/05/2010
Cohort Trend Analysis – ELA Grades 3-8
*Percentage may not total 100 due to rounding.

12/05/2010
Annual Measurable Objectives Using Performance Index ELA Grades 6-8
12/05/2010
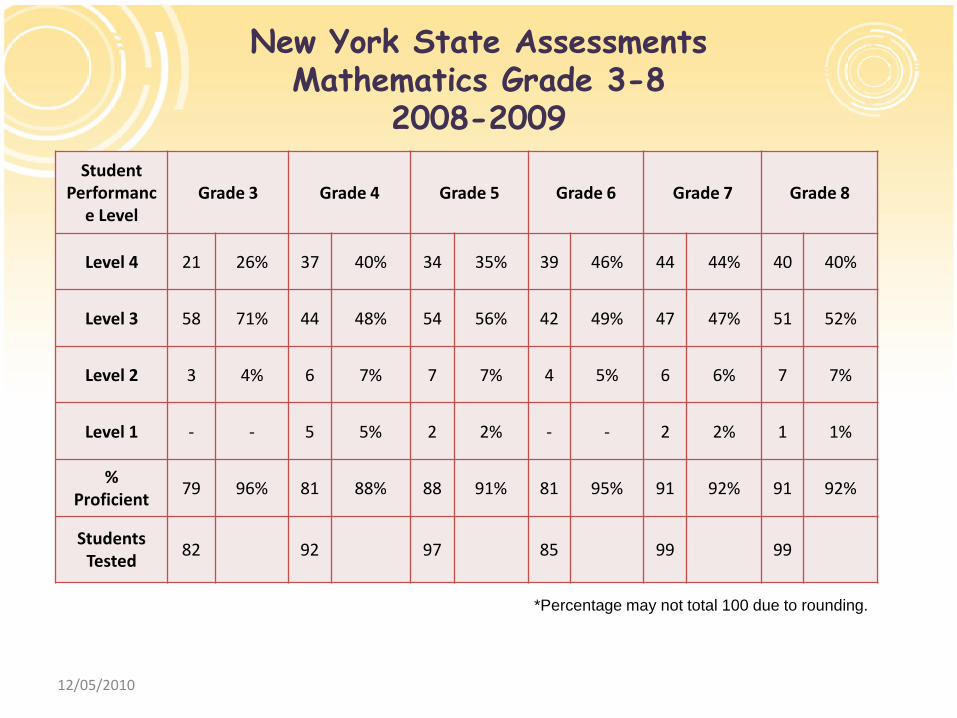
New York State Assessments Mathematics Grade 3-8
2008-2009
*Percentage may not total 100 due to rounding.
Student Performanc
e Level Grade 3 Grade 4 Grade 5 Grade 6 Grade 7 Grade 8
Level 4 21 26% 37 40% 34 35% 39 46% 44 44% 40 40%
Level 3 58 71% 44 48% 54 56% 42 49% 47 47% 51 52%
Level 2 3 4% 6 7% 7 7% 4 5% 6 6% 7 7%
Level 1 - - 5 5% 2 2% - - 2 2% 1 1%
% Proficient 79 96% 81 88% 88 91% 81 95% 91 92% 91 92%
Students Tested 82 92 97 85 99 99

12/05/2010
Trend Analysis - Grade Proficiency Mathematics Grades 3-8
*Percentage may not total 100 due to rounding.

12/05/2010
Bulkeley Middle School Progress Trend Mathematics Grades 6-8 Average Proficiency
*Percentage may not total 100 due to rounding.

12/05/2010
Grade Proficiency - Mathematics Grades 3-8
*Percentage may not total 100 due to rounding.
Grade 3 Grade 4 Grade 5 Grade 6 Grade 7 Grade 8
2005-06 88% 85% 73% 73% 82% 68%
2006-07 93% 92% 80% 87% 86% 86%
2007-08 92% 90% 92% 88% 95% 89%
2008-09 96% 88% 91% 95% 92% 92%
Cohort 2007 Cohort 2011
Cohort 2008 Cohort 2012
Cohort 2009 Cohort 2013
Cohort 2010 Cohort 2014

12/05/2010
Cohort Trend Analysis – Mathematics Grades 3-8
*Percentage may not total 100 due to rounding.

12/05/2010
Annual Measurable Objectives Using Performance Index Mathematics Grades 6-8
12/05/2010
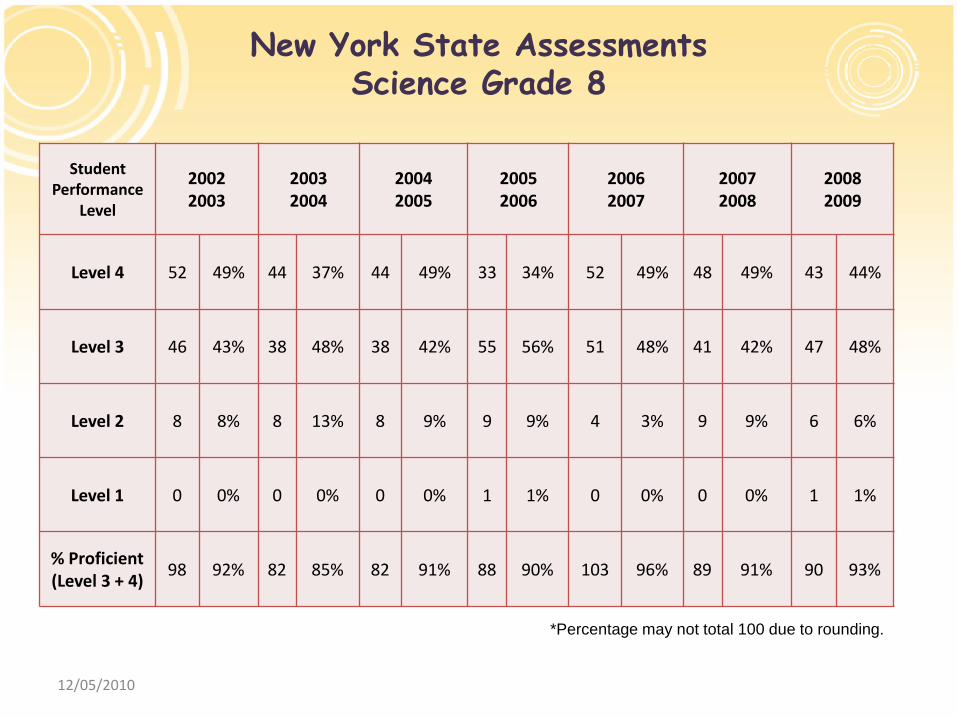
New York State Assessments Science Grade 8
*Percentage may not total 100 due to rounding.
Student Performance
Level
2002 2003
2003 2004
2004 2005
2005 2006
2006 2007
2007 2008
2008 2009
Level 4 52 49% 44 37% 44 49% 33 34% 52 49% 48 49% 43 44%
Level 3 46 43% 38 48% 38 42% 55 56% 51 48% 41 42% 47 48%
Level 2 8 8% 8 13% 8 9% 9 9% 4 3% 9 9% 6 6%
Level 1 0 0% 0 0% 0 0% 1 1% 0 0% 0 0% 1 1%
% Proficient (Level 3 + 4) 98 92% 82 85% 82 91% 88 90% 103 96% 89 91% 90 93%
12/05/2010
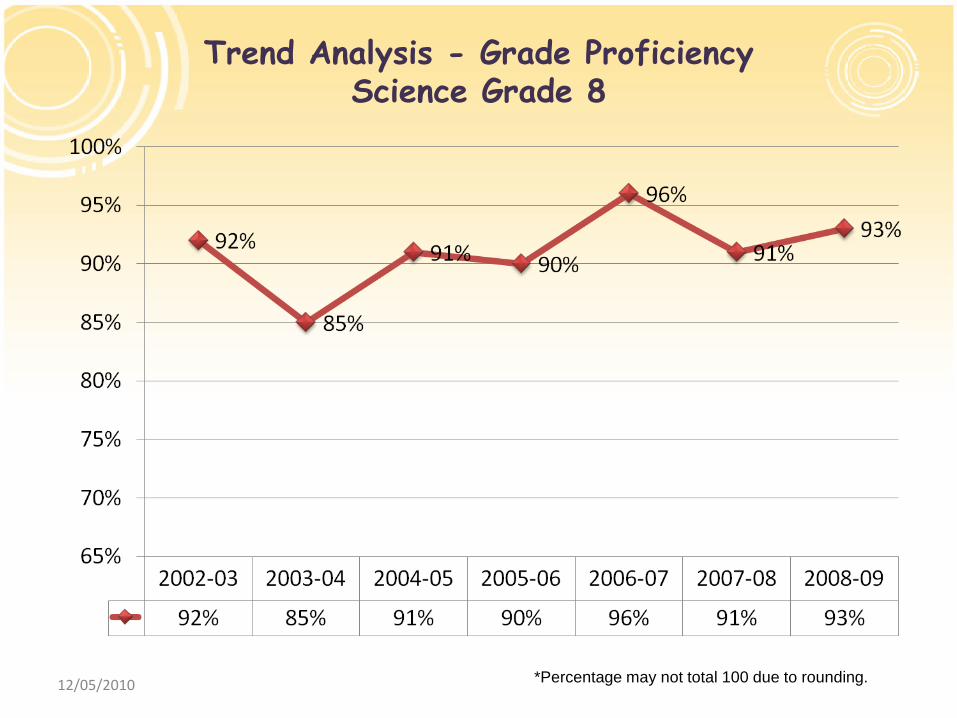
Trend Analysis - Grade Proficiency Science Grade 8
*Percentage may not total 100 due to rounding.

12/05/2010
New York State Assessments Social Studies Grade 8
*Percentage may not total 100 due to rounding.
Student Performance
Level
2002 2003
2003 2004
2004 2005
2005 2006
2006 2007
2007 2008
2008 2009
Level 4 19 17% 12 10% 19 21% 24 25% 41 39% 44 44% 39 41%
Level 3 58 52% 68 58% 59 66% 52 54% 53 50% 41 41% 48 50%
Level 2 31 28% 37 31% 11 12% 17 18% 12 11% 12 12% 7 7%
Level 1 1 1% 1 1% 0 0% 3 3% 0 0% 2 2% 2 2%
% Proficient Level 3 + 4 77 69% 80 68% 78 87% 76 79% 94 89% 85 86% 87 91%

12/05/2010
Trend Analysis - Grade Proficiency Social Studies Grade 8
*Percentage may not total 100 due to rounding.

12/05/2010
New York State Assessmentd Middle School
100% Proficiency Gap
2009 Gap 2013-2014
English Language Arts 6: 93% 7: 89% 8: 81%
-7% -11% -19%
100%
Math
6: 95% 7: 92% 8: 92%
-5% -8% -8%
100%
Science - Grade 8
92%
-8%
100%
Social Studies - Grade 8
91%
-9%
100%

12/05/2010
New York State Assessments Rhinebeck High School
ELA Regents
*Percentage may not total 100 due to rounding.
Student Performance
Level
2001 2002
2002 2003
2003 2004
2004 2005
2005 2006
2006 2007
2007 2008
2008 2009
Level 4 85-100 43 41% 39 39% 48 47% 38 37% 54 53% 41 38% 37 43% 43 43%
Level 3 65-84 48 56% 43 43% 51 50% 51 49% 44 44% 61 56% 41 48% 56 55%
Level 2 55-64 2 2% 8 8% 3 3% 8 8% 2 2% 4 4% 6 7% 0 0%
Level 1 0-54 0 0% 0 0% 0 0% 7 6% 1 1% 3 3% 2 2% 2 2%
% Proficient
(Level 3+4) 91 97% 82 82% 99 97% 89 86% 98 97% 102 94% 78 91% 99 98%

12/05/2010
Rhinebeck High School ELA Regents Exams
2004-2008
*Percentage may not total 100 due to rounding.
12/05/2010
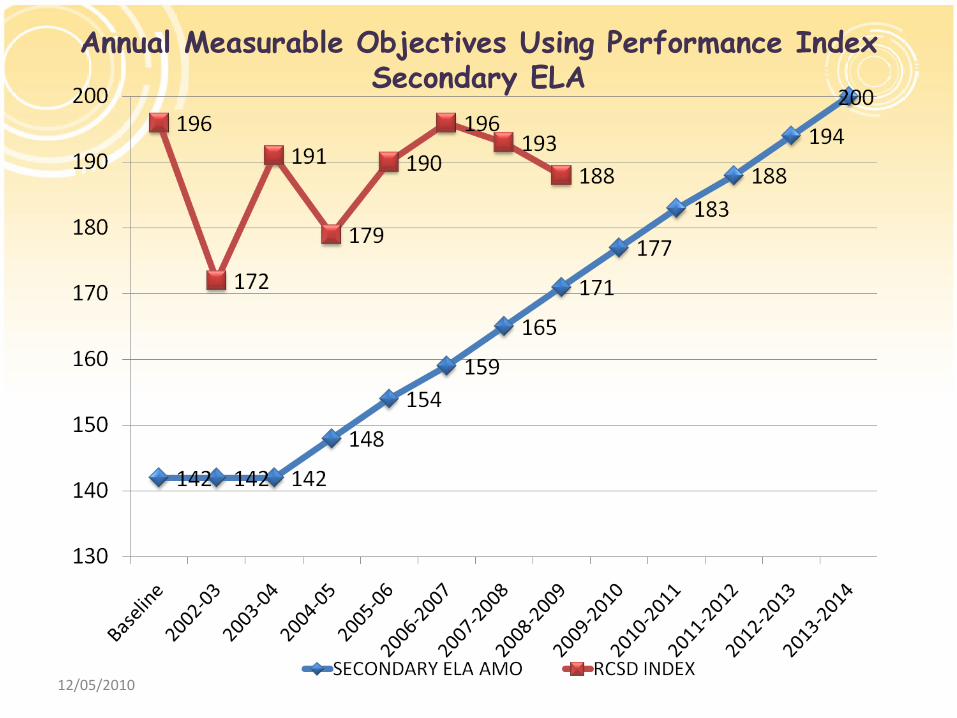
Annual Measurable Objectives Using Performance Index Secondary ELA

12/05/2010
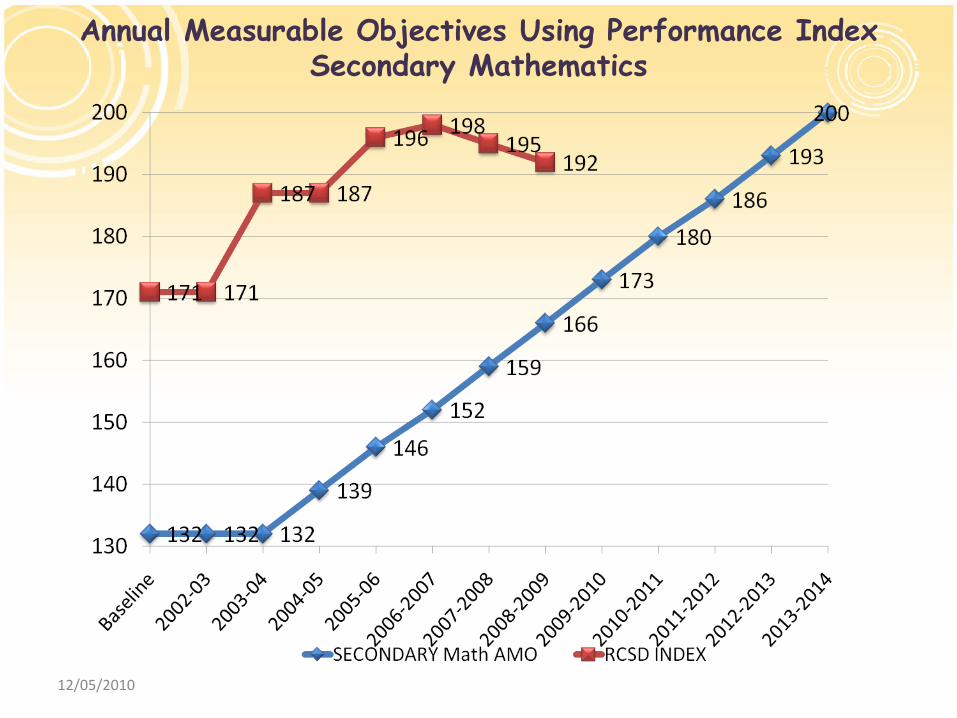
New York State Assessments Secondary Mathematics
*Percentage may not total 100 due to rounding.
Student Performance
Level 2007-2008 2008-2009
Level 4 85-100 30 51% 38 41%
Level 3 65-84 29 49% 52 56%
Level 2 55-64 0 0% 2 2%
Level 1 0-54 0 0% 1 1%
% Proficient Level 3+4 59 100% 90 97%
Integrated Algebra Student
Performance Level
2008-2009
Level 4 85-100 32 50%
Level 3 65-84 29 45%
Level 2 55-64 3 5%
Level 1 0-54 0 0
% Proficient Level 3+4 64 95%
Geometry
*Percentage may not total 100 due to rounding.
12/05/2010
Annual Measurable Objectives Using Performance Index Secondary Mathematics
12/05/2010
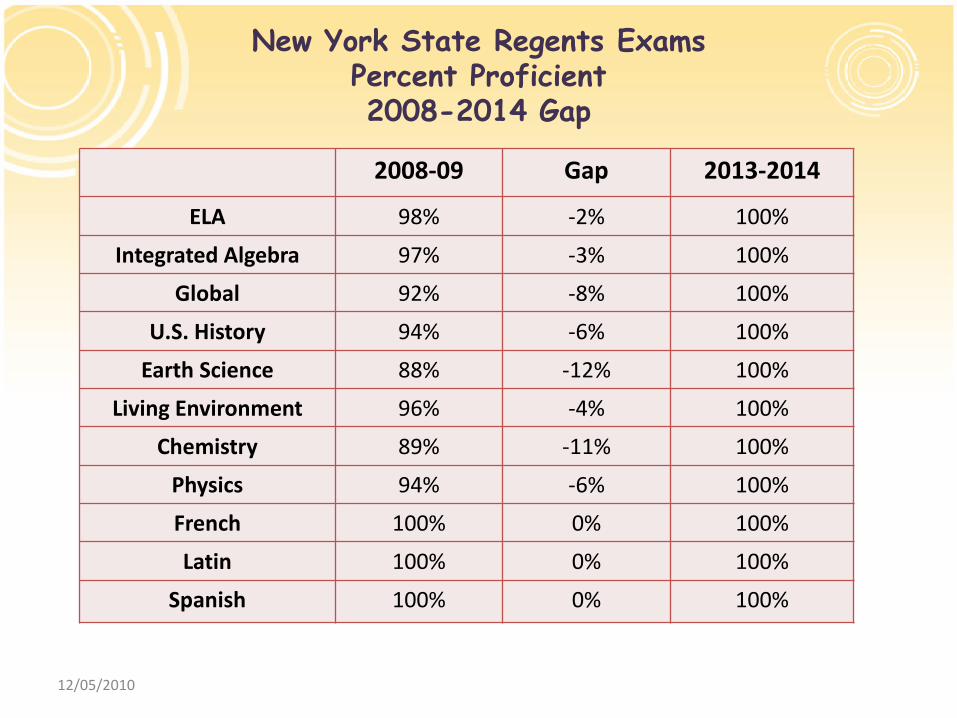
New York State Regents Exams Percent Proficient 2008-2014 Gap
2008-09 Gap 2013-2014 ELA 98% -2% 100%
Integrated Algebra 97% -3% 100% Global 92% -8% 100%
U.S. History 94% -6% 100% Earth Science 88% -12% 100%
Living Environment 96% -4% 100% Chemistry 89% -11% 100%
Physics 94% -6% 100% French 100% 0% 100% Latin 100% 0% 100%
Spanish 100% 0% 100%

12/05/2010
Rhinebeck High School Mean SAT Scores
2003 2004 2005 2006 2007 2008 2009
V M V M V M CR M WR CR M WR CR M WR CR M WR
Rhinebeck 551 549 548 544 581 572 556 548 547 576 557 549 551 559 543 553 549 526
NY State 496 510 497 510 497 511 493 510 483 491 505 482 488 504 481 485 502 478
National 507 519 508 518 508 520 503 518 497 502 515 494 502 515 494 501 515 493

12/05/2010
Rhinebeck Central School District AP Exam Results 2009
AP G
rade
Biol
ogy
Calc
AB
Chem
istr
y
Com
pute
r Sc
ienc
e A
ELA/
Com
p
Euro
pean
H
isto
ry
Fren
ch
Phys
ics C
M
ech
Span
ish
Wor
ld
H
isto
ry
Tota
l Gra
des
Tota
l Pe
rcen
tage
s
5 9 4 - - 3 1 - 3 2 9 31 30%
4 5 3 - - 5 1 - 2 5 8 29 28%
3 1 1 - - - 2 3 2 2 10 21 20%
2 3 2 - - 1 4 3 2 - 2 17 16%
1 1 2 1 - - - 2 - 1 - 7 7%
Total 19 12 1 0 9 8 8 9 10 29 105 100%

12/05/2010
Positive Trends and Strengths • Elementary Science results remain strong: 95% • Elementary Social Studies results remain strong: 94% • Elementary and Middle School Mathematics and ELA results trending positive. • Middle School Science results are strong: 93% • Middle School Social Studies results are strong: 91%
• Mathematics Regents results
continue to be solid:
• English Regents results continue to
be solid and K-8 is continuing to improve:
• Regents results in Global History, American History, Living Environment, Earth Science, Chemistry, Physics, and Foreign Language continue to be strong.
2004 2005 2006 2007 2008 2009
94% 90% 99% 99% 95% Int. Algebra – 97% Geometry – 95%
2004 2005 2006 2007 2008 2009
97% 86% 97% 94% 91% 98%
{
{

12/05/2010
Successes to Celebrate • Overall Academic Program is
strong and effective K-12 across all disciplines as evidenced by the data. The K-12 faculty, staff, administration and most of all the STUDENTS are to be commended for their well earned achievements.
• CLS and District identified by SED as High Performing and Gap Closing School and District.
• RHS made the Newsweek Challenge Index List of top 5% of HS in the country based upon the AP participation.
12/05/2010
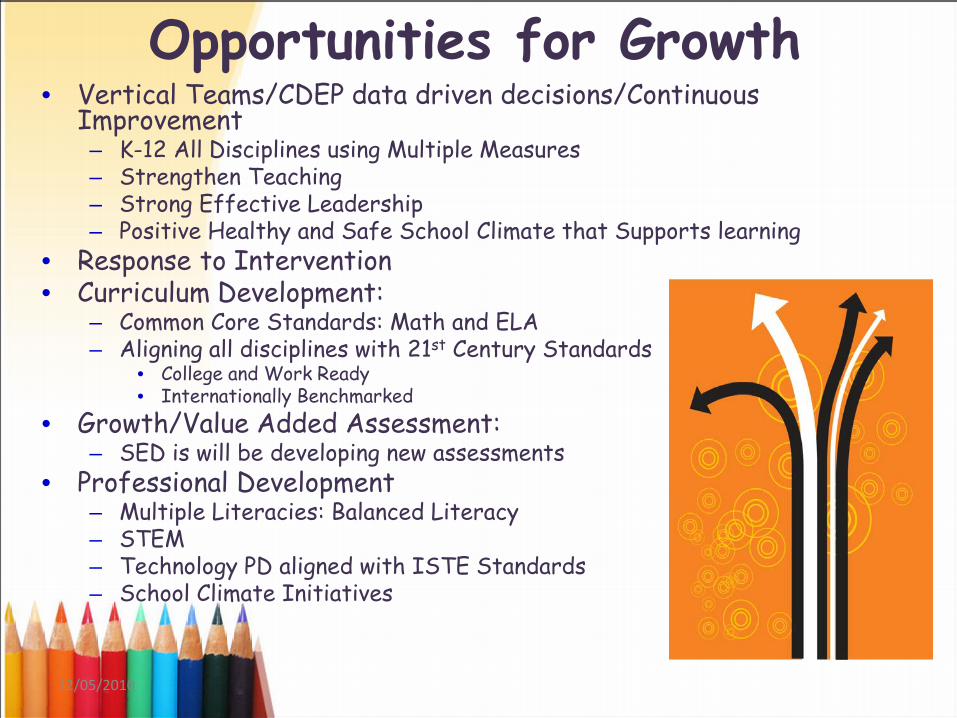
Opportunities for Growth • Vertical Teams/CDEP data driven decisions/Continuous
Improvement – K-12 All Disciplines using Multiple Measures – Strengthen Teaching – Strong Effective Leadership – Positive Healthy and Safe School Climate that Supports learning
• Response to Intervention • Curriculum Development:
– Common Core Standards: Math and ELA – Aligning all disciplines with 21st Century Standards
• College and Work Ready • Internationally Benchmarked
• Growth/Value Added Assessment: – SED is will be developing new assessments
• Professional Development – Multiple Literacies: Balanced Literacy – STEM – Technology PD aligned with ISTE Standards – School Climate Initiatives
12/05/2010
Contact Information: Marvin L. Kreps Director of Curriculum and Instruction Rhinebeck Central School District P.O. Box 351 Rhinebeck. New York 845-871-5570 x 5545 [email protected]