an overview of SCOOP - Chair of Software...
68
Chair of Software Engineering Software Architecture Bertrand Meyer, Carlo A. Furia, Martin Nordio ETH Zurich, February-May 2011 Lecture 12: Metrics, Models & Cost Estimation
Transcript of an overview of SCOOP - Chair of Software...

Chair of Software Engineering
Software Architecture
Bertrand Meyer, Carlo A. Furia, Martin Nordio
ETH Zurich, February-May 2011
Lecture 12: Metrics, Models
& Cost Estimation
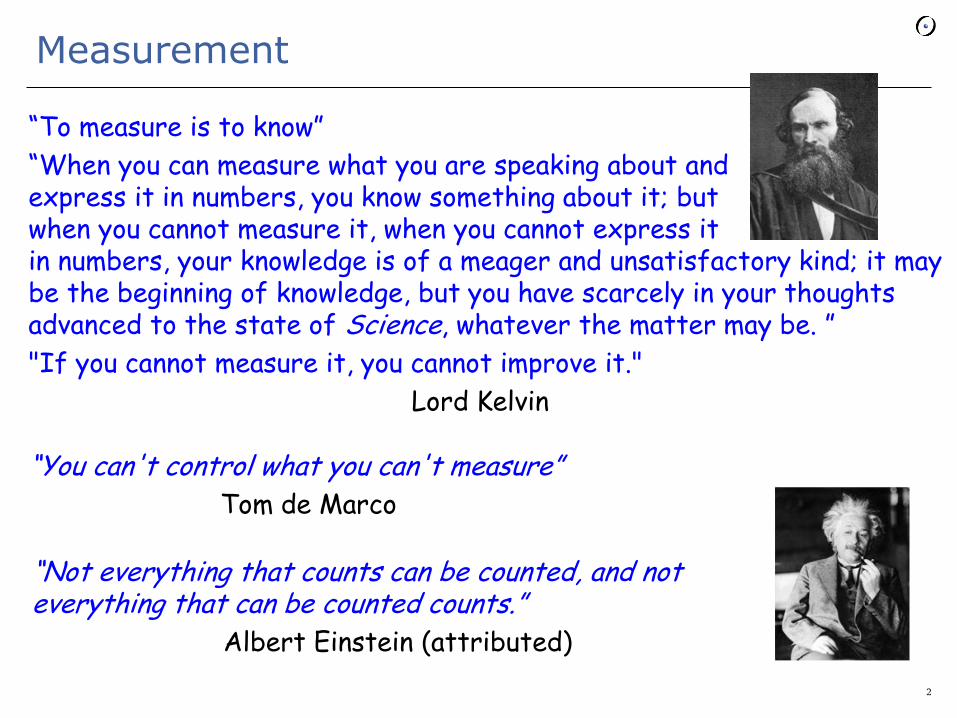
Measurement
“To measure is to know”
“When you can measure what you are speaking about and express it in numbers, you know something about it; but when you cannot measure it, when you cannot express it in numbers, your knowledge is of a meager and unsatisfactory kind; it may be the beginning of knowledge, but you have scarcely in your thoughts advanced to the state of Science, whatever the matter may be. ”
"If you cannot measure it, you cannot improve it."
Lord Kelvin
“You can't control what you can't measure” Tom de Marco
“Not everything that counts can be counted, and not everything that can be counted counts.” Albert Einstein (attributed)
2
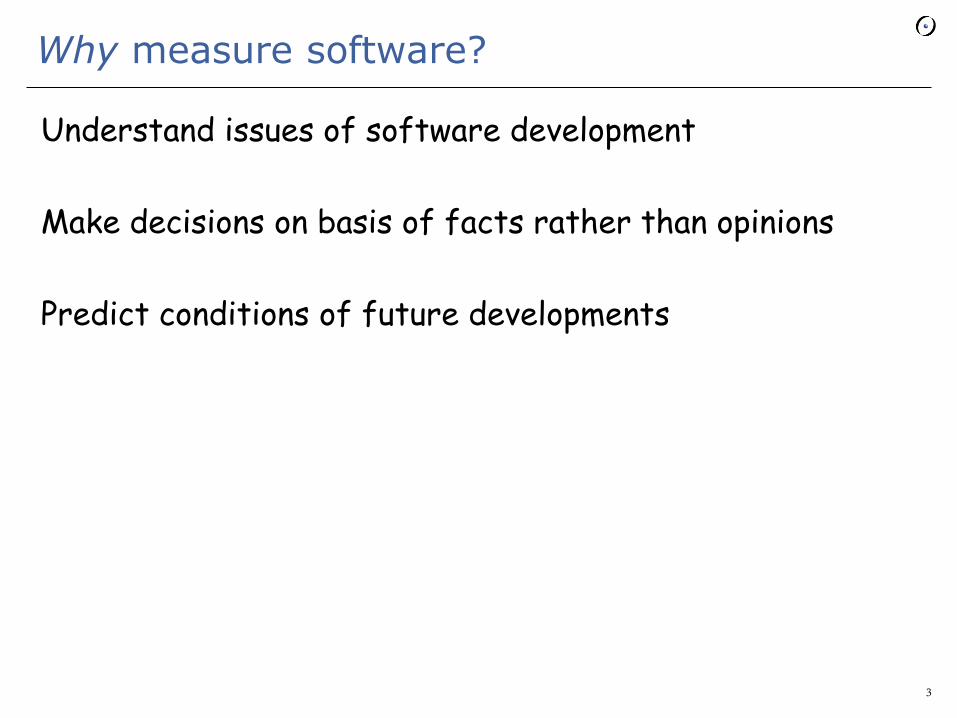
Why measure software?
Understand issues of software development
Make decisions on basis of facts rather than opinions
Predict conditions of future developments
3
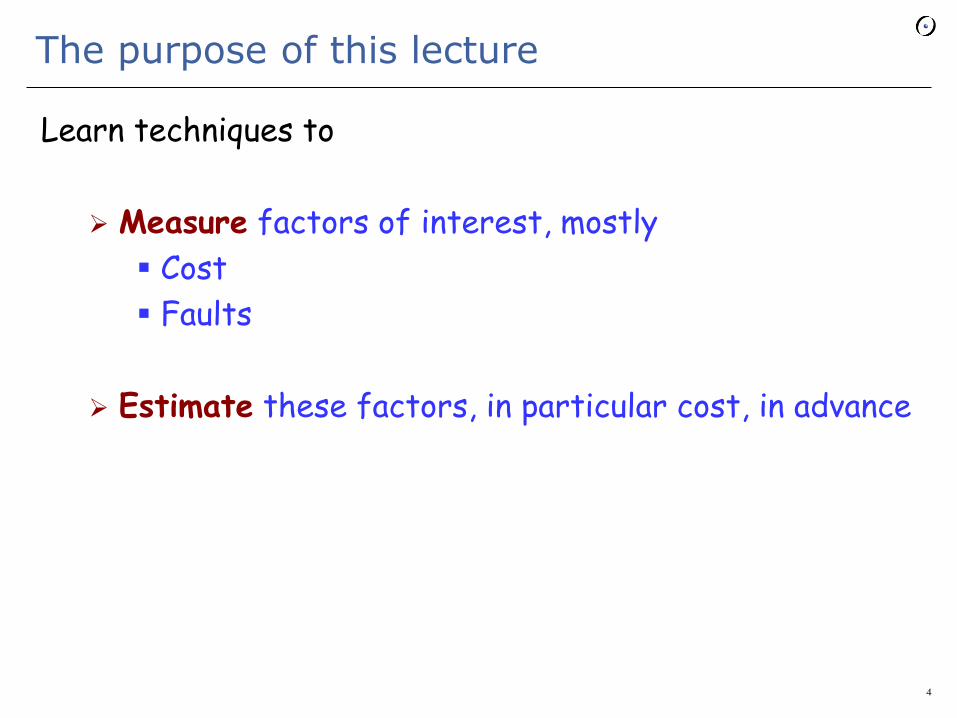
The purpose of this lecture
Learn techniques to
Measure factors of interest, mostly
Cost
Faults
Estimate these factors, in particular cost, in advance
4

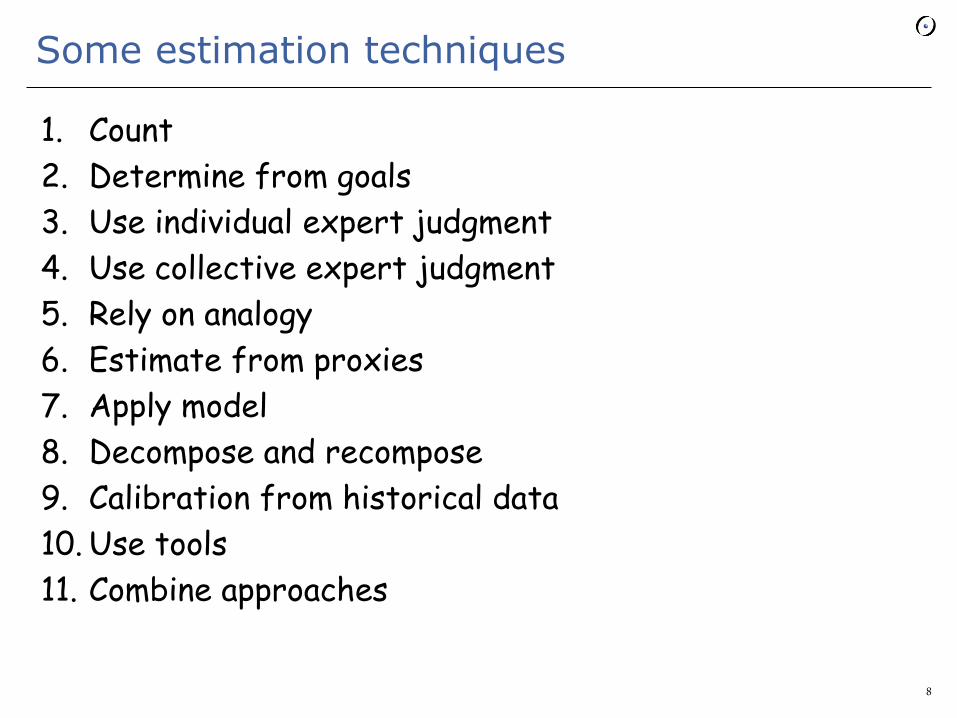
Some estimation techniques
1. Count
2. Determine from goals
3. Use individual expert judgment
4. Use collective expert judgment
5. Rely on analogy
6. Estimate from proxies
7. Apply model
8. Decompose and recompose
9. Calibration from historical data
10. Use tools
11. Combine approaches
5
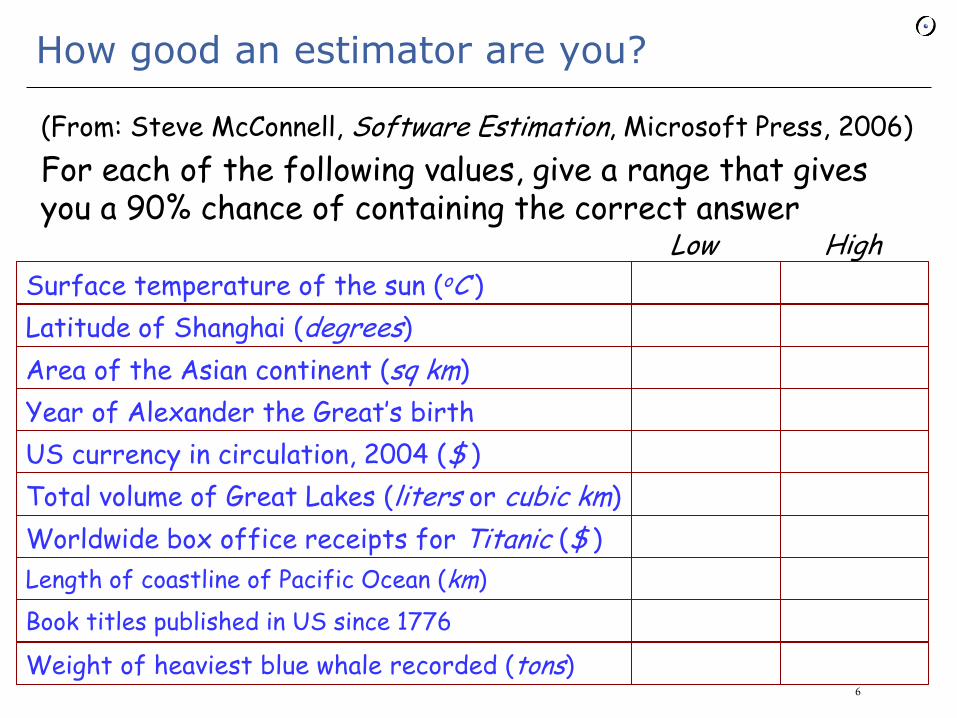
How good an estimator are you?
(From: Steve McConnell, Software Estimation, Microsoft Press, 2006)
For each of the following values, give a range that gives you a 90% chance of containing the correct answer
6
Surface temperature of the sun (oC )
Latitude of Shanghai (degrees)
Area of the Asian continent (sq km)
Year of Alexander the Great’s birth
US currency in circulation, 2004 ($ )
Total volume of Great Lakes (liters or cubic km)
Worldwide box office receipts for Titanic ($ )
Length of coastline of Pacific Ocean (km)
Book titles published in US since 1776
Weight of heaviest blue whale recorded (tons)
Low High

Results
7
1 2 3 4 5 6 7 8 9 10 0
Some estimation techniques
1. Count
2. Determine from goals
3. Use individual expert judgment
4. Use collective expert judgment
5. Rely on analogy
6. Estimate from proxies
7. Apply model
8. Decompose and recompose
9. Calibration from historical data
10. Use tools
11. Combine approaches
8
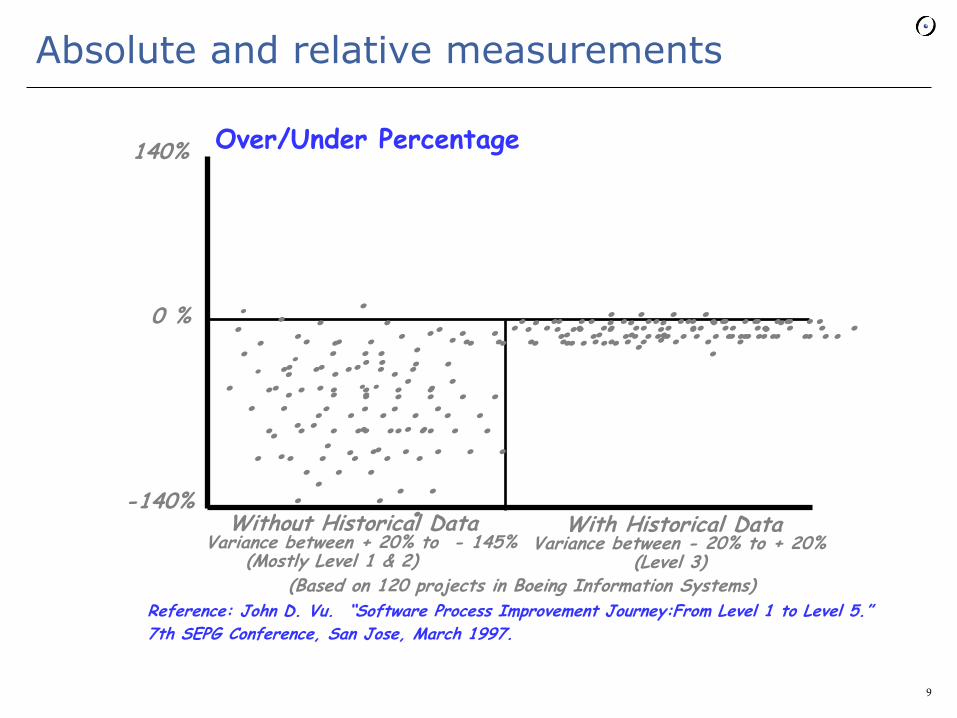
Absolute and relative measurements
.
0 %
140%
-140%
.. . .
.
..
. . . . .
.
. .
. . . .
. . . . . .
.
. . . . . . . . . . . . . .. . . . .. .
. . .
. .. .
. .
. . . .. .... .. . .. . .. . . . . . . . . .
Without Historical Data With Historical Data Variance between + 20% to - 145% Variance between - 20% to + 20%
(Mostly Level 1 & 2) (Level 3)
Over/Under Percentage
.
(Based on 120 projects in Boeing Information Systems)
. . . .
.
. . .
.. .
. .
. . .
. . .
. .
. . . . . . . . . . . . . . . . . . . .
.. . . . . . . . . . . . . . . . . . . .
. . . . . . . . . . . . . . . . . . . . . . . . . . .
. . . . . . . . . . . . . .
. . . . . . . .
. . . . . . . . .
. . . . . . . . . . . .
. . . . . .
Reference: John D. Vu. “Software Process Improvement Journey:From Level 1 to Level 5.”
7th SEPG Conference, San Jose, March 1997.
9
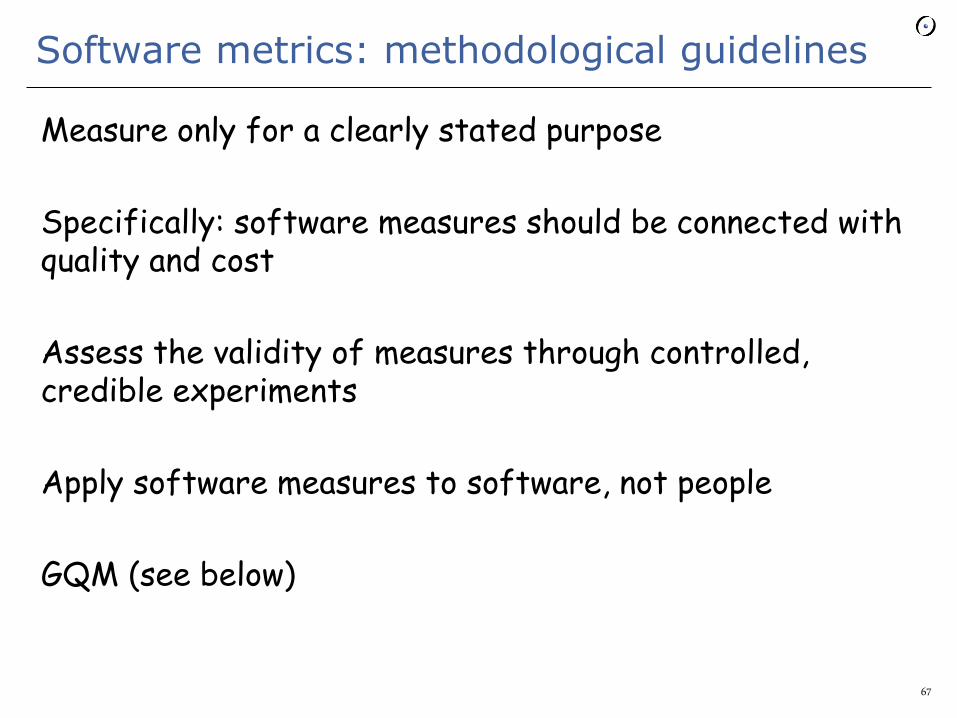
Software metrics: methodological guidelines
Measure only for a clearly stated purpose
Specifically: software measures should be connected with quality and cost
Assess the validity of measures through controlled, credible experiments
Apply software measures to software, not people
GQM (see next)
10
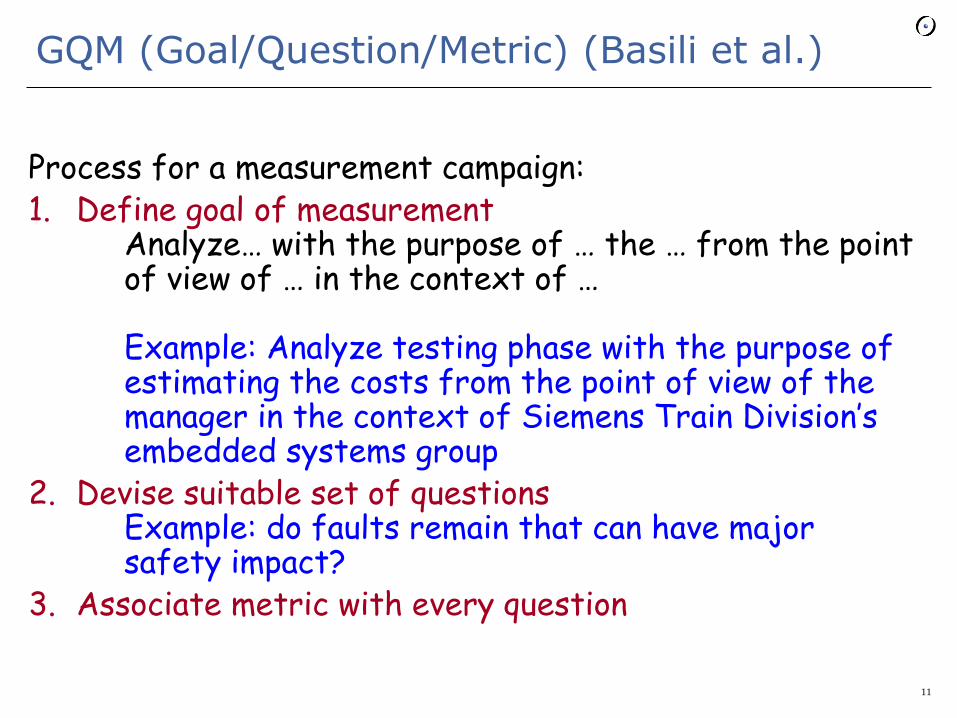
GQM (Goal/Question/Metric) (Basili et al.)
Process for a measurement campaign: 1. Define goal of measurement
Analyze… with the purpose of … the … from the point of view of … in the context of … Example: Analyze testing phase with the purpose of estimating the costs from the point of view of the manager in the context of Siemens Train Division’s embedded systems group
2. Devise suitable set of questions Example: do faults remain that can have major safety impact?
3. Associate metric with every question
11
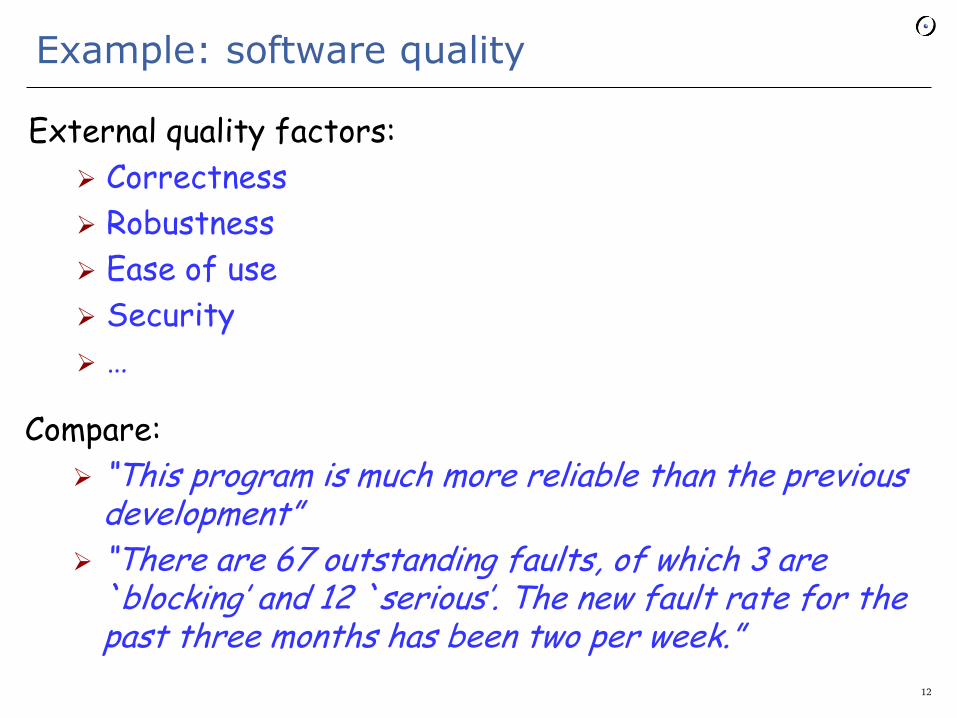
Example: software quality
External quality factors:
Correctness
Robustness
Ease of use
Security
…
Compare:
“This program is much more reliable than the previous development”
“There are 67 outstanding faults, of which 3 are `blocking’ and 12 `serious’. The new fault rate for the past three months has been two per week.”
12
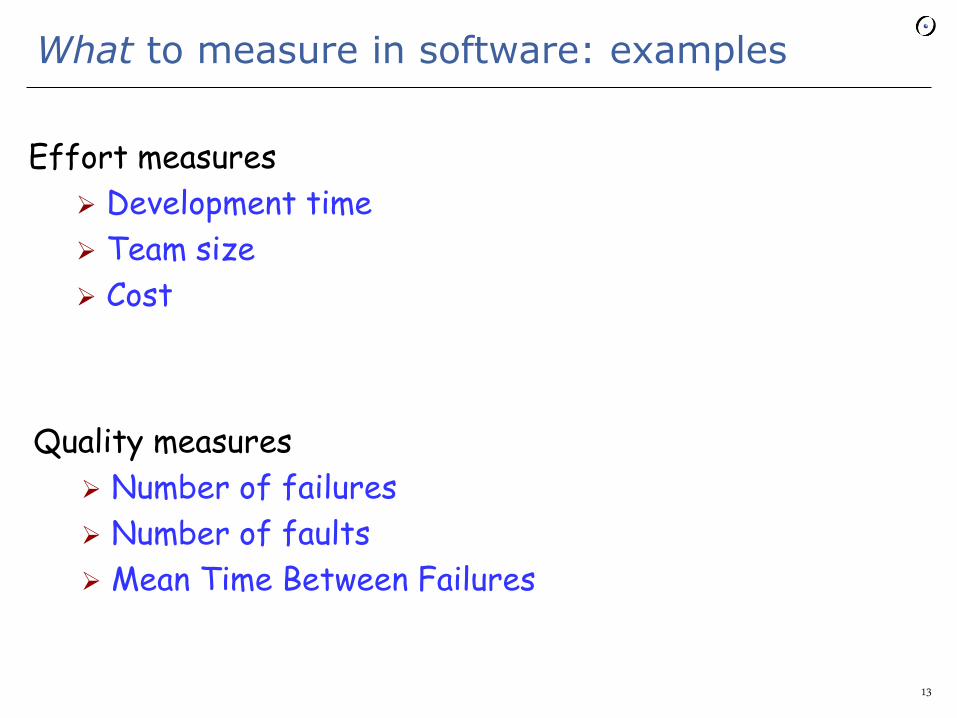
What to measure in software: examples
Effort measures
Development time
Team size
Cost
Quality measures
Number of failures
Number of faults
Mean Time Between Failures
13
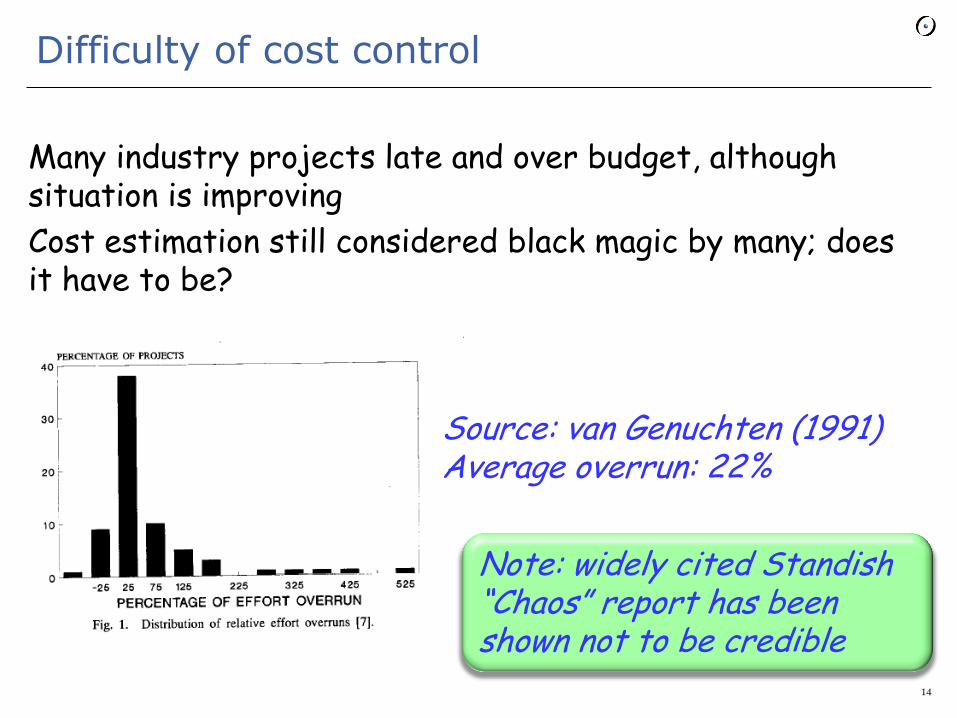
Difficulty of cost control
Many industry projects late and over budget, although situation is improving
Cost estimation still considered black magic by many; does it have to be?
Source: van Genuchten (1991) Average overrun: 22%
14
Note: widely cited Standish “Chaos” report has been shown not to be credible
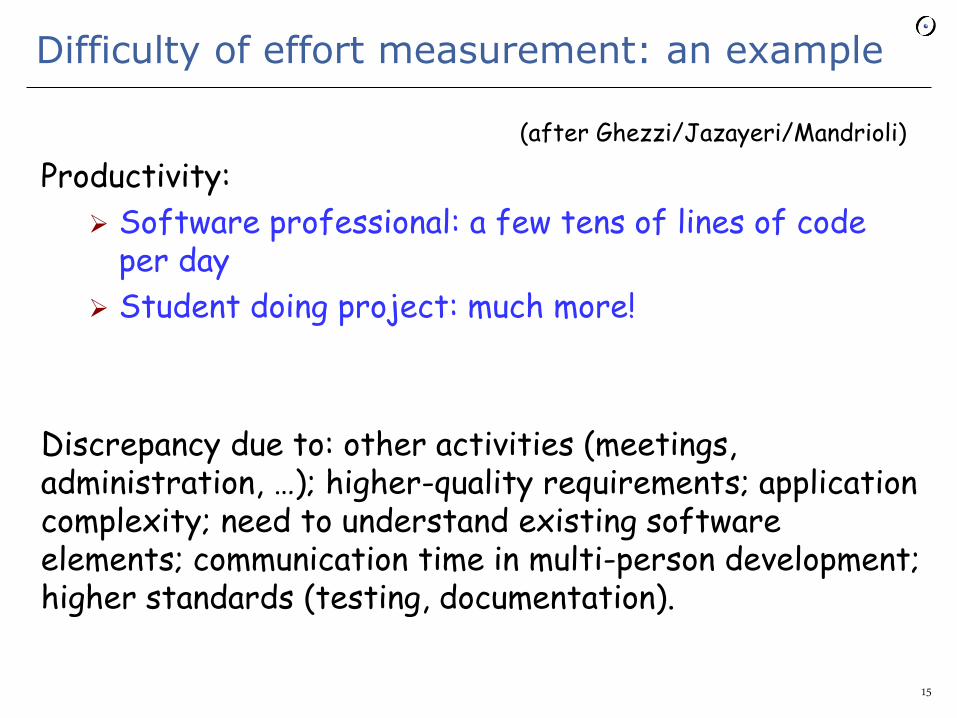
Difficulty of effort measurement: an example
(after Ghezzi/Jazayeri/Mandrioli)
Productivity:
Software professional: a few tens of lines of code per day
Student doing project: much more!
Discrepancy due to: other activities (meetings, administration, …); higher-quality requirements; application complexity; need to understand existing software elements; communication time in multi-person development; higher standards (testing, documentation).
15
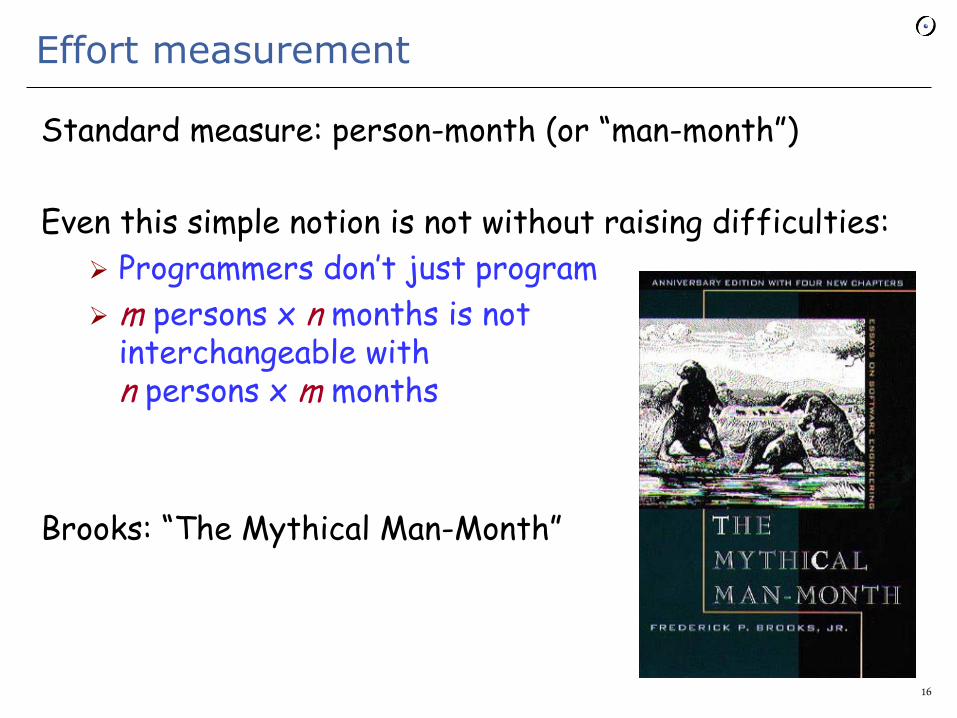
Effort measurement
Standard measure: person-month (or “man-month”)
Even this simple notion is not without raising difficulties:
Programmers don’t just program
m persons x n months is not interchangeable with n persons x m months
Brooks: “The Mythical Man-Month”
16
Project parameters
Elements that can be measured in advance, to be fed into cost model
Candidates:
Lines of code (LOC, KLOC, SLOC..) and other internal measures
Function points, application points and other external measures
Some metrics apply to all programs, others to O-O programs only
17
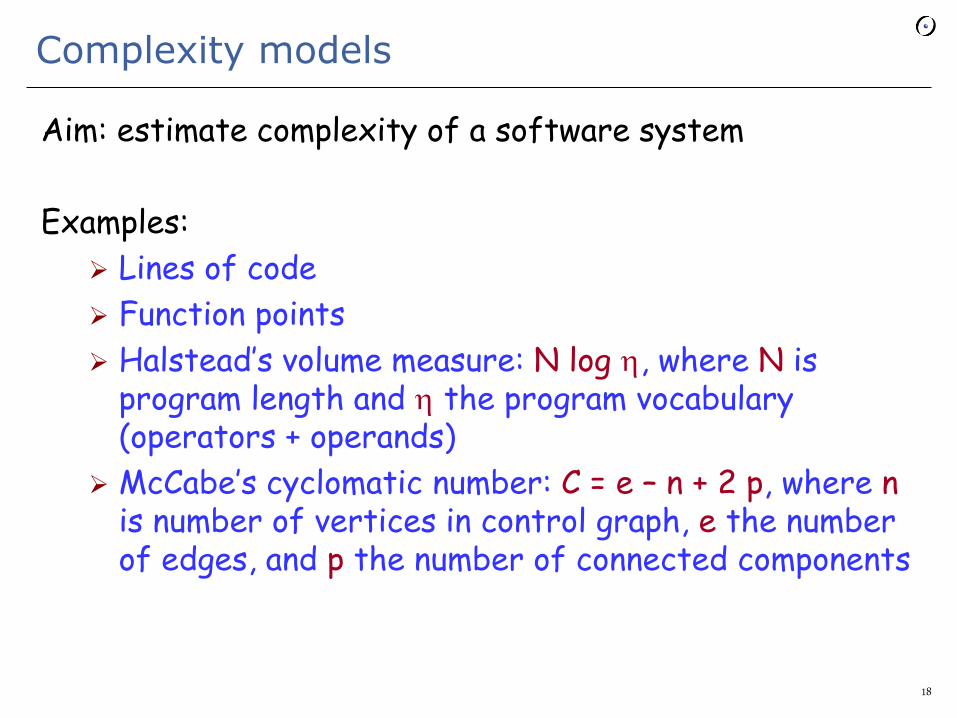
Complexity models
Aim: estimate complexity of a software system
Examples:
Lines of code
Function points
Halstead’s volume measure: N log , where N is program length and the program vocabulary (operators + operands)
McCabe’s cyclomatic number: C = e – n + 2 p, where n is number of vertices in control graph, e the number of edges, and p the number of connected components
18
Traditional internal code metrics
Source Lines of Code (SLOC)
Comment Percentage (CP)
McCabe Cyclomatic Complexity (CC)
19

Source lines of code (SLOC)
Definition: count number of lines in program Conventions needed for: comments; multi-line instructions; control structures; reused code. Pros as a cost estimate parameter:
Appeals to programmers Fairly easy to measure on final product Correlates well with other effort measures
Cons:
Ambiguous (several instructions per line, count comments or not …) Does not distinguish between programming languages of various
abstraction levels Low-level, implementation-oriented Difficult to estimate in advance.
20

Source lines of code
A measure of the number of physical lines of code
Different counting strategies:
Blank lines
Comment lines
Automatically generated lines
EiffelBase has 63,474 lines, Vision2 has 153,933 lines, EiffelStudio (Windows GUI) has 1,881,480 lines in all compiled classes.
Code used in examples given here and below are got from revision 68868 in Origo subversion server.
21
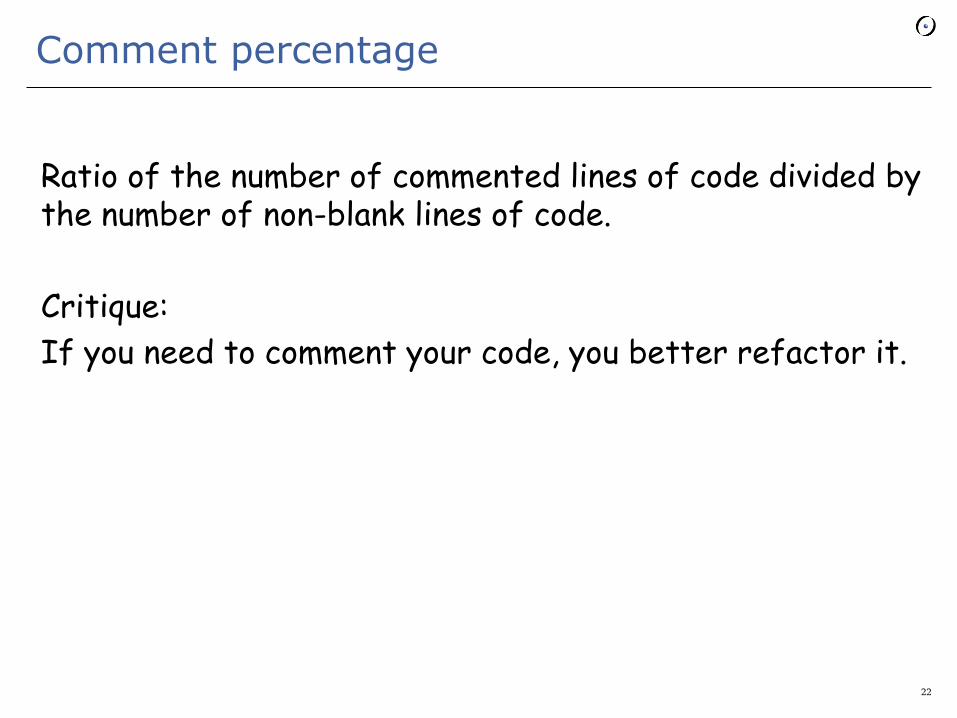
Comment percentage
Ratio of the number of commented lines of code divided by the number of non-blank lines of code.
Critique:
If you need to comment your code, you better refactor it.
22

Software Metrics
using EiffelStudio
With material by
Yi Wei & Marco Piccioni
May 2011
23

What to measure
Product properties
Lines of Code
Number of classes
Cohesion & Coupling
Conformance of code to OO principles
Process properties
Man-month spent on software
Number of bugs introduced per hour
Ratio of debugging/developing time
CMM, PSP
24
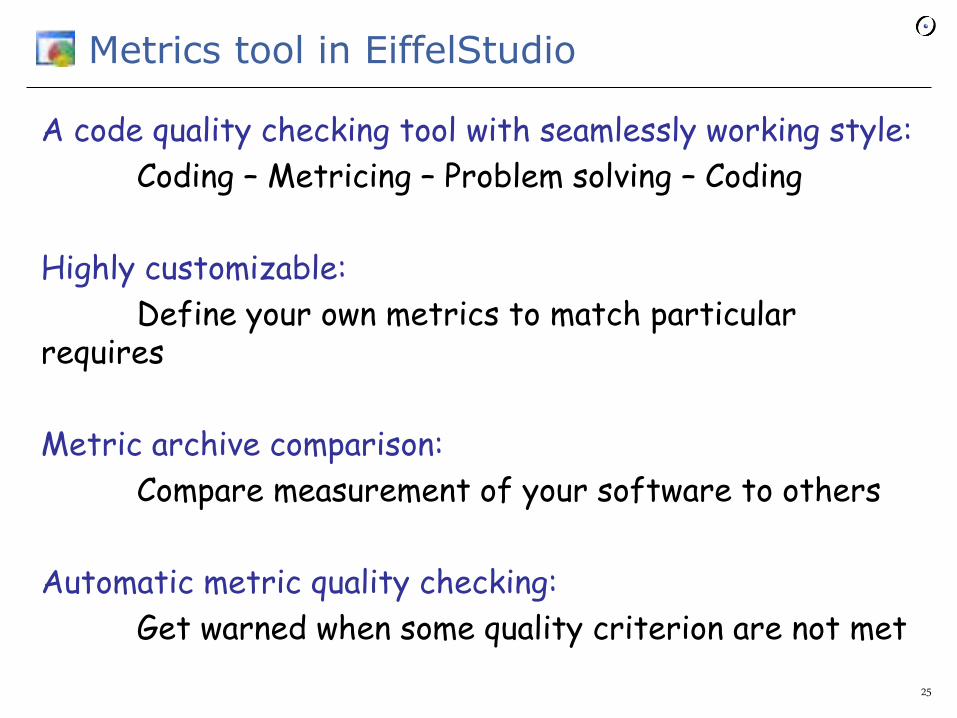
Metrics tool in EiffelStudio
A code quality checking tool with seamlessly working style:
Coding – Metricing – Problem solving – Coding
Highly customizable:
Define your own metrics to match particular requires
Metric archive comparison:
Compare measurement of your software to others
Automatic metric quality checking:
Get warned when some quality criterion are not met
25
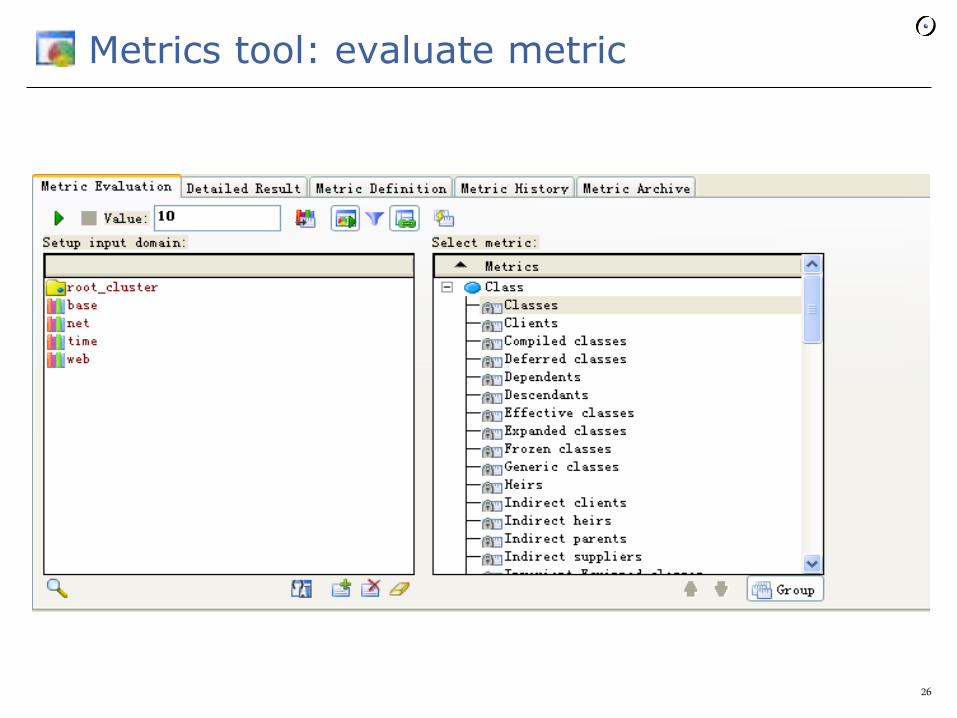
Metrics tool: evaluate metric
26
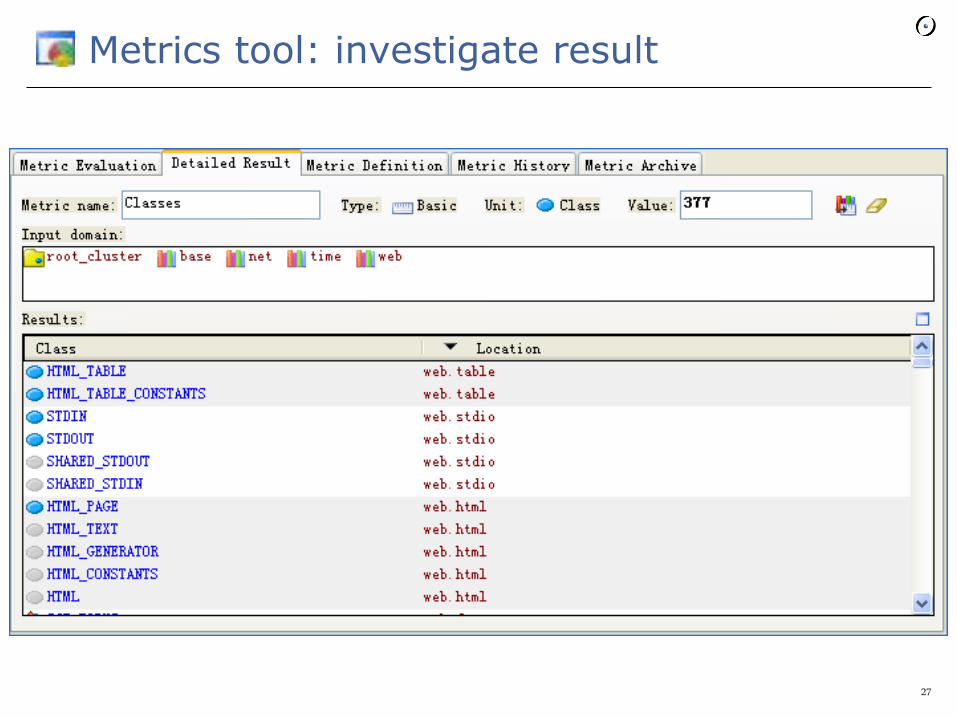
Metrics tool: investigate result
27
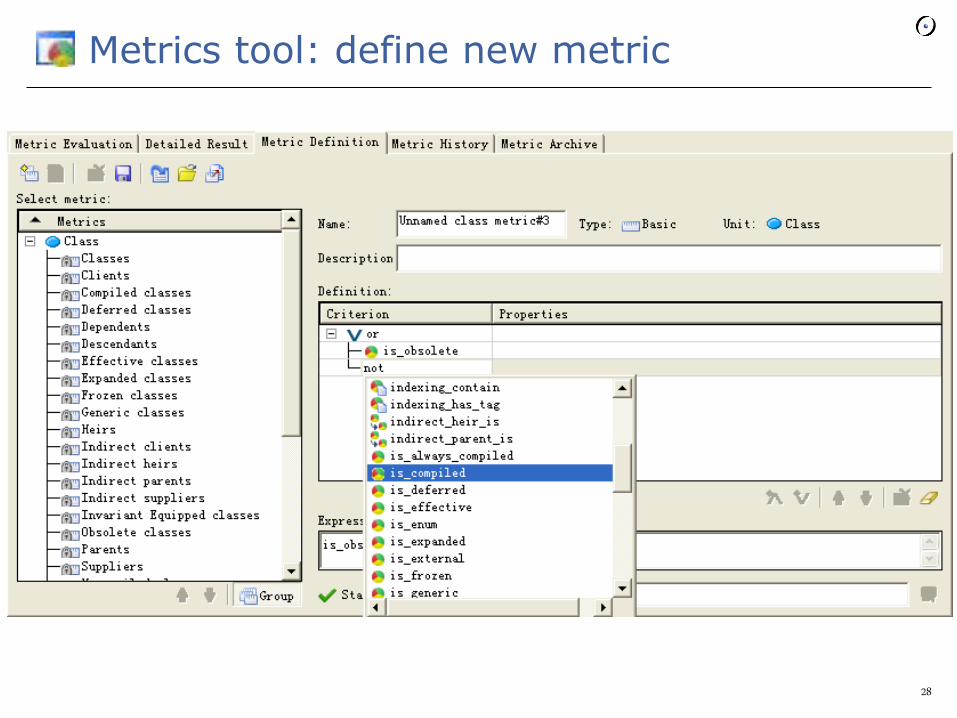
Metrics tool: define new metric
28
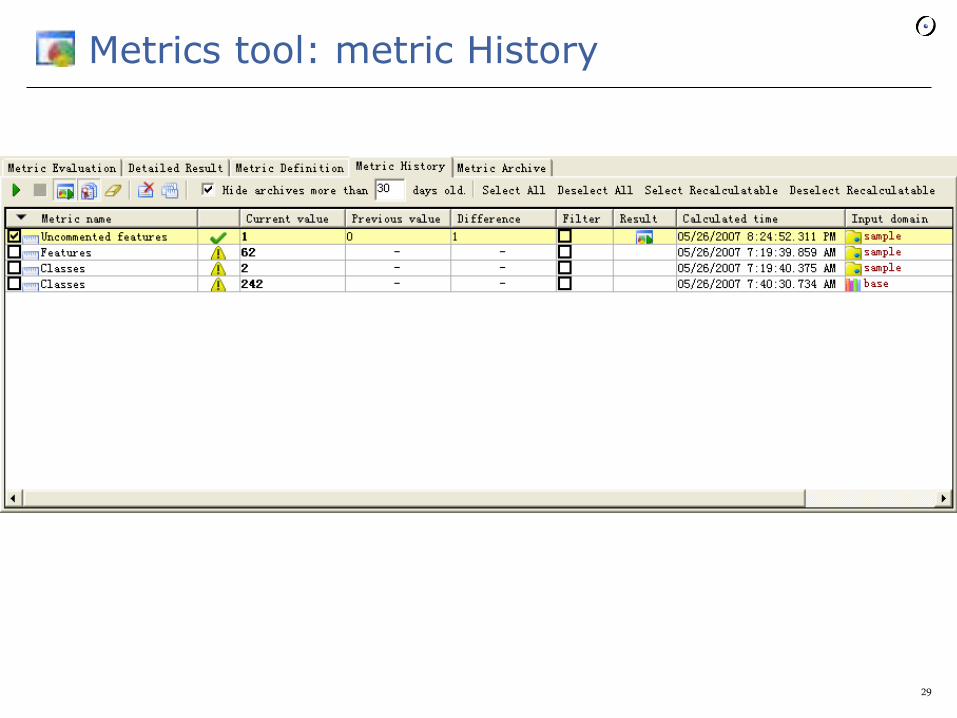
Metrics tool: metric History
29
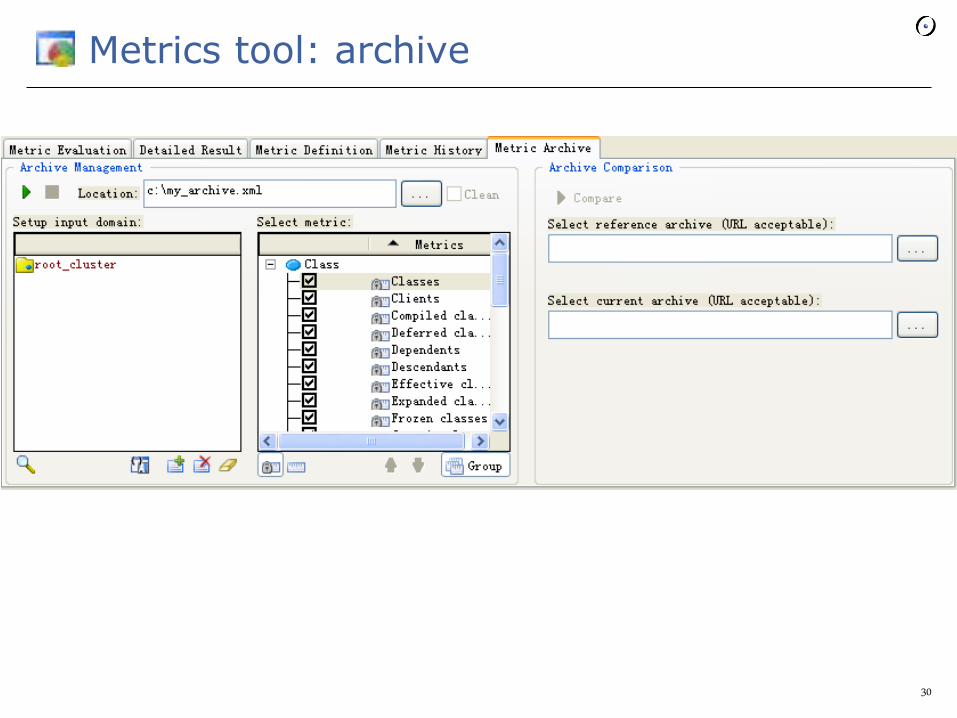
Metrics tool: archive
30

McCabe cyclomatic complexity
A measure based on a connected graph of the module
(shows the topology of control flow within the program)
Definition
M = E − N + P where
M = cyclomatic complexity
E = the number of edges of the graph
N = the number of nodes of the graph
P = the number of connected components.
31
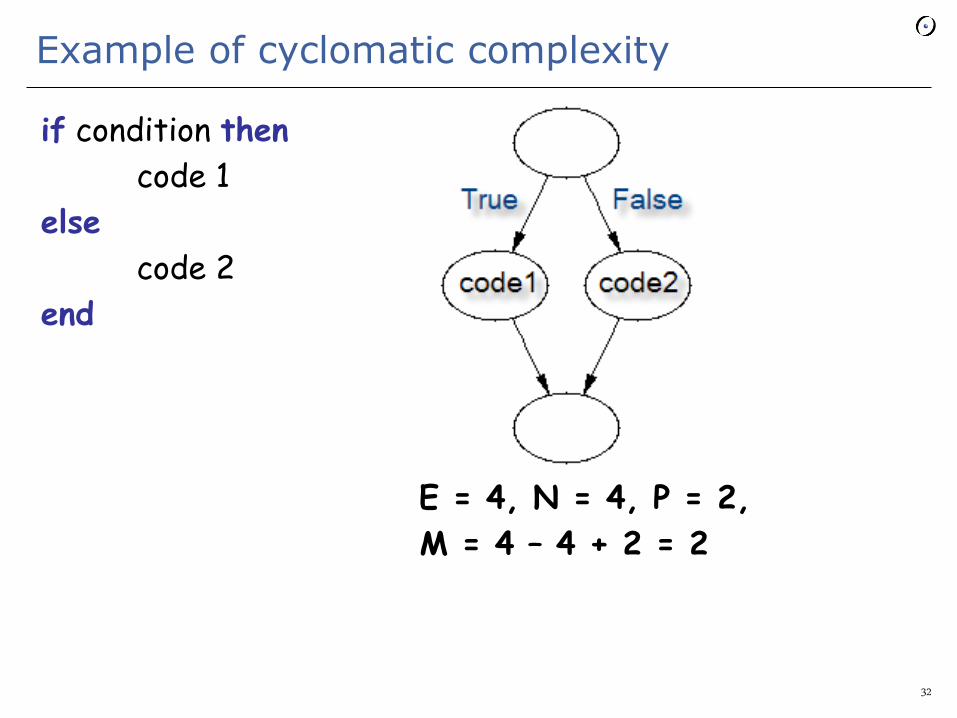
Example of cyclomatic complexity
if condition then
code 1
else
code 2
end
E = 4, N = 4, P = 2,
M = 4 – 4 + 2 = 2
32
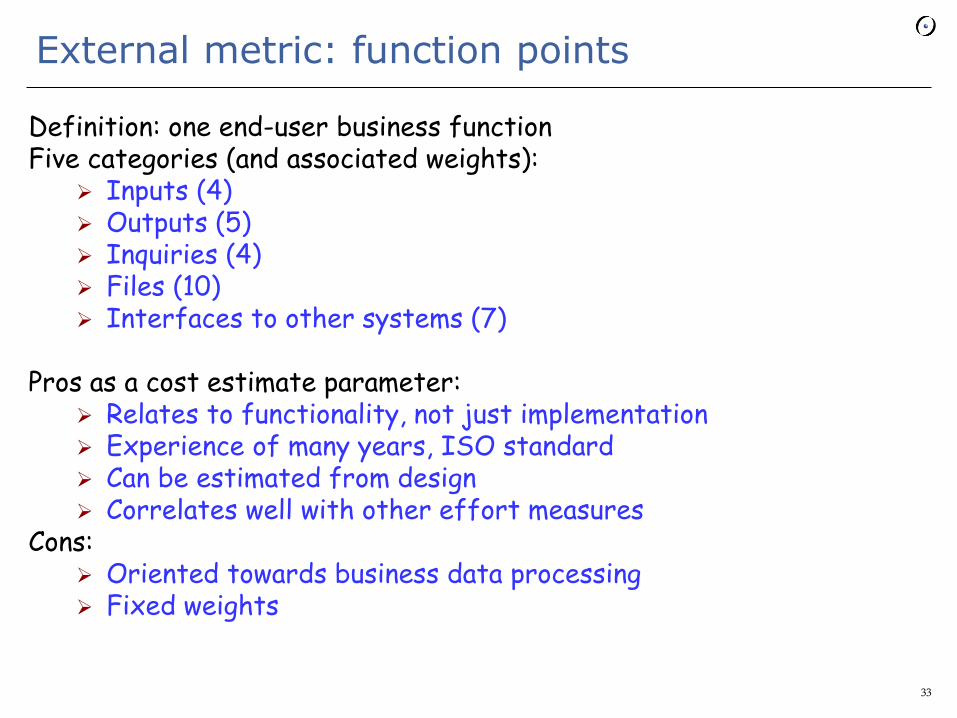
External metric: function points
Definition: one end-user business function Five categories (and associated weights):
Inputs (4) Outputs (5) Inquiries (4) Files (10) Interfaces to other systems (7)
Pros as a cost estimate parameter:
Relates to functionality, not just implementation Experience of many years, ISO standard Can be estimated from design Correlates well with other effort measures
Cons: Oriented towards business data processing Fixed weights
33
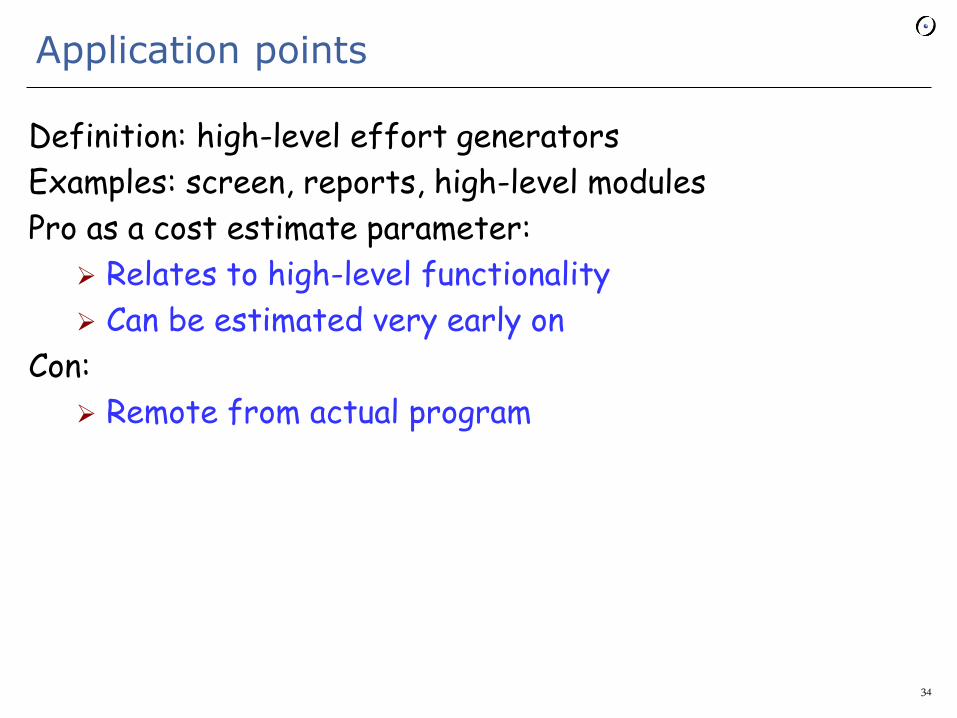
Application points
Definition: high-level effort generators
Examples: screen, reports, high-level modules
Pro as a cost estimate parameter:
Relates to high-level functionality
Can be estimated very early on
Con:
Remote from actual program
34
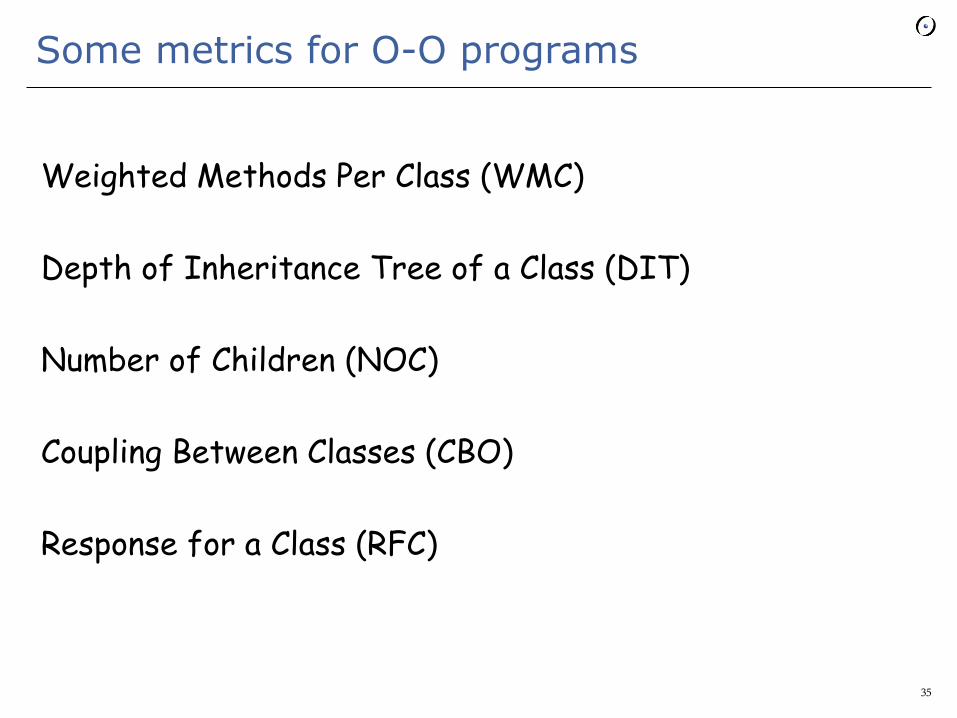
Some metrics for O-O programs
Weighted Methods Per Class (WMC)
Depth of Inheritance Tree of a Class (DIT)
Number of Children (NOC)
Coupling Between Classes (CBO)
Response for a Class (RFC)
35
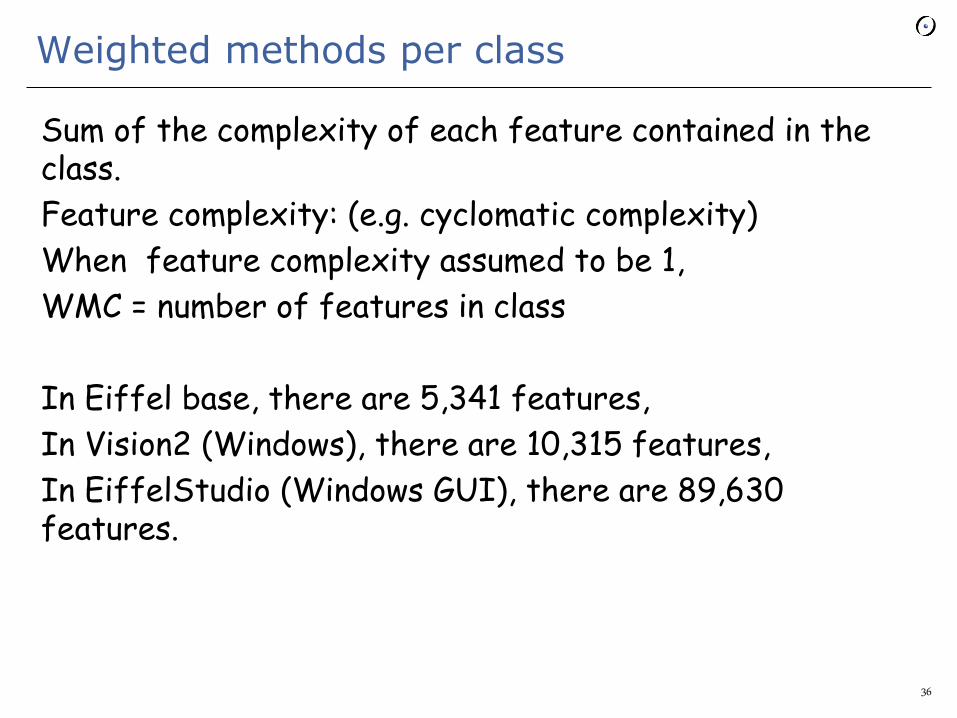
Weighted methods per class
Sum of the complexity of each feature contained in the class.
Feature complexity: (e.g. cyclomatic complexity)
When feature complexity assumed to be 1,
WMC = number of features in class
In Eiffel base, there are 5,341 features,
In Vision2 (Windows), there are 10,315 features,
In EiffelStudio (Windows GUI), there are 89,630 features.
36
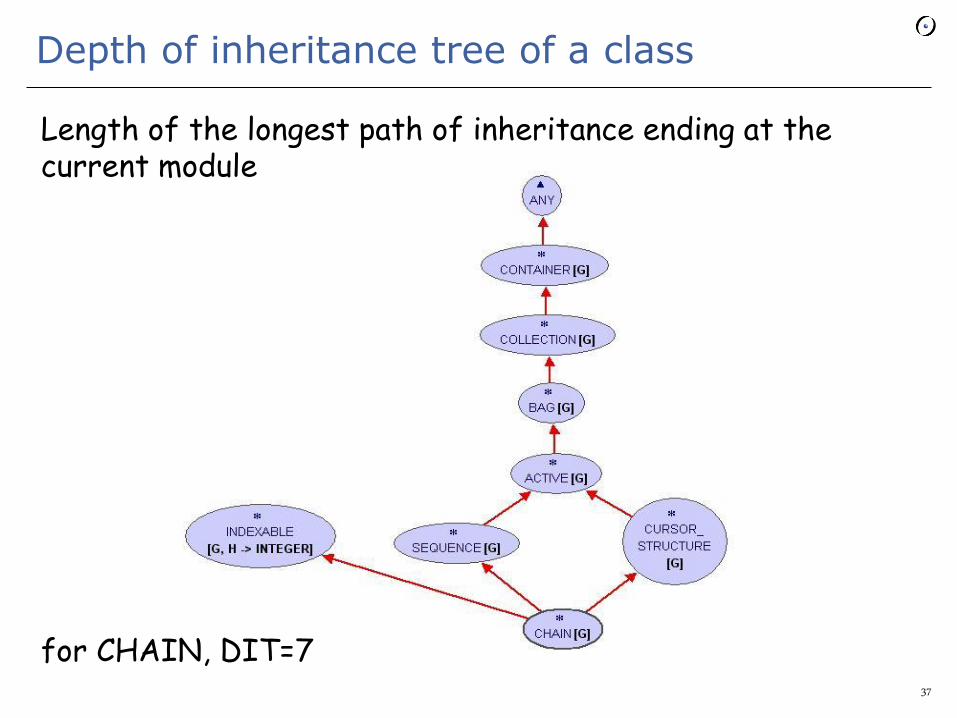
Depth of inheritance tree of a class
Length of the longest path of inheritance ending at the current module
for CHAIN, DIT=7 37

Number of children
Number of immediate subclasses of a class.
In Eiffel base, there are 3 classes which have more than 10 immediate subclasses:
ANY
COMPARABLE
HASHABLE
And of course, ANY has most children.
38
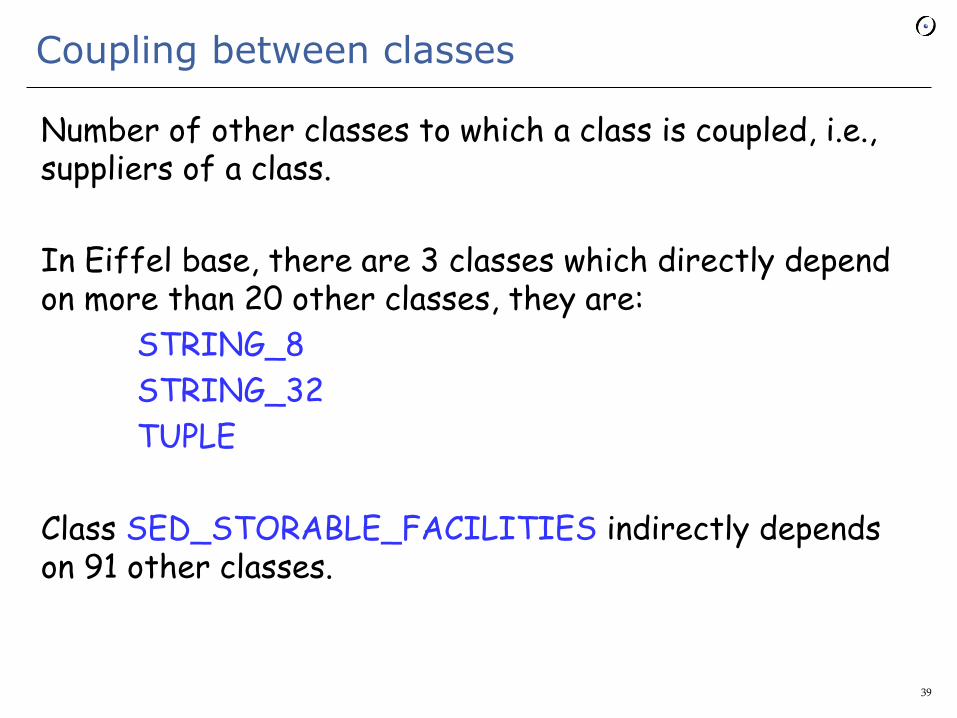
Coupling between classes
Number of other classes to which a class is coupled, i.e., suppliers of a class.
In Eiffel base, there are 3 classes which directly depend on more than 20 other classes, they are:
STRING_8
STRING_32
TUPLE
Class SED_STORABLE_FACILITIES indirectly depends on 91 other classes.
39
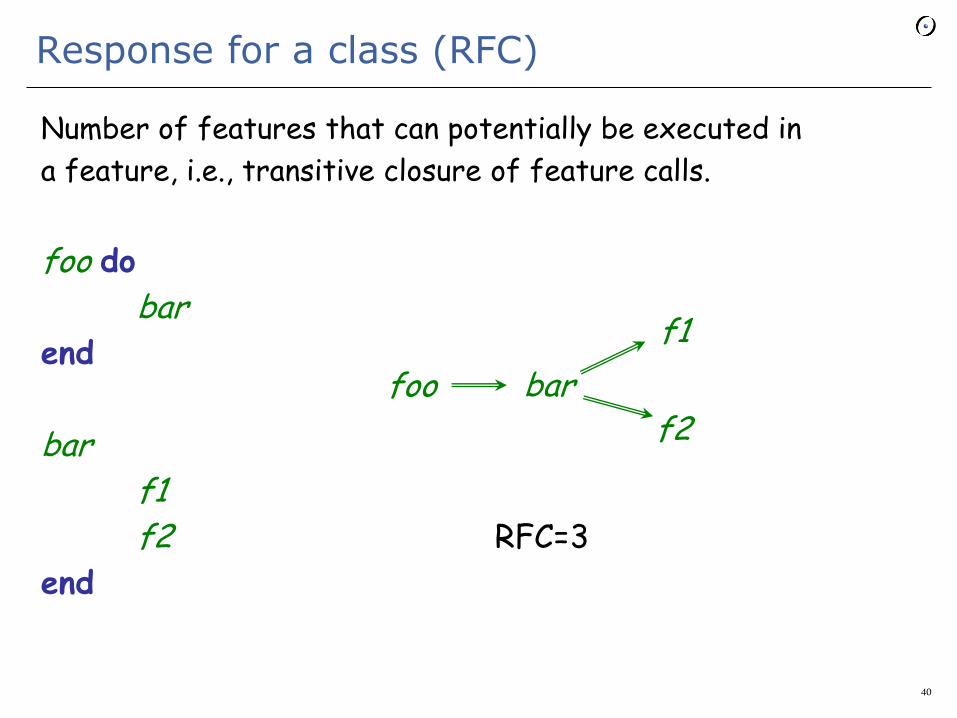
Number of features that can potentially be executed in
a feature, i.e., transitive closure of feature calls.
foo do
bar end
bar
f1
f2 RFC=3
end
Response for a class (RFC)
foo bar
f1
f2
40
41
Cost estimation techniques
(This part of the material comes for a large part from Steve McConnell, Sofware Estimation, Microsoft Press, 2006, and B.W. Boehm et al., Software Cost Estimation with Cocomo II, Addison-Wesley, 2000)
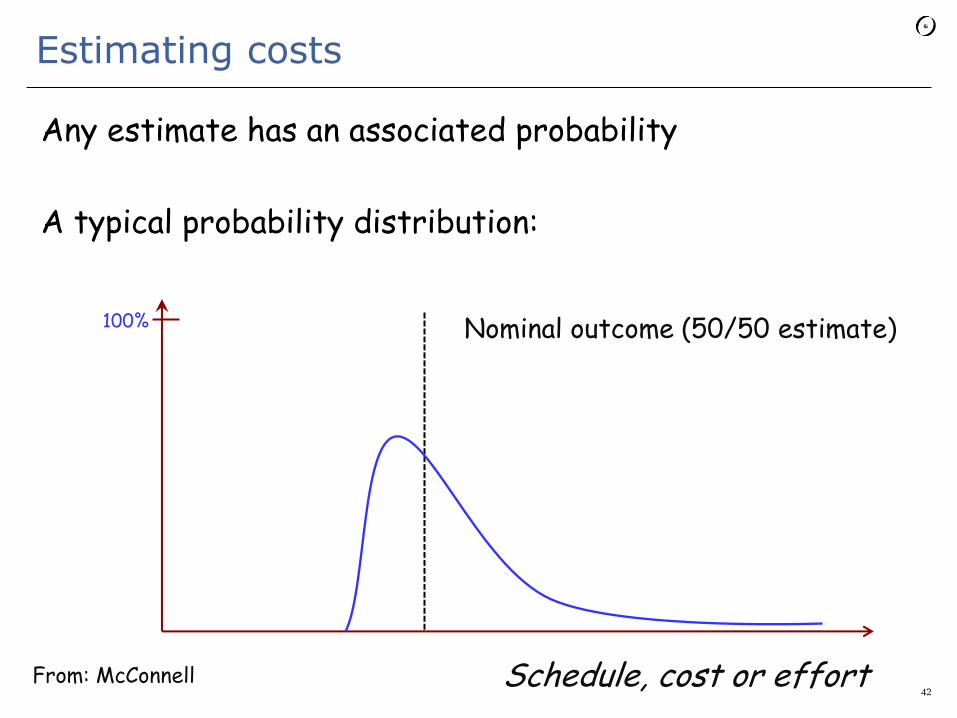
Estimating costs
Any estimate has an associated probability
A typical probability distribution:
42
100%
Schedule, cost or effort
Nominal outcome (50/50 estimate)
From: McConnell

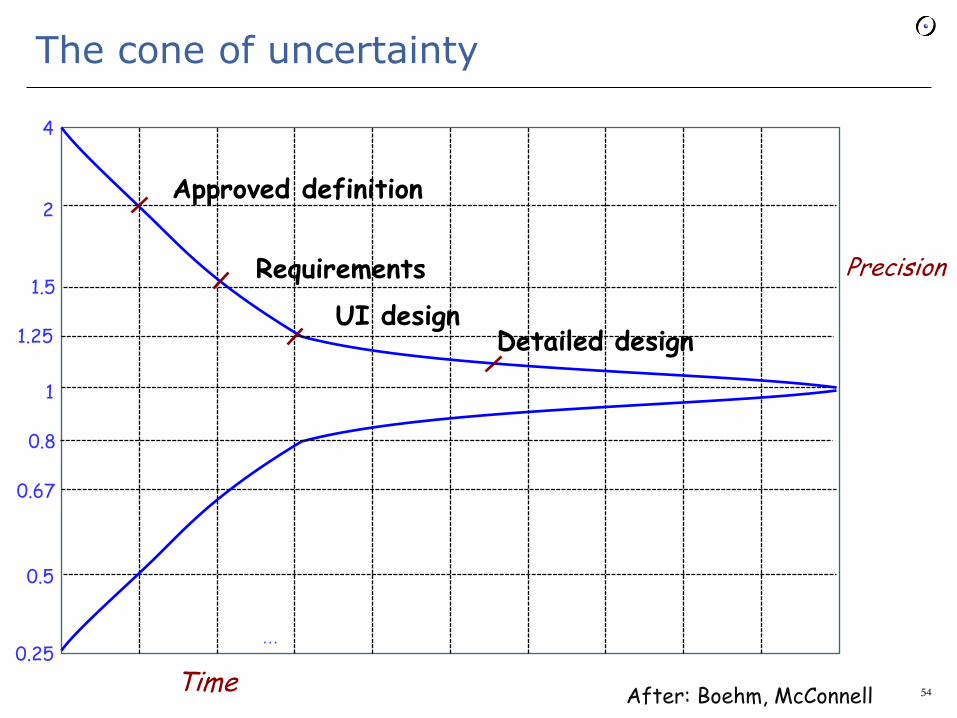
The cone of uncertainty
43
1
2
4
0.25
0.5
…
1.5
1.25
0.67
0.8
After: Boehm, McConnell Time
Precision
Approved definition
Requirements
UI design Detailed design
Limits to the cone model
You get a cone that narrows itself (not a cloud) only if the project is well controlled and the estimates are regularly and effectively updated.
With these qualifications, the cone model is superior to single-point estimates
44
Sources of uncertainty
1 The development process
2 Unstable requirements
3 Unaccounted activities
4 Optimism
5 Bias
6 Unsupported precision
45
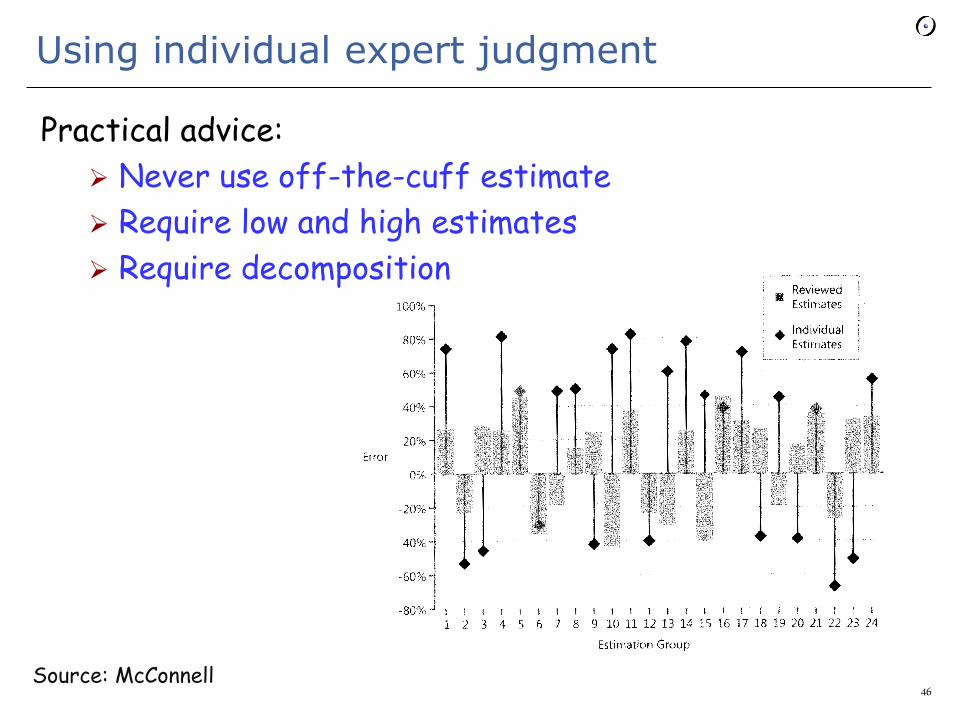
Using individual expert judgment
Practical advice:
Never use off-the-cuff estimate
Require low and high estimates
Require decomposition
46 Source: McConnell
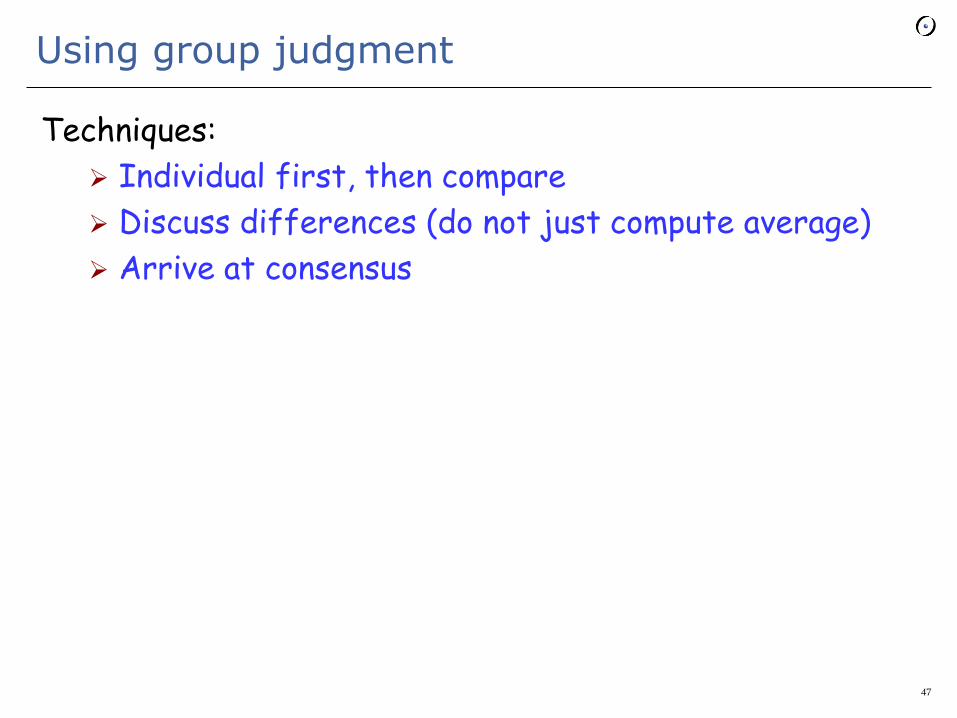
Using group judgment
Techniques:
Individual first, then compare
Discuss differences (do not just compute average)
Arrive at consensus
47
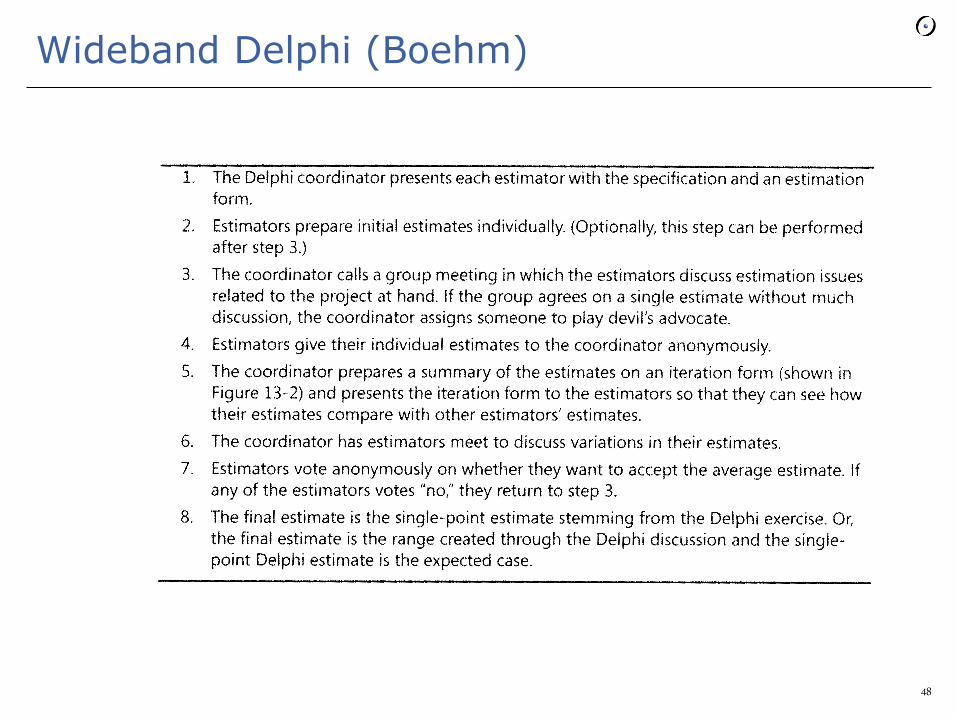
Wideband Delphi (Boehm)
48

Effectiveness of Wideband Delphi (McConnell)
49 Source: McConnell
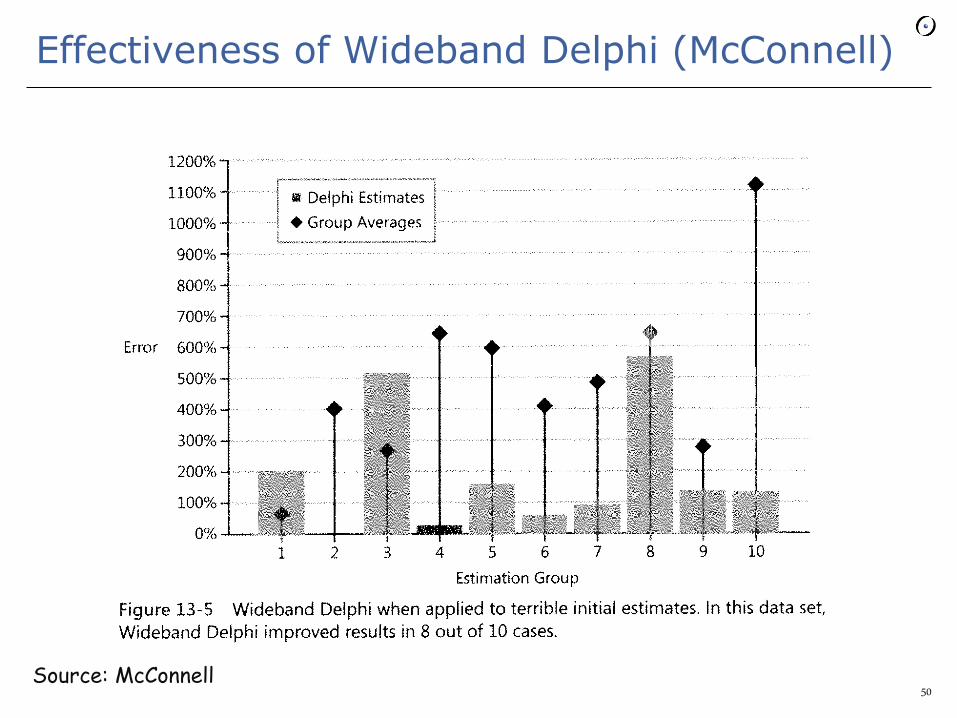
Effectiveness of Wideband Delphi (McConnell)
50 Source: McConnell

Decompose and recompose
Basic idea: find a division of the task into subtasks (function-based or step-based), estimate the subtasks, and combine the results.
Advantage: errors may compensate each other
Risk: accumulation of optimistic estimates
Advice: enforce best-case and worst-case estimate for each subtask
51
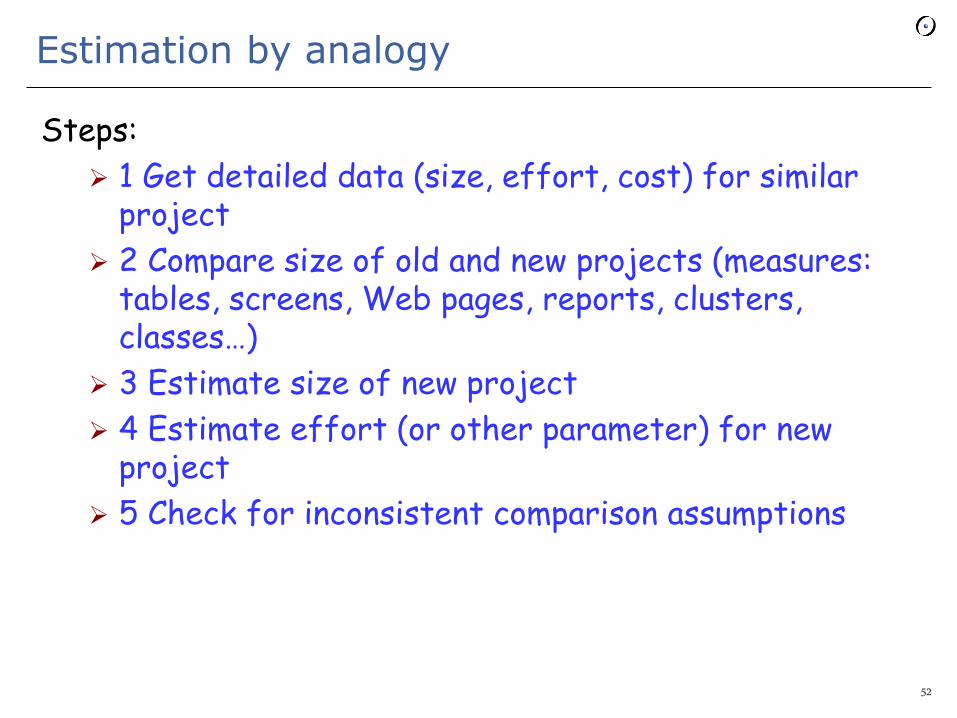
Estimation by analogy
Steps:
1 Get detailed data (size, effort, cost) for similar project
2 Compare size of old and new projects (measures: tables, screens, Web pages, reports, clusters, classes…)
3 Estimate size of new project
4 Estimate effort (or other parameter) for new project
5 Check for inconsistent comparison assumptions
52
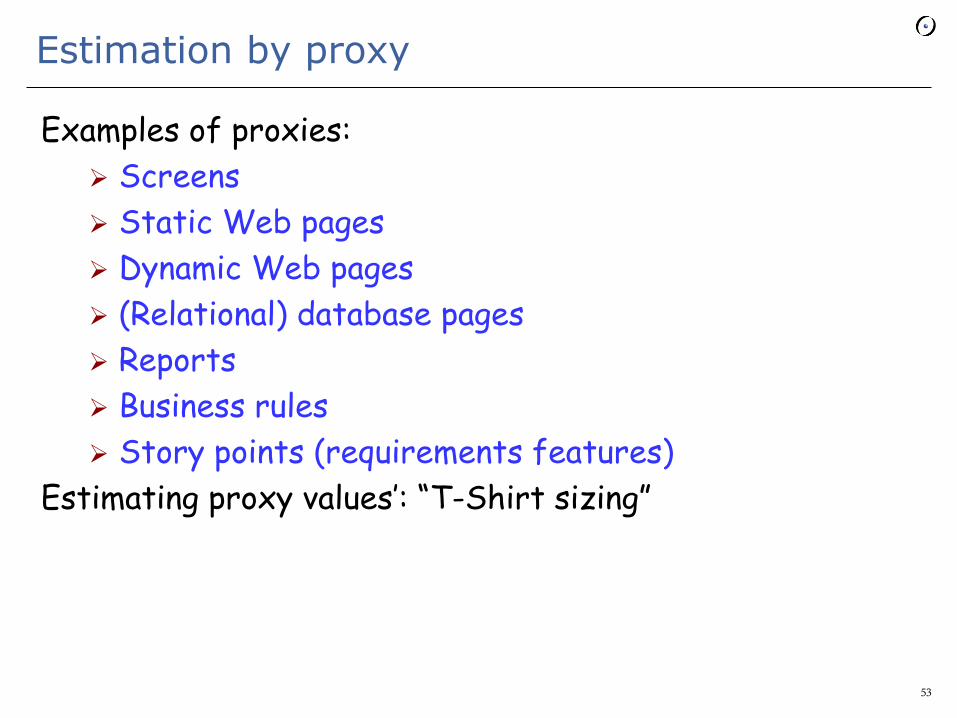
Estimation by proxy
Examples of proxies:
Screens
Static Web pages
Dynamic Web pages
(Relational) database pages
Reports
Business rules
Story points (requirements features)
Estimating proxy values’: “T-Shirt sizing”
53
The cone of uncertainty
54
1
2
4
0.25
0.5
…
1.5
1.25
0.67
0.8
After: Boehm, McConnell Time
Precision
Approved definition
Requirements
UI design Detailed design
Cost models
How do you estimate the cost of a project, before starting the project?
55

Cost models
Purpose: estimate in advance the effort attributes (development time, team size, cost) of a project
Problems involved:
Find the appropriate parameters defining the project (making sure they are measurable in advance)
Measure these parameters
Deduce effort attributes through appropriate mathematical formula
Best known model: COCOMO (B. W. Boehm)
56
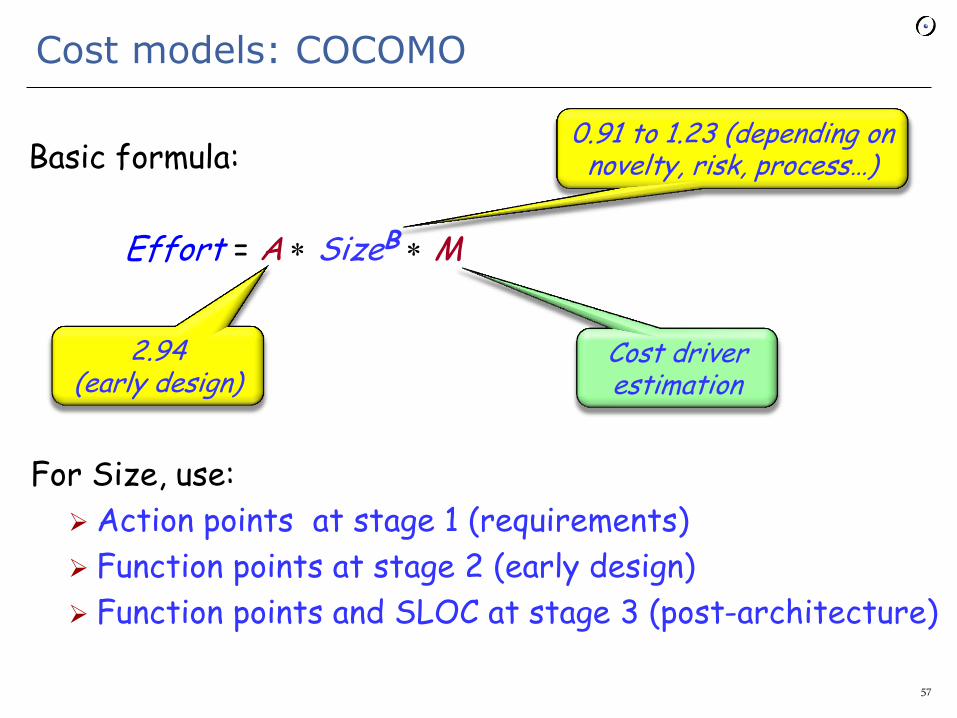
Cost models: COCOMO
Basic formula:
Effort = A * SizeB * M
Cost driver estimation
For Size, use:
Action points at stage 1 (requirements)
Function points at stage 2 (early design)
Function points and SLOC at stage 3 (post-architecture)
2.94 (early design)
0.91 to 1.23 (depending on novelty, risk, process…)
57

COCOMO cost drivers (examples)
Early design: Product reliability &
complexity
Required reuse
Platform difficulty
Personnel capability
Personnel experience
Schedule
Support facilities
Postarchitecture: Product reliability & complexity
Database size
Documentation needs
Required reuse
Execution time & storage constraints
Platform volatility
Personnel experience & capability
Use of software tools
Schedule
Multisite development
58
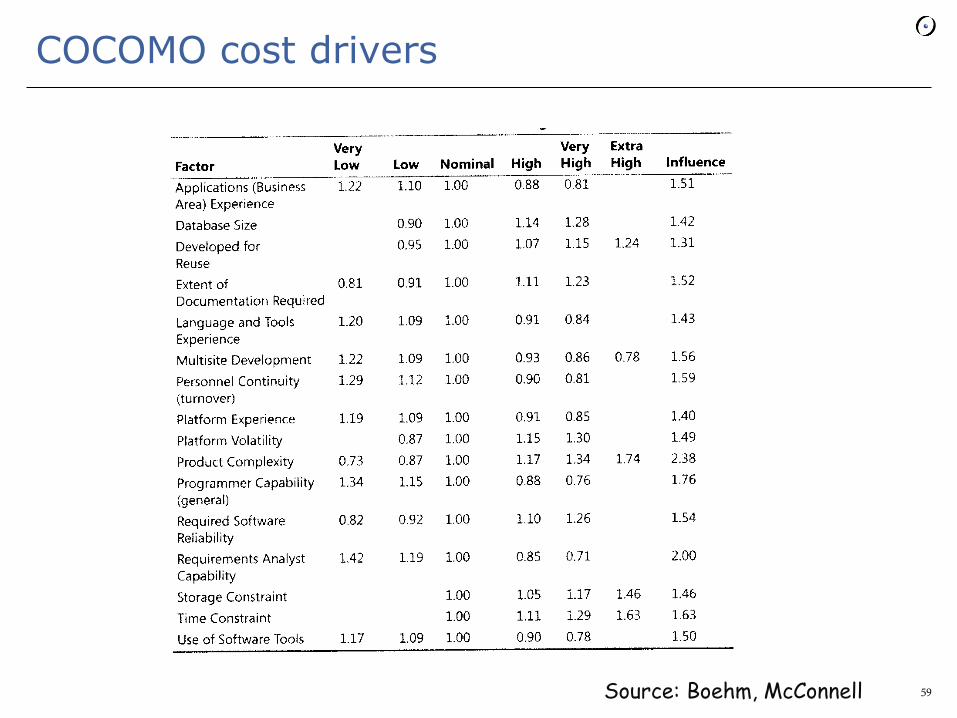
COCOMO cost drivers
59 Source: Boehm, McConnell
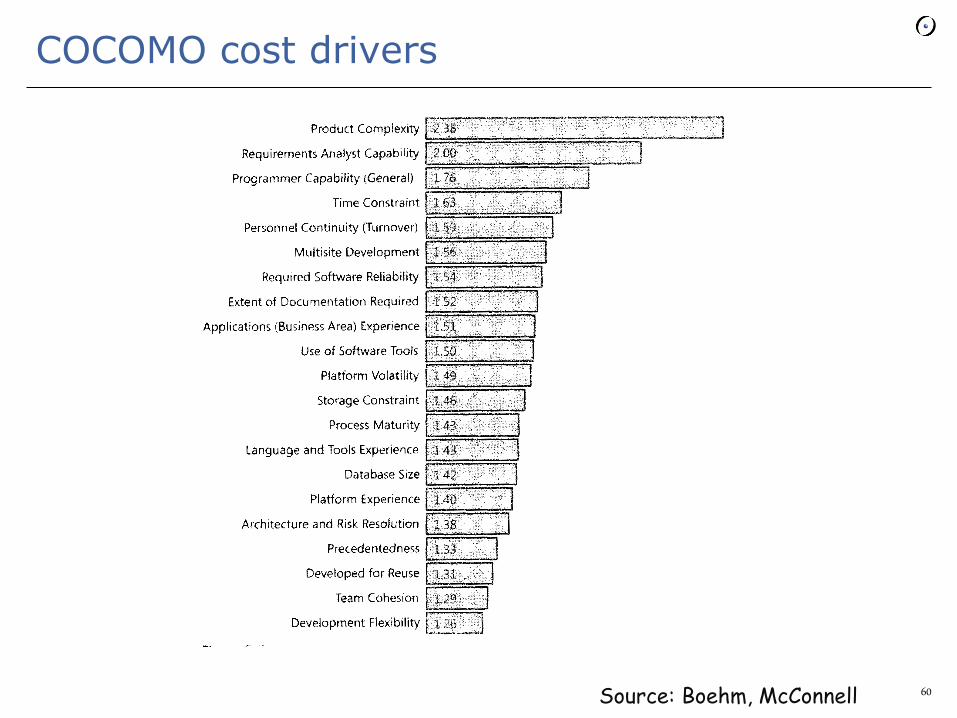
COCOMO cost drivers
60 Source: Boehm, McConnell
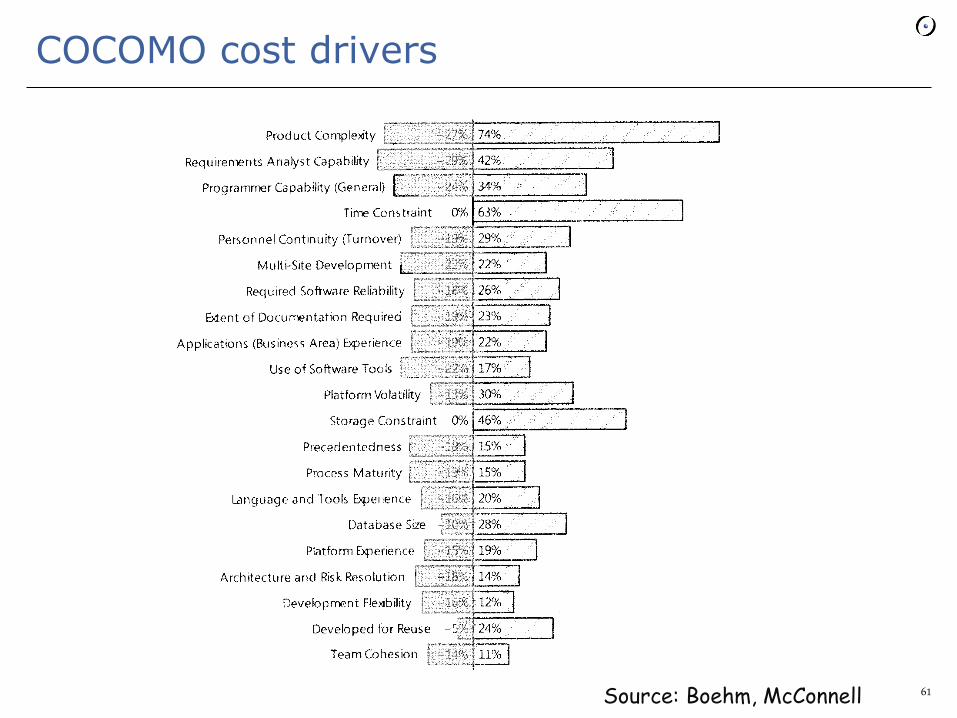
COCOMO cost drivers
61 Source: Boehm, McConnell
About cost models
Easy to criticize, but seem to correlate well with measured effort in well-controlled environments
Useful only in connection with long-running measurement and project tracking policy; cf CMMI, PSP/TSP
Worth a try if you are concerned with predictability and cost control
62
Reliability models
Goal: to estimate the reliability – essentially, the likelihood of faults – in a system.
Basis: observed failures
Source: hardware reliability studies; application to software has been repeatedly questioned, but the ideas seem to hold
63
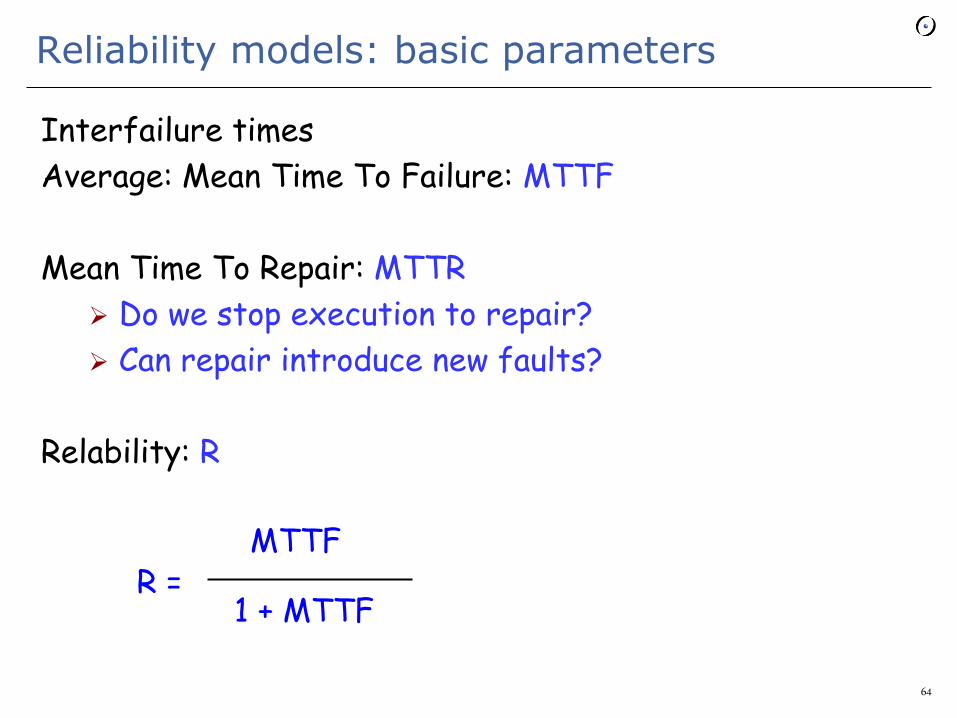
Reliability models: basic parameters
Interfailure times
Average: Mean Time To Failure: MTTF
Mean Time To Repair: MTTR
Do we stop execution to repair?
Can repair introduce new faults?
Relability: R
R =
MTTF
1 + MTTF
64
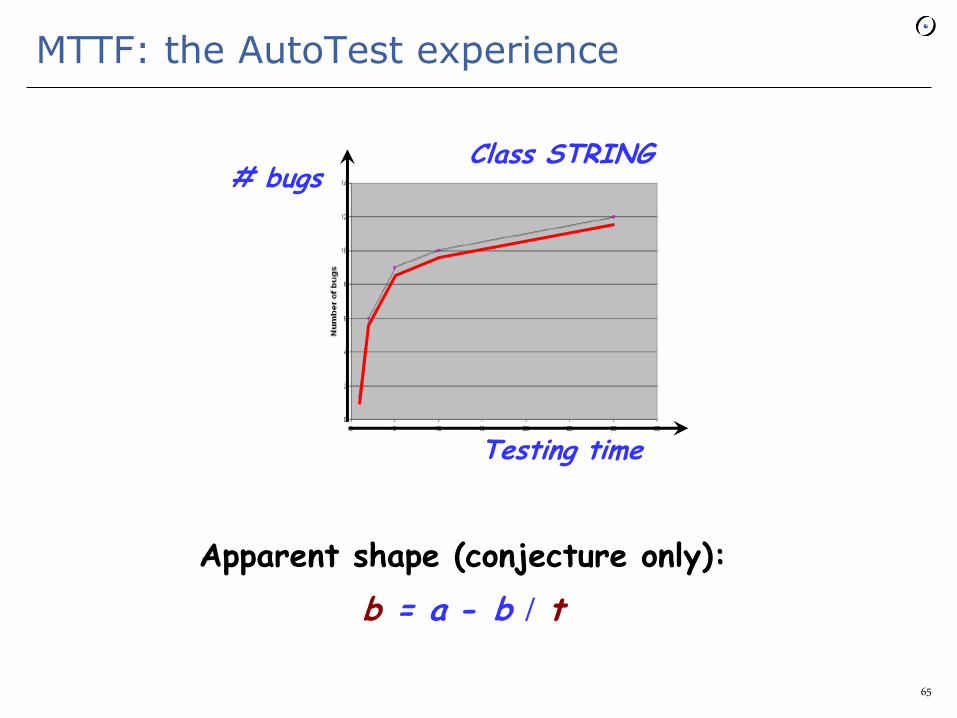
MTTF: the AutoTest experience
# bugs Class STRING
Testing time
Apparent shape (conjecture only):
b = a - b / t
65
Reliability models
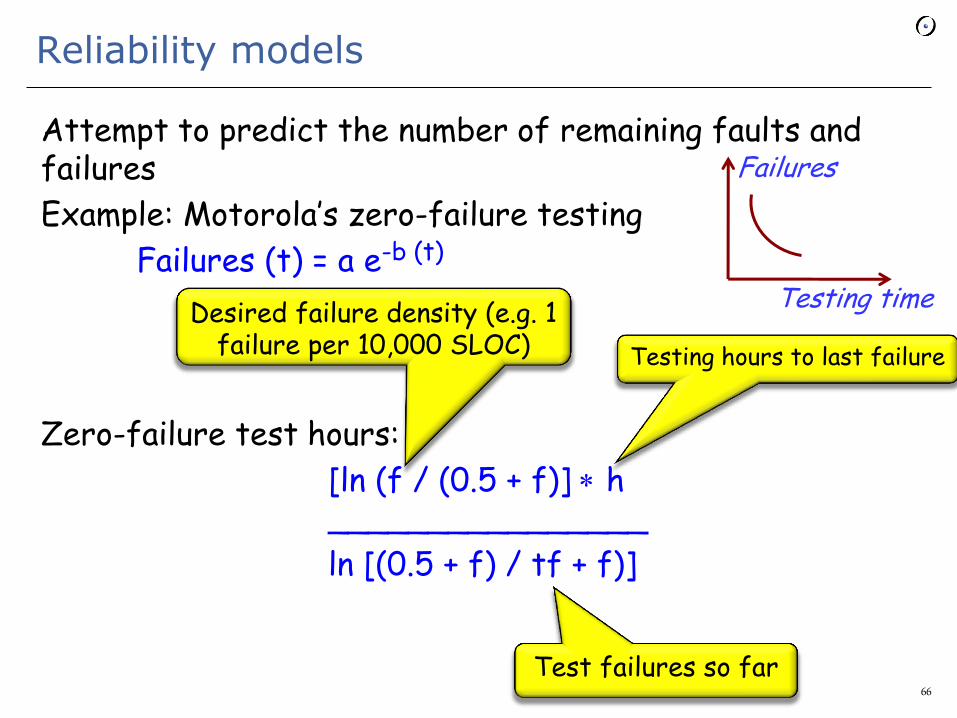
Attempt to predict the number of remaining faults and failures
Example: Motorola’s zero-failure testing
Failures (t) = a e-b (t)
Zero-failure test hours:
[ln (f / (0.5 + f)] * h ________________
ln [(0.5 + f) / tf + f)]
Testing hours to last failure
Test failures so far
Desired failure density (e.g. 1 failure per 10,000 SLOC)
66
Failures
Testing time
Software metrics: methodological guidelines
Measure only for a clearly stated purpose
Specifically: software measures should be connected with quality and cost
Assess the validity of measures through controlled, credible experiments
Apply software measures to software, not people
GQM (see below)
67
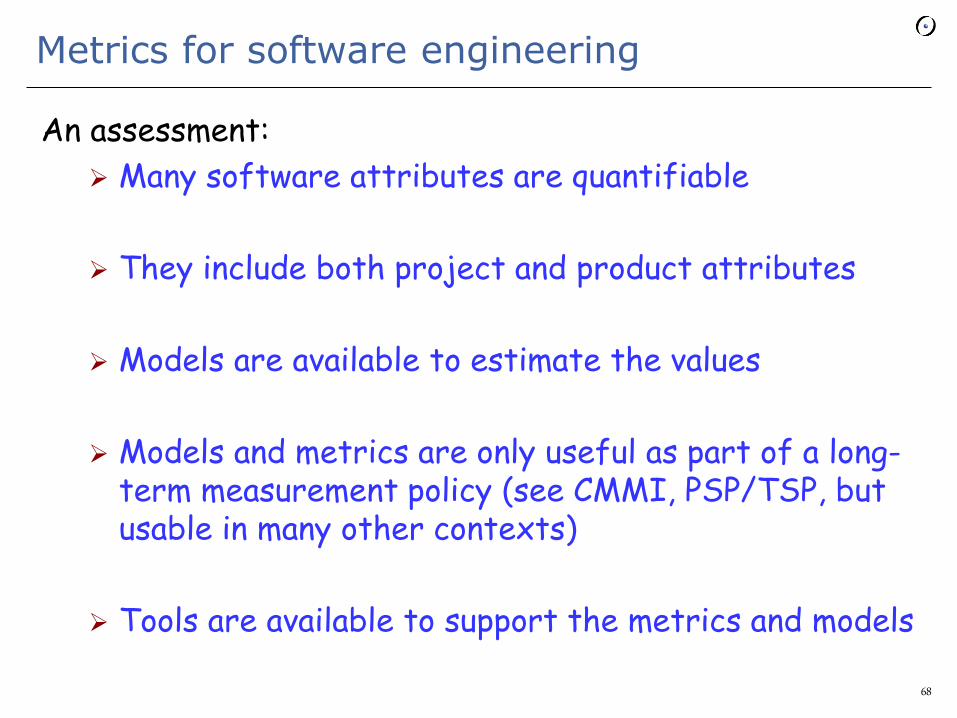
Metrics for software engineering
An assessment:
Many software attributes are quantifiable
They include both project and product attributes
Models are available to estimate the values
Models and metrics are only useful as part of a long-term measurement policy (see CMMI, PSP/TSP, but usable in many other contexts)
Tools are available to support the metrics and models
68