“A study of Non Performing Asset Management of Bank of India”

AN OVERVIEW OF NON-PERFORMING ASSET OF
NEPALESE COMMERCIAL BANKS
(WITH REFERENCE TO NEPAL INVESTMENT BANK LTD.,
NABIL BANK LIMITED & NEPAL BANGLADESH BANK LTD.)
BY
MANISHA SHRESTHA
THAKUR RAM MULTIPLE CAMPUS, BIRGUNJ
T. U. REGISTRATION NO. - 7-2-400-24-2000
CAMPUS ROLL NO. 66/090
A THESIS SUBMITTED TO:
OFFICE OF THE DEAN
FACULTY OF MANAGEMENT
TRIBHUWAN UNIVERSITY
IN PARTIAL FULFILLMENT OF THE REQUIREMENT OF THE
DEGREE OF MASTER'S OF BUSINESS STUDIES (MBS)
BIRGUNJ
March, 2010

2
RECOMMENDATION
This is to certify that the thesis
Submitted by:
Manisha Shrestha
Entitled:
AN OVERVIEW OF NON-PERFORMING ASSET OF NEPALESE COMMERCIAL BANKS
(WITH REFERENCE TO NEPAL INVESTMENT BANK LTD., NABIL BANK LIMITED &
NEPAL BANGLADESH BANK LTD.)
has been prepared as approved by this Campus in prescribed format
of the Faculty of Management. This thesis is forwarded for examination.
………..………..
Campus Chief
(Thakur Ram Multiple Campus)
BIRGUNJ
………………….
Mr. Sanjay Shrestha (Thesis Supervisor)
………………….
Mr. Rajeshwar Pd. Acharya (Head of the Research Committee)

3
DECLARATION
I hereby declare that the works reported in this thesis entitled “An overview of
“Non - Performing Asset of commercial banks (With reference to Nepal
Investment Bank Ltd., NABIL Bank Ltd. & Nepal Bangladesh Bank Ltd.)”
submitted to a Thakur Ram Multiple Campus, Faculty of Management, Tribhuwan
University, is my original work done for partial fulfillment of the requirement for
the Master’s Degree in Business Studies (MBS) under the supervision of Mr.
Sanjay Shrestha Associate Professor of Thakur Ram Multiple Campus.
Manisha Shrestha
Researcher
T.U. Registration No. 7-2-400-24-2000
Faculty of Management
Thakur Ram Multiple Campus.

4
VIVA -VOCE SHEET
We have conducted the viva-voce examination of the thesis presented by
MANISHA SHRESTHA
Entitled:
AN OVERVIEW OF NON-PERFORMING ASSET OF NEPALESE COMMERCIAL BANKS
(WITH REFERENCE TO NEPAL INVESTMENT BANK LTD., NABIL BANK LIMITED &
NEPAL BANGLADESH BANK LTD.)
and found the thesis to be original work of the student and written
according to the prescribed format. We recommend the thesis to be
accepted as partial fulfillment of the requirement for the
Master’s Degree in Business Studies (M.B.S.)
Viva-voce Committee
Head of Department ………………..
Member (Thesis Supervisor) ………………….
Member (External Expert) ………………….

5
ACKNOWLEDGEMENTS
To do a research work is really not an easy job. Spending so many months on the
collection at the materials from library and other sources and taking the valuable
guidelines of many respectable lecturers; Mr. Sanjay shrestha, Mr. Lalan Dubedi, &
Associate Professors Mr. Rajeshwor Acharya, Dr. Deepak Shakya, and Mr. Abhinash
Prasad Singh, I became able to complete this thesis.
Moreover, I also cannot forget the kind co operation of Mr. Krishna Thapa - Relationship
Manager of M/S Nabil Bank Ltd, who in spite of his busy schedule provided me his
valuable and insightful suggestion in order to prepare this thesis.
I would also like to extend my cordial thanks to all my teachers & bank staffs, who
constantly encourage me to prepare this thesis “An Overview at Non-performing Asset
of Nepalese commercial Banks (With reference to NBBL, NABIL & NBBL)” in this
form.
As it is my first effort, there may be some weakness in my presentation. And for those
weaknesses I would like to invite all the readers to give their comments & suggestions if
any.
Lastly, I would like to say confidently that this report of mine will be highly useful to the
students of Business Students and to all who are interested in this topic.
______________________
Manisha Shrestha
Thaku Ram Multiple Campus
March, 2010

6
ABBREVIATIONS
AIR Accrued Interest Receivable
AMC Asset Management Company
CIB Credit Information Bureau
C.V. Coefficient of Variation
NIB Nepal Investment Bank Ltd.
NABIL Nabil Bank Ltd.
NBBL Nepal Bangladesh Bank Ltd.
F/Y Fiscal Year
L & A Loan and Advances
Ltd. Limited
MIS Management Information System
NO.(N) Number
NP Net Profit
NPA Non Performing Asset
NRB Nepal Rastra Bank
NSBs National Saving Bonds
P.E. Probable Error
RBB Rastriya Banijya Bank
Rs. Rupees
r Correlation Coefficient
S.D.( ) Standard Deviation
EVC Everest College
TA Total Asset
TD Total Deposit
T.U. Tribhuwan University
% Percentage

7
TABLE OF CONTENTS
Page No
Recommendation I
Viva-Voce Sheet II
Acknowledgement III
Declaration IV
Abbreviations 1
Table of contents 2 – 5
CHAPTER- I INTRODUCTION
1.1 Background of the study 6
1.1.1 Brief History of Evolution of Banking 9
1.1.2 Banking system in Nepal 10
1.1.3 Brief Introduction of Commercial Bank 12
1.1.4 Brief Profile of the Subjected Banks 13
1.2 Focus of the study 18
1.2.1 NPA (Non Performing assets) in present context 20
1.3 Statement of the problem 22
1.4 Importance of the Study 22
1.5 Objective of the study 23
1.6 Limitation of the study 23

8
1.7 Organization of the study 24
CHAPTER- II REVIEW OF LITERATURE
2.1 Conceptual/Theoretical Review 26
2.1.1 Loans, Discounts and Overdrafts (LDO) 27
2.1.2 Loan Classification 27
2.1.3 Past Due/Overdue 28
2.1.4 Performing Assets (Loans) 28
2.1.5 Non-performing Assets/Loans (NPA / NPL) 28
2.1.5.a Reason behind high level of NPL 28
2.1.5.b Loan Loss Provision 29
2.1.6 Why Loans go bad? 29
2.1.7 Challenges 33
2.2 Review of Books 35
2.3 Review of Relevant NRB Directives 38
2.4 Review of Relevant Articles/Journals 45
2.5 Review of Related Thesis 52
2.6 Research Gap 58

9
CHAPTER- III RESEARCH METHODOLOGY
3.1 Research Design 62
3.2 Size of Populations and Sampling 62
3.3 Sources of Data 63
3.4 Data Collection Techniques 63
3.5 Data Analysis Tool 63
3.5.1 Financial Tools 64
3.5.1.1 Ratio Analysis 64
3.5.2 Statistical Tools 67
3.5.2.1 Percentages 67
3.5.2.2 Measures of Central Tendency 68
3.5.2.3. Measures of Dispersion 68
3.5.2.4 Standard Deviation 68
3.5.2.5 Coefficient of Variation 69
3.5.2.6 Correlation Coefficient (r)
3.5.3 Trend Analysis 71
3.5.4 Diagrammatic and Graphical Representation 72
CHAPTER- IV DATA PRESENTATION AND ANALYSIS
4.1 Ratio Analysis 74
4.1.1 Loans and Advances to Total Asset Ratio 74
4.1.2 Loans and Advances to Total Deposit Ratio (CD ratio) 75
10
4.1.3 Non-Performing Assets (Loans) to Total Loans and Advances Ratio 76
4.1.4 Loan Loss Provision to Total Loans and Advances Ratio 78
4.1.5 Provision Held to Non-Performing Loan Ratio 79
4.1.6 Return on loans and advances 81
4.2 Correlation Analysis 85
4.2.1 Correlation between Loan Loss Provision and Loans and Advances 85
4.2.2 Correlation between Loan Loss Provision and Non Performing Loan 86
4.2.3 Correlation between Loans and advances and Deposit 88
4.3 Trend Analysis 89
4.3.1 Trend Analysis of Loans and Advances 89
4.3.2 Trend Analysis of Non-Performing Assets (Loan) 92
4.3.3 Trend Analysis of Loan Loss Provision 94
4.3.4 Trend Analysis of Net Profit 97
4.4 Comparison of Credit Quality of Subjected Banks 99
4.5 Major Findings of the Study 102
CHAPTER – V SUMMARY, CONCLUSIONS AND RECOMMENDATIONS
5.1 Summary 108
5.2 Conclusions 111
5.3 Recommendations 113
Bibliography
Appendix

11
CHAPTER- I
INTRODUCTION
1.1 Background of the Study
Financial sector of any economy plays a vital role in its development and are currently viewed
as catalyst in the process economic growth of a country. This sector is the backbone of
developing country like Nepal. This sector has been gradually developed from the time of
economic liberalization in Nepal. There is no doubt that a sound financial system will certainly
boost the pace of development.
Financial sector of Nepalese economy is composed of two sector i.e., banking sector and non-
Banking sector. Banking sector means which purely provides Banking facilities like different
range of short term and long term loans, collection of deposits (short term /long term),
remittance service, LC, etc where as Non Banking sector means which mainly does activities of
deposits and loans and advances on narrow basis. Banking sector of Nepal comprises of Nepal
Rastra Bank, commercial Banks & development Banks. Nepal Rastra Bank is apex body of all
financial institutions of Nepal. The establishment of commercial Bank has reached up to 25 in
Nepalese economy and there are a lot more commercial Banks to come in recent time. Non-
Banking sector of Nepal mainly includes finance companies, cooperative units, micro- credit
development Banks, non government organizations performing limited Banking transactions.

12
Financial sector in Nepalese economy is a symbol of customary organization, where other
sector’s organization portrays to be like that. Financial sector represents competition,
transparency, financial discipline and self governance. The main activity of financial sector is
to play on interest rate whether it is on deposits or loans and advances. Beside this, it has to
deal with statutory reserve requirement, targeted credit programs, securities, trading insurance
service, practices like maintaining capital adequacy, loan loss provision, auditing etc.
Financial sector is a system on which whole body of an economy stands. It is applicable to any
type of economy whether it is developing or developed. Furthermore, it also supports other
sector. It works as lubricant for other sectors to grow. Financial intermediaries are gap fulfiller
that bridges between borrower and lender or saver and investor. Financial intermediaries come
up with different avenues to accept money of savers and provide to investors at competitive
price to flourish.
A sound financial system fulfill requirement of all types of customers. In developed economy,
financial institutions have to come with varieties of products and services so that all needs of
particular economy can be fulfilled. Effectiveness and efficiency are key element for financial
sector to survive in any economy. Moreover, any activity must be within a boundary line of
central Bank of that country or regulating body. Financial sector has to provide interest on its
deposits therefore, has compulsion to lend money. Then, there is an issue of defaulter case.
Commercial Banks collect deposits from the public and the largest portion of the deposited
money is utilized in disbursing loans and advances. The balance sheets of the commercial
Banks reflect deposits constitute a major portion of the liabilities and loans and advances
constitute a major portion of the assets. Similarly the profit of the Bank depends upon the

13
spread that it enjoys between the interest it receives from the borrowers and is paid to the
savers. An average Bank generates 65-75% of its revenues through its lending activities. The
return that the Bank enjoys through loans and advances is very attractive but do not come free
of cost and free of risk. There is risk inherent in lending portfolio. Banking sector is exposed to
number of risk like interest rate risk, liquidity risk, credit risk, borrower’s risk etc. Such risks in
excessive form had led many Banks to go Bankrupt in a number of countries.
One of the most critical risks is the borrower’s risk – the risk of non-payment of the disbursed
loans and advances. Failure to collect money lent may sometimes results in the Bank’s inability
to make repayment of the money to the depositors and return to the shareholders and
stakeholders. The risk involved is so high that it can bring Bank to a verge of Bankruptcy. The
Bankers have the responsibility of safeguarding the interest of the depositors, the shareholders
and the society they are serving. If a Bank behaves irresponsibility, the cost borne by the
economy will be enormous.
Due to their central role in the economy, governments and central Banks try their best to rescue
Banks from such situations. Hence to protect the Banks from such situation and protect
depositors and shareholders money, central Bank issues various directives and guidelines from
time to time with modifications and amendments for the sound regulation of the Banking
system. All the Banks have to abide by the rules and regulation issued by the central Bank. Of
the many directives, there are ten directives relating to the Banking prudential regulation/norms
to be followed by the Banks.

14
Financial institutions in Nepal are growing in an unexpected manner and no doubt they will
compete for each other’s market share and provide cut throat competition in the market. In this
scenario default rate is automatically going to increases either intentionally or unintentionally.
Therefore it is one of greatest concern for financial intermediaries to handle such issue. This
default is technically known as non performing Assets (NPA). This default may be on
principal, interest or principal and interest. It is normally not received on maturity period.
1.1.1 Brief History of Evolution of Banking
The Lombards, who were originally from plains of Lombardy of Northern Italy, introduced
Banking practice to England. These lombards brought this business to the city of London and
their home, the Lombard Street, is still the center of British Banking. The Lombards, after a
century or so of business in London, were eventually Bankrupted because they lent money to
Kings who did not repay them.
After the Lombards, Banking was practiced by the goldsmith as a sideline to their normal
activities in the bullion and jewellery fields. The early goldsmith used to have large vaults,
which were soundly built and heavily guarded. The person who deposited surplus funds with
the goldsmith became as a “depositor” and naturally paid for the privilege of having his money
defended this way. These payments were called ‘Bank Charges”. The depositors who needed
funds to pay wages or debts, could call at the Bank and collect such sums as required.
In the east, it is believed that Banking was practiced at the time of “Manu” as referred to in
Manusmriti. There is an opinion that at the time of “Chanakya” also it was in practice, as

15
Banking has been mentioned in “Kautilya’s Arthasastra “which is the first book on economics.
In the west, the history of Banking begins in ancient Greece, Rome and Mesopotamia.
However as a public enterprise, Banking made its first beginning around the middle of the
twelfth century in Italy. The Bank of Venice, founded in 1157 was supposed to be the most
ancient Bank. Bank of Barcelona and the Bank of Geneva in 1401 and 1407 respectively,
followed. Subsequently Bank of Amsterdam set up in 1609, which was very popular then. The
Bank of Venice and the Bank of Geneva continued to operate until the end of eighteenth
century. With the expansion of commercial Banking activities in Northern Europe, there sprang
up a number of private Banking houses in Europe and slowly spread throughout the world.
1.1.2 Banking System in Nepal
Nepal is one of the land locked countries in Asia covered by the UN ESCAP region and is
among the least developed of the developing countries. Land- lockedness is the major
geographic weakness that became the main hindrance in overall development of Nepal. In the
overall development of the Banking system in Nepal, the “Tejarath Adda” may be regarded as
the father of modern Banking institution and for a quite a long time it tendered a good service
to government servants as well as to the general public.If we turn into History, Prime Minister
“Ranodip Singh” took initiative for financial and economic reforms. He introduced ‘Tejarath
Adda ‘to provide credit facilities to general public at a very low rate. Basically concept of
‘Tejarath Adda’ was to provide loan by undertaking collateral of gold and silver. Government
employees have facilities to take loan and that loan was slowly redeemed from their salary.
Furthermore, successive Prime Minister Chandra Shamsher extended its service to outside
Kathmandu Valley. Legal provision was made to prevent the practice of capitalization of
16
Tejarath Adda. This step was towards modern Banking in Nepal. But concept of “Kaushi Tosh
Khana” brought by King Prithvi Narayan Shah was also step towards modern Banking in
Nepal.
Tejarath Adda was only subjected to provide loans to general public. It did not accept deposits.
At one point of time it faces financial crisis and failed to meet demand of general public. Prior
to the establishment of Nepal Bank Ltd; borrowers totally relied upon crooked lenders, who
charged very high interest rates and other charges. Beside this, these money lenders also
undertake valuable collateral in form of land, building, and precious metal. Nepal Bank Ltd
came into existence under the Nepal Bank Act 1937.The prelude of the Nepal Bank Act 1937
states the objectives of setting up the Nepal Bank Ltd as follows:
“In the absence of any Bank in Nepal, the economic progress of the country was being
hampered and causing inconvenience to the people, and therefore, with the objective of
fulfilling that need by providing services for the people and for the betterment of the country,
this law is hereby promulgated for the establishment of the Bank and its operation”.
Nepal Bank was the first Bank to play dual role as commercial Bank and central Bank. Till the
establishment of Nepal Rastra Bank, Nepal Bank Ltd carried out all the functions of central
Bank. Nepal Bank Ltd was semi government Bank so it unwilling went to many sectors in spite
of Banking service needs. Because of this purpose, Rastriya Banijya Bank a fully government
owned Bank was established on 23rd January 1966.
Till 1984, Nepalese financial sector was dominated by two commercial Banks i.e. Rastriya
Banijiya Bank and Nepal Bank Ltd. The commercial Bank act was amended in 1984 to increase
growth of commercial Banks in order to provide Banking services to the needed sector. There

17
was also provision for foreign investors to open commercial Banks in Nepal. In consequence,
Nepal Arab Bank Ltd. (Nabil Bank) was established on July 12, 1984, with the partnership of
Dubai Bank Ltd., Dubai.
Before 1985 two Development Banks i.e., NIDC and ADB were the non-Banking financial
institutions. Employees Provident Fund and National Insurance Corporation were established to
increase the financial activities of the country. Finance Company Act 1985 was introduced
which brought some 79 Financial Institutions in this country.
1.1.3 Brief Introduction of Commercial Bank
Commercial Bank Act 1974 defines, “A commercial Bank means Bank which deals in
exchanging currency, accepting deposits, extending loans and doing commercial transactions”.
Commercial Banks pool scattered fund and channels it to productive use. Banks undertaking
business with the objective of earning profits are commercial Banks. Commercial Banks can be
of various forms such as Deposit Banks, Savings Banks, Industrials Banks, mixed Banks, Exim
Banks etc. Commercial Banks render a variety of services. In absence of commercial Banks, it
would have been impossible to meet the financial needs of the country.
A commercial Bank is a type of financial intermediary and a type of Bank. After the Great
Depression, the U.S. Congress required that Banks only engage in Banking activities., whereas
investment Banks were limited to capital market activities. Since the two no longer have to be
under separate ownership, some use the term "commercial Bank" to refer to a Bank or a
division of a Bank that mostly deals with deposits and loans from corporations or large
businesses.
18
Though the commercial Banks were established with the concept of supplying short term credit
and working capital need of industries, they have been providing long-term loans for up to 15
years. After the enforcement to lend in priority and deprived sector, these Banks initiated to
provide credit to Small and cottage Industries, Agriculture and Services. NRB has a provision
of refinance facility also for such loan provided to priority and deprived sector including export
credit. Having observed the success on NABIL Bank Ltd; due to liberal economic policy in
1990s, many commercial Banks were established. The Table No. 1 shows the list of licensed
commercial Banks as of Mid April 2008.
REFEREE TO TABLE NO.1 APPENDIX 5
1.1.4 Brief Profile of the Selected Banks
Nabil Bank Limited (NABIL)
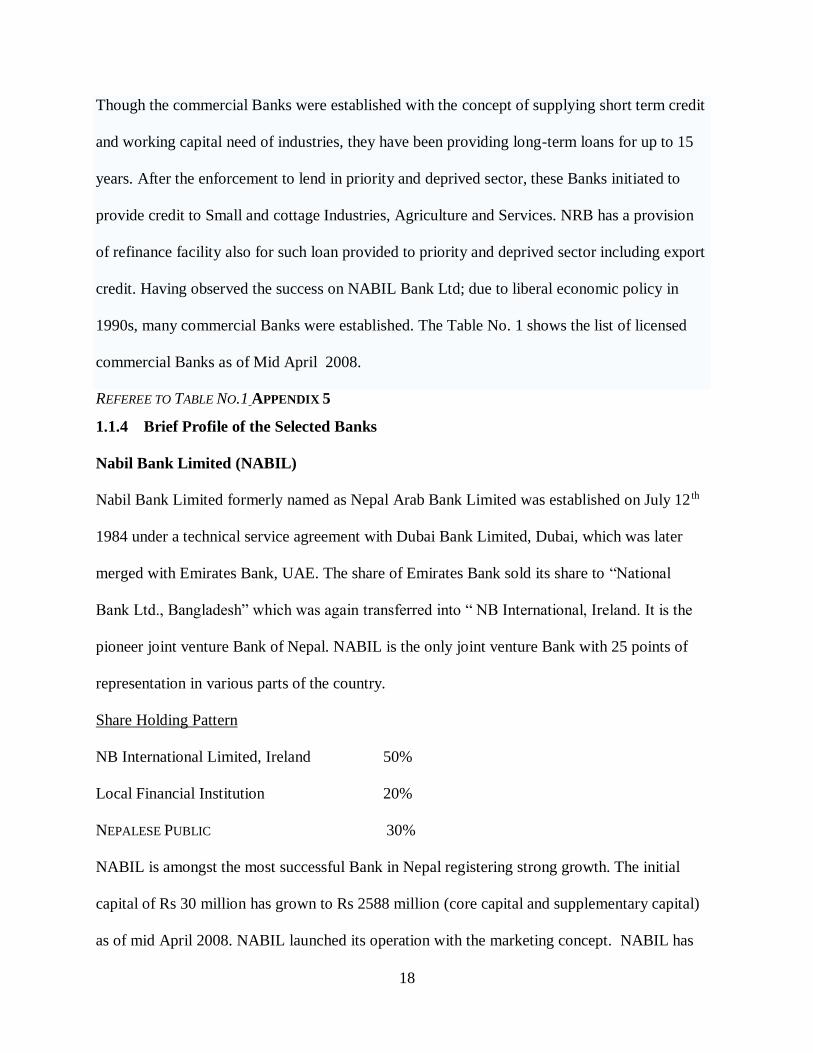
Nabil Bank Limited formerly named as Nepal Arab Bank Limited was established on July 12 th
1984 under a technical service agreement with Dubai Bank Limited, Dubai, which was later
merged with Emirates Bank, UAE. The share of Emirates Bank sold its share to “National
Bank Ltd., Bangladesh” which was again transferred into “ NB International, Ireland. It is the
pioneer joint venture Bank of Nepal. NABIL is the only joint venture Bank with 25 points of
representation in various parts of the country.
Share Holding Pattern
NB International Limited, Ireland 50%
Local Financial Institution 20%
NEPALESE PUBLIC 30%
NABIL is amongst the most successful Bank in Nepal registering strong growth. The initial
capital of Rs 30 million has grown to Rs 2588 million (core capital and supplementary capital)
as of mid April 2008. NABIL launched its operation with the marketing concept. NABIL has

19
also been a pioneer in introducing modern Banking and innovative products in Nepal like
working capital & Project financing ,trade finance, priority & deprived sector (financing or
refinancing), mortgage loan, personal lending, remittance products & card products (Credit and
debit card) etc. NABIL is the Banker to a multitude of International Aid Agencies, Non-
Government Organization, Embassies and Consultants in the country. NABIL has been
providing wide range of Banking services to various parts of the society. NABIL Bank ranks
among the top three financial institution in Nepal in terms of market share of handling Nepal’s
trade. NABIL Bank is being managed by a team of qualified and highly experienced
professionals. There are altogether 427 permanent employees working in the Bank. (Annual
Report 2007/08).1
The Bank has total accumulated deposit of Rs.23,342 million and the investment of the Bank
in form of loan and advances were Rs.15,903 million in the fiscal year 2007/08. Similarly, the
total profit of the Bank in the same period was Rs.674 million. The NPL of the Bank in the
year 2006/07 was recorded at 1.12% against loan and advances.
Key financial of the Bank as of third quarter of F/Y 2007/08 (12/04/2008)
Deposit 22,527 million
Loan and advances 20,817 million
Profit 531 million
NPA against total loan 1.30%
Nepal Investment Bank Ltd., (NIBL)

20
Nepal Investment Bank Ltd.(NIBL), previously Nepal Indosuez Bank Limited, was established
on 21 January 1986 as third joint venture Bank between Nepalese and French Partners under
the Company act,1964.
The French partner holding (holding 50% of the capital) was Credit Agricole Indosuez, a
subsidiary of one the largest Banking groups in the world. With the decision of Credit
Agricole Indosuez to divest , a group of companies comprising of Bankers, professionals,
industrialists and businessmen, in April 2002, acquired 50% of the holding of Credit Agricole
Indosuez in Nepal Indosuez Bank. The name of the Bank was changed to Nepal Investment
Bank Ltd., upon approval of Bank’s annual general meeting, Nepal Rastra Bank and company’s
registar office.
NIBL is headquartered in Kathmandu and has altogether 18 branches in different urban and
semi urban parts of the country. The capital ( core & supplementary capital) of the Bank is
noted Rs.2,550 million as of mid-April,2008.
The main objectives of the Bank is to provide loans and advances to the agriculture, industries
and commerce and to provide modern Banking services to the people.
The shareholding stucuture of the Bank comprises of :
- A group of companies holding 50% of the capital
- Rastriya Banijay Bank holding 15% of the capital
- Rastriya Beema Sanshthan holding 15% of the capital
- The general public holding 20% of the capital.
Performance review
Total accumulated deposit in the Bank was Rs.17, 769 million and the investment of the Bank
in form of loan and advances were Rs.24,488 million in the fiscal year 2007/08. Similarly, the

21
total profit of the Bank in the same period was Rs.501 million. The NPL of the Bank in the year
2007/08 was recorded at 2.37% against loan and advances. The brought level from 2.37% to
1.36% in the first 3rd quarter of fiscal year 2007/08.
Key financial of NIB as of third quarter of F/Y 2007/08 (12/04/2008)
Deposit 30468 million
Loan and advances 26437 million
Profit 475.55 million
NPA 1.36%
Nepal Bangladesh Bank Ltd. (NBBL)
Nepal Bangladesh Bank Ltd., was established in June 1994 under the Company Act, 1964, with
an authorized capital of Rs.240 million and paid up capital of Rs.60 million as a joint venture
Bank with IFIC Bank Limited of Bangladesh. Its Head Office is situated in Kathmandu.
The prime objective of this Bank is to render Banking services to the different sectors like
industries, traders, businessmen, priority sector, small entrepreneurs and weaker section of the
society and every other people who need Banking Services. During the period of 10 years of its
operation, it has accommodated a large number of clients and has been able to provide
excellent services to its clients. With a network of 17 branches and a corporate office, the Bank
commands the largest network amongst the joint venture commercial Banks in Nepal.The Bank
has introduced its first ATM facility at Katmandu Plaza, Putali Sadak Branch to give 24 hours
and 365 days Banking services to their valued customers.

22
Even being one of the joint venture Banks of the country, the financial health of the Bank was
found ill. Due to its ill health, NRB, central Bank of the country, had taken over its
management under their custody & control and has been appointed a management team to
restructure the Bank’s performance for one year contract.
Two month after the takeover of the management of financially-troubled NBBL by Nepal
Rastra Bank, had successful results. According to NRB, “The interim management had able to
recover Rs 700.3 million during these last two months. The non-performing asset level has
been reduced to 34 per cent from an earlier 41 per cent,” said the coordinator of the
management team. The central Bank intervened in the NB Bank mid-November, 2007 and took
over the management to avoid a possible financial catastrophe, and deputed a four-member
management team to run the Bank. Following, exposure of the Bank’s difficult financial
position, NB Bank saw a run on Bank resulting massive withdrawal. In the last two months,
Rs.463.30 million was recovered from loan investment and Rs237 million from NB Group.
Later, NRB handed over its management to a separate professional bankers’ management team
to minimize the previous back log. The contract is being matured on June 2008 and renewal of
the contract for further one year is expected.
Share Holding Pattern
NB International Limited, Ireland 50%
Local Financial Institution 20%
NEPALESE PUBLIC 30%
Performance review:
Total accumulated deposit in the Bank was Rs. 9464 million and the investment of the Bank in
the form of loan and advances were Rs.5855 million in the fiscal year 2007/08.Similarly, the

23
total profit of the Bank in the same period was Rs.393 million. The NPL of the Bank in the year
2007/08 was recorded at 38.19% against loan and advances.
The Bank has lowered its NPL level from 38.19% to 37.60% in the 3rd quarter of this current
fiscal year (2007/08).
Key financial of NIB as of third quarter of F/Y 2007/08 (12/04/2008)
Deposit 9656 million
Loan and advances 6379 million
Profit 542 million
NPA 37.60%
1.2 Focus of the study
A sound financial system plays a important role in economic development and reduction of
poverty in a developing country like ours by creating a pool of resources, reducing costs of
capital, minimizing risks, expanding and diversifying opportunities and increasing the
efficiency of resources used. It not only reduces the transaction cost but also interfaces with
sound corporate governance. A healthy financial sector is crucial for attracting foreign capital
as it creates confidence among the investors.
Financial institution is subjected to provide following activities like deposits, loans and
advances, securities, insurance policies, corporate bonds and shares etc. The main earning of
financial institutions is from loans and advances but all these loans are not paid in time and
those uncovered loans are termed as non- performing Assets (NPA). A high level of NPA is a
serious burden to the financial system and to the economy as well. So, high level of NPA leads

24
the bank to the high bank risk. There are probably many reasons behind high level of NPAs.
Sometimes it arises due to the external factors such as decrease in the market value of the
collaterals, deterioration in the borrower’s repayment capacity and economic slowdown.
Sometimes, it is caused by the borrower’s misconduct and sometimes by the weakness in
internal management practices of the Bank, credit extended to non-viable projects and
ineffective credit monitoring and supervision system.
NRB plays major role for protecting financial institutions from financial distress that
automatically safeguard depositors’ interest and ensure stability in the economy. NRB issues
directives from time to time for overall controlling of financial institutions. As per the
directives, commercial Banks are supposed to categorize disbursed loans into four different
categories on the basis of ageing of its past dues. Each category passes certain percentage of its
loan to provisioned amount for probable loss. So, the level of this provisioned amount has
direct impact upon profitability and performance of commercial Banks. The higher this amount,
the lower is expectation of net profit to the Bank.
NPA and loan loss provision is one of the major concern to solve this on timely basis,
otherwise indirectly or directly it will certainly cost to Banks and even to economy. The
financial institutions may become distracted with additional efforts required to manage these
problem loans.
In this situation, financial institutions may lose sight of their core activities. In light of the
possibility of huge write offs on loan a loss, credit risk is calculated at the higher side. This
phenomenon will certainly affect activities of financial intermediaries. These will definitely
obstacle growth of financial institutions and economy as well. The economy will be affected
because productive units will not get credit access that will hamper development process.

25
Therefore, the level of NPA should be kept at the minimum level and the Banks should manage
to even minimize and make the target to make it zero.
1.2.1 NPA (Non Performing assets) in Present Context
In our context, credits need to be classified in to four categories, namely pass, substandard,
doubtful & loss. Out of these classifications, the loan of the last three categories is called non-
performing assets. In other words all loans classifies as substandard, doubtful & loss categories
are called NPA (Non performing assets/loan). Based on this, when the loan is classified as sub-
standard due to non-payment of interest or installments for 3 months, it is converted into NPA.
In banking business, all are normally exposed to credit risk. NPA is not fully avoidable in the
Banking industry. However, it must be kept at a minimum level as far as possible. At the same
time the possible loss must be provided immediately.
In spite of the internal conflict in the country, Nepal experienced substantial growth in credits
during past five years. Table No.2 (Appendix 6) shows that the growth on credit substantially
reduced the average level of NPA percentage, while total volume of NPA remains almost the
same where it was five years back.

26
Table No: 4
Total NPA level of the commercial Banks Figure in billion
Year Total Loan NPA amount NPA%
2001 100.19 29.35 29.29
2001/02 103.13 31.36 30.41
2002/03 111.90 32.09 28.68
2003/04 127.06 28.93 22.77
2004/05 148.37 27.88 18.79
2005/06 188.31 26.77 14.22
2006/07 221.31 20.69 9.35
Mid April 08 271.19 20.37 7.52
The internationally acceptable level of NPA is said to be less than 5% on total loan and
advances. Table No.3 (Appendix 7) reveals that out of 18 commercial Banks, 12 Banks have
less than ' have around 4-5%. NPA level of other six Banks are quite high and above the
standard as well as industry average. The private sectors Bank have grown up with the
improved/modern banking practice and it has enhanced Banking culture. The same culture
applied in the credit operation and it enables to manage their credit with possible stringent
manner in most of the private sector Banks. However, all private sector Banks are not at par

27
which have been seen from the above table. Even private sector Banks are also carrying their
NPA up to almost 38.19% of their credit portfolio.
1.3 STATEMENT OF THE PROBLEM
Although financial institution is the backbone or engine of the growth of economy of Nepal, it
has several problems like lack of smooth functioning of economy, different policies and
guidelines of Nepal Rastra Bank, political instability, security problem, poor information
system, over liquidity caused by lack of good lending opportunities, increasing non- performing
assets etc. out of these problems, NPA is one of the serious problem faced by the commercial
Banks. So every Bank has now put the NPA management under top priority. It is because; the
NPA in the Banking system does not generate adequate revenue for the Bank, reduces the
profitability and ultimately may lead to the failure of the Bank. So, in the recent days, not only
government owned Banks but some of the Banks under private ownership are also suffering
from NPA burden. This question regarding to NPA with special reference to Nabil Bank Ltd.,
Nepal Investment Bank Ltd. and Nepal Bangladesh Bank Ltd; is stated below:
What is the impact of NPA on the profitability in the selected commercial Banks?
What is the proportion of NPA in selected commercial Banks?
What is the level of NPA in total assets, total deposits and loans and advance in selected
commercial Banks?
What are the trend line of the non-performing assets, loan and advance, loan loss of
selected commercial Banks?
1.4 Importance of the Study

28
The study has its own significances in various perspectives .These perspectives are as follows:
This study will be helpful in providing some of the present issues, latest information
and data regarding the NPA of the selected commercial Banks.
This study also gives the real picture of the current nonperforming assets to its
stakeholders.
The study will be helpful for the Banking industry to identify and to trace the
contributing factors causing NPA and to reduce its level.
This report will be helpful for regulating authority to know existing recovery problem
so as to have some modification of directives, laws and other proceeding.
This report may also be helpful in providing information to future researchers in
overcoming the problems that they may face while doing research in the similar type of the
research work.
1.5 Objective of the study
General objectives of this study are to analyze and identify the impact, cause and consequences
of non- performing loan. Besides this, there are some specific objectives that are listed below:
To find out the impact of NPA on the profitability in the selected commercial Banks.
To know the proportion of NPL in the selected commercial Banks.
To examine the level of NPL in total assets, total deposit and loans and advances.
To present the trend line of the non-performing assets, loan and advance, loan loss of
selected commercial Banks.
1.6 Limitation of the study
This research is subject to certain limitations as stated below:
29
The research focuses only on the non-performing assets of Nepalese Commercial
Banks. So various other aspects of the Banks remain unexplored.
The period of the study is limited from fiscal year 2004/2005 to 2007/2008.
Due to time, resources and financial constraints, some of the issues are ignored.
The another limitation of this study is that, this study is mainly based on secondary
data, interviews, published books, unpublished reports, public documents, annual reports of the
selected Banks, articles of different writers and so on.
1.7 Organization of the study
The entire report has been divided into five different chapters, each chapter dealing with
different aspects of the entire report. The chapter so divided is as follows:
Introduction: This is the first chapter, which includes background of the study, focus
of the study, statement of the problems, objectives of the study, importance of the study,
limitation of the study and organization of the study.
Review of literature: This is the second chapter and this includes review of books,
journals and other relevant materials such as origin and concept of Bank, concept of
commercial Bank. This chapter also covers the review of the theoretical background being
implemented as for the management of NPL. Present regulatory provisions and their
assessment are also reviewed in this chapter.
Research Methodology: - This chapter deals with the research methodology, which
consists of research design, sample size of sample and population, sources of data, data
collection procedure and method of data analysis along with different statistical and financial
tools used in the study.

30
Presentation and analysis of data: This chapter includes the presentation of data so
collected from secondary sources. For the data presentation different table and diagrams are
used. After the presentation of data the presentation is analyzed using various statistical tools
and techniques. Similarly it includes the analysis, interpretation of the primary data and
information collected through survey.
Summary, conclusions and recommendations: This is the last chapter, which
includes summary of the study. It also includes the conclusions and recommendations that may
be valuable to banking industry.

31
CHAPTER-TWO
REVIEW OF LITERATURE
In this chapter effort has been made to examine and review some of the related books, articles
published in different economic journals, bulletins, dissertation papers, magazines, newspapers,
and websites. The literature review shares the reader the results of other studies that are closely
related to the study being reported and to the larger, outgoing dialogue in the literature about a
topic, filling in gaps and extending prior studies. It also provides a framework for establishing
the importance of the study, as well as a benchmark for comparing the results of a study with
other findings. In brief, this chapter includes review of following:
2.1 Conceptual/Theoretical Review
2.1 Review of Books
2.2 Review of Relevant NRB Directives
2.3 Review of Relevant Articles/Journals
2.4 Review of Previous Relevant Thesis
2.5 Research Gap
2.1 Conceptual /Theoretical Review
Under this heading the concept and meaning of some of the terms used in the study has been
discussed.

32
2.1.1 Loans, Discounts and Overdrafts (LDO)
Commercial Bank’s main function is to create credit from its borrowed fund. The Bank doing
so converts its liability into active asset. Loans and advances are the assets coming from such
activities. Loans and advances dominate the asset side of the balance sheet of any Bank and
also constitute the primary sources of income to the Banks. They are also the least liquid of the
Bank’s entire asset. Loans and advances may take different forms and are allowed against
various types of securities. Loans, overdrafts, discounting of bills of exchange etc are some of
the forms of Bank lending. Granting loans and advances always carries a certain degree of risk.
This loans and advances are also regarded as risky assets of Banks.
2.1.2 Loan Classification
Loan classification refers to the process Banks use to review their loan portfolio and assign
loans to categories or grades based on the perceived risk and other relevant characteristics of
loans and as per guidelines of central Banks. The process of continual review and classification
of loans enables Banks to monitor the quality of their loan portfolios and when necessary to
take remedial action to counter deterioration in the credit quality of their portfolios. In most of
the countries, a number of days a past due payments represents a minimum condition for loan
classification purposes. However some criteria which exhibit forward looking features are also

33
considered. In the context of Nepal, as per guidelines of NRB, loans are classified into four
categories namely, Pass, Substandard, Doubtful and Loss.
2.1.3 Past Due/Overdue
An amount due under any credit facility is treated as past due or overdue when it has not been
paid on the due date fixed by the Bank.
2.1.4 Performing Assets (Loans)
Performing Loans are those loans that repay principle and interest timely to the Bank from the
cash flow it generates. In the context of Nepal, the loans classified as ‘Pass’ category is termed
as performing loan.
2.1.5 Non-performing Assets/Loans (NPA / NPL)
These are the loans that do not repay principle and interest timely to the Bank. NPL has many
different meanings, which varies from country to country. In some countries non-performing
loans means, the loan is impaired. In some countries, it means that the payments are past due,
but there are significant differences among countries how many days a payment should be in
arrears before past due status is triggered. Nevertheless, a rather common feature of NPL
appears to be that a payment if ‘more than 90 days past due. In Nepal also, if the loan is past
due for over 3 months, it is non-performing loans. Hence the loans falling under Substandard,
Doubtful and Loss categories are regarded as Non-performing loans.

34
2.1.5. a Reason behind high level of NPL
The following points are the important factors that contributed for creating NPA and retention
of high level of NPA for long period of time.
- Inadequate project appraisal
- Inadequate mitigation of credit risks ( especially for new project)
- Lack of internal control and credit operation
- Lending on unviable project
- Inadequate equity injection
- Poor credit monitoring
- External factors (business failure due to conflict and some other reasons)
- Not limiting concentration risks.
-
2.1.5. b Loan Loss Provision
Loan loss provision is the accumulated fund that is provided as a safeguard to cover possible
losses upon classification of risk inherited by individual loans. There is risk inherent in every
loan. Hence provisioning is made as cushion against possible losses and to reflect the true
picture of the Bank’s asset. Hence there is practice of showing net loan (Total Loans – Loan
Loss Provision) in financial statements. The amount of loan loss provision is directly correlated
to total credit of the Bank. The amount required for provisioning depends upon the level of
NPAs and their quality. High amount of provision is an indication of that Bank’s credit
portfolio needs serious attention. One percent provision of total credit is an ideal position as it

35
is the minimum requirement for all good loans. In Nepal, 1%, 25%, 50% & 100% provisioning
should be made for Pass, Substandard, and Doubtful and Loss loans respectively.
2.1.6 Why Loans go bad?
Below mentioned are the major reasons that gets loan into bad loans.
1. Lack of Credit policy and culture:
While dispensing credit, commercial Banks have to thoroughly examine the inherent risk
elements in a credit proposal in line with their credit policy. This contains the risk to
manageable level and also ensures that the Bank does not fall into an asset liability mismatch
position. In order to safeguard Bank’s assets with respect to market situation a clear cut written
credit policy is must in every financial institution. Policy guides the institution to
diversification on its own priorities and its portfolios with emphasis on highest quality. Credit
culture decides behavior of credit team. If behavior of credit team is not aligned with
institution’s priorities, then the credit culture of the institution is worthless. Credit culture also
reflects institution’s system and procedures. A good credit will definitely help in attainment of
management priorities with minimum errors.
2. Risk Management Strategy:
There are so many risks associated with a lending. An extensive list of risk is given below.
Most of the time and most of the Bankers of our society tend to compromise in analyzing all
the risks properly and then loan turns into bad. Some risks can be measured with the help of
mathematical credit tools; however, some risks like regulatory, defalcation risks are quite
difficult to measure and therefore needs in depth examination before finalizing a loan.
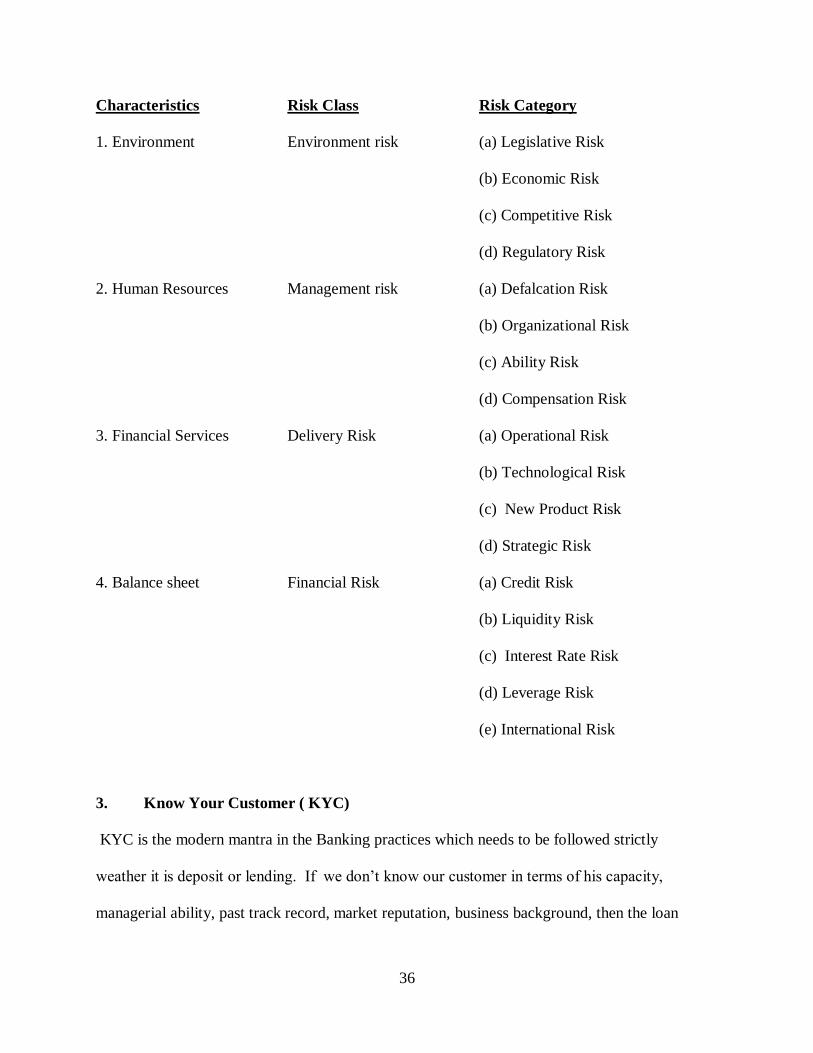
36
Characteristics Risk Class Risk Category
1. Environment Environment risk (a) Legislative Risk
(b) Economic Risk
(c) Competitive Risk
(d) Regulatory Risk
2. Human Resources Management risk (a) Defalcation Risk
(b) Organizational Risk
(c) Ability Risk
(d) Compensation Risk
3. Financial Services Delivery Risk (a) Operational Risk
(b) Technological Risk
(c) New Product Risk
(d) Strategic Risk
4. Balance sheet Financial Risk (a) Credit Risk
(b) Liquidity Risk
(c) Interest Rate Risk
(d) Leverage Risk
(e) International Risk
3. Know Your Customer ( KYC)
KYC is the modern mantra in the Banking practices which needs to be followed strictly
weather it is deposit or lending. If we don’t know our customer in terms of his capacity,
managerial ability, past track record, market reputation, business background, then the loan

37
extended to such customer may get default and attract NPA (Non performing assets) at any
time.
4. Lack of proper Financials
One of the common and serious problem of the market is that most of the borrowers do not
furnish the financials or even if furnish genuine or authenticity of the information is
questionable. This results difficulty in analyzing various risk associated. Due to this Bankers of
our market are forced to make name/security based lending, whereas financial based lending
system is the only tested and proved system of lending.
5. Stiff Competition and size of the market
The mushrooming financial institutions have created stiff unhealthy competition amongst the
institutions on the one hand and other hand the size of the market in proportion to the number
of institution has not increased. Rather, in recent years some international and national events
have shirked the Nepalese market. No sign of improvement is observed, instead problem seems
aggravating. Having this, the customers have been taking advantage of above situation and
taking loan from more than one Banks showing common security. This is called multiple
Banking which is a common problem being faced by commercial Bank. Competition is
indispensable in an open economy and it cannot be avoided. However, atmosphere of healthy
completion can be created by dissemination information amongst the financial instructions.

38
6. Undue influence:
One of the major factors contributing for bad loan is undue influence exerted by politician,
bureaucratic and sometimes even by members of the board and seniors executives of the Bank
itself. The list of the factors contributing bad loans are many more apart from enumerated
above. It is not possible to address all of them in short time.
2.1.7 Challenges
1. Market
As said above market situation of the country is worsening which is likely to increase bad
loans. Recent categorization of some industries as “sick” is likely that performing units will
also turn into NPAs. Further, the present market situation has reduced the realize value of
security. It is high time that financial situation should untidily come forward with innovative
ideas of expansion of the market.
2. Amendment of Relevant law:
Under the present legal system, financial institutions are spending years and years to realize the
values of assets securitized with them by borrowers by way auctions. Whenever, auctions of
securitized assets is initiated, the borrowers are taking undue advantage of buying pretty long
time due to poor legal system, in order to curb this situation, relevant laws need amendments in
such a way that the documents executed by the borrowers in favor of financial institutions
treated as “proven debts” unless the elements of mollified intention on the part of leaders is
apparent.
3. Credit Information Bureau (CIB)

39
Present legal status of CIB needs immediate changed, as in some cases, decision of CIB
blacklisting some defaulting borrowers have been reserved by the court. It has also been
observed time and again that financial institutions themselves tend to ignore the spirit of
disseminating information with CIB. Therefore, CIB should be established under a separate act
as a nonprofit making organization and every financial institution should be its member
compulsory. Any institutions not cooperating with CIB should be penalized. This will help in
disseminating information amongst the financial institutions.
4. Control and monitoring
One of the factors for growing bad loans is week control and monitoring of a borrowing
account institutions. Control and monitoring of borrowing accounts starts right from appraising
the loan request and ends up on settlement of loan in full. Therefore, credit and monitoring job
is a regular process of every financial institution. The loan doses not go bad at ones, initially
some symptom of sound healthiness (warning signs) on loan accounts surface, and if the
situation is not addressed, it is for sure that loan will turn into bad. Some of the system as
follows:
- Excessive use of demand of funds over and above the agreed limits
- Pending settlement of government or preferential creditors and authorities.
- Loss of sales or sales proceeds not coming to financial institutions
- Erosion of the value of stocks or security of dead stocks.
- Several lines of credit from the other lenders which, if fully utilize, could make the level
of funding unacceptable.
- Failure to meet orders

40
- Reliance on one consumer/suppliers
- Unmanageable diversification of business
- Request for release of securities, especial guarantee.
- Delays in coming cash
- Two businesses in one set of premises.
- Management change, etc.
2.2 Review of Books
(Bhuwan Dahal and Sarita Dahal:2000)1 in their book “ A Hand Book to General Banking”
have dealt with different aspects of Banking. As per their view, Banks have gained paramount
trust in the public and they are rendering wide range of services covering different strata of
society.
“A Bank is judged on the basis of Capital, Assets Quality, Management, Earning, Liquidity and
Sensitivity to market risk (CAMELS). Almost all the government Banks are running at loss.
Though almost all the private sector Banks are showing profit, it is very difficult to call them
sound if appraised from CAMELS approach. Some Banks have very low Capital Adequacy
Ratio (CAR) while some Banks have piled up Non Performing Assets (NPAs). Similarly Banks
don’t have proper system in place for management of market risks. The people have been
raising questions over the correctness of credit classification and provisioning of some Banks.
Should the suspicion come true, it will prove very costly to the depositors, creditors and
national economy as a whole. It would be prudent to advise NRB to strictly implement its
recently introduced directive so that other Banks avert the fate of NBL, RBB & NIDC. (Bhuvan
Dahal and Sarita Dahal, 2002:21)1.

41
They stated that loans and advances dominate the asset side of the balance sheet of any Bank
and earnings from such loans and advances occupy a major space in income statement. “Most
of the Banks failures in the world are due to shrinkage in the value of the loan and advances.
Hence loan is known as risky assets. Risk of non-repayment of loan is known as credit or
default risk. Performing loans have multiple benefits to the society while non-performing loan
erodes even existing capital. If loan is given to viable project not only lenders and borrower but
also the whole society gets benefit but society loses its scarce capital if loan is given to project
which is not viable.”
As per their view, there is risk inherent in every loan and efforts should be made to have proper
control in every step of loan management. They further suggested that Bank should not take
risk above certain degree irrespective of returns prospects. “Though all the loans are good at the
time of disbursement, with the passage of time, they show the sign of problem. Based on the
health of his loan, the loan should be classified and provided accordingly. Provisioning is made
as cushion against possible losses and to reflect the true picture of Bank’s assets. Hence there is
practice of showing net loan (Total Loan – Loan Loss Provision) in financial statements. The
Bank should comply with the statutory regulation relating to loan classification and
provisioning.”
( Shakespeare Vaidya) 2 in his book “Project Failures and Sickness in Nepal, Challenges to
Investors for Investment Risk Management” has discussed about the early warning system for
investment risk management. In this book, the author has also envisaged number of examples
about crisis created by the Banks in the world. As per his view, banking sector cannot ignore
any sector of the economy on the basis of its good and bad and there is vital role of financial
institutions in regards to bad accounts.

42
“Nepalese financial institutions have made significant progress especially during this decade,
although they are still far behind the developed markets. In spite of having great risk
management i.e. focused on collateral rather than on project, credit culture is a new aspect both
to the investors and corporate. Unless we have a credit culture, they will end up nowhere. ----
How to identify a good Bank? Huge deposits, high technology, strong marketing, broad
branching network etc? Finally we arrive the point – collection of the loans, on the whole,
private sector Banks have lower non-performing assets (NPAs) than their public sector
counterparts. NPAs are the loans that cannot be or have not been recovered. The government
owned Banks suffer acutely from this, as they have to lend to various priority sectors, at the
whims of their political masters and then forget everything about the money forever.”
With the growing number of financial institutions, market economy, economic liberalization
etc industrial sickness in Nepal has phenomenal proportions in the last few years. Much of the
amounts of almost all leading financial institutions are blocked in sick company, which can be
witnessed from the auction notice published regularly in newspaper. Credit risk is the first risk,
which keeps the Bank moving in the market. The loans provided against the securities are
simply a promise to pay. When borrowing customer fails to make part or all of their promised
interest and principal payments, these defaulted loans and securities result in losses that can
eventually erode Bank’s capital. Because owner’s capital is usually no more than ten percent
of the volume of loans and risky securities, and often much less than that, it cannot absorb too
many defaults on loans and securities before Bank capital simply becomes inadequate to absorb
further losses. At this point, the Bank fails and will close unless the regulatory authorities elect
to keep it afloat with government loans until a buyer can be found or until the Bank becomes
viable by reducing its nonperforming assets.

43
“Banks and financial institution invoke penal measure when an installment of a term loan is
defaulted. This is simply a Banking procedure to offend the borrowers in case of defaults;
however it is not the complete panacea for project failures. The follow up machinery to enquire
into the reasons for the default is generally slow in movement or maximum time would have
already been consumed when Banks normally acknowledge the failure of the projects. The
consequence is that by the time, lending institution is able to ascertain the causes for the first
default, more installments are overdue.
Delays in implementation schedule, cost escalation in mid-stream, inadequate cash generation
or siphoning of fund are few of the factors responsible for default. A lending institution unless
it has an effective monitoring system, may miss these signs of potential sickness. The first
default should be ample evidence that something is out of order and the term lending institution
should take immediate steps to review the position n detail before go out of hand.”
Finally he concludes “In order to safeguard the Banks from the financial crisis likely to be arise
from the project failures and sick units, that is, non performing loans, the government needs to
do a number of things and fast. It must bring broad rules for poor financial institutions,
transferring bad loans to bridge Bank or loan recovery agency, removes many non-performing
loans from even healthier Bank’s balance sheets, beef up regulation, supervision and
disclosure, improve ability to Banks to sell the collateral that backs soured loans, and
recapitalize the Banking system.”
2.3 Review of Relevant NRB Directives
NRB issues various directives relating Banking regulations and prudential norms. Among
various directives issued in 2001 directive No. 2 is relating to loan classification and
provisioning.

44
Directives Relating To Loan Classification and Provisioning (Directive No. 2)3
Effective FY 2058/59 (2001/02), Banks shall classify outstanding loan and advances on the
basis of aging of principal amount into the following 4 categories.
Pass
Loans and advances whose principal amount are not past due and past due for a period up to 3
(Three) months shall be included in this category. These are classified and defined as
Performing Loans.
Substandard
All loans and advances that are past due for a period of 3 months to 6 months shall be included
in this category.
Doubtful
All loans and advances which are past due for a period of 6 months to 1(one) year shall be
included in this category.
Loss
All loans and advances which are past due for a period of more that 1 (one) year as well as
advances which have least possibility of recovery or considered unrecoverable and those
having thin possibility of even partial recovery in future shall be included in this category.
Loans and Advances failing in the category of Sub-standard, Doubtful, and Loss are classified
and defined as Non-Performing Assets (Loan).

45
Table No. 5
Time table of Loan Classification
Classification
Pass Loans not past due and past due up to 3 (three) months.
Sub-Standard Loans and advances past due for a period of over 3 months to 6
months.
Doubtful Loans and advances past due for a period of over 6 months to 1
year.
Loss Loans and advances past due for a period of over 1 year.
The respective overdue periods of Pass, Sub-standard and Doubtful loans shall be considered
for higher classification from the next day of date of expiry of the overdue period provided for
each class.
Additional arrangement in respect of Pass Loan
Loans and advances fully secured by gold, silver, fixed deposit receipts and HMG securities
shall be included under “Pass’ category. However, where collateral of fixed deposit receipt or
HMG securities or NRB Bonds is placed as security against loan for other purposes, such loan
has to be classified on the basis of ageing. Loans against FDRs (fixed deposits receipts) of
other Banks shall also qualify for inclusion under Pass loan.
Additional arrangement in respect of “Loss” Loan

46
Even if the loan is not past due, loans having any or all of the following discrepancies shall be
classified as ‘Loss”
a) No security at all or security that is not in accordance with the borrower’s agreement
with the Bank.
b) The borrower has been declared Bankrupt.
c) The borrower is absconding or cannot be found.
d) Purchased or discounted bills are not realized within 90 days from the due date.
e) The credit has not be used for the purpose originally intended
f) Owing to non-recovery, initiation as to auctioning of the collateral has passed six
months and if the recovery process is under litigation.
g) Loans provided to the borrowers included in the blacklist and where the credit
information Bureau blacklists the borrower.
Note: Bills Purchased/Discounted are to be classified into Loss Loan where they are not
realized within 90 days from due date. This is departure from the normal classification rules
applicable to other loans. Accordingly, it Bills would have only two classification Viz. Pass and
Loss.
Additional arrangement in respect of term loan.
In respect of term loans, the classification shall be made against the entire outstanding loan on
the basis of the past due period of overdue installment.
For Contingent items
In the events of conversion of contingent liabilities of the Bank e.g. LC or immature Guarantee
into the liabilities of the Banks such amount becomes recoverable from the customers and such
47
amounts also has to be classified as per the classification norms applicable to loans and
advances and accordingly be provided with required provisioning.
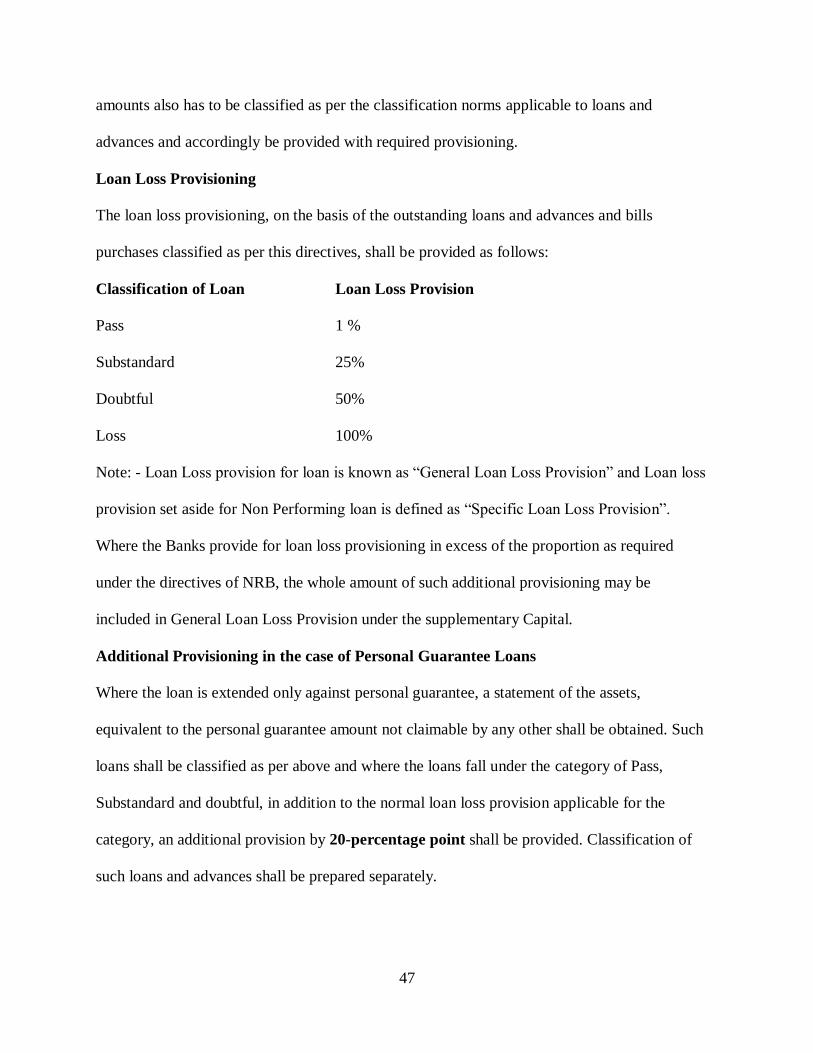
Loan Loss Provisioning
The loan loss provisioning, on the basis of the outstanding loans and advances and bills
purchases classified as per this directives, shall be provided as follows:
Classification of Loan Loan Loss Provision
Pass 1 %
Substandard 25%
Doubtful 50%
Loss 100%
Note: - Loan Loss provision for loan is known as “General Loan Loss Provision” and Loan loss
provision set aside for Non Performing loan is defined as “Specific Loan Loss Provision”.
Where the Banks provide for loan loss provisioning in excess of the proportion as required
under the directives of NRB, the whole amount of such additional provisioning may be
included in General Loan Loss Provision under the supplementary Capital.
Additional Provisioning in the case of Personal Guarantee Loans
Where the loan is extended only against personal guarantee, a statement of the assets,
equivalent to the personal guarantee amount not claimable by any other shall be obtained. Such
loans shall be classified as per above and where the loans fall under the category of Pass,
Substandard and doubtful, in addition to the normal loan loss provision applicable for the
category, an additional provision by 20-percentage point shall be provided. Classification of
such loans and advances shall be prepared separately.

48
Classification of Loan Loan Loss Provision
Pass 21 %
Substandard 45%
Doubtful 70%
Loss 100%
Rescheduling and restructuring of Loan
In respect of loans and advances falling under the category of Substandard, Doubtful or Loss,
Banks may reschedule or restructure such loans only upon receipt of a written plan of action
from the borrower citing the following reason. ;
a) The internal and external causes contributing to deterioration of the quality of loan.
b) The reduced degree of risk inherent to the borrower/enterprise determined by analyzing
its balance sheet and profit and loss account in order to estimate recent cash flows and to
project future ones, in addition to estimate recent cash flows and to project future ones, in
addition to assessing market conditions.
c) Evidence of existing of adequate loan documentation.
d) An evaluation of the borrower/enterprise’s management with particular emphasis on
efficiency, commitment and high standards of business ethics.
Loan Loss Provisioning in respect of rescheduled, restructured or swapped loan
a) Except for priority sector, in respect of all types of rescheduled or restructured or
swapped loan, if such credit falls under Pass category according to NRB directives, loan loss
provisioning shall be provided at minimum 12.5%.

49
b) In case of rescheduling or restructuring or swapping of insured or guaranteed priority
sector credit, the loan loss provisioning shall be provided at one fourth of the percentage
mentioned in clause (a)
c) In respect of swapped loans, the Bank accepting the loans in swapping has to provide
loan loss provision classifying the loan under the same classification as were existing. The
Bank accepting the loan in swapping shall obtain certification from the concerned Bank of
financial institution as to the existing classification.
Provisioning Against Priority Sector Credit
For uninsured priority sector credit full provisioning shall be made but for ensure priority sector
credit provisioning shall be 25% of the percentage of normal calcifications. This is because
DICGC bears 75% of the loan amount in case of defaults.
Classification of Loan Loan Loss Provision
Pass 0.25%
Substandard 6.25%
Doubtful 12.50%
Loss 25.00%
(For Rescheduled/Restructured loan of Priority Sector)
Classification of Loan Loan Loss Provision
Pass 3.125%
Substandard
Doubtful
Loss

50
Note: - In case of rescheduling, restructuring or swapping of insured or guaranteed priority
sector credit, the proportion of loan loss provision would be 3.125% (being 25% of 12.5%).
2.4 Review of Relevant Articles/Journals
“Modus Operandi of Risk Appraisal in Bank Lending”
( Shiba Raj Shrestha) 4 Executive Director NRB in his article titled as above has tried to
highlight different aspects of credit risk management. As per his view, as the effective risk
management is central to good Banking, the tradeoff between risk and return is one of the
prime concerns of any investment decision whether long-term or short-term. He concludes,
“Effective credit risk management allows a Bank to reduce risks and potential NPAs. It also
offers other benefits. Once Banks understand their risks and their costs, they will be able to
determine their most profitable business, thus, price products according the risk. Therefore, the
Banks must have an explicit credit risk strategy and supported by organizational changes, risk
measurement techniques and fresh credit process and systems. There are five crucial areas that
management should focus on;
a. Credit sanctioning and monitoring process
b. Approach to collateral.
c. Credit risk arises from new business opportunities.
d. Credit exposures relative to capital or total advances
e. Concentration on correlated risk factors.
Apart from these; the Bank management should regularly review all asset quality issues
including portfolio composition, big borrower exposures, and development in credit
management policy and process.” He is hopeful that the Banks adopt good risk management
practices and will be able to reap both strategic and operational benefit.

51
Write-Offs behind fall in Banks’ NPL Level”
In the report titled “ Write –Offs behind fall in Banks NPL level” published in the
Himalayan Times, the reporter has attempted the crucial issues of non performing loan
(NPL) ailing the financial sector in Nepal may appear to have been sorted out. The level of
NPL which stood at a whooping 60% prior the financial sector reforms in 2002 and hovered
around 30% in 2004, has come down to 14.22% in 2006. However, thereby hangs a story of
massive write - off loans and interest on loans. Nepal Bank Ltd., written off loan amounting to
almost Rs. 4 billion and an interest of around Rs.8 billion, pointed out Nepal Rastra Bank. And
according to the Bank regulatory, even Rastriya Banijay Bank is planning to write of a total of
Rs.12 billion loans (The Himalayan Times, Dec.20, 2007).
The reporter further states that the big borrowers have been avoiding loan repayment by getting
stay order from courts. While the recently promulgated Bank and financial institutions act 2063
demarcates the role of NRB and in handling the NPL issues of the Banks, the regulator still
clearly lacks the teeth to deal with defaulters with an iron hand. For instead of being authorized
directly initiates action against them, NRB can request the government of Nepal to take
necessary steps against the defaulters when approved by the commercial Banks.
The reporters concludes, the three steps NRB directives to Banks on handling bad loans entails:
follow up, blacklisting borrowers and then request NRB for enforcement action in term of
seizing the passport or attaching of property for auction.
(Maha Pradad Adhikari) 5 in his article titled, non performing loan and its management “has
tried to highlight the NPL refers to those loans and advances which are not able to serve the
interest and the installment within the given period of time. And the internationally acceptable
level of NPA is said to be less than 5% on total loans and advances. But, out of 17 commercials

52
Bank, 11 Banks have less than 5% NPL and one have marginally above 5% NPL. NPL level of
other five Banks is quite high and above the standard as well as industry average. Similar
situation is the agriculture development Bank and some other non Bank financial institution.
He said that the private sectors Banks have grown up with the different and improved Banking
culture. The same culture is applied in the credit operation and it enables to manage their credit
with possible stringent manner in most of the private sectors Bank. However, all private sectors
Bank are not at par. Even private sector Banks are also carrying their NPA up to almost 40% of
their credit portfolio. The average NPA level of the private sector Bank is 6.58%, which is
higher than the standard but far below the industry’s average. Public sector Banks are still
exposed to high risks on credit and holds huge amount of NPA. The recent attempt to write off
of dead account would minimize the level of NPA substantially. However, other risks of one
time writes off is still high to the individually entity.
He concludes, the process of credit risk management starts from the formation of appropriate
credit policy guidelines rules and also comprises of credit appraisal, mitigation of the credit,
credit documentation, processing, credit control, monitoring, follow ups, counseling, board
over sight and timely recovery actions. When any of these steps is compromised, the loan may
convert into the NPL. Once the loan is converted into the NPA, it must be resolved on time
with appropriate NPL management strategy and methodology.
“Non-Performing Assets: A need for rationalization”

53
(Deependra B Chhetri) 6 in the article titled “Non Performing Assets : A need for
Rationalization”, the writer has attempted to provide connation of the term NPA and its
potential sources, implication of NPA in financial sector in the South East Asian Region. He
had also given possible measures to contain NPA. “Loans and advances of financial institutions
are meant to be serviced either part of principal of the interest of the amount borrowed in
stipulated time as agreed by the parties at the time of loan settlement. Since the date becomes
past dues, the loan becomes non-performing asset. The book of the account with lending
institution should be effectively operative by means of real transaction effected on the part of
the debtor in order to remain loan performing.”
As stated by the writer, the definition of NPA differs from country to country. In some of the
developing countries of Asia Pacific Economic Cooperation (APEC) forum, a loan is classified
as non-performing only after it has been arrear for at least 6 months. Similarly, it is after three
months in India. Loans thus defaulted are classified into different categories having their
differing implication on the asset management of financial institution. He also stated that NPAs
are classified according to international practice into 3 categories namely Substandard,
Doubtful and Loss depending upon the temporal position of loan default. “Thus the degree of
NPA assets depends solely on the length of time the asset has been in the form of non-obliged
by the customer (debtors). The more time it has elapsed the worse condition of asset is being
perceived and such assets are treated accordingly.” As per Mr. Chhetri’s view, failure of
business for which loan was used, defective and below standard credit appraisal system, credit
program sponsored by Government, slowdown in economy/recession, diversion of fund are
some of the factors leading to accumulation of NPAs.

54
He said that there is serious implication of NPAs, on financial institution. He further added that
the liability of credit institution does not limit to the amount declared as NPA but extend to
extra amount that requires by regulation of supervisory authority in the form of provisioning as
the amount required for provisioning depends upon the level of NPAs and their quality. As per
his view, rising level of NPAs create a psyche of worse environment especially in the financial
sector. He mentioned that by reviving the activities of the financial institution like waiving
interest, rescheduling the loan, writing off the loan, appointing private recovery agent, taking
help of tribunals and law of land etc NPAs can be reduced.
Finally he concluded that financial institutions are beset with the burden of mounting level of
NPAs in developing countries. “Such assets debar the income flow of the financial institution
while claiming additional resources in the form of provisioning thereby hindering gainful
investment. Rising level of NPAs cannot be taken as stimulus but the vigilance demanded to
solve the problem like this, eventually will generate vigor to gear up the Banking and financial
activities in more active way contributing to energizing growth.”
Why Asset Management Co. is considered the best option to resolve the non performing
loan problem?
(Mr. Bhishma Raj Dhungana) 7 in the article titled has highlighted one of the approach mainly
Asset Management Company (AMC) for resolving the problem of NPL. As per him, AMC is
the specialized financial intermediary to manage the non-performing and distress loans of
Banks and financial institutions who buy the NPL from financial institution and take necessary
steps to recover the maximum value from the acquired assets. As per his view, if NPLs are not
resolved in time there would be inherent direct or indirect costs to the economy. As stated by
him NPL may arise due to the external factors like decrease in market value of collateral,

55
deterioration in borrower’s repayment capacity, economic slowdown, borrower’s misconduct,
improper credit appraisal system, lack of risk management practice, ineffective credit
monitoring and supervision system. Hence he suggested that, NPL should be kept at minimum
level and the specialized institution such as AMCs should manage the distressed loans.
He says that, both traditional approach and AMC are available to deal with NPL problem.
Under traditional approach, Bank handles the NPL’s in its own way especially through
recovery unit who focus on continuing negotiation with the borrower and give top priority to
the loan recovery. As opined by the writer, this approach is useful in dealing with small
business loans where personal touch is adopted but for big loans this approach does not work.
“AMCs seem as the only realistic option when the financial sector recovery is the underlying
objective in financial system where the institution fails to resolve the NPL problem through
their own effort.” He states that the main advantage of establishing AMC is that AMC is able
to move in an expeditious manner removing the distraction of managing NPAs from the
Banking system and frees up resources within the financial institutions allowing them to
concentrate on their core activities.
He concludes, “As in most of the countries, Nepalese Financial system is largely dominated by
the Banking sector. The Banking sector is severely affected by the NPL problem, it is estimated
that the NPL of the Nepalese Banking system is around 16%. Therefore there is no doubt that it
has serious implication on the economic performance of the country. It will be the eclipse in the
development of financial soundness in the economy, if not controlled in time. However,
traditional or AMC root can be practiced to get recovery from this sickness of the financial
system, the AMC root may be more effective approach to be quick recovery as it has been
experienced around the world.”
56
“Asset Management Company: East Asia’s Experience”
The article titled above was published in editorial of Nepal Bank Limited Newsletter of Magh
2060. In this editorial, the writer has expressed some views regarding Asset Management
Company models to resolve NPA problems in the context of East Asian countries. He has
stated that, east Asia’s financial system are burdened with a large volume of non- performing
assets which impede the ability of financial institution to serve the prudent intermediation need
of their communities. “To resolve NPA problems and help restore the health and confidence of
the financial sector, the countries in East Asia have used one or more asset management
company (AMC) models. The most common AMC model used centralizes this activity in a
government agency. However, some countries have opted for a more decentralized approach
involving the creation of several ‘Bank based’ AMCs.” As per his view if the country’s NPA
problems are limited or concentrated and government can afford to take a gradual approach, a
Bank based AMC would be appropriate where as if NPA problem is more pervasive and the
country’s business culture and legal infrastructure are less developed, then centralized
government based strategy would be more appropriate.
“In Thailand, the government dealt promptly and decisively with NPA problems in finance
companies but has not done the same for the Banking sector where NPA problems are still
pervasive. The government policy of encouraging state owned and private Banks to establish
their own AMCs appears overly optimistic and is likely to require substantial government
coordination and financial support. In Indonesia, the NPA problems appear to be the most
severe by far, of all the countries surveyed. In Malaysia, the government promptly reduced
NPA problems by transferring them to a centralized, government-run AMC. While it is too
early to tell, the approach appears well coordinated and comprehensive. The Korean

57
government has achieved major strides in addressing the loan problems in the financial sector.
The government AMC faces an important challenge but is actively working to improve its
management of distressed assets. In Philippines, problem assets are significant in the extent but
substantially less than in other East Asian countries. The experience of the AMC in the
Philippine provides valuable insights into the importance of operational independence.”
2.5 Review of Related Thesis
(Dinesh Kumar Khadka) 8 in his thesis Non Performing Assets of Nepalese Commercial Banks
with an objectives to examine the level of NPAs in total assets, total deposit and total lending
of Nepalese Commercial Banks. He has also showed that the effect of non -performing assets
on return on assets and return on equity of Nepalese commercial Banks.
He said that despite of being loans and advances more profitable then other assets, it creates
risk of non-payment for the Bank. Such risk is known as credit risk or default risks. Therefore,
like other assets the loans and advances are classified into performing and non performing
assets on the basis of overdue schedule. Escalating level of NPAs has been becoming great
problem in banking business in the world. In this context Nepal cannot be run off from such
situation; the level of NPAs is Nepalese Banking business in very alarming. It is well known
fact the problem of swelling nonperforming assets and the issue is becoming more and more
unmanageable day by day. We are well known different financial reports, news paper and news
that the total NPA in Nepalese Banking system is about 35 billion, while it is very worse in
case of two largest commercial Banks RBB and NBL.
Finally he concludes that the level of NPA in sampled Nepalese commercial Banks is not so
alarming. The situation is quite satisfactory. But the increasing trend remain continue in
coming days, the situation will be unmanageable and alarming. The commercial Banks could

58
not give full attention towards supervising their lending and toward recovering their bad loans
perfectly level of NPA has been increasing., The level of NPA of Nepal Bangladesh Bank Ltd.,
Nepal SBI Bank Ltd. and Bank of Kathmandu seems very unsatisfactory., if the situation not
handing right now, it will be unmanageable and difficult to handle.
He recommends that the Banks should have to take enough collateral while lending loan,
appropriate financial analysis, supervision, monitoring and control should be done. Lastly those
Banks having high level of NPA should take immediate action towards recovering their bad
loan as possible as soon. In case of default to repay the loan by borrower, the Banks should
depose off the collateral taken from the borrower and recover principal and interest amount.
( Lila Prasad Ojha) 9 has carried out research on “Lending Practices: A study on Nabil Bank
Limited, Standard Chartered Bank Nepal Limited and Himalayan Bank Limited” His main
objectives of study are to analyze, the various aspects of Bank’s lending in various sector of
economy, the individual Bank’s performance regarding the lending quantity, quality, efficiency
and its contribution in total income. The problems, conclusion and recommendation figured out
by him in this thesis are discussed as below.
He stated that, over liquidity caused due to lack of good lending opportunities, risk arising due
to mismanagement of lending portfolio, increasing non-performing assets etc is some of the
problems that is facing by Nepalese Banking sector. His main objective is to analyze the
various aspects of Bank’s lending in various sector of economy, the individual Bank’s
performance regarding the lending quantity and quality.
He concludes “The highest growth rate, proportionately high volume of loans and advances, the
best contribution in priority and agricultural sector and the high level of deposits mobilization
of HBL has put this Bank in the top position in the lending function. However the better

59
activity ratio of SCBNL has proved this Bank the best in managing the lending portfolio
according to the demand of profit oriented business. The high volume of lending activities and
high volume of productive sector loan of NABIL has put the Bank in the top position in
absolute terms. The increasing provision on loan loss and high volume of non-performing
assets in NABIL & HBL certainly attracts the high attention of any person interested with these
Banks. The high volume of NPA of HBL may have caused due to the failure of industrial and
agricultural sector. NABIL’s increased NPA may have caused due to the accumulated bad
debts that is kept behind the curtain to show the high efficiency of management.”
He suggested that following the normal guidelines of NRB and acting upon this also reduce
many of the credit risk arising from borrowers. He recommended Banks to be more cautious
and realistic while granting loans and advances. As suggested by him, the major solution of
reducing the risk is to avoid lending in more risky area until the Bank does not fully satisfy
itself regarding the future viability of the project. He further suggested that the establishment of
Asset Management Co. (AMC), which helps commercial Banks in collecting their debts and
improving their credit rating efficiency, should be initiated. As per his opinion, lack of proper
credit appraisal, default by blacklisted borrower and professional defaulter, the over confidence
in commercial Banks regarding credit appraisal efficiency and negligence in taking information
from credit information bureau has caused many of the bad debts in these Banks.
( Shama Bhattarai ) 10 in her study “Implementation of Directives Issued by Nepal Rastra
Bank: A Comparative Study of Nepal SBI Bank Limited and Nepal Bangladesh Bank Limited”
has made an attempt to analyze various aspects of NRB Directives with respect to Capital
Adequacy and Loan Classification and Provisioning. As per her view the process of continual
review and classification of loans and advances enables Banks to monitor the quality of their

60
loan portfolios and to take remedial action to counter deterioration in the credit quality of their
portfolios.
She concluded that with the new provisions the Banks will have its provision amount
increasing in coming years and subsequently profitability of the Banks will also come down.
However, the true picture of the quality of the assets will be painted in the coming years to
come. She recommends, “The Banks should be very careful while analyzing the paying
capacity of its credit clients. With longer period of past due, the Bank will end up increasing its
provisions which will keep the bottom line low if the Bank is not careful.”
(Raja Ram Khadka) 11 in his thesis on “A study on the Investment Policy of Nepal Arab Bank
Limited in comparison to other Joint Venture Banks of Nepal” has concluded that NABIL is
comparatively less successful in on balance sheet utilization a well as off balance sheet
operations than that of other JVBs. Mr. Khadka warned that in coming days NABIL may be
behind in the competitive market if it cannot mobilize its resources as efficiently as other JVBs.
He recommended, “The Bank must utilize depositor’s money as Loans and Advances to get
success in competitive Banking environment. The largest item of the Bank in the asset side is
Loans and Advances. Negligence in administrating this asset could be the main cause of a
liquidity crisis in the Bank and one of the main reasons of a Bank failure.”
(Sabitri Shrestha) 12 in her thesis “Impact and Implementation of Nepal Rastra Bank (NRB)’s
Guidelines (Directives) on Commercial Banks: A study of Nabil Bank Limited and Nepal SBI
Bank Limited” has tried to find out the impact of NRB directives on commercial Banks. She
has also made effort to find out whether the directives are actually implemented and are being

61
monitored by NRB or not. She has stated that both NABIL and Nepal SBI are implementing
the NRB directives.
She concludes “All the changes in NRB directives made both positive and negative impacts on
the commercial Banks. Even though this study is limited to only two sample i.e. Nabil Bank
and Nepal SBI Bank, among entire population, it clears the new directives issued by NRB
make good impact more than bad impact on the various aspects of the Banks. It can be seen
that the provision has been changed and the increased provisioning amount has decreased the
profitability of commercial Banks. Apart from, loan exposure has been cut down to customers
due to the borrower limits have been brought down by NRB. Therefore reduction in loan
amount results to decrease the interest income from loans, which will decrease the profits of the
Banks in coming years. Decreasing profitability push towards lesser dividends to shareholders
and lesser bonus to employees. Not only the negative sides but also there are positive sides of
new directives. Recently the problems of Banks are increasing operating cost and decreasing
loan amount resulting decrease in profits of the Banks. But it shows it is only for short term
because the directives are more effective to protect the Banks from bad loans, which protect the
Banks from Bankruptcy as well as protection of deposits of depositors. Increase in capital
adequacy ratio strengthen the Bank’s financial position, loan related provision will made safety
of loans except the risk reducing provisions will protect the Bank from liquidation. Above all, it
can be concluded that newly issued directives are more effective than previous one although it
has brought some problems towards Banks. To decrease the decreasing profits of the Banks,
they should research the alternatives such like more investments in other business; Bank should
adopt new technology according to the demand of time and must not depend on only interest
income for profits.”

62
(Anju Khadka) 13 has carried out research on “A Comparative Study on Investment Policy of
Commercial Banks” with an objective to find out the relationship between deposits, investment,
loans and advances and net profit. She has made the following conclusion while comparing the
performance of NBL with NABIL, SCBNL and NIBL.
She concludes “NBL is comparatively less successful in on balance sheet as well as off-balance
sheet operations than that of other CBs. It predicts that in the coming days if it could not
mobilize and utilize its resources as efficiently as other CBs to maximize the returns, it would
lag behind in the competitive market of Banking. Profitability positions of NBL are
comparatively worse than that of other CBs. It predicts that NBL may not maintain the
confidence of shareholders, depositors and its all customers if it cannot increase its volume
even in future.”
As the Banks experience many difficulties in recovering the loans and advances and their large
amount is being blocked as non performing assets, she suggested that there is an urgent need to
work out a suitable mechanism through which the overdue loan can be realized.
The internationally acceptable level of NPA is said to be less than 5% on total loan and
advances. Based on the table no.2 out of 18 commercial Banks (excluding new 5 Banks), 12
Banks have less than 5% NPA. NPA level of other five Banks is quite high and above the
standard average. Similar situation is the agricultural development Bank and some other non
Bank financial institutions. The private sectors Bank have grown up with the different and
improved Banking culture. The same culture is applied in the credit operation and it enables to
manage their credit with possible stringent manner is most of the private sectors Bank.
However, all private sector Banks are not at per which have been seen from the above table.

63
Even private sector Banks are also carrying their NPA up to almost 40% of their credit
portfolio.
2.6 Research Gap
From the study it has been found that the high level NPAs can be regarded as a serious burden
to the Banks and economy as well. So high level of NPAs is the early symptom of Bank failure
and NPAs are one of the serious problems faced by the commercial Banks. Some researchers
were done in which matters relating to loan loss provisioning has been discussed but no
research was found in detailed analysis of non-performing loan and loan loss provisioning of
commercial Banks. Hence the researcher had attempted to fill this research gap by taking
reference of Nabil Bank Limited, Nepal Investment Bank Ltd. and Nepal Bangladesh Bank Ltd.
This research will be able to deliver some of the present issues, latest information and data
regarding loan classification and loan loss provisioning. After reviewing the relevant
literatures, the next chapter concentrates in the research methodology applied in the study.
End Notes:
1. Bhuvan Dahal and Sarita Dahal, A hand Book to Banking , (Kathmandu:Asmita Books &
Stationery,2002)p.21
2. Shakespeare Vaidya, Project Failures and Sickness in Nepal, Challenges to Investors for
Investment Risk Management , (Kathmandu : Monitor Nepal, 1998), p. 20-21
3. Directives No. 2 of Circular No. 71/058, September 14, 2001
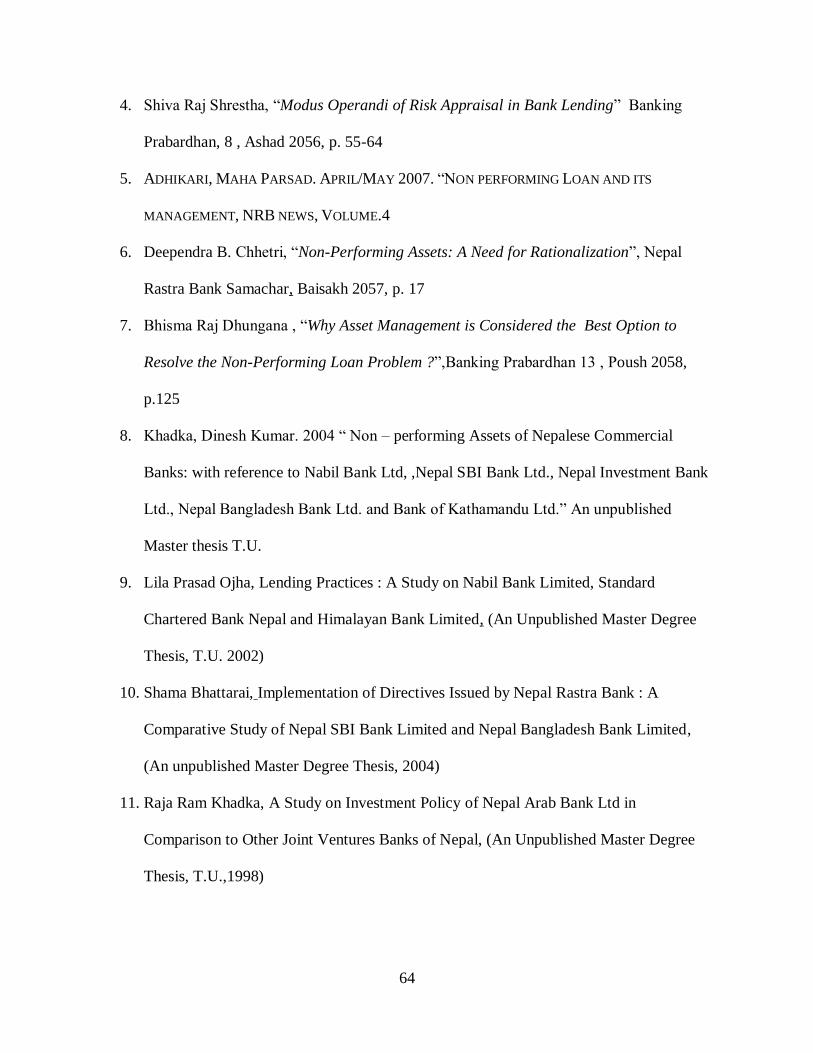
64
4. Shiva Raj Shrestha, “Modus Operandi of Risk Appraisal in Bank Lending” Banking
Prabardhan, 8 , Ashad 2056, p. 55-64
5. ADHIKARI, MAHA PARSAD. APRIL/MAY 2007. “NON PERFORMING LOAN AND ITS
MANAGEMENT, NRB NEWS, VOLUME.4
6. Deependra B. Chhetri, “Non-Performing Assets: A Need for Rationalization”, Nepal
Rastra Bank Samachar, Baisakh 2057, p. 17
7. Bhisma Raj Dhungana , “Why Asset Management is Considered the Best Option to
Resolve the Non-Performing Loan Problem ?”,Banking Prabardhan 13 , Poush 2058,
p.125
8. Khadka, Dinesh Kumar. 2004 “ Non – performing Assets of Nepalese Commercial
Banks: with reference to Nabil Bank Ltd, ,Nepal SBI Bank Ltd., Nepal Investment Bank
Ltd., Nepal Bangladesh Bank Ltd. and Bank of Kathamandu Ltd.” An unpublished
Master thesis T.U.
9. Lila Prasad Ojha, Lending Practices : A Study on Nabil Bank Limited, Standard
Chartered Bank Nepal and Himalayan Bank Limited, (An Unpublished Master Degree
Thesis, T.U. 2002)
10. Shama Bhattarai, Implementation of Directives Issued by Nepal Rastra Bank : A
Comparative Study of Nepal SBI Bank Limited and Nepal Bangladesh Bank Limited,
(An unpublished Master Degree Thesis, 2004)
11. Raja Ram Khadka, A Study on Investment Policy of Nepal Arab Bank Ltd in
Comparison to Other Joint Ventures Banks of Nepal, (An Unpublished Master Degree
Thesis, T.U.,1998)

65
12. Sabitri Shrestha, Impact and Implementation of Nepal Rastra Bank (NRB)’s Guidelines (
Directives) on Commercial Banks : A study of Nabil Bank Limited and Nepal SBI Bank
Limited, (An Unpublished Master Thesis , T.U. 2003)
13. Anju Khadka, A comparative study on Investment Policy of Commercial Banks, (An
Unpublished Master Degree Thesis, T.U. 2002.)
CHAPTER-III
RESEARCH METHODOLOGY
Research Methodology is a diagnostic approach of research and is a way to systematically
solve the research problem. It may be understood as a science of studying how research is done
scientifically. It helps in studying the entire research work in easy manner and also in

66
presenting report in an understandable way. It includes wide range of methods, including a
quantitative technique for analysis of data and information collected. Therefore, research
methodology refers to the methods and techniques used in collection, tabulation and analysis of
data and information collected to achieve the objective of the study. The main objective of this
research is to analyze, examine and interpret the data and information to come at appropriate
decision by giving conclusions and suggestions. The major components of research
methodologies followed in the course of this study are
Research design
Size of population and sample
Source of data
Data collection techniques
Data analysis tools.
Research is a systematic inquiry of any particular topic and methodology is the method of
doing research in a well manner. Hence research methodology is the systematic study of
research problem that solves them with some logical evidence. The research methodology
adopted in the present study as discussed as below:
3.1 Research Design
Research design is the specification of methods and procedures for acquiring the information
needed. It is the plan, structure and strategy of investigation conceived so as to obtain answers
to research questions and to control variance. This research will follow analytical and
descriptive research design.
3.2 Size of Populations and Sampling

67
Population refers to the entire group people, events or things of interest that a researcher wishes
to investigate. A sample represents only a part of a universe (quantity). In sampling method
only tiny part of the whole aspect of matter is considered and conclusion about the entire aspect
is done on that basis. Since this study is about loan classification and loan loss provisioning of
commercial Banks, the population for this study comprised all the licensed commercial Banks
of the country. Therefore, all the commercial Banks are the population of the study. The census
of the population is neither feasible nor desirable for the study of this nature that is why a
sample from the population has been selected for the purpose of this study.
A list of licensed commercial Banks was obtained from NRB. There are altogether 23
commercial Banks in Nepal. The commercial Banks of Nepal can be categorized into two types
namely Public Sector and Private Sector. Public sector Banks include two old Banks NBL and
RBB and private sector Banks comprise remaining 21 Banks. Out of the total population
following 3 commercial Banks were selected as samples for this study by using judgmental
sampling method.
Nabil Bank Limited ( NABIL)
Nepal Investment Bank Limited ( NIBL)
Nepal Bangladesh Bank Limited ( NBBL)
3.3 Sources of Data
Both primary and secondary data has been used in this study. Bank employees are the primary
sources of data and following are the secondary sources of data used in the study.
Annual reports, newsletter of the subjected Banks
Laws, guidelines and directives regarding the subject matter.

68
Text books
Articles published in newspapers, Journals, Magazines, and other publications
Unpublished thesis and dissertation
Various reports published by NRB, CIB etc
Various related websites
3.4 Data Collection Techniques
Primary data has been obtained through questionnaire, direct interviews, field visit and
telephonic inquires. The annual reports of NABIL, NIBL & LBL were collected from
concerned Banks. Various publications of NRB were collected from branch office of NRB
Birgunj. The reference of NRB directives and guidelines has been executed from Nabil Bank
Limited and website of NRB. Various reports, textbooks, journals, and unpublished dissertation
have been obtained by visiting TRM College, Birgunj and TU Central Library.
3.5 Data Analysis Tool
The available information is grouped as per the need of the research work in order to meet
research objectives. The collected data are presented in appropriate forms of table and charts.
For analysis purpose different kinds of appropriate mathematical, statistical and financial tools
have been applied. Further to represent the data in simple form diagrams and graphs have also
been used. The data collected from different sources are recorded systematically and identified.
3.5.1 Financial Tools
Financial tools are used as a benchmark for evaluating the financial position and performance
of any firm. “Financial analysis is the process of identifying the financial strength and
weakness of the firm by properly establishing relationship between the items of the balance
sheet and profit and loss account.” “Financial analysis is the use of financial statements to

69
analyze a company’s financial position and performance and to assess future financial
performance.”
3.5.1.1 Ratio Analysis
Ratio Analysis is the widely used tool of financial analysis. A ratio is simply one number
expressed in terms of another and as such it expresses the numerical or quantitative relationship
between two variables. Ratio analysis reflects the relative strengths and weakness of any
organization and also indicates the operating and financial growth of the organization. “Ratios
help to summarize large quantities of financial data and to make quantitative judgment about
the firm’s financial performance. The relationship between two accounting figures expressed
mathematically is known as financial ratios” Even though there are many ratios, only those
ratios have been calculated which are related to the subject matter. Following ratios have been
computed and analyzed in this study.
Loans and Advances to Total Assets Ratio
Loans and advances of any commercial Banks represent the major portion in volume of total
assets. The ratio of loans and advances to total assets measures the volume of loans and
advances in the structure of total assets. The high degree of ratio indicates the good
performance of the Banks in mobilizing its fund by way of lending functions. However in its
reverse side, the high degree is representative of low liquidity ratio. Granting loans and
advances always carries a certain degree of risk. Thus this asset of Banking business is
regarded as risky assets. Hence this ratio measures the management attitude towards risky
assets. The low ratio is indicative of low productivity and high degree of safety in liquidity and
vice versa. This ratio is calculated as follows
Loans and advances to total asset ratio =AssetTotal
advancesandLoans

70
Loans and Advances to Total Deposit Ratio (CD Ratio)
The core banking function is to mobilize the funds obtained from the depositors to borrowers
and earn profit and CD ratio is the fundamental parameter to ascertain fund deployment
efficiency of commercial Bank. In other words this ratio is calculated to find out how
successfully the Banks are utilizing their total deposits on credit or loans and advances for
profit generating purpose as loans and advances yield high rate of return. Greater CD ratio
implies the better utilization of total deposits and better earning, however, liquidity
requirements also needs due consideration. Hence 70%-80% CD ratio is considered as
appropriate. This ratio is calculated by dividing total credit by total deposit of the Bank.
Loans & Advances to Total Deposit Ratio =DepositTotal
advancesandLoans
Non-Performing Loans to Total Loans and Advances Ratio
This ratio determines the proportion of non-performing loans in the total loan portfolio. Higher
ratio implies the bad quality of assets of Banks in the form of loans and advances. Hence lower
NPL to total credit ratio is preferred. As per international standard only 5% NPL is allowed but
in the context of Nepal 10% NPL is acceptable. It is calculated as follows:
Non-Performing loans to total loans and advances = AdvancesLoansTotal
LoansgminPerforNon
Loan Loss Provision to Total Loans and Advances Ratio
This ratio describes the quality of assets in the form of loans and advances that a Bank is
holding. Since there is risk inherent in loans and advances, NRB has directed commercial
Banks to classify its loans into different categories and accordingly to make provision for
probable loss. Loan loss provision signifies the cushion against future contingency created by

71
the default of the borrower in payment of loans and ensures the continued solvency of the
Banks. Since high provision has to be made for non-performing loan, higher provision for loan
loss reflects increasing non-performing loan in volume of total loans and advances. The low
ratio signifies the good quality of assets in the volume of loans and advances. It indicates how
efficiently it manages loan and advances and makes efforts to cope with probable loan loss.
Higher ratio implies, higher portion of NPL in the total loan portfolio. This ratio is calculated as
follows:
Loan Loss Provision Ratio = AdvancesLoansTotal
ovisionPrLossLoan
Provision Held to Non-performing loan
This ratio determines the proportion of provision held to non-performing loan of the Bank. This
ratio measures up to what extent of risk inherent in NPL is covered by the total loan loss
provision. Higher ratio signifies that the Banks are safeguarded against future contingencies
that may create due to non-performing loan or in other words Banks have cushion of provision
to cope the problem that may be cause due to NPL. Hence higher the ratio better is the financial
strength of the Bank. This ratio is calculated as follows:
Provision Held to Non performing loan = LoangminperforNon
ovisionPrLossLoanTotal
Return on loans and advances
This ratio indicates how efficiently the Bank has employed its resources in the form of loans
and advances. It is the ratio of net profit and total loans and advances of a Bank. Net profit
refers to that profit which is obtained after all types of deduction like employee bonus, tax,
provision etc. Hence this ratio measures Bank’s profitability with respect to loans and
advances. Higher the ratio better is the performance of the Bank. It is calculated as below:

72
RETURN ON LOANS AND ADVANCES =AdvancesLoansTotal
ofitPrNet
3.5.2 Statistical Tools
Statistical tools are the mathematical techniques used to facilitate the analysis and interpretation
of numerical data. “Statistical Analysis is one particular language, which describes the data and
makes possible to talk about the relations and the difference of the variables.” Following
statistical tools have been used in this study.
3.5.2.1 Percentages
A percent is a number of hundredth parts one number to another. Uses of percentages make the
data much simpler and grasp. It is the simplest statistical device used in interpretation of
phenomenon. It can reduce everything to a common base and thereby helps in meaningful
presentation. Mathematically, let A represent the base used for comparison, B represent the
given data to be compared with the base, then the percentage of given number in the base may
be calculated as
Percentage (P%) = 100A
B
3.5.2.2 Measures of Central Tendency
Measures of central value are simple statistical treatments of distribution that attempts to find
the single figure to describe the entire distribution. It is the best possible value of a group of
variables that singly represents to whole group. In the statistical analysis the central value falls
within the approximately middle value of the whole data. Among the several tools of
measuring central value, the mean has been used in this analysis where and when necessary.
The mean is the arithmetic average of a variable. Arithmetic Mean of a series is given by
Mean ( X ) =N
X
73
3.5.2.3. Measures of Dispersion
Dispersion measures the variation of the data from the central value. The central value alone is
not enough to analyze the quality of data regarding its variability. With the light of dispersion,
an average becomes more powerful and meaningful. Following tools of measuring dispersion
has been used in this study.
3.5.2.4 Standard Deviation
Standard deviation (S.D.) is the most popular and the most useful measure of dispersion. It
indicates the ranges and size of deviance from the middle or mean. It measures the absolute
dispersion. Higher the value of standard deviation higher is the variability and vice versa. It is
the positive square root of average sum of squares of deviations of observations from the
arithmetic mean of the distribution.
It can be calculated as follows
Standard Deviation N
)XX( 2
3.5.2.5 Coefficient of Variation
The percentage measure of coefficient of standard deviation is called coefficient of variation.
The less is the C.V the more is the uniformity and consistency and vice versa. Standard
deviation gives an absolute measure of dispersion. Hence where the mean value of the variable
is not equal it is not appropriate to compare two pairs of variables based in S.D. only. The
coefficient of variation measures the relative measures of dispersion, hence capable to compare
two variables independently in terms of their variability.
Coefficient of variation (C.V) = 100X
3.5.2.6 Correlation Coefficient (r)

74
Correlation refers to the degree of relationship between two variables. Correlation coefficient
determines the association between the dependent variable and independent variable. If
between the variables, increase or decrease in one cause increase or decrease in another, then
such variables are correlated variables. “ Correlation may be defined as the degree of linear
relationship existing between two or more variables. Two variables are said to be correlated
when the change in the value of one is accompanied by the change of another variable.” There
are different techniques of calculating correlation coefficient. Among various techniques we
have used Karl Pearson coefficient of correlation.
It is calculated as follows:
Correlation Coefficient (r) =yxN
xy
Where,
x = XX y = YY
x Standard Deviation of Series X
y Standard Deviation of Series Y
N = No. of pairs of observation
On simplification of the equation of r, we obtain the following formula for computing r.
r =
22 y.x
xy
The Karl Pearson Coefficient of correlation always falls between –1 to +1. The value of
correlation in minus signifies, the negative correlation and in plus signifies the positive
correlation. If,
r = 0, There is no relationship between the variables

75
r < 0, There is negative relationship between the variables
r > 0, There is positive relationship between the variables
r = +1, The relationship is perfectly positive.
r = -1, The relationship is perfectly negative.
The reliability of the correlation coefficient is judged with the help of probable error (P.E). It is
calculated as follows:
Probable Error (P.E.) =N
)r1(6745.0 2
Where, r = correlation coefficient
N= No. of pairs of observation.
If r > 6 P.E, then the correlation coefficient is significant and reliable.
If r < P.E, then the correlation coefficient is insignificant and there is no evidence of
correlation.
3.5.3 Trend Analysis
Trend Analysis is one of the statistical tools which is used to determine the improvement or
deterioration of its financial situation. Trend analysis informs about the expected future values
of various variables. The Least square method has been adopted to measure the trend behaviors
of these selected Banks. This method is widely used in practices. The formula of least square
method for the straight line is represented by the following formula.
Yc = a + bX
Where,
Yc = Trend Values
a = Y intercept or the computed trend figure of the Y variable, when X = 0

76
b = Slope of the trend line of the amount of change in Y variable that is associated with change
in 1 unit in X variable.
X = Variable that represent time i.e. time variable
The value of the constants a and b can be determined by solving the following two normal
equations.
XbNaY ……………...(i)
XbXaXY …………(ii)
Where, N = number of years
But for simplification, if the time variable is measured as a deviation form its mean i.e. mid
point is taken as the origin, the negative value in the first half of the series balance out the
positive values in the second half so that ( X = 0.
The values of constant a and b can easily be determined by using following formula.
a = N
Y
b = 2X
XY
3.5.4 Diagrammatic and Graphical Representation
Diagrams and graphs are visual aids that give a bird eye view of a given set of numerical data.
They represent the data in simple and readily comprehensive form. Hence various bar
diagrams, pie charts and graph have been used for presentation and analysis of data.
After highlighting the research methodology, the next chapter concentrates on presentation and
analysis of the study.

77
End Notes:
1. M. Pandey, Financial Management, Eighth Edition, (New Delhi :Vikas Publishing House
Pvt. Ltd. , 1999), p. 108
2. John Wild, K. R., Subramanyam, Robert Halsey , Financial Statement Analysis, Eight
Edition,( MC Graw Hill.: 2003,) p. 13
3. Pandey, op cit p. 108, The figure of Loans and Advances includes Bill Purchased &
Discounted in its term and this is valid for the entire study.
4. M. Pandey, Financial Management, Eighth Edition, (New Delhi :Vikas Publishing House
Pvt. Ltd. , 1999), p. 108
5. John Wild, K. R., Subramanyam, Robert Halsey , Financial Statement Analysis, Eight
Edition,( MC Graw Hill.: 2003,) p. 13

78
6. A.B. Sthapit, Hiranya Gautam, P.R. Joshi, Prakash Man Dongol, Statistical Methods,
(Kathmandu : Buddha Academic Publishers & Distribution P. Ltd., 2003 )p.362
CHAPTER-IV
PRESENTATION AND ANALYSIS OF DATA
In this section raw form of data collected from various sources are changed into an
understandable presentation using financial as well as statistical tools supported by diagrams
and graphs as mentioned in the previous chapter. This chapter is the heart of the study as all
the findings, conclusions and recommendations are going to be derived from the calculations
and analysis done in this section.
4.1 Ratio Analysis
4.1.1 Loans and Advances to Total Asset Ratio
Loans and advances of any commercial Banks signify the major portion in volume of total
assets. The ratio of loans and advances to total assets measures the volume of loans and
advances in the structure of total assets. The high degree of ratio indicates the good

79
performance of the Banks in mobilizing its fund by way of lending functions. However in its
other side, the high degree is representative of low liquidity ratio. Loans and advances always
carry a certain degree of risk. Thus this asset of banking business is regarded as risky assets.
Hence this ratio measures the management’s attitude towards risky assets. The low ratio is
indicative of low productivity and high degree of safety in liquidity and vice versa.
Reference to Table No.6 (Appendix 8)
The table no.6 exhibits the loans and advances to total assets of three Banks for five
consecutive years. This ratio shows fluctuating trend of all three Banks. The overall ratio of the
three Banks has been ranged from 48.99% of NABIL in 2004 to 64.40% of NIBL in 2007. The
mean ratio of NIBL, NABIL and NBBL stand for 62.46%, 56.40% and 68.08% respectively.
Hence among the three Banks, NBBL has the highest proportion of loans and advances in the
total asset structure followed by NIBL and then NABIL. This infers that NABIL has the lowest
degree of investment in risky assets. The management of NABIL has managed to minimize the
risk assets as they have invested higher proportion of their asset in risk free zone or nominally
risky assets like treasury bills, debentures, National Saving Bonds (NSBs) etc.
The standard deviation of NIB, NABIL and NBBL are 4.24, 6.26 & 6.74 and C.V.s are 6.79%,
11.10% & 9.90% respectively. (Appendix 2) Thus it can be interpreted that NABIL and NBBL
has higher deviation with higher degree of variation in this ratio. Even though this ratio is least
of NIBL; it has the most consistent ratio and the least deviation during the study period.
However, NABIL is considered to be moderate in terms of deviation and variability of ratio
during the study period.
4.1.2 Loans and Advances to Total Deposit Ratio (CD ratio)
80
This ratio is often called CD ratio (Credit Deposit ratio) in Banking terms. The core banking
function is to mobilize the funds obtained from the depositors to borrowers and earn profit,
thus, CD ratio is the fundamental parameter to ascertain fund deployment efficiency of
commercial Bank. In other words this ratio is calculated to find out how successfully the Banks
are utilizing their total deposits on credit or loans and advances for profit generating purpose as
loans and advances yield high rate of return. Greater CD ratio implies the better utilization of
total deposits and better earning. However, liquidity requirements also needs due
consideration. To safe guard the Bank’s image, Banks have to maintain liquidity so as to pay
off depositor’s money on demand, thus, a balance of assets must be stroked to ensure both
profitability and liquidity. As per Banking practice and followed by standard norms, 70%-80%
CD ratio is considered as appropriate. This ratio is calculated by dividing total credit or loans
and advances by total deposit of the Bank.
Referee to Table No. 6 (Appendix 8)
Table no.7 exhibits the loans and advances to total deposit of three Banks for five consecutive
years. This ratio shows increasing trend of two Banks (NIBL & NABIL) and decreasing trend
of NBBL. NBBL has the highest ratio for the whole period except in 2007.The mean ratio of
NIBL, NABIL and NBBL is 70.78%, 66.63% & 73.41% respectively. Hence among the three
Banks, NBBL has the highest proportion of loans and advances in the total deposit followed by
NIBL and NABIL. It signifies that NBBL and NIBL have been ahead in utilizing depositor’s
money on loans and advances with the objective to earn profit. This consists that NABIL has
low investment in the form of loans and advances in comparison to them. The management of
NABIL is highly concerned over risk as they have invested higher proportion of their deposit in

81
risk free or nominally risky assets like treasury bills, debentures, National Saving Bonds
(NSBs) etc.
The standard deviation of NIBL, NABIL and NBBL are 4.39, 6.09 & 6.69 and C.V.s are
6.20%, 9.14% & 9.12% respectively. (Appendix 2) Thus it signifies that NABIL & NBBL have
higher deviation with higher degree of variation in this ratio. Even though this ratio is least of
NIBL; it has the most consistent ratio and the least deviation during the study period.
4.1.3 Non-Performing Assets (Loans) to Total Loans and Advances Ratio
This ratio determines the proportion of non-performing assets in the total loan portfolio. As per
NRB directives the loans falling under category of substandard, doubtful and loss are regarded
as non-performing loan. Higher ratio entails the bad quality of assets of Banks in the form of
loans and advances. Hence lower NPA to total credit ratio is preferred. As per international
standard only 5% NPL allowed but in the context of Nepal maximum 10% NPA is acceptable.
REFEREE TO TABLE NO.8 (APPENDIX 9)
Table no.8 exhibits the ratio of non-performing loans to loans and advances of NIBL, NABIL
and NBL for five consecutive years. The figure represented in the above table no. 5 shows that
NBBL has the highest ratio throughout the study period and also shows increasing trend.
NABIL shows the least ratio during the study period. NIBL is moderate in this ratio and strive
to maintain the NPA ratio below 3%. NABIL’s decreasing trend of NPA is the result of
effective credit management of Bank and its efforts of recovering bad debts through
establishment of Recovery Cell. The mean non-performing loan to total loan ratio of NIBL,
NABIL & NBBL are 2.31%, 2.55%, and 22.12% respectively. This ratio of NBBL is
significantly high in comparison to other two Banks and portrays the critical condition of the
Banks. NPA of NBBL is much higher than the acceptable standard of 10%. NIBL and NABIL

82
have been able to maintain the NPA level below 5% which is within prescribed international
standard.
The standard deviation of NIBL, NABIL and NBBL are 0.29, 1.91 & 11.67 and C.V.s are
12.69%, 74.99% & 52.74% respectively. (Appendix 2). Thus it signifies that NIBL has the least
deviation but highest degree of variation in this ratio. Among the three Banks, NABIL is
moderate in terms of deviation & variability and NBL has the highest deviation but the least
variability of ratio during the study period. Since NPA is one of the causes of banking crisis,
NBBL declared problematic and has been given serious attention to come over from high NPA.
The central Bank (Nepal Rastra Bank) has taken their management from last years.
4.1.4 Loan Loss Provision to Total Loans and Advances Ratio
This ratio describes the quality of assets in the form of loans and advances that a Bank is
holding. Since there is risk inherent in loans and advances, NRB has directed commercial
Banks to classify its loans into different categories and accordingly to make provision for
probable loss. Loan loss provision signifies the cushion against future contingency created by
the default of the borrower in payment of loans and ensures the continued solvency of the
Banks. Since high provision has to be made for non-performing loan, higher provision for loan
loss reflects increasing non-performing loan in volume of total loans and advances. The low
ratio signifies the good quality of assets in the volume of loans and advances. It indicates how
efficiently it manages loan and advances and makes efforts to cope with probable loan loss.
Higher ratio implies, higher portion of NPL in the total loan portfolio.
Table 9
Loan Loss Provision to Loans & Advances (%)
In Million Rs

83
Yea
r (M
id
Ju
ly)
NIBL NABIL NBBL
LLP Loans &
Advances
Ratio
(%)
LLP Loans &
Advances
Ratio
(%)
LLP Loans &
Advances
Ratio
(%)
2004 150 5921 2.53 358 8114 4.41 713 7962 8.96
2005 208 7338 2.83 359 8549 4.20 995 9645 10.32
2006 327 10453 3.13 361 10947 3.30 1839 9627 19.10
2007 402 13178 3.05 356 13279 2.68 2971 9796 30.33
2008 483 17769 2.72 357 15903 2.24 2112 5855 36.07
Mean 2.85 Mean 3.37 Mean 20.96
S.D 0.24 S.D 0.94 S.D 12.01
C.V 8.55 C.V 27.90 C.V 57.30
(Source: Annual Reports & Websites of Concerned Banks)
The above table no. 9 exhibits the ratio of loan loss provision to loans and advances of NIBL,
NABIL and NBBL for five consecutive years. The figure represented in the above table no. 6
shows that NBBL has the highest ratio throughout the study period and also shows increasing
trend. NIBL shows the least ratio during the study period, however, NABIL has been
performing well from last five year as above ratio observed in decreasing trend. The mean loan
loss ratio of NIBL, NABIL & NBBL are 2.85%, 3.37%, and 20.96% respectively. This ratio of
NBL is significantly high in comparison to other two Banks. Higher LLP is indicative of poor
and ineffective credit policy, higher proportion of non-performing asset and poor performance
of the economy. Hence the greater ratio of NBBL suggest that there is high proportion of NPA
in the total loans and advances & decreasing trend of loan loss provision ratio of NABIL
explains that NABIL has been successful to reduce its non performing loan resulting to
decreasing LLP.
The standard deviation of NIBL, NABIL and NBBL are 0.24,0.94 & 12.01 and C.V.s are
8.55%, 27.90% & 57.30% respectively (Appendix 2). Thus it signifies that NBBL has higher

84
deviation with higher degree of variation in this ratio. Among the three Banks, NABIL is
moderate in terms of variability and NIBL has the least variability of ratio during the study
period.
4.1.5 Provision Held to Non-Performing Loan Ratio
This ratio determines the proportion of provision held to non-performing loan of the Bank. This
ratio measures up to what extent of risk inherent in NPL is covered by the total loan loss
provision. Higher ratio signifies that the Banks are safeguarded against future contingencies
that may create due to non-performing loan or in other words Banks have cushion of provision
to cope the problem that may be cause due to NPL. Hence higher the ratio better is the financial
position of the Bank.
Table 10
Provision Held to Non-Performing Loan (%) In Million Rs
Yr
(Mid
July)
NIBL NABIL NBBL
LLP
NPL
Ratio
(%)
LLP
NPL
Ratio
(%)
LLP
NPL
Rati
o
(%)
2004 150 117 128.21 358 450 79.56 713 1013 70.38
2005 208 181 114.92 359 287 125.09 995 1042 95.49
2006 327 281 116.37 361 145 248.97 1839 1832 100.3
8
2007 402 272 147.79 356 183 194.54 2971 2927 101.5
0

85
2008 483 422 114.45 357 178 200.56 2112 2236 94.45
Mean 124.35 Mean 169.74 Mean 92.44
S.D 14.27 S.D 67.02 S.D 12.70
C.V 11.48 C.V 39.48 C.V 13.74
(Source: Annual Reports & Websites of Concerned Banks)
The above table no.10 exhibits the ratio of provision held to non-performing loan of NIBL,
NABIL and NBBL for five consecutive years. The figure represented in the above table no.7
shows that NABIL has the highest ratio throughout the study period except in 2004. NIBL is
moderate in this ratio and shows increasing trend except in the year 2007. NBBL shows least
ratio in compared to other three Banks.
The mean ratio of NIBL, NABIL & NBBL are 124.35%, 169.74%, and 92.44% respectively
This ratio of NABIL is significantly high in comparison to other two Banks and portrays that
the Bank has adequate provision against non-performing loan but this ratio of NABBL is
comparatively lower.
The standard deviation of NIBL, NABIL and NBBL are 14.27,67.02 & 12.70 and C.V.s are
11.48%, 39.48% & 13.74% respectively ((Appendix 2). Thus it signifies that NABIL has the
highest deviation along with the highest degree of variation in this ratio. Among the three
Banks, NIBL is moderate in terms of variability and NBBL has the least variability of ratio
during the study period.
4.1.6 Return on loans and advances
This ratio indicates how efficiently the Bank has employed its resources in the form of loans
and advances. This ratio is calculated by dividing net profit of the Bank by total loans and
advances. Net profit refers to that profit which is obtained after all types of deduction like

86
employee bonus, tax, provision etc. Hence this ratio measures Bank’s profitability with respect
to loans and Advances. Higher the ratio better is the performance of the Bank.
Table No. 11
Return on Loans & Advances (%) In Million Rs
Year
(Mid
July)
NIBL NABIL NBBL
Net
Profit
(Loss)
Loans
&
Adv.
Ratio
(%)
Net
Profit
Loans
&
Adv.
Rati
o
(%)
Net
Profit
Loans
&
Adv.
Ratio
(%)
2004 117 5921 1.98 416 8114 5.13 71 7962 0.89
2005 152 7338 2.07 455 8549 5.32 3 9645 0.03
2006 232 10453 2.22 520 10947 4.75 (650) 9627 (6.75)
2007 351 13178 2.66 635 13279 4.78 (1456) 9796 (14.86)
2008 501 17769 2.82 674 15903 4.24 393 5855 6.71
Mean 2.35 Mean 4.84 Mean -2.80
S.D 0.37 S.D 0.41 S.D 8.26
C.V 15.77 C.V 8.55 C.V -295.53
87
(Source: Annual Reports & Websites of Concerned Banks)
The above table no.11 exhibits the ratio of return on loans and advances of NIBL, NABIL and
NBBL for five consecutive years. The figure represented in the above table no. 11 shows that
NABIL has the highest ratio throughout the study period, however, the said ratio is on
decreasing trend from last five years. NIBL is moderate in this ratio and shows increasing trend
consistently for last five years. Since NBBL is in loss in the year 2005 and 2006, it shows
negative return in these periods. The ratio was not at par in the year 2004 and 2005. However,
after changed management, NBL has shown good return @ 6.71% in the year 2007. In the
changed scenario, NBBL will also provide positive return on loans and advances in the near
future.
The mean ratio of NIBL, NABIL & NBBL is 2.35%, 4.84%, and (2.80%) respectively. Since
NABL’s net profit is the highest among all the three Banks, this ratio is also the highest.
The standard deviation of NIBL, NABIL and NBBL are 0.37, 0.41, & 8.26 and CVs are
15.77%, 8.55% & (295.53%) respectively (Appendix 2). Thus it signifies that along with the
higher return NABIL has the least deviation with the least degree of variation in this ratio.
Among the three Banks, NIBL is moderate in terms of deviation & variability. NBBL has the
highest deviation with the highest variability of ratio during the study period. Thus it can be
concluded that even though NBBL has the highest exposure on loans and advances, the Bank
has failed to earn return on loans and advances.
Following figure no. 1, 2 & 3 represents five years Performing Loans, Non Performing Loans
and Loan Loss Provision of NIBL, NABIL & NBBL.

88
Figure No. 1
Figure No. 2
5804
7157
10172
12906
17347
117 181281
272 422150 208 327 402 483
0
2000
4000
6000
8000
10000
12000
14000
16000
18000
20000
2004 2005 2006 2007 2008
(Rs.
Mill
ion)
Financial Year ending Mid July
Performing, Non Performing Loan and Loan Loss Provisionof NIBL
Performing Loan Non Performing Loan Provision

89
Figure No. 3
4.2 Correlation Analysis
4.2.1 Correlation between Loan Loss Provision and Loans and Advances
358 359 361 356 357
76648262
10802
13096
15725
450 287145 183 178
0
2000
4000
6000
8000
10000
12000
14000
16000
18000
(Rs.
Mill
ion)
Financial Year ending mid-July
Performing, Non Performing Loan and Loan Loss Provisionof NABIL
Performing Loan Non Performing Loan
6949
86037795
6869
3619
1013 10421832
29272236
713995
1839
29712112
0100020003000400050006000700080009000
10000
2004 2005 2006 2007 2008
(Rs M
illio
n)
Financial Year ending Mid July
Performing, Non Performing Loan and Loan Loss Provisionof NBBL
Performing Loan Non Performing Loan Provision

90
The correlation between LLP and loans and advances shows the degree of relationship between
these two items. How a unit increment in loans and advances affect the loan loss provision is
measured by this correlation. Here loans and advances is independent variable and LLP is
dependent variable.
Table No.12
Correlation between LLP and Loans and Advances
Banks Correlation
Coefficient (r)
Probable Error
(P.E.)
6 * P.E
NIBL 0.9836 0.0098 0.05853
NABIL 0.4931 0.2283 1.3698
NBBL -0.0298 0.3014 1.8013
Above table no.12 explains the relationship between loans and advances and LLP. (Appendix
3). Here the correlation coefficient of NBBL is -0.0298 and it is less than 6 times the value of
its P.E. and even lesser than P.E., the correlation coefficient of the Bank seems insignificant. In
other words, the total LLP of the above Bank is not correlated with the loans and advances
during the study period. The correlation coefficient of NIBL is 0.9836 and its P.E. is 0.0098

91
and 6P.E. is 0.05853. Since r is greater than P.E. & 6 P.E, there is positive correlation between
LLP and loans and advances of NIBL Hence there is positive correlation between LLP and
Loans and advances of NIBL and its correlation coefficient is significant and reliable.
4.2.2 Correlation between Loan Loss Provision and Non Performing Loans
The correlation between LLP describes the relationship between LLP and NPL. How a unit
increases in NPA effect the LLP is exhibited by this correlation. Here non-performing loan is
independent variable and LLP is dependent variable. As earlier mentioned NPA are the loan
falling on the category of Substandard, Doubtful and Loss loan and the respective provisioning
requirement is 25%, 50% and 100%. Higher the NPA higher will be the provisioning amount.
Table No. 13
Correlation between Loan Loss Provision and Non Performing Loan
Banks Correlation
Coefficient (r)
Probable Error
(P.E.)
6 * P.E
NIBL 0.9592 0.0241 0.1444
NABIL -0.0736 0.3000 1.8001
NBBL 0.9929 0.0043 0.02558
Above table no. 13 explains the relationship between LLP and NPL. (Appendix 3) Here all the
three Banks except NABIL Bank have positive correlation between LLP and NPL. The positive
correlation between LLP and NPL of two Banks i.e. NIBL & NBBL connote the increment in
NPL leads to increment in LLP. The negative correlation of NABIL clearly indicates that the

92
Bank has low volume of NPA provision. The loan loss provision includes 1% of good (PASS)
categories too.
The correlation coefficient of NIBL is 0.9592 and its P.E and 6P.E are 0.0241 and 0.1444.
Since correlation coefficient (r) is greater than 6 times the value of P.E., the correlation
coefficient is significant and reliable. In other words, the total LLP of NIBL is highly correlated
with the non performing loan during the study period and the increase in LLP of NIBL is due to
increase in NPL for the Bank. The correlation coefficient of NABIL is.-0.0736 and its P.E. is
0.30 and 6P.E. is 1.8001. In case of NABIL, r is lower than 6 times the value of P.E. Hence its
correlation coefficient is said to be insignificant as the provision increment is not due to NPA
as provision increases due to 1% provision under good loan. So it can be interpreted that there
is good sign for the health of NABIL Bank... The correlation coefficient of NBBL is 0.9929. It
is less than six times the value of P.E. and 6 P.E... Hence there is positive correlation between
NPL and LLP of NBBL From this also we can understand that NIBL and NBBL have high
degree of NPL in comparison to NABIL.
4.2.3 Correlation between Loans and advances and Deposit
Deposit is one of the major items of liability side and loans and advances is the major item of
asset side of balance sheet of any commercial Bank. Bank’s disburses loans and advances
through the funds received from the depositors. The correlation coefficient between loans and
advances and deposit describes the degree of relationship between these two variables. Here
deposit is independent variable and loans and advances is dependent variable. Hence how a unit
increase in deposit impact in the volume of loans and advances is exhibited by this correlation
coefficient.
Table No.14

93
Correlation between Deposit & Loans and Advances and Deposit
Banks Correlation Coefficient
(r)
Probable Error (P.E.) 6 * P.E
NIBL 0.9940 0.0036 0.0213
NABIL 0.9170 0.0480 0.2881
NBBL 0.9681 0.0189 0.1134
The above table no. 14 shows the correlation coefficient, probable error and six times the value
of three Banks (Appendix 3). It shows there is high degree of positive correlation between
loans and advances and deposit in all three Banks. The respective values of correlation
coefficient of NIBL, NABIL and NBBL are 0.9940, 0.9170 and 0.9681 which are greater than
6 times the value of their respective probable error. Hence it can be interpreted that the
correlation between these three variables in NIBL, NABIL & NBBL are certain and significant.
That means increase in volume of deposit leads to increment in loans and advances of above
three Banks.
4.3 Trend Analysis
Trend analysis is a statistical tool, which helps to forecast the future values of different
variables on the basis of past tendencies of variable. Trend analysis informs about the expected
future values of various variables. Amongst the various methods to determine trend the least
square method is widely used in practices. Hence in this study also least square method has
been adopted to measure the trend behaviors of these selected Banks. However, trend analysis
is based on the assumption that past tendencies continues in the future. Under this heading the
effort has been made to calculate trend values of following variables from mid July 2004 to mid
July 2008 and forecast is done for next five years from mid July 2008 to mid July 2012.

94
4.3.1 Trend Analysis of Loans and Advances
The values of average loans and advances (a), rate of change of loans and advances (b) and
trend values of loans and advances of three Banks for 10 years from mid July 2004 to mid July
2013 are as follows :( Appendix 4)
Table No. 15
Trend Values of Loans & Advances
Years
(Mid July)
Banks
NIBL
a = 10,931.80
b = 2,953.60
NABIL
a = 11,358.40
b = 2,030.80
NBBL
a = 8,577
b = (406.30)
2004 5,025 7,297 9,390
2005 7,978 9,328 8,983
2006 10,932 11,358 8,577
2007 13,885 13,389 8,171

95
2008 16,839 15,420 7,764
2009 19,793 17,451 7,358
2010 22,746 19,482 6,952
2011 25,700 21,512 6,546
2012 28,653 23,543 6,139
2013 31,607 25,574 5,733
The above table no. 15 shows that NBBL has decreasing trend but NIBL and NABIL have
increasing trend of loans and advances. The average loans and advances of NIBL is Rs
10,931.80, which is increasing at the rate of Rs 2953.60 million every year. Loans and
advances are expected to increase from Rs 19,793 in 2008 to Rs 31,607 million in 2012.
NABIL’s average loans and advances is Rs 11,358.400 and are increasing every year at the rate
of Rs 2,030.80 million Hence the expected loans and advances of NABIL are supposed to
increase from Rs 17,451 in 2008 to Rs 25,574 million in 2012. However, the average loans and
advances of NBBL is Rs 8,577 million, which is decreasing every year at the rate of Rs 406.30
million. Accordingly loans and advances of NBBL is expected to be decrease from Rs 7,358
million in 2008 to Rs 5,733 million in 2012.
As NBBL is suffering from the problems of non-performing loans and single obligor limit
problem due to capital constraints, they are concentrating more on recovering bad debts and
there was no further investment in the form of loans and advances. Hence its loans and
advances show decreasing trend. Even though NIBL & NABIL show increasing trend, rate of
increment of NABIL is lower than that of NIBL. Like the proportion of loan and advances in
total asset structure, its increment rate is also low. From this it can be interpreted that NABIL
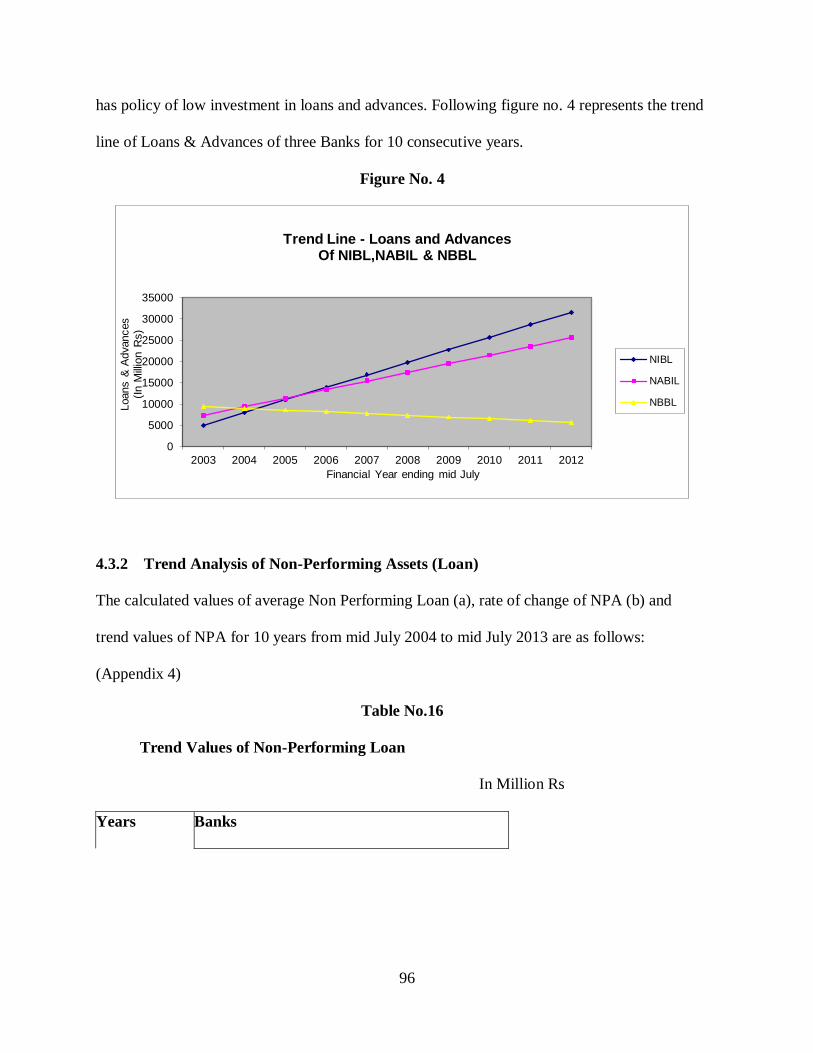
96
has policy of low investment in loans and advances. Following figure no. 4 represents the trend
line of Loans & Advances of three Banks for 10 consecutive years.
Figure No. 4
4.3.2 Trend Analysis of Non-Performing Assets (Loan)
The calculated values of average Non Performing Loan (a), rate of change of NPA (b) and
trend values of NPA for 10 years from mid July 2004 to mid July 2013 are as follows:
(Appendix 4)
Table No.16
Trend Values of Non-Performing Loan
In Million Rs
Years Banks
0
5000
10000
15000
20000
25000
30000
35000
2003 2004 2005 2006 2007 2008 2009 2010 2011 2012
Loans &
Advances
(In M
illio
n R
s)
Financial Year ending mid July
Trend Line - Loans and AdvancesOf NIBL,NABIL & NBBL
NIBL
NABIL
NBBL

97
(Mid July)
NIBL
a = 254.60
b = 70.10
NABIL
a = 248.60
b = (64.80)
NBBL
a = 1810
b =
433.10
2004 114 378 944
2005 185 313 1,377
2006 255 249 1,810
2007 325 184 2,243
2008 395 119 2,676
2009 464.90 54 3,109
2010 535 (11) 3,542
2011 605 (75) 3,976
2012 675 (140) 4,409
2013 745 (205) 4,842
The 16 table shows that NABIL has decreasing trend but NIBL and NBBL have increasing
trend of NPL. The average NPA of NIBL is Rs 254.60, which is increasing at the rate of Rs
70.10 million every year. NPL is expected to increase from Rs 464.90 million in 2008 to Rs
745 million in 2012. NABIL’s average NPA is Rs 248.60, which is decreasing every year at the
rate of Rs 64.80 million. Hence the expected NPA of NABIL is supposed to decrease from Rs
54 million in 2008 to Rs 205 million in 2012. The average NPA of NBBL is Rs 1810 million,
which is increasing every year at the rate of Rs 433.10 million. Accordingly NPA of NBBL is
expected to increase from Rs 3109 million in 2008 to Rs 4842 million in 2012.

98
NBBL has significantly high non-performing loan in the total volume of loans and advances
and its rate of increment is also very high. If this trend continues, it would lead the Bank to the
verge of Bankruptcy affecting several parties of the society. Hence immediate reform should be
initiated. Due to NABIL’s recovery efforts through establishment of Recovery Cell; its NPL
has come down in recent years. Hence NABIL shows decreasing trend of NPA. Even though
NPA of NIBL is relatively lower, it shows increasing trend. If this trend continues, not only
NBBL but also NIBL will also be severely affected by the problem of increasing non-
performing loan. Following figure no. 5 represents the trend line of Non Performing Loan of
three Banks for 10 consecutive years.
Figure No.5
4.3.3 Trend Analysis of Loan Loss Provision
The calculated values of average Loan Loss Provision (a), rate of change of LLP (b) and trend
values of LLP for 10 years from mid July 2004 to mid July 2013 of the three Banks are as
follows (Appendix 4):
(1,000)
-
1,000
2,000
3,000
4,000
5,000
6,000
2003 2004 2005 2006 2007 2008 2009 2010 2011 2012
Non P
erf
orm
ing L
oan
(In M
illio
n R
s)
Financial Year ending mid July
Trend Line - Non Performing Loanof NIBL, NABIL & NBBL
NIBL
NABIL
NBBL

99
Table No. 17
Trend Values of Loan Loss Provision
In Million Rs
Years
(Mid July)
Banks
NIBL
a =314
b =86
NABIL
a = 358.20
b = (0.5)
NBBL
a = 1726.20
b =
477.20
2004 142 359.20 772
2005 228 359 1249
2006 314 358 1726
2007 400 358 2203
2008 486 357 2681
2009 572 357 3158

100
2010 658 356 3635
2011 744 356 4112
2012 830 355 4589
2013 916 355 5067
The above table no. 17 shows that NABIL has decreasing trend but NIBL and NBBL have
increasing trend of LLP. The average LLP of NIBL is Rs 3314, which is increasing at the rate
of Rs 86 million every year. LLP is expected to increase from Rs 572 million in 2008 to Rs 916
million in 2012. The average LLP of Nabil is Rs 358.20.20, which is decreasing every year at
the rate of Rs 0.50 million. Hence the expected LLP of NABIL is supposed to decrease from Rs
357 million in 2008 to Rs 355 million in 2012. Considering above ratio, we can say that
NABIL’s average LLP would be almost constant in the period of five years from 2008 to 2012.
The average LLP of NBBL is Rs 1726.20 million, which is increasing every year at the rate of
Rs 477.20 million. Accordingly LLP of NBBL is expected to increase from Rs 3158 million in
2008 to Rs 5067 million in 2012.As NBBL is suffering from the problems of bad debts, they
have huge amount of Non-performing loan. Higher the non-performing loan higher would be
the LLP. Hence its LLP shows increasing trend. NABIL’s decreasing trend of LLP shows that
it is successful in reducing the non-performing loans of the Bank. Even though LLP of NIBL is
lower than NBBL, it shows increasing trend, which is an indication of increment of NPA in the
total asset quality. Following figure no. 6 represents the trend line of Loan Loss Provision of
three Banks for 10 consecutive years.
Figure No. 6
14,000
16,000
18,000
20,000
Loan L
oss P
rovis
ion
(In M
illio
n R
s)
Trend Line - Loan Loss Provisionof NIBL, NABIL & NBBL NIBL
NABIL
NBBL

101
4.3.4 Trend Analysis of Net Profit
The calculated values of average Net Profit (a), rate of change of Net Profit (b) and trend values
of Net Profit for 10 years from mid July 2004 to mid July 2013 of the three Banks are as
follows (Appendix 4):
Table No. 18
Trend Values of Net Profit In Million Rs
Years
(Mid July)
Banks
NIBL
a = 270.60
b = 96.70
NABIL
a = 540
b = 69.60
NBBL
a = (327.80)
b =
(81.50)
2004 77 401 (165)
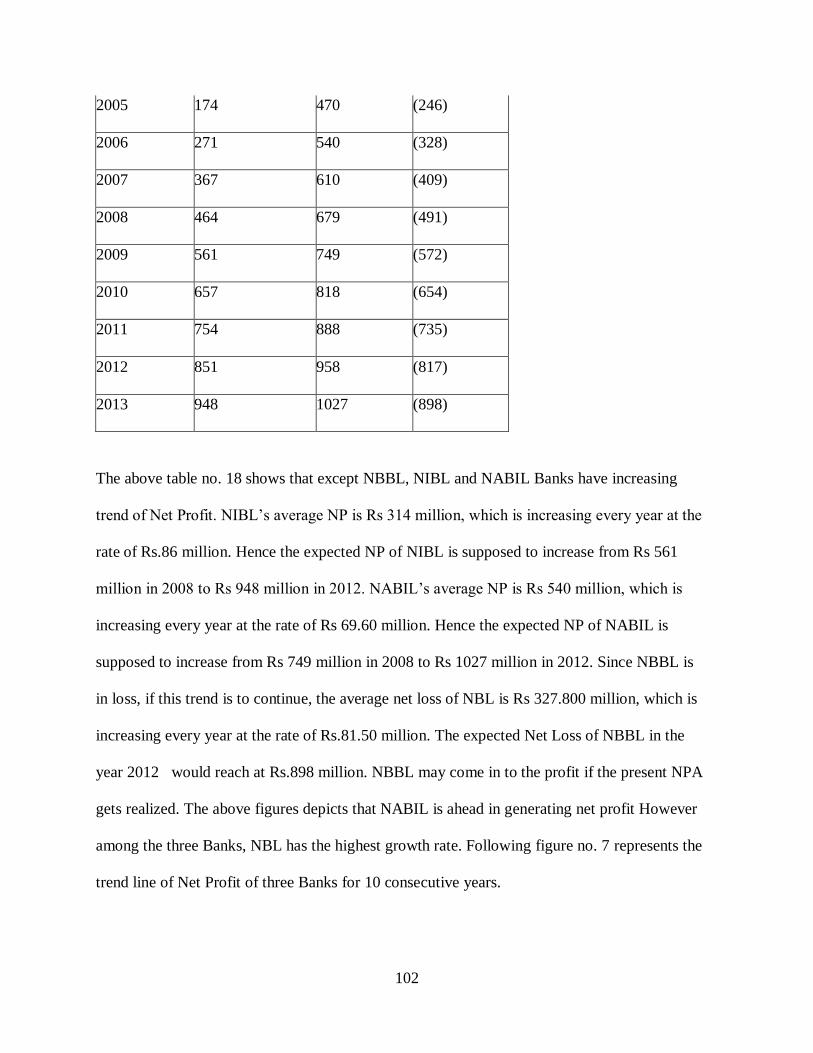
102
2005 174 470 (246)
2006 271 540 (328)
2007 367 610 (409)
2008 464 679 (491)
2009 561 749 (572)
2010 657 818 (654)
2011 754 888 (735)
2012 851 958 (817)
2013 948 1027 (898)
The above table no. 18 shows that except NBBL, NIBL and NABIL Banks have increasing
trend of Net Profit. NIBL’s average NP is Rs 314 million, which is increasing every year at the
rate of Rs.86 million. Hence the expected NP of NIBL is supposed to increase from Rs 561
million in 2008 to Rs 948 million in 2012. NABIL’s average NP is Rs 540 million, which is
increasing every year at the rate of Rs 69.60 million. Hence the expected NP of NABIL is
supposed to increase from Rs 749 million in 2008 to Rs 1027 million in 2012. Since NBBL is
in loss, if this trend is to continue, the average net loss of NBL is Rs 327.800 million, which is
increasing every year at the rate of Rs.81.50 million. The expected Net Loss of NBBL in the
year 2012 would reach at Rs.898 million. NBBL may come in to the profit if the present NPA
gets realized. The above figures depicts that NABIL is ahead in generating net profit However
among the three Banks, NBL has the highest growth rate. Following figure no. 7 represents the
trend line of Net Profit of three Banks for 10 consecutive years.

103
Figure No. 7
4.4 Comparison of Credit Quality of Subjected Banks
In the following figure there is comparison between the year 2004 and 2008 that what had
happened within five years.
Figure No: 8
Comparison of Credit Quality of NIBL July 2004 (Volumes in Millions)
(1,000)
(500)
-
500
1,000
1,500
2003 2004 2005 2006 2007 2008 2009 2010 2011 2012
Net
Pro
fit
(In M
illio
n R
s)
Financial Year ending mid July
Trend Line - Net Profitof NIBL, NABIL & NBBL
NIBL
NABIL
NBBL

104
NPL LOAN
117
5921
NIBL
2004
July 2008 (Volumes in Millions)
Figure No: 9
Comparison of Credit Quality of NABIL
NPL LOAN
422
17769
NIBL
2008

105
July 2004 (Volumes in Millions)
July 2008 (Volumes in Millions)
Figure No: 10
NPL LOAN
450
8114
NABIL
2004
NPL LOAN
178
15903
NABIL
2008

106
Comparison of Credit Quality of NBBL
July 2004 (Volumes in Millions)
Figure No: 11
July 2008 (Volumes in Millions)
4.5 Major Findings of the Study
From the analysis of data, following major findings have been obtained.
NPL LOAN
1013
7962
NBBL
2004
NPL LOAN
2236
5855
NBBL
2008

107
The average loans and advances to total asset ratio of NIBL, NABIL & NBBL during
the study period is found to be 62.46%, 56.40% and 68.07% respectively. The relatively low
ratio of NABIL is the indication of risk averse attitude of the management or they have the
policy of investing low in the risky assets i.e. loans and advances. They have higher proportion
of their investment in risk free or nominally risky asset like treasury bills, National Saving
Bonds etc. Here this ratio is the highest of NBBL but issued loans and advances are not
generating the desired income. NBBL shows the highest degree of deviation and variation
while NIBL and NABIL have the most consistent ratio throughout the study.
The core Banking function is to mobilize the funds obtained from the depositors and
how successfully this function have been discharged by the Banks is measured by the ratio of
loans and advances to total deposit ratio or simply CD ratio. The average CD ratio of NIBL,
NABIL and NBBL during the study period is found to be 70.78%, 66.63% & 73.41%
respectively. The average ratio of NIBL and NABIL is nearly same but that of NBBL is
relatively lower. Even though this ratio is the least of NBBL, it has the most consistent and
least deviated ratio during the study period whereas NIBL has higher deviation and variability
in this ratio. NBL is moderate among the three Banks in terms of deviation and variability of
ratio.
The analysis of non-performing loans to total loans revealed that, average NPA of
NIBL, NABIL & NBBL is 2.31%, 2.55% & 22.12% of total loan respectively. That means
97.69%, 97.45% & 77.88% of total loan of NIBL, NABIL & NBBL is performing loan.
Amongst three Banks, NBBL has significantly higher proportion of the non-performing loan in
the total loans portfolio and this ratio also shows increasing trend, which exhibits the critical
condition of the Bank.

108
NIBL and NABIL have controlled the NPA level and strive to maintain below 5%
which is within prescribed international Banking standard. During the study period this ratio is
found moderate in NIBL but NPA is on increasing trend. However, NABIL has shown
significant decrement and control over NPA which is the result of Banks effective credit
management and its efforts of recovering bad debts through establishment of Recovery Cell.
Due to high level of NPA, NBBL has been declared Bank run and has been given serious
attention to come over from high NPA. The central Bank (Nepal Rastra Bank) has taken their
management from last years.
Loan Loss Provision ratio of NBBL is found to be significantly higher which is around
20.96% in average followed by NIBL of 2.85% and NABIL of 3.37%. Since higher ratio is an
indication of higher non-performing loan in the total loans and advances NBBL’s relatively
higher ratio is the result of higher proportion of NPA in the total loan. Even though NABIL’s
average ratio is higher than that of NIBL. NIBL & NABIL show decreasing trend in this ratio
which means both Bank’s asset quality is improving. NBLB has the highest deviation and
variation of the ratio followed by NABIL and then NIBL.
The average ratio of provision held to non-performing loan of NIBL, NABIL & NBBL
was found to be 124.35%, 169.74% & 92.44% respectively. Hence NABIL has significantly
higher ratio in comparison to other two Banks, which exposes that the Bank has adequate
provision against non-performing loan but this ratio of NBBL is comparatively lower. Even
though NBBL has provided required provision on each category of NPA as per NRB directives,
it has not enough provision against NPA if all the NPA goes in default. Still there is minimal
risk of 7.56%, which is not secured a little bit. However this ratio shows increasing trend. NIBL

109
is moderate in this ratio and has the least variability and NABIL shows the highest variability in
this ratio.
The main objective of commercial Banks is to earn profit through mobilization of fund.
The ratio of returns on loans and advances ratio revealed that NBBL seems to be failure to earn
return on loans and advances. Even though NBBL has higher investment in the most income-
generating asset i.e. loans and advances, it is in loss since last five years. The average return on
loans and advances is –2.80%. NABIL with an average of 4.84% return on loans and advances
has the highest ratio as it is ahead in generating net profit. NIBL is moderate with an average of
2.35% return on loans and advances. NBBL has the highest variability followed by NIBL and
then NABIL.
The correlation coefficient between LLP and loans and advances of NIBL, NABIL &
NBB: is 0.9836, 0.4931 and -0.0298. Here correlation coefficient of NIBL is less than the value
of 6 times P.E and even less than P.E., it is insignificant and there is no evidence of correlation.
Since higher provision has to be provided for non-performing loan, the high negative
correlation of NBBL is the result of high non-performing loans in the total loan portfolio.
Hence the increase in provision of NBBL is not due to increment in loans and advances but due
to increment in its non-performing loans. NABIL has positive correlation between LLP and
loans and advances but it is not significant. This is also due to high proportion of NPL in the
total loan portfolio. However LLP of NIBL is highly correlated with loans and advances and its
correlation coefficient is significant and reliable.
The correlation between LLP and NPL reveals that there is positive correlation between
LLP and NPL in all the three Banks. As earlier mentioned higher provision needs to be
provided for NPL, higher the NPL higher would be the LLP. The correlation coefficient

110
between these two variables in NIBL, NABIL & NBBL is 0.9592, -0.0736 and 0.9929. The
correlation coefficient of NIBL and NBBL is significant but that of NABIL is insignificant.
The reason behind this is relatively lower proportion of NPL in the total loan portfolio of
NABIL.
While analyzing correlation between loans and advances and deposit, it has been found
that NIBL, NABIL & NBBL have high degree of positive correlation between these two
variables. The respective correlation coefficient of NIBL, NABIL & NBBL is 0.9940,0.9170
and 0.9681, which is significant and reliable. That means increase in volume of deposit leads to
increment in loans and advances of above three Banks.
Trend analysis was done based on the data of past five years and forecast was made for
next five years. The trend of loans and advances showed decreasing trend in NBBL and
increasing trend in regards to NIBL & NABIL but rate of increment of NIBL is higher that than
that of NABIL. The loans and advances of NBL is decreasing at the rate of Rs 406.30 million
every year and that of NIBL & NBBL is increasing at the rate of Rs 2953.60 million and
2030.80 million every year respectively.
From the trend analysis of NPL, it is found that NPL is increasing in case of NIBL &
NBBL and in case of NABIL it is decreasing. The NPL of NABIL is decreasing at the rate of
Rs 64.80 million every year and that of NIBL & NBBL is increasing at the rate of Rs 70.10
million and 433.10 million every year respectively. The decreasing trend of NPA in NABIL is
due to its efforts towards good management of existing and new loan and recovering bad debts.
From the trend analysis of LLP, it is found that LLP is expected to increase in coming
years in case of NIBL & NBB L and in case of NABIL it is expected to remain in the same
level in coming years. The LLP of NABIL is decreasing at the rate of Rs 0.50 million every

111
year and that of NIBL & NBBL is increasing at the rate of Rs 86 million and 477.20 million
every year respectively. The decreasing trend of LLP in NABIL is due to its recovery efforts
towards reducing NPL.
From the trend analysis of Net Profit, it is found that NP is expected to increase in
coming years in two Banks i.e. NIBL and NABIL. NBBL shows decrement of net profit at the
rate of Rs 81.50 million each year. Similarly Net Profit of NIBL & NBBL is increasing every
year by Rs 96.70 million and Rs 69.60 million respectively. As NIBL has high rate of
increment, if this trend is to continue, NBL would soon surpass NABIL. NBBL has to give
proper attention in recovery of bad debts (NPA) to recover the profit.
Increasing non-performing loan is one of the burning problems of Nepalese Banking
sector. Improper credit appraisal system, ineffective credit monitoring & supervision system,
economic slowdown, borrower’s misconduct, political pressure to lend to un-credit worthy
parties etc are the major factors leading to non-performing assets. Setting up recovery cell,
hiring Asset Management Company etc are some to the measures to resolve the problem of
NPA. Loan classification and loan loss provision also helps to confront the problems thus
created due to non-performing loans. Since loan loss provision is deducted from the profit of
the Bank, increase in provision decrease the profit of the Bank by the same amount but this
type of negative effect is only for short period. Once the Banks have adequate provision and
sound credit management, the profitability will again gear up.
After the completion of analysis of data, the next chapter or the final chapter incorporates the
summary, conclusions and recommendation regarding the subject matter.

112
CHAPTER - V
SUMMARY, CONCLUSION AND RECOMMENDATIONS
Finally this chapter includes the summary, conclusions and recommendation based on the result
of the analysis of the data.
5.1 Summary
National development of any country depends upon the economic development of the country
and economic development is supported by financial infrastructure of that country. Banks
constitute an important segment of financial infrastructure of any country. Thus, Banks play an

113
important role in the economic development of the country as the issue of development always
rests upon the mobilization of resources.
Banks deals in the process of canalizing the available resources to the needy sector causing
overall economic development. This research is aimed at studying the non-performing loan and
loan loss provisioning of commercial Banks. For this purpose, descriptive cum analytical
research design was adopted. Out of the total population of 23 commercial Banks, three Banks
were taken as sample using Judgmental Sampling Method. Nepal Investment Bank Limited
was selected from private sector Banks and two joint venture Bank, NABIL Bank Limited and
Nepal Bangladesh Bank Ltd. Both primary and secondary data have been used in the study.
Primary data has been collected through questionnaire, direct interviews & telephonic
interviews and annual reports and other publication forms the basis of secondary data. The data
collected from various sources are recorded systematically and presented in appropriate forms
of tables and charts and appropriate mathematical, statistical, financial, graphical tools have
been applied to analyze the data. The data of five consecutive years of the three selected Banks
have been analyzed to meet the objective of the study.
NABBL and NIBL have the highest proportion of the loans and advances in the total asset
structure but NABIL has relatively lower loans and advances in the total asset structure. The
credit deposit ratio also shows increasing trend of two Banks (NIBL & NABIL) and decreasing
trend of NBBL. It indicates the risk diversification and minimization attitude of the
management of NABIL. There is higher proportion of non-performing assets (loan) in the total
loans and advances of NBBL, which comes around 22.12% on average, which is very much
higher than the acceptable standard of minimum 10%. Since higher provision has to be
apportioned for NPA, its loan loss provision is also significantly higher than the other two

114
Banks. Regarding NPA and LLP, NIBL is moderate among the three and NABIL has the least
NPL and accordingly the least LLP than NBBL and nearer to NIBL. The modern credit
analysis approach applied by NABIL towards lending has made this Bank successful to have
low ratio of provisioning and lower ratio of non-performing loans.
Even though, NBBL has the highest proportion of their investment in the most income
generating asset, the Bank is in loss. Most of the loans of NBBL have at risk zone and become
non-performing and hence it is not generating any income instead demanded high provision for
probable loss. There is negative return on loans and advances in NBBL. Even NIBL has higher
proportion of investment in loans and advances in comparison to NABIL, its return on loans
and advances is comparatively lower. However the high return of NABIL is not due to its
proper lending function but due to low deposit cost, high fee based income, high yield on
lending, high foreign currency deposit, foreign exchange earnings and high foreign trade
income (LC) etc.
There is positive correlation between LLP and loans and advances in NIBL & NABIL but these
two variables shows negative correlation in case of NBBL. This is due to increment of non-
performing assets (loan) of NBBL. Amount to be provisioned depends upon the non-
performing assets (loan) and its quality. Higher provision has to be provided for NPA. Hence
even though loans and advances do not increase, if in the same loan portfolio NPA increases,
LLP will increase. This has also been shown by the positive correlation between LLP and NPL
in two Banks, however, NABIL has negative correlation between LLP and NPA. The negative
correlation of NABIL clearly indicates that the Bank has been reducing NPA provision.
Similarly, all three Banks NIBL, NABIL and NBBL have shown positive correlation between
loans and advances and deposit.

115
The trend analysis of loans and advances shows increasing trend in n case of NIBL and NABIL
but decreasing trend in NBBL. This is because, NBBL has no further investment plans in loans
and advances in recent years instead they are concentrating more on recovering bad debts. The
trend analysis of Non-performing loan and Loan Loss Provision shows increasing trend in
NBBL and even in NIBL whereas NABIL shows decreasing trend in coming years. This is due
to NABIL’s recovery efforts towards reducing NPL through establishment of Recovery Cell.
The past trend of net profit of the entire three Banks except NBBL exhibits increasing trend in
coming years. Since NBL is in loss if this trend is to continue, its loss goes drastically.
Today’s Banking industry is severely affected by the problem of NPA. Improper credit
appraisal system, ineffective credit monitoring & supervision system, economic slowdown,
borrower’s misconduct, and overvaluation of collateral, political pressures to lend to un-
creditworthy parties etc are the major factors leading to non-performing assets. Setting up
recovery cell, hiring Asset Management Company etc are some to the measures to resolve the
problem of NPA. Loan classification and loan loss provision also helps to confront the
problems thus created due to non-performing assets (loans). The directive regarding loan
classification and loan loss provisioning is very important for maintaining sound financial
health of the Banks. The provisioning directives leads to increment in provision amount of the
Banks leading to decrement in profitability of the Bank but this is only for a short run.
5.2 Conclusions
Liberalization of financial sector started in 1980s with the aim to streamline it. After that the
financial sector widened with more Banks and financial institutions. Even the financial sector
developed rapidly in quantity, but in terms of quality it is far behind the developed countries.

116
Banks came into existence mainly with the objectives of collecting idle funds, mobilizing them
into productive sector and causing an overall economic development .The Banker’s have the
responsibility of safeguarding the interest of the depositors, the shareholders and the society
they are serving. Lending is the major function of any commercial Bank and it is the most
income-generating asset of any commercial Bank but there is risk inherent in Bank’s lending
portfolio. In order to cover the risk inherent in the lending portfolio, Banks have to make loan
loss provision by categorizing the loans into different category as per the NRB directives.
Increasing non-performing assets (loan) is the serious problem of the Banking sector in Nepal.
Non-performing asset debar the income flow of the Bank while claiming additional resources
in the form of provisioning and hinder further gainful investments.
It has been found that NBBL has very high portion of non-performing loan resulting to higher
provision. Hence even the Bank has the highest investment in the most income generating asset
i.e. loans and advances, it is in loss. The private sector Bank like NIBL and NABIL does not
have higher non-performing loan and accordingly don’t have higher provision. However, in
recent last year NIBL’s non-performing loan has shown significant increment and accordingly
provision has also increased. Among the three Banks NABIL has the least non-performing loan
and thus the least loan loss provision despite NIB has low average of NPA & LLP in
comparison of last five years data. NABIL has been improving on NPA and LLP from last four
years. NABIL is also a head in generating income. From these indicators it can be said that
NABIL is the best among the three Banks. However NABIL seems less oriented towards
lending. Hence the lower percentage of NPA and provisioning of NABIL is not only due to
proper lending management function but also due to relatively lower investment in loans and
advances.
117
In the conclusion it can be said that ineffective credit policy, political & board executive’s
pressure to lend to un-creditworthy borrowers, overvaluation of collateral are the major causes
of mounting non-performing assets in the joint venture Bank like NBBL. Other factors leading
to accumulation of NPAs are weak loan sanctioning process, ineffective credit monitoring &
supervision system, economic slowdown, borrower’s misconduct etc. Continual review and
classification of loans enables Banks to monitor quality of their loan portfolios and to take
remedial action to counter deterioration in credit quality. In addition to this establishing
recovery cell, hiring Asset Management Company are also measures to resolve the problem of
NPL. The present loan classification and provisioning directive seems more stringent than the
previous one. As a result more provision has to be apportioned leading to lesser profitability but
this kind of negative impact is only for short period. Adequate provisioning strengthens the
financial health of the Banks and makes them able to face any kind of future contingencies.
5.3 Recommendations
The high portion of non-performing loan accompanied by higher provision of NBBL
indicates that the Bank’s credit portfolio needs serious attention. Hence NBBL is
recommended to take immediate remedial actions for recovering bad debts. Hiring
Asset Management Company (AMC) is recommended for NBBL to resolve the
problem of mounting non-performing loan.
Though NBBL’s loan portfolio seems low in comparison to other Banks, their loan and
advances are considered here to be lower as NBBL has stopped extending of loan and
advances rather they are involved in recovery of bad debts and mounted NPA. NABIL’s
credit contribution to loans and advances is also relatively low. Entire economy is

118
largely dependent upon the proper execution of lending function by commercial Banks.
Low level of lending means, low level of investment resulting to low level of
productivity, which may ultimately affect negatively on the national economy. Loans
and advances on one hand is the highest income-generating asset and on the other hand
it also helps to upgrade the economic health of the country. Hence NABIL is
recommended to increase its investments in productive sector in the form of loans and
advances.
It has been observed that the loans and advances of NBBL are decreasing and there
were no further investment of deposit in recent years. Hence it is recommended for
NBBL for exploring new areas of investment.
The main factors which leads to Non-Performing assets are improper credit appraisal
system, ineffective credit monitoring and supervision system etc. Besides that
negligence in taking information from Credit Information Bureau may also lead to bad
debts. Hence all the three Banks are recommended to be more cautious and realistic
while granting loans and advances. After advancing loans there should be regular
supervision and follow up for proper utilization of loan.
It is recommended for the Banks to initiate training and development program for the
employees to make them efficient and professional in credit appraisal, monitoring and
proper risk management.
Following the directives of NRB and acting upon it also reduce many of the credit risk.
Besides there are penalty implication on non-compliance of the directives. Hence all the
three Banks are recommended to adhere the directives and they are also suggested to

119
come up with a stronger internal audit department to ensure that the directives are
properly implemented.
The regulation regarding loan classification and provisioning is stringent and tighter
than the previous. Hence NRB should not only impose directives but also create
supportive environment for the commercial Banks. NRB is recommended to strengthen
Credit Information Bureau (CIB) so that Banks can get required credit information
about the borrowers on time. This would help in reducing NPA.
The ratio of provision held to non-performing loan of NABIL is relatively lower in
comparison to other two Banks. Even though NABIL has made provision for each
category of loan as per NRB directives; the total provision amount is not enough in case
all the non-performing goes on default or the loan has to be written off. Hence NABIL
is recommended to increase this ratio by reducing non-performing loan.
It is often said that ‘Prevention is better than cure’. Hence it is recommended for all the
three Banks to take preventive measures before the loan goes to default. All the Banks
are recommended to have an information system to gather all the possible information
and activities about its borrowers so that necessary precautions can be taken in time.

120
BIBLIOGRAPHY
Books
Dahal, Bhuvan & Sarita (2002). A Hand Book to Banking. (2nd Edition). Kathmandu: Asmita
Books & Stationery.
Gupta, S.C. (1992). Fundamental of Statistics. (5th Edition). Bombay: Himalaya Publishing
House.
Gupta, S.P. (1997). Statistical Method. (28th Edition). New Delhi: Sultan Chand & Publishers.
Joshi, P.R. (2001). Research Methodology. (1st Edition). Kathmandu: Buddha Academic
Publishers & Distributors Pvt. Ltd.

121
Kothari, C.R. (1984). Quantitative Techniques. (3rd Revised Edition). New Delhi: Vikas
Publishing House Pvt. Ltd.
Pandey, I.M. (1999). Financial Management . (8th Edition). New Delhi: Vikas Publishing
House.
Pant, Prem R. (1998). Fieldwork Assignment and Report Writing. (1st Edition). Kathmandu:
Veena Academic Enterprises Pvt. Ltd.
Radhaswami, M., & Vasudevan, S.V. (1984). A Text Book of Banking (Law, Practice & Theory
of Banking). (3rd Edition). New Delhi: S. Chand and Co. Pvt. Ltd.
Shrestha, Sunity & Silwal, Dhruba P.(2002). Statistical Methods in Management. (1st Edition).
Kathmandu: Taleju Prakashan.
Sthapit, Dr. A.B., H. Gautam, Joshi, P.R. & Dongol, P.M. (2003). Statistical Methods. (1st
Edition). Kathmandu: Buddha Academic Publishers & Distributors Pvt. Ltd.
Timilsina,Yogendra (1997). Banking Business in Nepal. (3rd Edition). Kathmandu: Ratna
Pustak Bhandar.
Vaidya, Shakespeare (1998). Project Failures and Sickness in Nepal, Challenges to Investors
for Investment Risk Management. (1st Edition). Kathmandu: Monitor Nepal.
Weston, J. Fred & Copeland, Thomas E. (1990). Managerial Finance. (9th Edition). New York:
The Dryden Press.
Wild, John J., Subramanyam, K.R., & Haskey, Robert F. (2003). Financial Statement Analysis.
(8th Edition). USA: McGraw Hill International.
Wolff, H.K., & Pant, P.R. (2002). A Hand Book for Social Science Research and Thesis
Writing. (3rd Edition). Kathmandu: Buddha Academic Publishers & Distributors Pvt.
Ltd.
122
Journals/Articles
Bhattarai, Narendra (March, 2003). I Took up This New Job Because I Eager for Challenges.
Business Age, Vol.5, No. 3 p. 74.
Bhattarai, Narendra (July 14, 2004). Raise NPL Limit. The Himalayan Times, p. 7.
Chhetri, Deependra B. (Baisakh, 2057). Non-Performing Assets: A Need for Rationalization.
Nepal Rastra Bank Samachar. p. 17-21.
Dhungana, Bhisma R. (Poush, 2058). Why Asset Management Company is Considered the Best
Option to Resolve the Non Performing Loan Problem. Banking Prabardhan. 13, p.
125-127.
Editorial, (Magh, 2060). Asset Management Company: East Asia’s Experience. Nepal Bank
Limited Newsletter. No. 10, p. 2.
Ghimire, Binam R. (July, 2003). Credit Sector Reform and NRB. New Business Age. p. 47-49
Khatiwada, Yubaraj. (November, 2002). Liberalization Was Not Done in Proper Sequence.
New Business Age. p. 34.
Neupane, Him P. (Baisakh, 2060). Bad Loans of Banking Sector – Challenges & Efforts to
Resolve It. Nepal Rastra Bank Samachar. p.141-146
Pandit, Gandi (August, 2002). Legal Complication between Deloitte and NRB. Business Age.
Vol. 4, No. 8, p.31
Pant, Shovan D. (September, 2001). Banking Industry is Not Robust. Business Age. Vol. 3, No.
9, p.31.
Rana, Himalaya S.J.B. (December, 2003). Golden Days are Gone. New Business Age, p. 35
123
Sapkota, Narayan. (19 May, 2004). Portion of NPA in Commercial Banks-High in Public, Low
in Private. Rajdhani, p.5.
Sapkota, Suman (Jestha-Magh 2058). Doubtful Debtors and New Changed Provisions. Nepal
Bank Patrika, p.47-50
Sharma, Narayan & Phulara, Bashu D. (February, 2003). Failed State Vis-à-vis Failed Banking
System. Business Age. Vol. 5, No. 2, p.41-43
Shrestha, Shiba R. (Ashad 2056). Modus Operandi of Risk Appraisal & In Bank Lending.
Banking Prabardhan 8, p.55-64.
The Kathmandu Post (June 11, 2003) p. 6
Tiwari, Gopal (July 14, 2004). Financial Sector Hobbled with Chaos, Fragility. The Himalayan
Times. p.7
Himalayan Times (December 20, 2007) p.46.

124
Other Reports
NABIL Bank Limited (2003/04/-2006/07). Annual Report. Kathmandu.
Nepal Bangladesh Bank Limited (2003/04-2006/07). Annual Report. Kathmandu.
Nepal Rastra Bank (July, 2007). Banking and Financial Statistics. Kathmandu. Vol.42, p.35
Nepal Rastra Bank Circulars No. 71/058, September 14, 2001.
NIBL Bank Limited (2003/04-2006/07). Annual Report. Kathmandu.
Unpublished Master Degree Thesis
Bhattarai, Shama (2004). Implementation of Directives Issued by Nepal Rastra Bank, A
Comparative Study of Nepal SBI Bank Limited & Nepal Bangladesh Bank Limited. An
Unpublished Master Degree Thesis, TU.
Khadka, Anju (2002). A Comparative Study on Investment Policy of Commercial Banks. An
Unpublished Master Degree Thesis, TU.
Khadka, Dinesh (2004). Non Performing Assets of Nepalese Commercial Banks with reference
to Nabil Bank Ltd., Nepal SBI Bank Ltd., Nepal Investment Bank Ltd., Nepal Banladesh
Bank Ltd. And Bank of Kathmandu. An Unpublished Master Degree Thesis, TU.
Khadka, Raja Ram (1998). A Study on Investment Policy of Nepal Arab Bank Limited in
Comparision to Other Joint Venture Banks in Nepal. An Unpublished Master Degree
Thesis, TU.
Ojha, Lila Prasad (2002). Lending Practices: A Study on Nabil Bank Limited, Standard
Chartered Bank Nepal Limited and Himalayan Bank Limited. An Unpublished Master
Degree Thesis, TU.

125
Pandey, Santosh (2002). Nepal Rastra Bank Directives, Their Implementation and Impact on
Commercial Banks, A Case Study of Himalayan Bank Limited. An Unpublished Master
Degree Thesis, TU.
Shilpakar, Anjana (2003). A Study on Lending Practices of Finance Companies of Nepal. An
Unpublished Master Degree Thesis, TU.
Shrestha, Sabitri (2003). Impact and Implementation of Nepal Rastra Bank (NRB)’s Guidelines
(Directives) on Commercial Banks: A Study of Nabil Bank Limited and Nepal SBI Bank
Limited. An Unpublished Master Degree Thesis, TU.
Websites
www.nabilbankltd.com
www.nabilbankltd.com
www.nbblbankltd.com
www.nepalnews.com
www.nepalstock.com
www.nrb.org.com
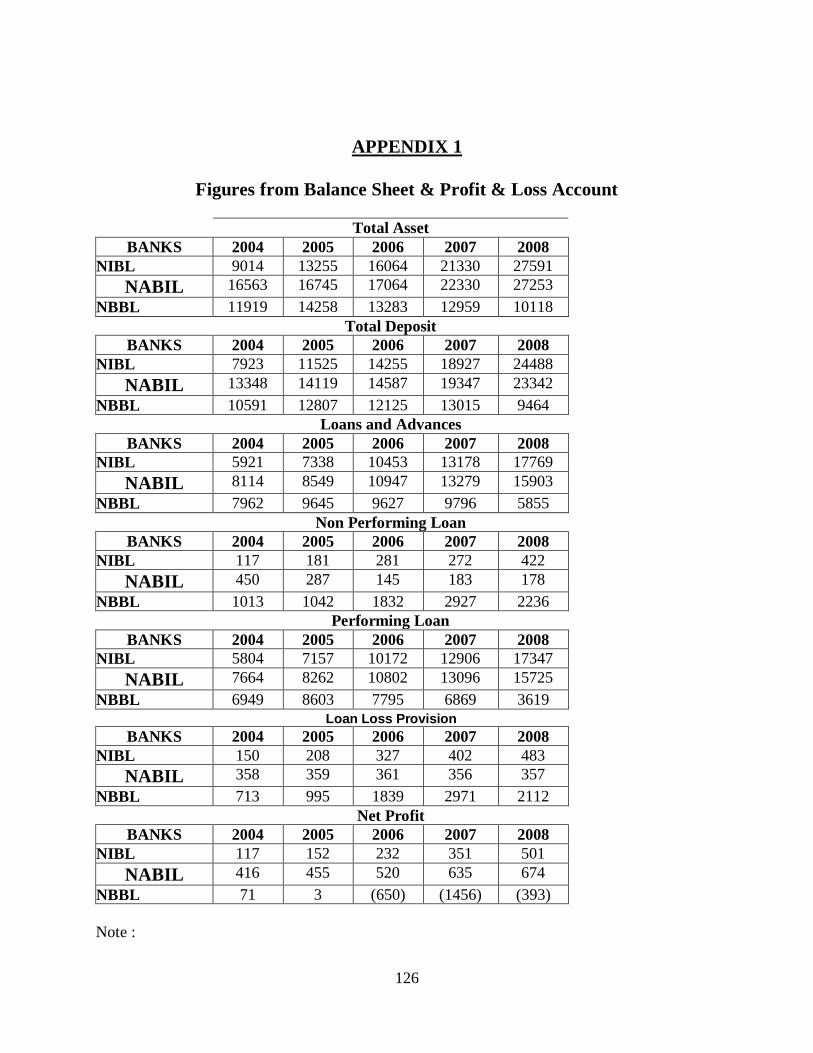
126
APPENDIX 1
Figures from Balance Sheet & Profit & Loss Account
Total Asset
BANKS 2004 2005 2006 2007 2008
NIBL 9014 13255 16064 21330 27591
NABIL 16563 16745 17064 22330 27253
NBBL 11919 14258 13283 12959 10118
Total Deposit
BANKS 2004 2005 2006 2007 2008
NIBL 7923 11525 14255 18927 24488
NABIL 13348 14119 14587 19347 23342
NBBL 10591 12807 12125 13015 9464
Loans and Advances
BANKS 2004 2005 2006 2007 2008
NIBL 5921 7338 10453 13178 17769
NABIL 8114 8549 10947 13279 15903
NBBL 7962 9645 9627 9796 5855
Non Performing Loan
BANKS 2004 2005 2006 2007 2008
NIBL 117 181 281 272 422
NABIL 450 287 145 183 178
NBBL 1013 1042 1832 2927 2236
Performing Loan
BANKS 2004 2005 2006 2007 2008
NIBL 5804 7157 10172 12906 17347
NABIL 7664 8262 10802 13096 15725
NBBL 6949 8603 7795 6869 3619
Loan Loss Provision
BANKS 2004 2005 2006 2007 2008
NIBL 150 208 327 402 483
NABIL 358 359 361 356 357
NBBL 713 995 1839 2971 2112
Net Profit
BANKS 2004 2005 2006 2007 2008
NIBL 117 152 232 351 501
NABIL 416 455 520 635 674
NBBL 71 3 (650) (1456) (393)
Note :

127
The entire figures presented above are rounded off to the nearest million Rs.
The data presented herein are pertained to mid July of each year.
The data presented herein are based on the amount mentioned in the annual reports of
respective years in case of NABIL & SCBNL. The data of NBL is based on data in websites
of www.nepalstock.com and the annual report to shareholders of NBL published in
Gorkhapatra.
Loans and Advances also include Bill Purchased & Discounted.
APPENDIX 2
Calculation of Mean, S.D. & C.V of Loans & Advances to Total Asset Ratio
of Nabil (Sample Calculation)
(Rs. In Million)
Years (Mid July)
Ratio (X) %
(X –X)
(X –X)
2
2004 47.51 0.51 0.26
2005 48.82 1.82 3.30
2006 45.32 -1.68 2.84
2007 44.26 -2.74 7.53
2008 49.11 2.11 4.44
N= 5 X = 235.02 (X-X)2 =18.37
We have,
Mean ( X ) =N
X=
5
02.235= 47%
Standard Deviation N
)XX( 2
5
37.18 = 2.14
Coefficient of variation (C.V) = 100X
= 100
47
14.2 = 4.55 %
Similarly the Mean, S.D. & C.V of other ratios of the three banks have been calculated.

128
APPENDIX 3
Calculation of Correlation Coefficient, P.E. & 6 P.E.
of Nabil (Sample Calculation)
(Rs. In Million)
Years (Mid
July)
Loans &
Advance
s (X)
LLP (Y)
x = (X –X)
y = (Y-Y)
x2 y
2 xy
2004 5,789 360 (1,684) (63) 2,835,182 3,994 106,416 2005 7,335 434 (138) 11 18,989 117 (1488) 2006 8,324 600 851 176 724,541 31,258 150,492 2007 7,802 364 330 (59) 108,373 3,505 (19,489) 2008 8,114 358 641 (65) 411,138 4,251 (41,806) N= 5 X=
37,364 Y
=2116 x
2 =0 y
2 =0 x
2=
4,098,223 y
2=
43,125 xy=
194,125
We have, Karl Pearson Correlation coefficient,
Correlation, ( r) =
22 y.x
xy =
125,43223,098,4
125,194
= 0.4618
Probable Error (P.E.) =N
)r1(6745.0 2=
5
)4618.01(6745.0 2= 0.2373
6 P.E. = 6 0.2373 = 1.4240
Similarly the Correlation coefficients, P.E & 6 P.E between different variables of three banks
have been calculated.
APPENDIX 4
Calculation of Trend Values of Loans & Advances
of NIBL (Sample Calculation)
(Rs. In Million)
Years
(Mid
July)
Loans &
Advances (Y)
Deviation
from Mid
July 2001
(X)
X2 XY Yc = a + bX
Yc = 20021.20 +
(785.90) X
2004 21,074 (2) 4 (42,148) 21,593
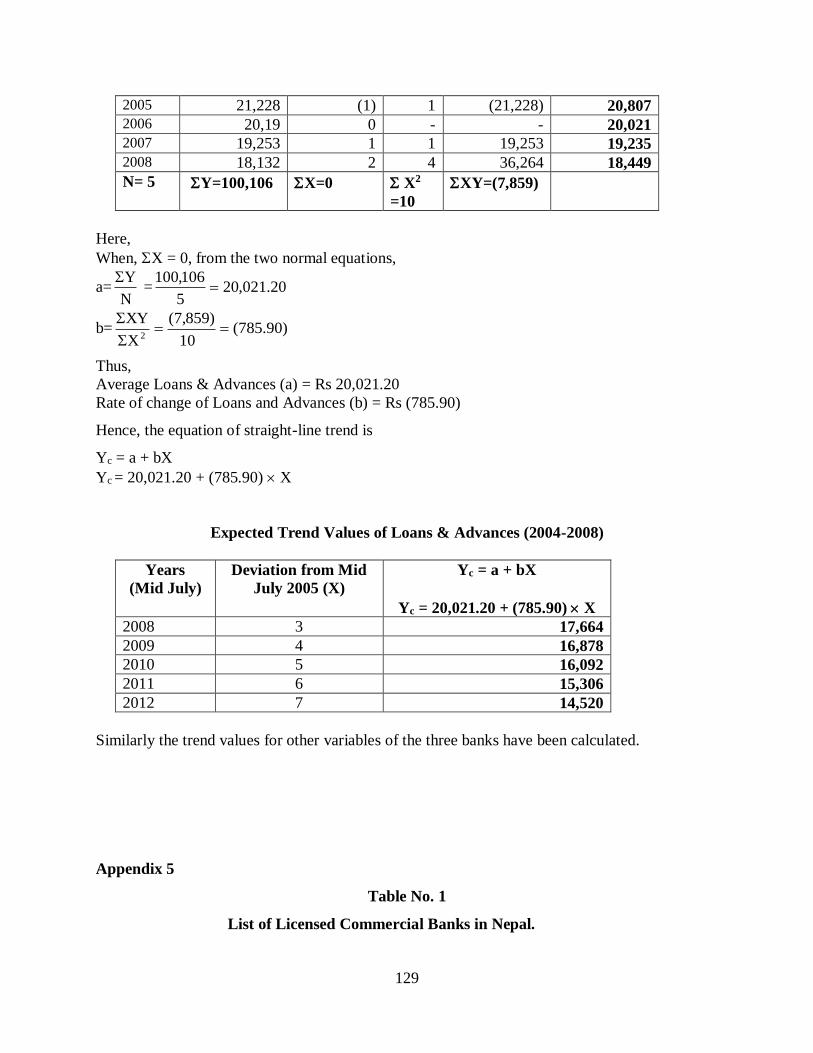
129
2005 21,228 (1) 1 (21,228) 20,807 2006 20,19 0 - - 20,021 2007 19,253 1 1 19,253 19,235
2008 18,132 2 4 36,264 18,449
N= 5 Y=100,106 X=0 X2
=10
XY=(7,859)
Here,
When, X = 0, from the two normal equations,
a=N
Y = 20.021,20
5
106,100
b= )90.785(10
)859,7(
X
XY2
Thus,
Average Loans & Advances (a) = Rs 20,021.20
Rate of change of Loans and Advances (b) = Rs (785.90)
Hence, the equation of straight-line trend is
Yc = a + bX
Yc = 20,021.20 + (785.90) X
Expected Trend Values of Loans & Advances (2004-2008)
Years
(Mid July)
Deviation from Mid
July 2005 (X)
Yc = a + bX
Yc = 20,021.20 + (785.90) X
2008 3 17,664
2009 4 16,878
2010 5 16,092
2011 6 15,306
2012 7 14,520
Similarly the trend values for other variables of the three banks have been calculated.
Appendix 5
Table No. 1
List of Licensed Commercial Banks in Nepal.
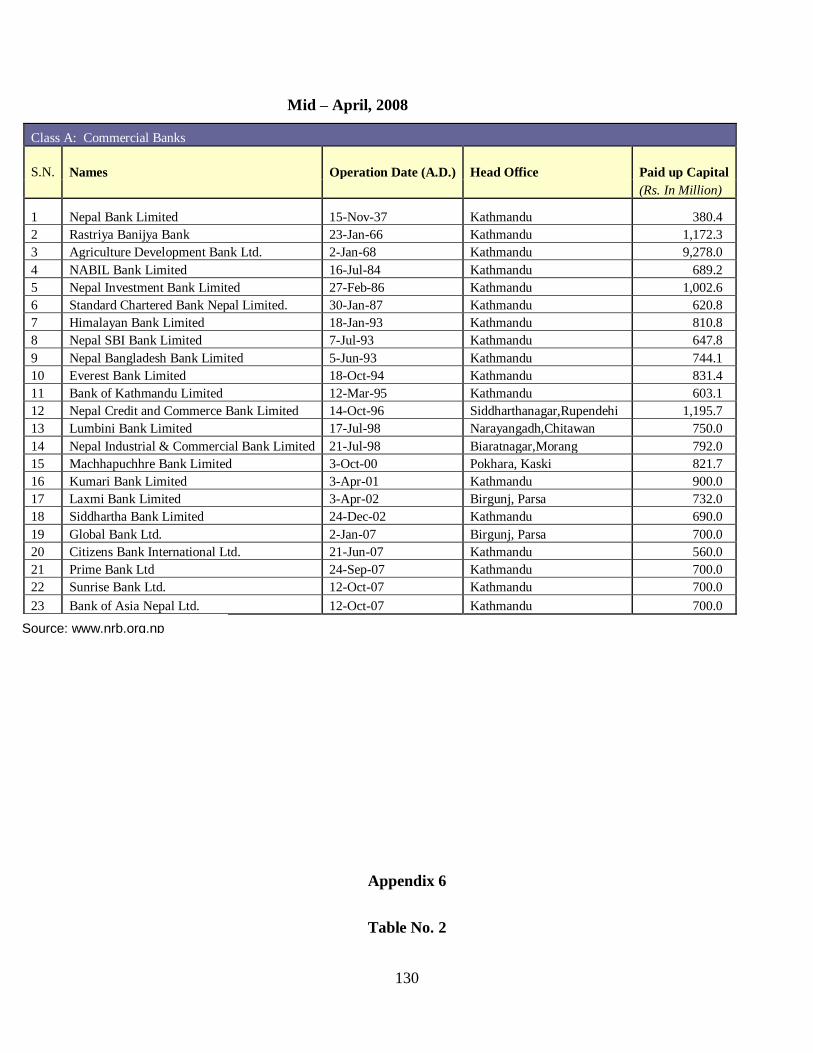
130
Mid – April, 2008
Class A: Commercial Banks
S.N. Names Operation Date (A.D.) Head Office Paid up Capital
(Rs. In Million)
1 Nepal Bank Limited 15-Nov-37 Kathmandu 380.4
2 Rastriya Banijya Bank 23-Jan-66 Kathmandu 1,172.3
3 Agriculture Development Bank Ltd. 2-Jan-68 Kathmandu 9,278.0
4 NABIL Bank Limited 16-Jul-84 Kathmandu 689.2
5 Nepal Investment Bank Limited 27-Feb-86 Kathmandu 1,002.6
6 Standard Chartered Bank Nepal Limited. 30-Jan-87 Kathmandu 620.8
7 Himalayan Bank Limited 18-Jan-93 Kathmandu 810.8
8 Nepal SBI Bank Limited 7-Jul-93 Kathmandu 647.8
9 Nepal Bangladesh Bank Limited 5-Jun-93 Kathmandu 744.1
10 Everest Bank Limited 18-Oct-94 Kathmandu 831.4
11 Bank of Kathmandu Limited 12-Mar-95 Kathmandu 603.1
12 Nepal Credit and Commerce Bank Limited 14-Oct-96 Siddharthanagar,Rupendehi 1,195.7
13 Lumbini Bank Limited 17-Jul-98 Narayangadh,Chitawan 750.0
14 Nepal Industrial & Commercial Bank Limited 21-Jul-98 Biaratnagar,Morang 792.0
15 Machhapuchhre Bank Limited 3-Oct-00 Pokhara, Kaski 821.7
16 Kumari Bank Limited 3-Apr-01 Kathmandu 900.0
17 Laxmi Bank Limited 3-Apr-02 Birgunj, Parsa 732.0
18 Siddhartha Bank Limited 24-Dec-02 Kathmandu 690.0
19 Global Bank Ltd. 2-Jan-07 Birgunj, Parsa 700.0
20 Citizens Bank International Ltd. 21-Jun-07 Kathmandu 560.0
21 Prime Bank Ltd 24-Sep-07 Kathmandu 700.0
22 Sunrise Bank Ltd. 12-Oct-07 Kathmandu 700.0
23 Bank of Asia Nepal Ltd. 12-Oct-07 Kathmandu 700.0
Appendix 6
Table No. 2
Source: www.nrb.org.np

131
Bank wise NPA level on Mid July 2007
Bank Wise NPL
Mid July 2007
Total Loans
(Rs 000s)
NPL
% Amount
Nepal Bank Limited 13,756,620 13.49 1,856,049
Rastriya Banijya Bank 25,394,627 29.16 7,405,073
Agriculture Development Bank Ltd. 27,153,148 14.97 4 ,064,826
NABIL Bank Limited 15,903,024 1.12 178,294
Nepal Investment Bank Limited 17,769,100 2.37 421,972
Standard Chartered Bank Nepal Limited. 10,790,148 1.83 197,017
Himalayan Bank Limited 17,793,724 3.61 641,615
Nepal SBI Bank Limited 10,065,052 4.56 458,756
Nepal Bangladesh Bank Limited 5,854,583 38.19 2,235,865
Everest Bank Limited 14,082,686 0.80 113,179
Bank of Kathmandu Limited 9,694,102 2.51 243,296
Nepal Credit and Commerce Bank Limited 5,122,222 30.63 1,568,937
Lumbini Bank Limited 4,944,501 20.37 1,007,036
Nepal Industrial & Commercial Bank Limited 9,128,649 1.11 101,140
Machhapuchhre Bank Limited 7,319,939 1.16 85,168
Kumari Bank Limited 9,062,433 0.73 66,119
Laxmi Bank Limited 6,529,239 0.35 23,021
Siddhartha Bank Limited 6,319,727 0.34 21,542
Global Bank Ltd. 2,602,564 - -
Citizens Bank International Ltd. 2,026,260 - -

132
Prime Bank Ltd N.A - N.A
Sunrise Bank Ltd. N.A - N.A
Bank of Asia Nepal Ltd. N.A - N.A
(Based on Provisional data of Mid April 2008)

133
Appendix 7
Table No.3
Bank wise NPA level on Mid April 2008
Bank Wise NPL
Mid April 2008
Total Loans
(Rs 000s)
NPL
% Amount
Nepal Bank Limited
15,603,598
11.00
1,716,396
Rastriya Banijya Bank
25,598,327
25.85
6,617,167
Agriculture Development Bank Ltd.
29,188,865
15.28 4,460,059
NABIL Bank Limited
20,817,386
1.30
270,626
Nepal Investment Bank Limited
26,437,653
1.36
359,552
Standard Chartered Bank Nepal
Limited.
12,695,035
1.02
129,489

134
Himalayan Bank Limited
20,092,426
3.46
695,198
Nepal SBI Bank Limited
11,852,093
4.07
482,380
Nepal Bangladesh Bank Limited
6,379,397
37.60
2,398,653
Everest Bank Limited
17,281,501
0.63
108,873
Bank of Kathmandu Limited
12,166,668
2.28
277,856
Nepal Credit and Commerce Bank
Limited
5,199,244
26.83
1,394,957
Lumbini Bank Limited
5,284,497
15.42
814,869
Nepal Industrial & Commercial Bank
Limited
10,558,391
0.80 84,467
Machhapuchhre Bank Limited
8,343,138
4.62
385,453

135
Kumari Bank Limited
9,238,987
1.39
128,482
Laxmi Bank Limited
8,569,717
0.29 24,852
Siddhartha Bank Limited
8,374,699
0.31 25,962
Global Bank Ltd.
4,744,883 - -
Citizens Bank International Ltd.
4,504,534 - -
Prime Bank Ltd
3,954,316 - -
Sunrise Bank Ltd.
2,290,404 - -
Bank of Asia Nepal Ltd.
2,020,109 - -
(Based on Provisional data of Mid April 2008)

136
Appendix 8
Table No. 6
Loans & Advances to Total Asset Ratio (%) In Million Rs
Year
(Mid
July)
NIBL NABIL NBBL
Loans &
Advances
Total
Asset
Ratio
(%)
Loans &
Advances
Total
Asset
Ratio
(%)
Loans &
Advances
Total
Asset
Ratio
(%)
2004 5921 9014 65.69 8114 16563 48.99 7962 11919 66.80
2005 7338 13255 55.36 8549 16745 51.05 9645 14258 67.65
2006 10453 16064 65.07 10947 17064 64.15 9627 13283 72.48
2007 13178 21330 61.78 13279 22330 59.47 9796 12959 75.59
2008 17769 27591 64.40 15903 27253 58.35 5855 10118 57.87
Mean 62.46 56.40 68.08
S.D 4.24 6.26 6.74
C.V 6.79 11.10 9.90
(Source : Annual Reports & Websites of Concerned Banks)

137
Appendix 9
Table No. 8
Non-Performing Assets (Loans) to Loans & Advances (%) Rs. In Million
Year
(Mid
July)
NIBL NABIL NBBL
NPL
Loans &
Advances
Ratio
(%)
NPL
Loans &
Advances
Ratio
(%)
NPL
Loans &
Advances
Ratio
(%)
2004 117 5921 1.98 450 8114 5.55 1013 7962 12.72
2005 181 7338 2.47 287 8549 3.36 1042 9645 10.80
2006 281 10453 2.69 145 10947 1.32 1832 9627 19.03
2007 272 13178 2.06 183 13279 1.38 2927 9796 29.88
2008 422 17769 2.37 178 15903 1.12 2236 5855 38.19
Mean 2.31 Mean 2.55 Mean 22.12
S.D 0.29 S.D 1.91 S.D 11.67
C.V 12.69 C.V 74.99 C.V 52.74
(Source : Annual Reports & Websites of Concerned Banks)

![Arcil NON PERFORMING ASSET seminar [kompatibilitätsmodus]](https://static.fdocuments.us/doc/165x107/5485a7685806b5d1588b47b6/arcil-non-performing-asset-seminar-kompatibilitaetsmodus.jpg)