An overview of investment types, trends and performance Basic Investment Concepts C09-0223-007...
67
An overview of investment types, trends and performance Basic Investment Concepts C09-0223-007 (3/09)
-
Upload
rosa-black -
Category
Documents
-
view
215 -
download
0
Transcript of An overview of investment types, trends and performance Basic Investment Concepts C09-0223-007...
An overview of investment types, trends and performance
Basic Investment Concepts
C09-0223-007 (3/09)

You should consider the investment objectives, risks, charges and expenses of the investment options carefully before investing. The prospectuses/prospectus summaries/information booklets containing this and other information can be obtained by contacting your local representative. Please read the information carefully before investing.
Insurance products, annuities and funding agreements issued by ING Life Insurance and Annuity Company (“ILIAC”) One Orange Way, Windsor, CT 06095 , which is solely responsible for meeting its obligations. Plan administrative services provided by ILIAC or ING Institutional Plan Services, LLC. All companies are members of the ING family of companies. Securities distributed by or offered through ING Financial Advisers, LLC (member SIPC) or other broker-dealers with which it has a selling agreement.

Agenda
Investment Types Stocks
Bonds
Mutual Funds
Market Trends and Investment Concepts

Investment Types

Represent ownership in a corporation
Potentially make money for investors by: Paying dividends Rising in value
Corporations come in a variety of sizes large medium small
Stocks

Number of shares outstanding x price per share
Indication of firm size Large cap - Over $3.3 billion (+/-)
(e.g., Microsoft, Wal-Mart, G.E.)
Mid cap - $750 million to $3.3 billion (+/-) (e.g., 3Com Corporation, Tupperware Brands Corp., Tootsie Roll)
Small cap - $200 million to 1 billion (+/-) (e.g., LA-Z-Boy, Swift Energy, LoJack Corp.)
Market Capitalization
As of 1/26/09. Market capitalization for Large Cap is represented by the S&P 500 Index; Mid Cap by the S&P 400 Index; Small Cap by the S&P 600 Index.
Source: Standard & Poor’s

Wilshire 5000
Russell 2000
Standard & Poor’s® Small Cap 600
Standard & Poor’s® Mid Cap 400
Standard & Poor’s® 500
- S&P® 500 Growth- S&P® 500 Value
Dow Jones Industrial Average
These unmanaged indexes are not intended to represent specific mutual funds. Investors cannot invest directly in an index. Individual results may vary to management fees, transaction costs and taxes. Performance figures do not take into account the fees and expenses of investing in mutual funds or variable products. Past performance is no guarantee of future results.
Major Domestic Market Indices

??Supply and
Demand Company
Performance
Industry IssuesEconomic, Social and
Political Factors
What affects stock prices?

1976-2008 Average Annualized Rate of Return = 10.22%
These unmanaged indexes are not intended to represent specific mutual funds. Investors cannot invest directly in an index. Individual results may vary to management fees, transaction costs and taxes. Performance figures do not take into account the fees and expenses of investing in mutual funds or variable products. Past performance is no guarantee of future results.
Source: Thomson Financial Company; Standard & Poor’s 500 Index Composite Total Return as of 12/31/2008
Year
Ret
urn
-50.00%
-40.00%
-30.00%
-20.00%
-10.00%
0.00%
10.00%
20.00%
30.00%
40.00%
50.00%
'76 '78 '80 '82 '84 '86 '88 '90 '92 '94 '96 '98 '00 '02 '04 '06 '08
Stock Market Performance Over Time

Average Annualized Returns as of 12/31/08
1 Yr. 5 Yrs. 10 Yrs.
-37.00% -2.19% -1.38%
-33.79% -0.93% 3.02%
Ret
urn
-40.00%
-30.00%
-20.00%
-10.00%
0.00%
10.00%
20.00%
30.00%
40.00%
50.00%
S&P 500 21.05% -9.11% -11.88% -22.10% 28.69% 10.87% 4.89% 15.80% 5.49% -37.00%
Russell 2000 21.26% -3.15% 2.48% -20.48% 47.25% 18.32% 4.55% 18.35% -1.57% -33.79%
'99 '00 '01 '02 '03 '04 '05 '06 '07 '08
These unmanaged indexes are not intended to represent specific mutual funds. Investors cannot invest directly in an index. Individual results may vary to management fees, transaction costs and taxes. Performance figures do not take into account the fees and expenses of investing in mutual funds or variable products. Past performance is no guarantee of future results.
Source: Thomson Financial Company
Large Cap vs. Small Cap

Growth stocks: Exhibit faster than expected gains in earnings
Expected to continue to show high levels of profit growth
Characterized by high P/E ratios and below average dividends
Value stocks: Deemed to be undervalued in price; could eventually have their worth
recognized by the market
Characterized by low P/E ratios, below average earnings growth rate forecasts, and above average dividends
Growth vs. Value

Growth vs. Value
Average Annualized Returns as of 12/31/08
1 Yr. 5 Yrs. 10 Yrs.
-34.92% -3.13% -3.15%
-39.22% -1.31% -0.25%
-40.00%
-30.00%
-20.00%
-10.00%
0.00%
10.00%
20.00%
30.00%
40.00%
S&P 500 Grow th 28.26% -22.08% -12.73% -23.59% 25.68% 6.14% 3.47% 11.01% 9.13% -34.92%
S&P 500 Value 12.72% 6.08% -11.71% -20.86% 31.80% 15.71% 6.34% 20.80% 1.99% -39.22%
1999 2000 2001 2002 2003 2004 2005 2006 2007 2008
Ret
urn
These unmanaged indexes are not intended to represent specific mutual funds. Investors cannot invest directly in an index. Individual results may vary to management fees, transaction costs and taxes. Performance figures do not take into account the fees and expenses of investing in mutual funds or variable products. Past performance is no guarantee of future results.
Source: Thomson Financial Company
Diversify by Style: Large Cap

-40.00%
-30.00%
-20.00%
-10.00%
0.00%
10.00%
20.00%
30.00%
40.00%
S&P 600 12.40% 11.80% 6.54% -14.63% 38.80% 22.65% 7.68% 15.12% -0.30% -31.07%
S&P MidCap 400 14.72% 17.51% -0.61% -14.51% 35.64% 16.50% 12.55% 10.32% 7.98% -36.23%
S&P 500 21.05% -9.11% -11.88% -22.10% 28.69% 10.87% 4.89% 15.80% 5.49% -37.00%
1999 2000 2001 2002 2003 2004 2005 2006 2007 2008
Small vs. Mid vs. Large
Average Annualized Returns as of 12/31/08
1 Yr. 5 Yrs. 10 Yrs.
-31.07% 0.88% 5.18%
-36.23% -0.08% 4.46%
-37.00% -2.19% -1.38%
These unmanaged indexes are not intended to represent specific mutual funds. Investors cannot invest directly in an index. Individual results may vary to management fees, transaction costs and taxes. Performance figures do not take into account the fees and expenses of investing in mutual funds or variable products. Past performance is no guarantee of future results.
Source: Thomson Financial Company
Ret
urn
Diversify by Market Cap

-40.00%
-30.00%
-20.00%
-10.00%
0.00%
10.00%
20.00%
30.00%
40.00%
50.00%
S&P 600 Grow th 19.58% 0.57% -1.18% -15.36% 37.32% 22.01% 8.97% 10.54% 5.60% -32.94%
S&P 600 Value 3.03% 20.86% 13.10% -14.47% 40.05% 23.23% 6.44% 19.57% -5.54% -29.51%
1999 2000 2001 2002 2003 2004 2005 2006 2007 2008
Growth vs. Value
These unmanaged indexes are not intended to represent specific mutual funds. Investors cannot invest directly in an index. Individual results may vary to management fees, transaction costs and taxes. Performance figures do not take into account the fees and expenses of investing in mutual funds or variable products. Past performance is no guarantee of future results.
Source: Thomson Financial Company
Average Annualized Returns as of 12/31/08
1 Yr. 5 Yrs. 10 Yrs.
-32.94% 0.85% 4.81%
-29.51% 0.88% 5.35%
Ret
urn
Diversify by Style: Small Cap

-40.00%
-30.00%
-20.00%
-10.00%
0.00%
10.00%
20.00%
30.00%
40.00%
50.00%
S&P 400 Grow th 27.37% 9.16% -7.97% -19.17% 30.96% 14.01% 13.42% 5.81% 13.50% -37.61%
S&P 400 Value 2.33% 27.84% 7.14% -10.11% 40.22% 18.92% 11.60% 14.62% 2.65% -34.87%
1999 2000 2001 2002 2003 2004 2005 2006 2007 2008
Growth vs. Value
These unmanaged indexes are not intended to represent specific mutual funds. Investors cannot invest directly in an index. Individual results may vary to management fees, transaction costs and taxes. Performance figures do not take into account the fees and expenses of investing in mutual funds or variable products. Past performance is no guarantee of future results.
Source: Thomson Financial Company
Average Annualized Returns as of 12/31/08
1 Yr. 5 Yrs. 10 Yrs.
-37.61% -0.15% 5.33%
-34.87 -0.11% 3.59%
Ret
urn
Diversify by Style: Mid Cap

IOU’s
Certify the lending of money to a government or corporation and describe the terms of the loan
Potentially generate money for investors by: Interest payments
Rising in value
Issued by many different entities
Come in a variety of qualities and maturities
Bonds

Government– Treasuries– Agencies– Municipals
Corporate– Investment Grade – Junk (High Yield)
(Higher Risk)
Types of Bonds
Please note, bonds offered by government chartered corporations carry more risk than U.S. Treasury securities.

Moody’s
Aaa
AaABaaBaBCaaCaC-
S&P
AAAAAABBBBBBCCCCCCD
Definition
Highest qualityHigh qualityFavorable attributesMedium qualitySpeculative elementsSmall assurancePoor standingHighly speculativeVery poor prospectsIn default
Bond Ratings
Please note, bond ratings are subject to change and may be downgraded any time by the ratings agency.

– Changes in fundamentals of issuer
– Changes in interest rates
Why do bond prices change?
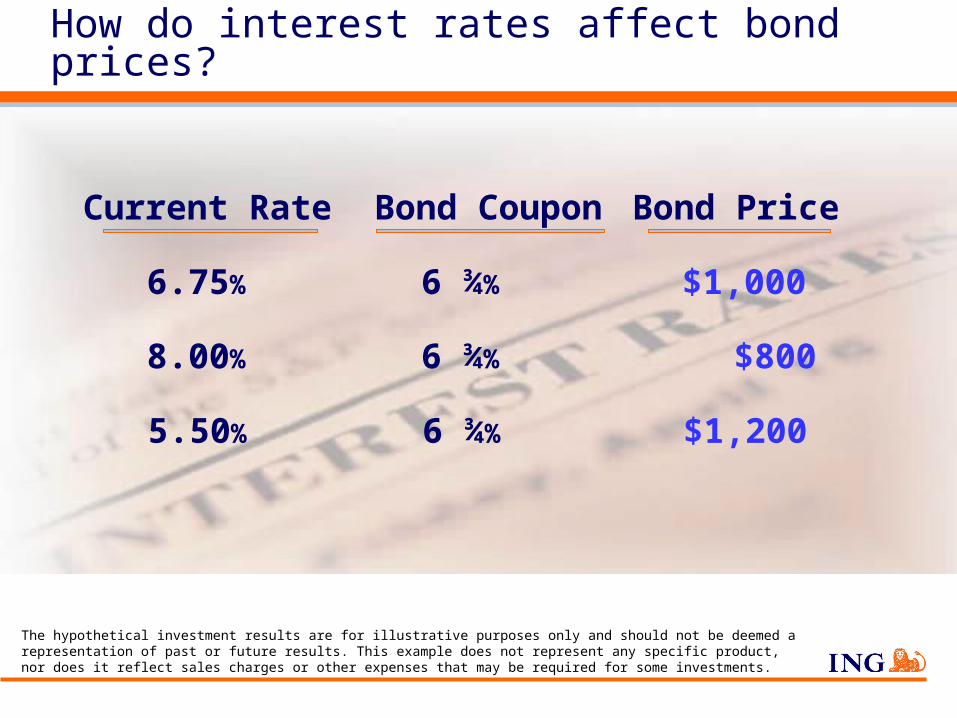
Current Rate Bond Coupon Bond Price
6.75% 6 ¾% $1,000
8.00% 6 ¾% $800
5.50% 6 ¾% $1,200
The hypothetical investment results are for illustrative purposes only and should not be deemed a representation of past or future results. This example does not represent any specific product, nor does it reflect sales charges or other expenses that may be required for some investments.
How do interest rates affect bond prices?

Collections of stocks, bonds, and other securities
Managed by a professional investment company
Come in a wide variety of types
Have stated investment objectives, policies and philosophies
Have administrative and investment management fees
Mutual Funds

Types of Mutual Funds/Investment Objectives
Equity Aggressive Growth
Growth
Growth & Income
Sector
International Foreign
Worldwide
Emerging Markets
Fixed Income (short long, intermediate)
Government
Corporate
High Yield
Foreign
Municipal
Combination Balanced
Asset Allocation
Money Market *
* An investment in the fund is not insured or guaranteed by the Federal Deposit Insurance Corporation or any other government agency. Although the fund seeks to preserve the value of your investment at $1.00 per share, it is possible to lose money by investing in money market funds.

Size
Style
OtherGrowth Value
Blend
Small Cap
Mid Cap
Large Cap
Quantitative vs. Fundamental
Top-down vs. Bottom-up
Equity Mutual Funds and Management Style

Market Trends and Investment Concepts

Aggressive Portfolio
Moderately Aggressive
Portfolio
Moderate Portfolio
Moderately Conservative
Portfolio
Conservative Portfolio
Portfolios reflect a varying mix of equity vs. fixed investments based on different investor profiles
Portfolios are illustrative only and are not intended to be specific recommendations. You have to decide what’s best for your risk tolerance level.
0
10%
20%
30%
40%
50%
60%
70%
80%
90%
100%
Allo
cati
on Fixed
Investments
Equity Investments
Sample Model Portfolio Allocations

Portfolio Diversification
When two investments exhibit parallel movement, the returns move up and down at the same time and to the same degree.
Risk: Not reduced in a portfolio with no diversification.
Investment A
Investment B
Portfolio 1
No Diversification
Source: SunGard® Online Investment Systems

Portfolio Diversification
When there is some similarity in movement among the returns of two investments, risk is partially reduced when combined into a portfolio.
Investment EPortfolio 2
Investment F
Some Diversification
Source: SunGard® Online Investment Systems

Portfolio Diversification
When two investments move in opposite directions, the strongest diversification effect will be produced.
Risk: Greatly reduced when both investments are represented in a portfolio, without substantially reducing portfolio expected return.
Investment C
Investment D
Portfolio 3
Complete Diversification
Source: SunGard® Online Investment Systems

Diversify Between Asset Classes
An asset class is a category of funds with similar investment objectives and risk profiles.
Asset class diversification attempts to reduce risk and/ or improve return.
Over time, the variance of returns within an investor’s portfolio primarily depend on the invested asset classes vs. individual fund selection.
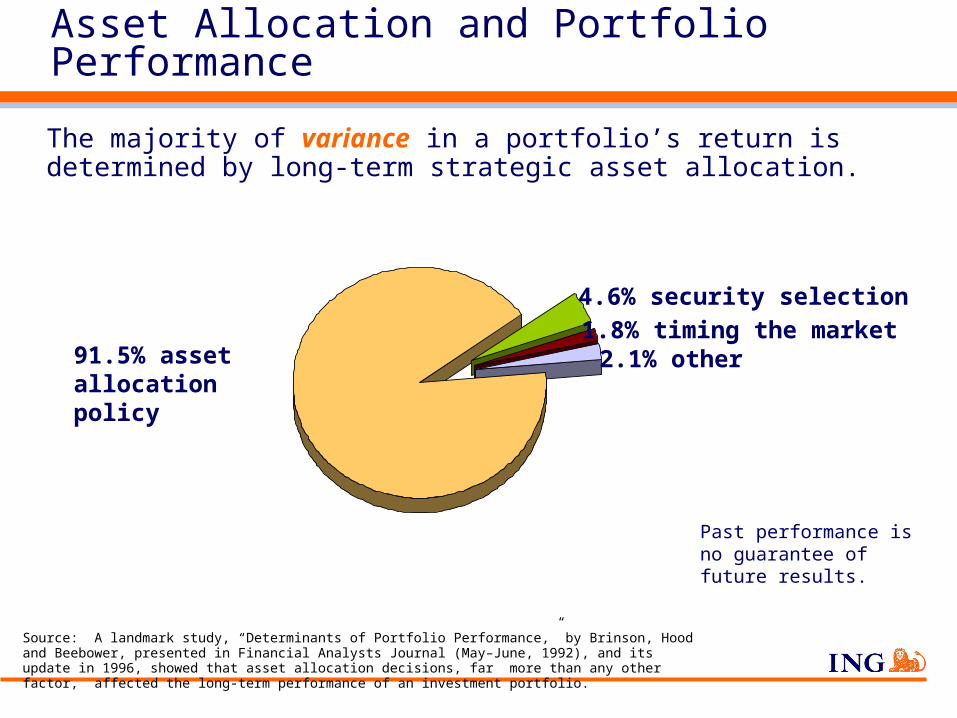
Source: A landmark study, “Determinants of Portfolio Performance,” by Brinson, Hood and Beebower, presented in Financial Analysts Journal (May–June, 1992), and its update in 1996, showed that asset allocation decisions, far more than any other factor, affected the long-term performance of an investment portfolio.
Source: A landmark study, “Determinants of Portfolio Performance,” by Brinson, Hood and Beebower, presented in Financial Analysts Journal (May–June, 1992), and its update in 1996, showed that asset allocation decisions, far more than any other factor, affected the long-term performance of an investment portfolio.
Past performance is no guarantee of future results.
4.6% security selection
2.1% other1.8% timing the market
Asset Allocation and Portfolio Performance
The majority of variance in a portfolio’s return is determined by long-term strategic asset allocation.
91.5% asset allocation policy

Relative Return/Risk Continuum
Each sample asset class has its own investment return/risk characteristics.
Risk
This illustration is hypothetical and is not intended to represent the performance of any specific asset class.
Ret
urn
Stability of Principal
Large Cap Growth
Small/Mid/Specialty
Global/International
Income
Large Cap Value
Balanced

HIGHESTRETURN
LOWESTRETURN
1999 2000 2001 2002 2003 2004 2005 2006 2007 2008
LargeStocks
LargeStocks
LargeStocks
LargeStocks
LargeStocks
SmallStocks
SmallStocks
SmallStocks
SmallStocks
SmallStocks
Int’lStocks
Int’lStocks
Int’lStocks
Int’lStocks
Int’lStocks
LT Gov’tBonds
LT Gov’tBonds
LT Gov’tBonds
LT Gov’tBonds
LT Gov’tBonds
LargeStocks
30 DayT-Bills
30 DayT-Bills
30 DayT-Bills
30 DayT-Bills
LT Gov’tBonds
SmallStocks
These unmanaged indexes are not intended to represent specific mutual funds. Investors cannot invest directly in an index. Individual results may vary to management fees, transaction costs and taxes. Performance figures do not take into account the fees and expenses of investing in mutual funds or variable products. Past performance is no guarantee of future results.
Source: Thomson Financial Company
LT Gov’tBonds
30 DayT-Bills
SmallStocks
LargeStocks
Int’lStocks
Asset Class Winners and Losers

Potential Benefits of Diversification

These unmanaged indexes are not intended to represent specific mutual funds. Investors cannot invest directly in an index. Individual results may vary to management fees, transaction costs and taxes. Performance figures do not take into account the fees and expenses of investing in mutual funds or variable products. Past performance is no guarantee of future results.
Source: Thomson Financial Company
Annual Returns for 2004 - 2008
Diversifying Across Asset Classes
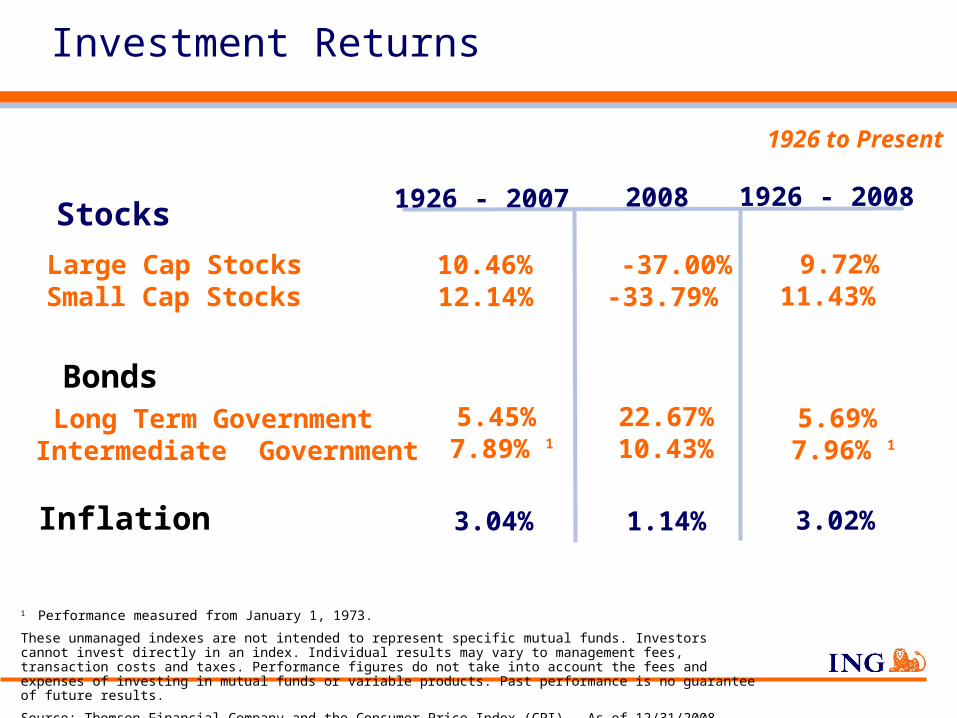
Stocks
Large Cap StocksSmall Cap Stocks
Long Term GovernmentIntermediate Government
Inflation
2008
-37.00%-33.79%
22.67%10.43%
1.14%
1926 - 2007
10.46%12.14%
5.45%7.89% 1
3.04%
Bonds
1926 - 2008
9.72%11.43%
5.69%7.96% 1
3.02%
1 Performance measured from January 1, 1973.
These unmanaged indexes are not intended to represent specific mutual funds. Investors cannot invest directly in an index. Individual results may vary to management fees, transaction costs and taxes. Performance figures do not take into account the fees and expenses of investing in mutual funds or variable products. Past performance is no guarantee of future results.
Source: Thomson Financial Company and the Consumer Price Index (CPI). As of 12/31/2008.
1926 to Present
Investment Returns

10.74%9.83%
10.52%8.44%
3.58%
10.76%10.80%
9.31%7.96%
1
4.53%
7.32%7.43%
9.32%6.74%
2.78%
Stocks
Large Cap StocksSmall Cap Stocks
Long Term GovernmentIntermediate Government
Inflation
Bonds
1980 - 2008 1970 - 2008 1990 - 2008
1 Performance measured from January 1, 1973.
These unmanaged indexes are not intended to represent specific mutual funds. Investors cannot invest directly in an index. Individual results may vary to management fees, transaction costs and taxes. Performance figures do not take into account the fees and expenses of investing in mutual funds or variable products. Past performance is no guarantee of future results.
Source: Thomson Financial Company and the Consumer Price Index (CPI). As of 12/31/2008.
1970, 1980, 1990 to Present
Investment Returns

The Importance of Diversification
Small Stocks - 5 Years(Russell 2000)
Sector leaders are based on annual index returns with dividends reinvested (1980 - 2008)
Source: Thomson Financial Company
International Stocks - 11 Years(MSCI EAFE)
Large Stocks - 6 Years(S&P 500)
Bonds - 7 Years(Barclays Capital Credit Bond Index)
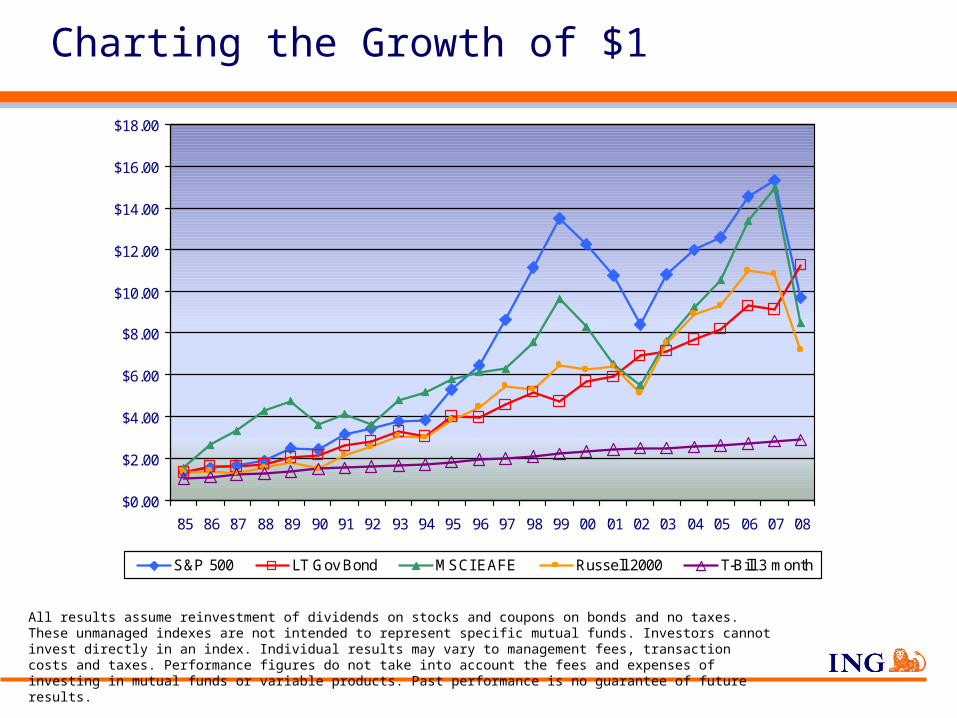
All results assume reinvestment of dividends on stocks and coupons on bonds and no taxes. These unmanaged indexes are not intended to represent specific mutual funds. Investors cannot invest directly in an index. Individual results may vary to management fees, transaction costs and taxes. Performance figures do not take into account the fees and expenses of investing in mutual funds or variable products. Past performance is no guarantee of future results.
Source: Thomson Financial Company. Period 1/1/1985 – 12/31/2008.
$0.00
$2.00
$4.00
$6.00
$8.00
$10.00
$12.00
$14.00
$16.00
$18.00
'85 '86 '87 '88 '89 '90 '91 '92 '93 '94 '95 '96 '97 '98 '99 '00 '01 '02 '03 '04 '05 '06 '07 '08
S&P 500 LT Gov Bond MSCI EAFE Russell 2000 T-Bill 3 month
Charting the Growth of $1

Both John and Barbara saw their $10,000 investment in common stocks drop to $7,846 in the month of October 1987.
The hypothetical investment results are for illustrative purposes only and should not be deemed a representation of past or future results. This example does not represent any specific product, nor does it reflect sales charges or other expenses that may be required for some investments. Source: Thomson Financial Company.
John: Sold off his stocks and reinvested in 3 month U.S. Treasury Bills.
As of December 31, 2008, his investment reflected:
Average Annual Return
Cumulative ReturnIndex
T-Bill (3 Month Yield) 4.28% 142.71%John
Account Balance
$19,043
Barbara: Held on to her stocks. As of December 31, 2008, her investment reflected:
S&P 500 Composite Total Return 8.66% 480.53%Barbara $45,548
A Tale of Two Investors

Value of $10,000 invested in the securities included in the S&P 500 Index January 1, 1973:
Unlike CDs, which are insured by the FDIC and offer a fixed rate of return, the principal value and investment return for equities will fluctuate with changes in market conditions. All results assume reinvestment of dividends on stocks and coupons on bonds and no taxes. Past performance is no indication of future results. Indices are unmanaged and not available for direct investments.
Source: Thomson Financial Company
$5,000
$5,500
$6,000
$6,500
$7,000
$7,500
$8,000
$8,500
$9,000
$9,500
$10,000
S&P 500 $10,000 $9,514 $8,961 $9,391 $8,520 $5,729
'01/01/733 Months
Later6 Months
Later9 Months
Later1 Year Later
1 Year, 9 Months Later
Continued...Balance after 1 year, 9 months: $5,729
When the Going Gets Tough...

Scenario 1: $5,729 remained invested in securities (represented by the S&P 500)Scenario 2: $5,729 removed from the market and reinvested in an interest-bearing CD at 5%.
$5,000
$10,000
$15,000
$20,000
$25,000
S&P 500 $5,729 $7,704 $7,914 $10,312 $12,408 $24,303
CD at 5% $5,729 $5,870 $6,015 $6,316 $7,312 $9,332
01-Oct-74 6 Months Later 1 Year Later 2 Years Later 5 Years Later 10 Years Later Value as of 12/31/08
$239,486
$30,466
Unlike CDs, which are insured by the FDIC and offer a fixed rate of return, the principal value and investment return for equities will fluctuate with changes in market conditions. All results assume reinvestment of dividends on stocks and coupons on bonds and no taxes. The S&P 500 is an unmanaged index and is not intended to represent specific mutual funds. Investors cannot invest directly in an index. Individual results may vary to management fees, transaction costs and taxes. Performance figures do not take into account the fees and expenses of investing in mutual funds or variable products. Past performance is no guarantee of future results.
Source: Thomson Financial Company.
$24,303
$9,332
When the Going Gets Tough...

Investing in the S&P 500 over a 10-year period ending 12/31/08.
-6% -4% -2% 0%-16% -14% -12% -8%-10%
All Trading Days
Minus 10 Best Days
Minus 20 Best Days
Minus 30 Best Days
Average Annual Return
-7.72%
-1.38%
Stock market performance is represented by price movements of the S&P 500 Index, an unmanaged stock market index that cannot be invested directly. This example assumes the reinvestment of dividends. Past performance is no guarantee of future results.
Source: Bloomberg
What a Difference a Day Makes!
-11.58%
-14.86%

Returns as of 12/31/08. Average Equity Investor returns were calculated by applying the retention rates of investors of mutual funds to the returns of the S&P 500. The S&P 500 is an unmanaged index and is not intended to represent specific mutual funds. Investors cannot invest directly in an index. Individual results may vary to management fees, transaction costs and taxes. Performance figures do not take into account the fees and expenses of investing in mutual funds or variable products. Past performance is no guarantee of future results.
Source: Dalbar, 2009 and Thomson Financial Company.
Investment Returns 1989 - 2008
8.43%
1.87%
0.00%
1.00%
2.00%
3.00%
4.00%
5.00%
6.00%
7.00%
8.00%
9.00%
S&P 500 Average EquityInvestor
Don’t Get Caught Chasing Returns

Timing the Market and Your Portfolio?
“Emotion is the enemy of all good investors”
“If 7,000 pros on Wall Street can’t do it, someone who (just) learned how a limit order works shouldn’t do it.”
- Ben Utley, certified financial planner and founder of Utley & Associates of Eugene, OR
Responding to market downturns
Don’t lose sight of your long-term objectives: Overall investment strategy Investment horizon timeline (years until retirement) Diversification through asset allocation Disciplined investing through dollar-cost averaging

Rose 936.42 pts, its largest point gain in its history (10/13/2008)
Declined 777.68 pts, its largest point loss in history (9/29/2008)
Rose 889.35 pts, its 2nd largest point gain in its history (10/28/2008)
The Dow Jones Industrial Average (DJIA):
Source: 2009 Dow Jones & Company
Comprehensive study showed that these events did not compel the majority of plan participants to: Withdraw from plan participation Reduce their contribution levels Increase their fund transfer activity
Market Volatility’s Impact on Investor Behavior

Top 10 Retirement Bloopers
1. You aren’t saving at all for retirement.Will Social Security subsidize your retirement needs?
2. You cashed out of your employer-sponsored retirement program or IRA. Did you pay over 35% in taxes including a 10% penalty?
3. You aren’t taking advantage of your employer-sponsored retirement program.Will you forgo the potential tax-deferred growth?
4. You don’t know the first thing about IRAs. Do you know IRAs also offer tax-deferred growth?

Top 10 Retirement Bloopers
5. You aren’t diversified.
Have you checked the Top 10 holdings of your investment options?
6. You didn’t learn from the Enron fiasco.
Is it prudent to invest heavily in employer stock?
7. You assume you’ll need less.
Upon reaching retirement, will your lifestyle change?
8. You’re not taking advantage of higher savings limits.
Do you know how Pension Reform affects you?

Top 10 Retirement Bloopers
9. You don’t have a smart withdrawal plan. Will you take a lump sum or opt for a systematic payout option?
10. You borrowed from your retirement plan when it wasn’t really an emergency. Do you know you’re missing out on potential market growthwhile paying yourself back?

Financial Roller Coaster
Is this cause for concern?
A reflection that market volatility is a way of life?
Most likely, a bit of both.
Recent volatility of the Dow Jones Industrial Average:

Don’t “throw in the towel” Some consolation for investors: You
weren’t alone! There’s no “surefire” strategy to
becoming wealthy We need to come to grips with what
happened and plan sensibly for the future
...What should I do?
I lost half my savings in a market slide...

Where within your portfolio did you incur the losses?
Was your account diversified? Did you skip bonds thinking they were too conservative?
Were your stock holdings broadly diversified by: Size? (small-, mid and large-cap stocks)
Style? (value and growth)
Sector? (retail, energy, utilities, etc.)
Gaining insight into why you may have lost so much: Questions to ponder...
How did I get here?

Key factor: After years of a Bull market we were faced with one of the worst Bear markets in history
Did we become conditioned to expect higher returns of the 90’s?
Maybe I shouldn’t I be allocated 100% in stocks. Maybe it’s 80, 70 or 60 percent.
Be careful not to go from one extreme to the next. Don’t allow emotions to drive you out of stocks completely.
After the recent market downswing, how should my money REALLY be diversified?
Where do I go from here?
Check the performance of your investment options Have they measured up to their peers?
Is your portfolio over-weighted in certain areas? Are you only in Large Cap? Have you considered Small Cap or Value
Stocks? Bonds?
Tip: Compare the Top 10 holdings of your investment options Are they similar among your investment options? Are you truly diversified?
Regrouping: Getting Back to Basics

Bear Markets(Decline & Recovery)
Amount of Decline
Aug ‘56 - Sep ‘58
Dec ‘61 - Sep ‘63
Feb ‘66 - May ‘67
Nov ‘68 - Mar ‘72
Jan ‘73 - Jul ‘80
Nov ‘80 - Nov ‘82
Aug ‘87 - Jul ‘89
Mar ‘00 - Sept ‘06
Duration of Bear# of Months
14.9
6.6
8.0
18.1
21.0
20.8
3.4
31.0
21.6%
28.0%
22.2%
36.1%
48.2%
27.1%
33.5%
47.5%
Recovery Period# of Months
11.3
14.5
7.0
21.7
70.5
2.8
20.0
48.0
Source: Neuberger Berman; Standard & Poor’s Corp. Past performance does not guarantee future results.
Oct ‘07 - ? ? ? ?
Bear Markets

The S&P 500 is an unmanaged index and is not intended to represent specific mutual funds. Investors cannot invest directly in an index. Individual results may vary to management fees, transaction costs and taxes. Performance figures do not take into account the fees and expenses of investing in mutual funds or variable products. Past performance is no guarantee of future results.
Source: Thomson Financial Company
Ret
urn
Dec 7, 1941Pearl Harbor
Nov 22, 1963Kennedy
AssassinationAug 2, 1990
Iraq Invades Kuwait
Feb 26, 1993World Trade
Center Bombed
Sep 11, 2001World Trade Center &
Pentagon Attacked
Cumulative Return of the
S&P 500 After Tragic Events
U.S. Market Recovery After Tragedy

Six month returns from start of Post-Crisis period
* Large and small cap are represented by the top and bottom deciles of NYSE based on market cap. Growth and Value are represented by the S&P 500/BARRA Growth and Value indices, respectively.
Source: Ned Davis Research, CRISP, Ibbotson
-3.6%-3.4%-3.1%-3.1%Feb ‘94Northridge Earthquake
2.2%5.5%-8.7%-1.3%May ‘86US Bombs Libya
0.3%-10.7%Jan ‘74Oil Embargo
26.5%24.8%Nov ‘62Cuban Missile Crisis
41.3%18.9%Aug ‘50Korean War
29.8%-5.8%Jan ‘42Pearl Harbor
ValueGrowthSmall Cap
Large
Cap *
Start of
Post-CrisisCrisis
Don’t Bet Against America

Sh
are
Pri
ce
$5
$8$8
$6$6
$10
5
10
January$100 10
March$100 16.6
April$100 12.5
May$100 12.5
June$100 16.6
February$100
20
Month:Investment:
Shares:
7
8
6
9
Dollar cost averaging/Systematic Investment plan does not ensure a profit nor guarantee against loss. Investors should consider theirfinancial ability to continue their purchases through periods of low price levels. The hypothetical investment results are for illustrative purposes only and should not be deemed a representation of past or future results.
This example does not represent any specific product, nor does it reflect sales charges or other expenses that may be required for some investments.
Total Investment: $600 Total Shares Purchased: 88.2
Average Cost per Share: $6.80 Average Market Price per Share: $7.16
Investing Through Dollar Cost Averaging

$10
$6Sh
are
Pri
ce
5
10
7
8
6
9
January$600 60
March$0 0
April$0 0
May$0 0
June$0 0
February$0
0
Month:Investment:
Shares:
(from prior example)
Total Investment: $600 Total Shares Purchased: 60
Average Cost per Share: $10.00 Average Market Price per Share: $7.16
Dollar cost averaging/Systematic Investment plan does not ensure a profit nor guarantee against loss. Investors should consider theirfinancial ability to continue their purchases through periods of low price levels. The hypothetical investment results are for illustrative purposes only and should not be deemed a representation of past or future results.
This example does not represent any specific product, nor does it reflect sales charges or other expenses that may be required for some investments.
...vs. Making a One-time Investment

72
average rate of return
=# of years for investment to
double
0% tax on 6% = 6% net
=72
6% net
12 years for investment to
double
Tax-deferred Investment
25% tax on 6% = 4.5% net
=72
4.5% net
16 years for investment to
double
Taxable Investment
Hypothetical example: $10,000 invested at age 20, earning 6% at 25% tax rate*
The Formula for Rule of 72:
* A 25% tax rate and an 6% rate of return are applied for this illustration. Actual rates may be significantly higher or lower which will impact the comparative results. The hypothetical investment results are for illustrative purposes only and should not be deemed a representation of past or future results. This example does not represent any specific product, nor does it reflect sales charges or other expenses that may be required for some investments.
How long could it take to double your money?
A Rule to Save By: Rule of 72

Hypothetical example: $10,000 invested at age 20, earning 6% at 25% tax rate*
Tax-deferred Investment
12 years for investment to double
Age 20 $10,00032 20,00044 40,00056 80,00068 160,000
Total $160,000
minus Tax @ 25% 40,000
AFTER TAXES $120,000
Taxable Investment
16 years for investment to double
Age 20 $10,00036 20,00052 40,00068 80,000
Total $80,000
AFTER TAXES $80,000
* A 25% tax rate and an 6% rate of return are applied for this illustration. Actual rates may be significantly higher or lower which will impact the comparative results. The hypothetical investment results are for illustrative purposes only and should not be deemed a representation of past or future results. This example does not represent any specific product, nor does it reflect sales charges or other expenses that may be required for some investments.
A Rule to Save By: Rule of 72

Terminology

Load - fee for entering (front-end) or exiting (back-end) a fund
Total fund expenses - annual expense applied to fund for management and administration (Funds ALWAYS have annual expenses, but NOT always loads)
NAV (Net Asset Value):
Price quoted on a daily basis
Is net of fund expenses (tiny fraction assessed daily)
Fund Terminology

Mutual funds: May be offered within a qualified retirement program (custodial account)
Offered at net asset value (NAV): NAV (price) quoted on a daily basis and may be tracked in newspapers
NAV is net of fund expenses: A tiny fraction is assessed daily
Investing in a mutual fund means purchasing shares of that fund
Mutual Fund Terminology

May be offered within a qualified retirement program (e.g., 401(k), 403(b), etc.)
Account values determined on a daily basis
Contributions toward the account purchase “units” of a pooled Separate Account The Separate Account then invests directly into the open market (e.g.,
directly into mutual funds)
AUVs are not tracked in newspapers
Variable Group Annuity Investment Options

Variable Group Annuity Investment Options
Each unit purchased has a value known as the Accumulation Unit Value (AUV)
Number of units owned x AUV = The account balance
Accumulation Unit Values:

Prospectus Each fund has one
Your retirement program has one (sometimes called a “disclosure booklet” or “disclosure information”)
Outlines “ground rules” of fund (e.g., fund objective)
Annual and Semi-Annual Report Each fund has one
Lists ALL fund holdings as of particular date
Provides manager analysis of performance
Statement of Additional Information (SAI) Addendum to prospectus
Fund Reporting/Sources of Information

Several types of stocks, bonds and funds
Different funds/varying investment objectives
Our role defined
Conclusion