Test Report: Proton Radiation Evaluation of TIRS QWIP and ...
An overview of cloud masking and other research for Landsat and LDCM
LTAP-related work Cloud masking (with and without TIRS thermal and OLI cirrus band) Cloud number vs. size of marine trade cumulus (if time permits)
Lazaros Oreopoulos (NASA-GSFC)
and Mike Wilson (UMBC-GEST)
with contributions by
Tamás Várnai, John Gasch, Dongmin Lee, Ilan Koren, and Graham Feingold

LTAP-related work (with John Gasch & Dongmin Lee)

ISCCP D2 Nominal CF- (January 1983 – 1997) Land CF = 56
Average MODIS L2 CF – (January 2005-2009) Land CF = 45
3
Cloud Fraction climatology comparison: ISCCP vs. MODIS
In LTAP, cloud fraction predictions are compared to climatology

Average Cloud Fraction 2005 – 2009
Average ACCA = 31.0
Average MODIS CF of all acquired ETM+ scenes
= 32.7
4

Average MODIS CF of scenes not acquired by L7
Black and Dark-Green are regions where consistently clear
candidate scenes were routinely skipped by L7
(Note that CONUS is always acquired)
5
Contrast above with this map of average MODIS CF of scenes
acquired by L7 These depict the advantage of the cloud avoidance approach.
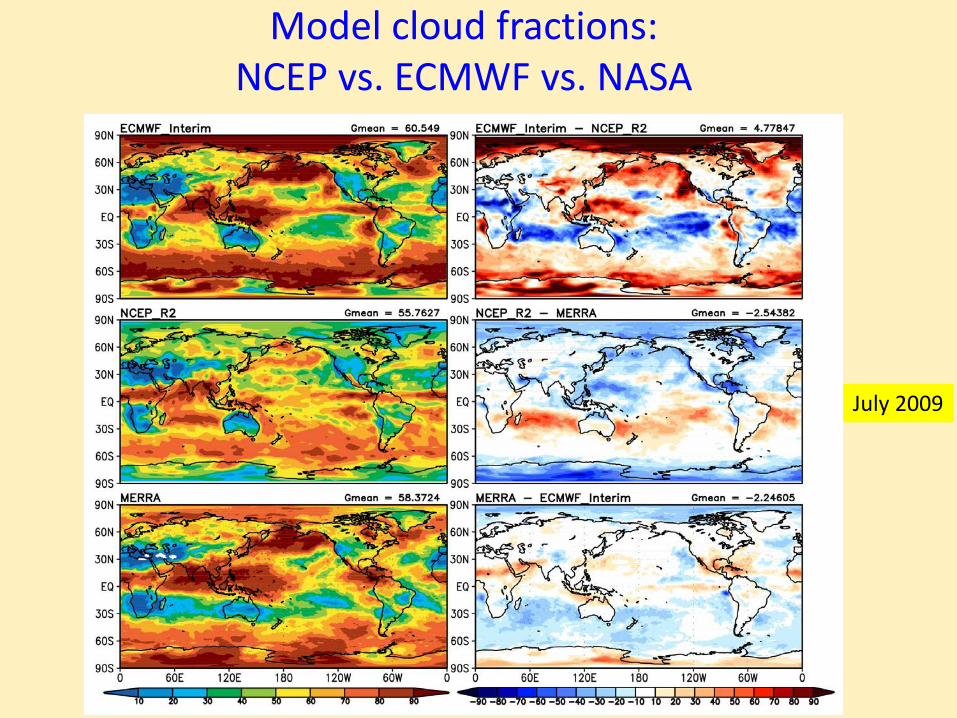
Model cloud fractions: NCEP vs. ECMWF vs. NASA
July 2009

Cloud masking, historic Landsat (with Mike Wilson & Tamás Várnai)

L1<L3 and L3<L4 and L4<L5*1.07 and L5<0.65 or
L1*0.8<L3 and L3<L4*0.8 and L4<L5 and L3<0.22
L3>0.24 and L5<0.16 and L3>L4 or
0.24>L3>0.18 and L5<L3-0.08 and L3>L4
L3>L4 and L3>L5*0.67 and L1<0.30 and L3<0.20 or
L3>L4*0.8 and L3>L5*0.67 and L3<0.06
[L1>0.15(0.20) or L3>0.18] and L5>0.12 (0.16) and max(L1,L3)>L5*0.67
IInput Top-of-Atmosphere Reflectance for LandSat Bands 1, 3, 4, and 5. (L1, L3, L4, and L5)
Non-Vegetated Lands
Snow/Ice
Water Bodies
Clouds
Vegetated Lands
Yes
Yes
Yes
Yes
No
No
No
No
Modified Luo et al. (2008) LTK scheme (Oreopoulos et al. 2011)
No thermal!
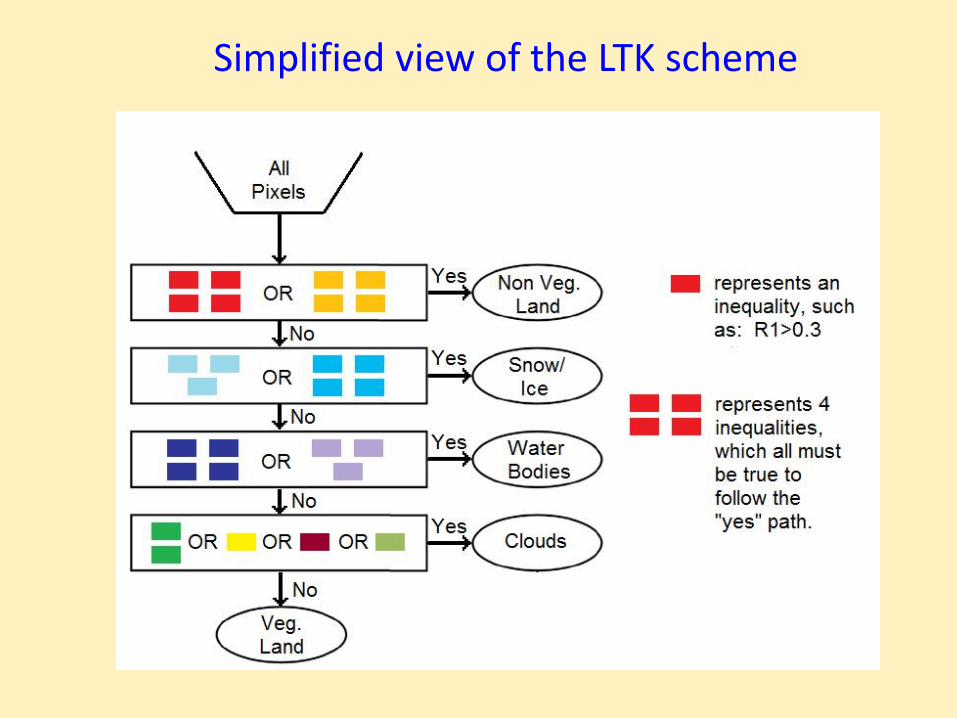
Simplified view of the LTK scheme

Cloud
Vegetated Lands
Water Bodies
Snow/Ice
Non-Vegetated Lands Subtropical South P158_r72_4
ACCA agreement 96.7% LTK agreement 95.7%

Cloud “score” and mask performance: LTK vs. ACCA

Cloud masking for LDCM: adding split window (BT11-BT12) and the cirrus (1.38 µm) band
(with Mike Wilson)

Band 31 (11.1µm) Band 26 (1.38µm)
MODIS 2006240 19:45 UTC (courtesy of R. Frey)

Split-window Test 1.38 µm Ref. Test (black means test not performed)
MODIS 2006240 19:45 UTC (courtesy of R. Frey)

Simulations by others (what MODIS applies)
From the CASPR User’s guide
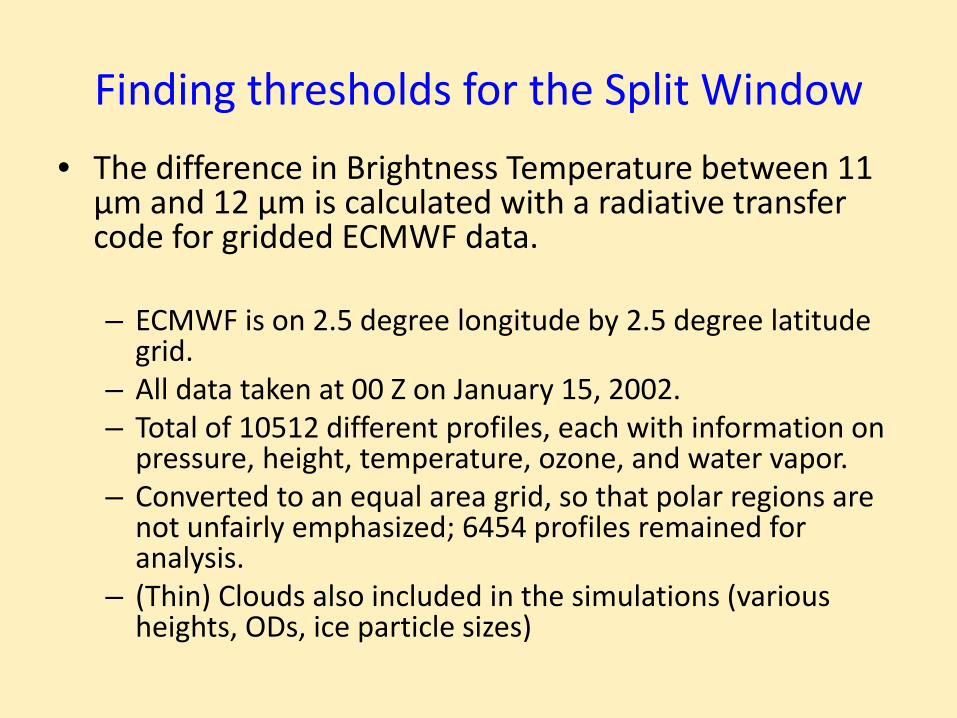
Finding thresholds for the Split Window • The difference in Brightness Temperature between 11
µm and 12 µm is calculated with a radiative transfer code for gridded ECMWF data. – ECMWF is on 2.5 degree longitude by 2.5 degree latitude
grid. – All data taken at 00 Z on January 15, 2002. – Total of 10512 different profiles, each with information on
pressure, height, temperature, ozone, and water vapor. – Converted to an equal area grid, so that polar regions are
not unfairly emphasized; 6454 profiles remained for analysis.
– (Thin) Clouds also included in the simulations (various heights, ODs, ice particle sizes)

Selected profiles shown by triangles
Fewer Triangles occur near the poles

Clouds separate from clear in a bispectral plot

Upper envelope of red points=our thresholds
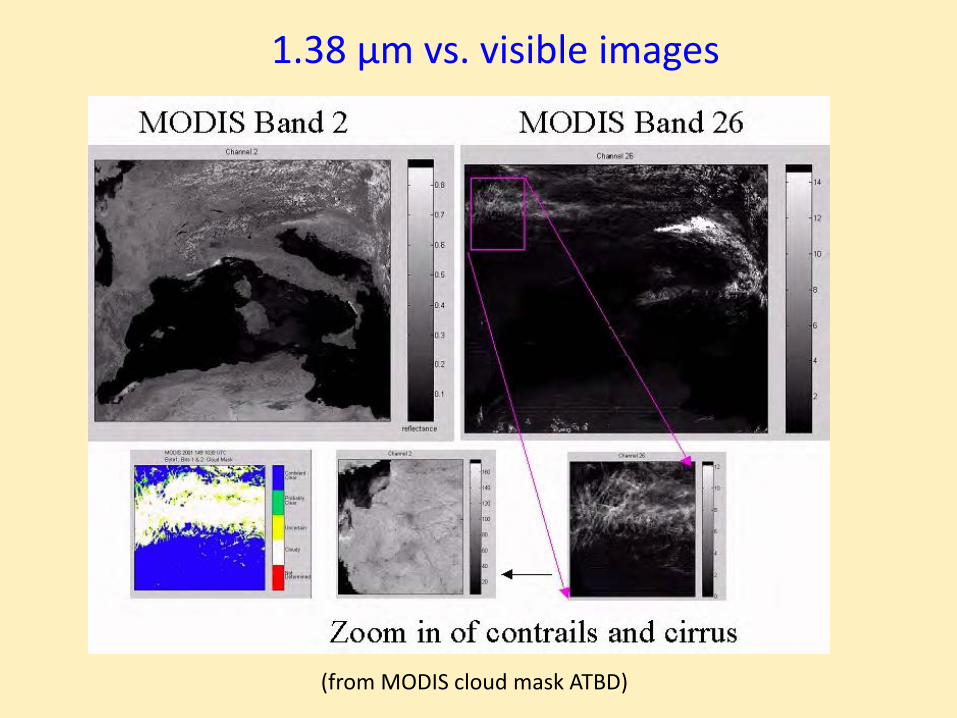
(from MODIS cloud mask ATBD)
1.38 µm
1.38 µm vs. visible images

Derivation of 1.38 µm Threshold (1)
• 6454 ECMWF gridboxes from January 15, 2002. • Constant values for all cases:
– Solar Zenith Angle = 30 degrees – Surface Albedo = 0.25
• All combinations of the following: – Cloud Optical Depths of 1, 2, 3, 4. – Cloud Top Heights of 100,150,200,250,300,400 mb – Effective Ice Diameters of 40, 70, 100 µm.

Derivation of 1.38 µm Threshold (2)
• Threshold set to reflectance at which 99% of cloudy cases were brighter than that reflectance.
• Threshold value: 0.01126.
• For this value: – 99% of cloudy simulations were correctly thresholded – 93.7% of clear simulations were correctly thresholded.

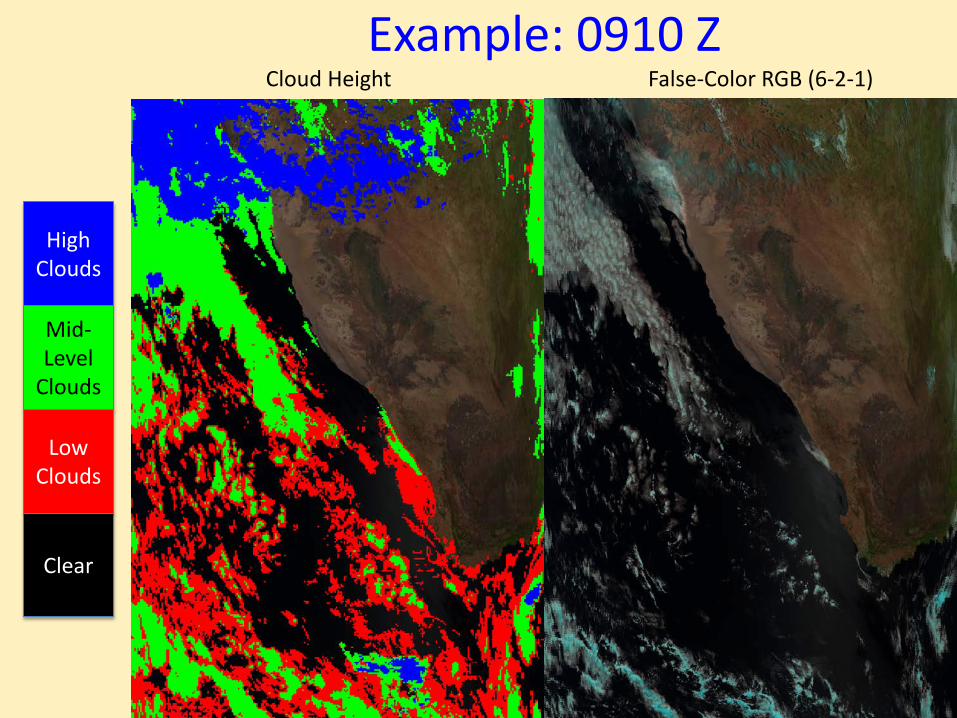
Example: 0910 Z
Example: 0910 Z
Clear
High Clouds
Mid-Level
Clouds
Low Clouds
Cloud Height False-Color RGB (6-2-1)

Clear
High Clouds
Mid-Level
Clouds
Low Clouds
Cloud Height Split-Window Cloud Mask Example: 0910 Z

Clear
High Clouds
Mid-Level
Clouds
Low Clouds
Cloud Height 1.38 µm Cloud Mask Example: 0910 Z

Clear
High Clouds
Mid-Level
Clouds
Low Clouds
Cloud Height LTK Cloud Mask Example: 0910 Z

Clear
High Clouds
Mid-Level
Clouds
Low Clouds
Example: 0910 Z Cloud Height Enhanced LTK Cloud Mask

Split Window is Cloudy AND
1.38 um Threshold is Cloudy
Split Window is Cloudy
OR
1.38 um Threshold is Cloudy
Enhancement of LTK
Yes
Yes
No Enhancement for Vegetated Land
Non-Vegetated Land retesting improves results over land. Snow/Ice and Water retesting improves results over water.
Enhanced LTK scheme

MODIS Global Analysis (1) • One day’s worth of MODIS data used for
analysis. – January 15, 2002: same day as ECMWF data runs. – Daytime granules between 60°N and 60°S latitude
(108 granules total)
MODIS Global Analysis (2)
• MOD35 (MODIS cloud mask) was assumed to be “cloudy” if pixel was either “confident cloudy” or “probably cloudy.”
• Several algorithms were tested against the MOD35 Cloud Mask: – LTK Cloud Mask a la Oreopoulos et al. (2011) – Split window – 1.38 µm Reflectance Threshold – Enhanced LTK cloud mask with split window and 1.38 µm

MODIS Global Analysis (3)
• A pressure cloud mask (MOD06) was used to divide clouds into high (<400 mb), mid-level (400-850 mb) and low clouds (>=850 mb).
• Each algorithm’s agreement to these categories was measured. – 100% means the algorithm completely agreed with
the cloudy/clear results of MOD35. – 0% means the algorithm completely disagreed. – Scene (granule) cloud fractions were also compared.
• Results for land only (according to MOD35 flags) were also derived.

Cloud Fraction Comparison
Cloud Fraction of 1 deg gridboxes
MODIS (MOD35) Cloud Mask LTK Cloud Mask
0%-20% Water 20%-40% 40%-60% 60%-80% 80%-100% 0%-20%
Land No
Retrieval Cloud
Fraction:
Enhanced LTK Cloud Mask

Enhanced LTK scheme mask performance LTK0 by
Oreopoulos et al. (2011)
At least one algorithm
cloudy (LTK1)
LTK with selective reclassification
(LTK2)
All Clouds 70.01% 86.75% 85.21% High Clouds 71.36% 97.21% 96.08% Mid Clouds 86.83% 95.73% 94.37% Low Clouds 40.01% 58.10% 55.83%
Clear 93.88% 84.96% 90.35% Overall
Performance
77.62% 86.18% 86.85%
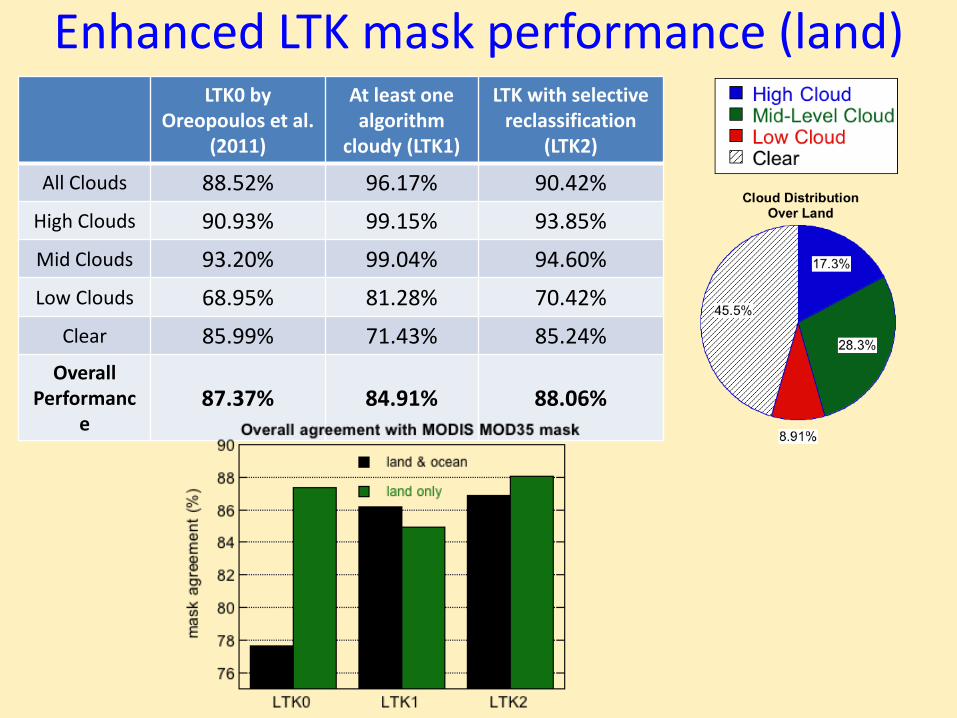
Enhanced LTK mask performance (land) LTK0 by
Oreopoulos et al. (2011)
At least one algorithm
cloudy (LTK1)
LTK with selective reclassification
(LTK2)
All Clouds 88.52% 96.17% 90.42% High Clouds 90.93% 99.15% 93.85% Mid Clouds 93.20% 99.04% 94.60% Low Clouds 68.95% 81.28% 70.42%
Clear 85.99% 71.43% 85.24% Overall
Performance
87.37% 84.91% 88.06%

Small cumulus size distribution analysis
(with Ilan Koren and Graham Feingold)

1)( +−= mbaaAa = area of individual cloud
slope m
Koren, Oreopoulos, Feingold, Remer, Altaratz, ACP, 2008
Num
ber o
f clo
uds
Cloud area, m2
Cloud fraction = f (A)
Reflectance = f (A, τc)
A = total area of clouds τc = cloud optical depth
pixels
pixe
ls Sparse marine cumulus from Landsat-7
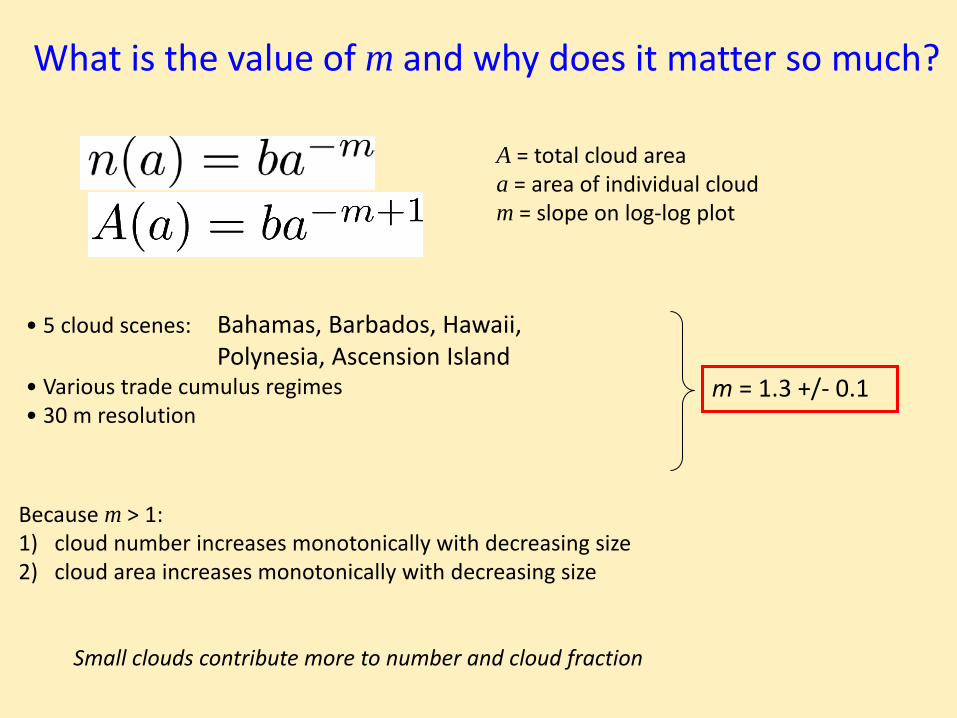
Small clouds contribute more to number and cloud fraction
Because m > 1: 1) cloud number increases monotonically with decreasing size 2) cloud area increases monotonically with decreasing size
A = total cloud area a = area of individual cloud m = slope on log-log plot
• 5 cloud scenes: Bahamas, Barbados, Hawaii, Polynesia, Ascension Island • Various trade cumulus regimes • 30 m resolution
m = 1.3 +/- 0.1
What is the value of m and why does it matter so much?

Two opposing forces: 1) Large clouds are optically thicker and reflect more 2) Large clouds are less abundant
What about reflectance?
Reflectance decreases with increasing size provided m>1.269 (1600 nm) m>1.125 (470 nm)
area Nor
mal
ized
inte
grat
ed re
flect
ance
cloud size
refle
ctan
ce

50% of the reflectance derives from clouds with areas <1 km2
area, km2
Nor
mal
ized
cum
ulat
ive
refle
ctan
ce
50%
The end result

Thoughts on Landsat, LDCM and the future • It’s been a great learning experience to be part of an excellent Landsat STM
• Free Landsat data will lead to increase of even cloud-related research
• The acquisition strategy needs to be simplified: always acquire over land should be the way of the future
– If something like LTAP continues to exist try to use the best cloud climatologies and forecasts
• Fight for thermal capabilities in future missions
• Cloud masking will never be perfect (85-90% accuracy probably the best we can do with limited number of bands), but a product should be provided.
• Shadow detection is much harder (especially to automate), but its importance should not be overemphasized

Acknowledgements • Financial support by NASA’s LPSO (Irons/Masek)
USGS
DR

Additional slides
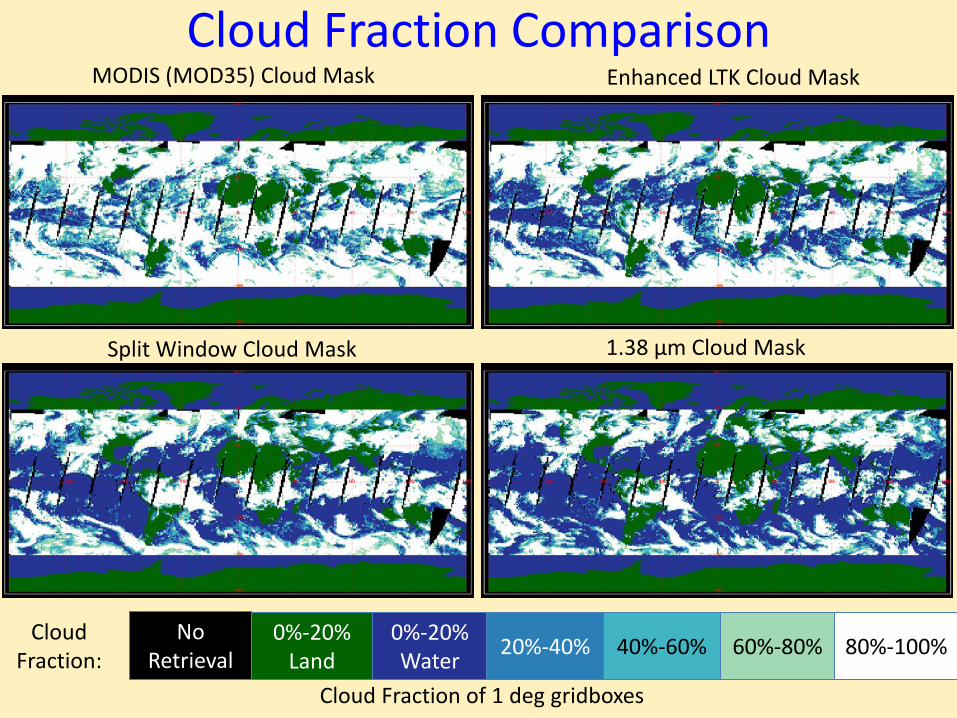
Cloud Fraction Comparison
Cloud Fraction of 1 deg gridboxes
MODIS (MOD35) Cloud Mask Enhanced LTK Cloud Mask
0%-20% Water 20%-40% 40%-60% 60%-80% 80%-100% 0%-20%
Land No
Retrieval Cloud
Fraction:
Split Window Cloud Mask 1.38 µm Cloud Mask

Cloud score performance: 108 MODIS granules
Original LTK Enhanced LTK

Cloud mask performance: 108 MODIS granules