
An online-offline prognosis model for fatigue life ...
16
ORIGINAL CONTRIBUTION An online‐offline prognosis model for fatigue life prediction under biaxial cyclic loading with overloads Guoyi Li 1 | Siddhant Datta 1 | Aditi Chattopadhyay 1 | Nagaraja Iyyer 2 | Nam Phan 3 1 Arizona State University, Tempe, AZ 85287, USA 2 Technical Data Analysis Inc., Falls Church, VA 22042, USA 3 US Naval Air Systems Command, Patuxent River, MD 20670, USA Correspondence Guoyi Li, Arizona State University, Tempe, AZ 85287, USA. Email: [email protected] Funding information Technical Data Analysis Inc., Grant/ Award Number: N68335‐16‐G‐0009, DO 0001; US Navy Naval Air Systems Command Abstract This paper presents a robust online‐offline model for the prediction of crack propagation under complex in‐phase biaxial fatigue loading in the presence of overloads of different magnitudes. The online prognosis model comprises a combination of finite element analysis and data‐driven regression to predict the crack propagation under constant loading, while the offline model is trained using experimental data to inform the post‐overload crack growth retardation behavior to the online model. The developed methodology is vali- dated by conducting biaxial fatigue experiments using aluminum AA7075‐ T651 alloy cruciform specimens. A close correlation is observed between the experimental results and model predictions. The results show that the model successfully predicts the crack retardation behavior under the influence of overloads with different magnitudes occurring at different stages of fatigue crack growth. Error analysis is conducted to investigate the sensitivities of the number of training points and crack increments to the prediction accuracy. In addition, the error propagation with respect to the crack length is studied, which provides constructive suggestions for further model improvement. KEYWORDS biaxial fatigue, crack propagation, Gaussian process machine learning, online‐offline model, overload, prognosis Nomenclature: a c , Crack length at current stage; a f , Crack length at future stage; a N , Crack length at N th loading cycle; AR f , Accuracy ratio when crack length is a f ; C 1 & C 2 , Coefficients of prognosis model; _ da dN a , Acceleration ratio of crack growth rate from da dN min back to recovery; da dN c , Crack growth rate at current stage; _ da dN d , Deceleration ratio of crack growth rate from overload to da dN min ; da dN d q , Crack growth rate at retardation region; da dN f , Crack growth rate at future stage; da dN min , Minimum crack growth rate where crack reaches in retardation due overload; da dN N , Crack growth rate at N th loading cycle; e MAPE , Mean absolute percentage error; k, Kernel function; K i , Covariance of training samples; K p , Covariance of testing samples; K ip , Covariance between training and testing samples; M S , Material parameter; N c , Number of fatigue cycle at current stage; N f , Predicted number of fatigue cycle at future stage; N gt , Ground truth of N f ; N NOL , Fatigue cycle when next overload happens; N OL , Fatigue cycle when current overload happens; R, Stress ratio; S, External load; X, Online training data matrix comprising of input and output parameters; Y, Offline training data matrix comprising of input and output parameters; Z, Normalization constant of posterior distribution; Δa, Crack increment in online‐offline framework; ΔK, Stress intensity factor range; ΔK f , Stress intensity factor range vector of future stage; ΔK p , Stress intensity factor range vector of testing set; (ΔK OL ) p , Stress intensity factor range vector of testing set at instant of overload; λ, Overload ratio; θ, Hyperparameter vector that belongs to the kernel function; μ 1 & μ 2 , Mean vectors of input and output posterior distribution, respectively; σ 2 1 & σ 2 2 , Variance vectors of input and output posterior distribution, respectively; Φ i , Offline output parameters of training set; Φ p , Offline output parameters of testing set Received: 19 October 2018 Revised: 13 December 2018 Accepted: 15 January 2019 DOI: 10.1111/ffe.12983 Fatigue Fract Eng Mater Struct. 2019;42:1175–1190. © 2019 Wiley Publishing Ltd. wileyonlinelibrary.com/journal/ffe 1175
Transcript of An online-offline prognosis model for fatigue life ...

Received: 19 October 2018 Revised: 13 December 2018 Accepted: 15 January 2019
OR I G I NAL CONTR I BUT I ON
DOI: 10.1111/ffe.12983
An online‐offline prognosis model for fatigue life predictionunder biaxial cyclic loading with overloads
Guoyi Li1 | Siddhant Datta1 | Aditi Chattopadhyay1 | Nagaraja Iyyer2 | Nam Phan3
1Arizona State University, Tempe, AZ85287, USA2Technical Data Analysis Inc., FallsChurch, VA 22042, USA3US Naval Air Systems Command,Patuxent River, MD 20670, USA
CorrespondenceGuoyi Li, Arizona State University,Tempe, AZ 85287, USA.Email: [email protected]
Funding informationTechnical Data Analysis Inc., Grant/Award Number: N68335‐16‐G‐0009, DO0001; US Navy Naval Air SystemsCommand
Nomenclature: ac, Crack length at current s
crack length is a f ; C1 & C2, Coefficients of p
Crack growth rate at current stage;_da
dN
� �d
,
retardation region; dadN
� �f , Crack growth rate a
dadN
� �N , Crack growth rate at Nth loading cycl
Covariance of testing samples; Kip, Covariancurrent stage; N f , Predicted number of fatigNOL, Fatigue cycle when current overload happarameters; Y, Offline training data matrix cCrack increment in online‐offline frameworkStress intensity factor range vector of testing
θ, Hyperparameter vector that belongs to the
σ22, Variance vectors of input and output pparameters of testing set
Fatigue Fract Eng Mater Struct. 2019;42:1175–1190.
Abstract
This paper presents a robust online‐offline model for the prediction of crack
propagation under complex in‐phase biaxial fatigue loading in the presence
of overloads of different magnitudes. The online prognosis model comprises a
combination of finite element analysis and data‐driven regression to predict
the crack propagation under constant loading, while the offline model is
trained using experimental data to inform the post‐overload crack growth
retardation behavior to the online model. The developed methodology is vali-
dated by conducting biaxial fatigue experiments using aluminum AA7075‐
T651 alloy cruciform specimens. A close correlation is observed between the
experimental results and model predictions. The results show that the model
successfully predicts the crack retardation behavior under the influence of
overloads with different magnitudes occurring at different stages of fatigue
crack growth. Error analysis is conducted to investigate the sensitivities of
the number of training points and crack increments to the prediction accuracy.
In addition, the error propagation with respect to the crack length is studied,
which provides constructive suggestions for further model improvement.
KEYWORDS
biaxial fatigue, crack propagation, Gaussian process machine learning, online‐offline model,
overload, prognosis
tage; a f , Crack length at future stage; aN, Crack length at Nth loading cycle; AR f , Accuracy ratio when
rognosis model;_da
dN
� �a, Acceleration ratio of crack growth rate from da
dN
� �min back to recovery; da
dN
� �c,
Deceleration ratio of crack growth rate from overload to dadN
� �min;
dadN
� �d
� �q, Crack growth rate at
t future stage; dadN
� �min, Minimum crack growth rate where crack reaches in retardation due overload;
e; eMAPE, Mean absolute percentage error; k, Kernel function; Ki, Covariance of training samples; Kp,
ce between training and testing samples; MS, Material parameter; Nc, Number of fatigue cycle atue cycle at future stage; Ngt, Ground truth of N f ; NNOL, Fatigue cycle when next overload happens;pens; R, Stress ratio; S, External load; X, Online training data matrix comprising of input and outputomprising of input and output parameters; Z, Normalization constant of posterior distribution; Δa,; ΔK, Stress intensity factor range; ΔK f , Stress intensity factor range vector of future stage; ΔKp,set; (ΔKOL)p, Stress intensity factor range vector of testing set at instant of overload; λ, Overload ratio;
kernel function; μ1 & μ2, Mean vectors of input and output posterior distribution, respectively; σ21 &
osterior distribution, respectively; Φi, Offline output parameters of training set; Φp, Offline output
© 2019 Wiley Publishing Ltd.wileyonlinelibrary.com/journal/ffe 1175

1176 LI ET AL.
1 | INTRODUCTION
Metallic materials and structures used in mechanical andaerospace applications are subject to complex uniaxialand multiaxial fatigue loading conditions during theirservice lives.1 Understanding the crack growth behaviorunder such complex loading is essential for estimatingtheir useful life and enhancing their operational reliabil-ity.2 The variant induced by load(s), such as single andperiodic overload and underload, challenges traditionalmethodologies in characterizing crack growth mecha-nisms.3-5 Hence, a robust model that can accuratelypredict crack growth rate and fatigue life under complexloading conditions would be highly beneficial for a widerange of structural applications.
To date, there are many experimental and modelingstudies devoted to fatigue behavior characterization ofmetallic materials, with the majority focused on uniaxialand constant loading cases.6,7 In recent years, under-standing and characterizing the crack nucleation andpropagation under complex fatigue loading conditionshave also seen increased interest. For example, Colinand Fatemi8 conducted a study to investigate the fatiguebehaviors of stainless steel 304L and aluminumAA7075‐T6 under step, periodic, and random loadings,which showed that the fatigue life of aluminumAA7075‐T6 was affected by overload direction. Theyfound that the tensile overloads resulted in a longerfatigue life, while the compressive overload led to shorterfatigue life. The focus of this study, among many others,was primarily to address issues associated with complexuniaxial loading conditions. A deeper understanding ofthe behavior of complex structure under biaxial loadingconditions with overload, however, remains largelyunexplored.
Some early studies9-11 have shown that the fatiguecrack growth rate in the in‐plane direction is dependenton the biaxial stress state near the crack tip(s). Recently,the crack growth mechanism of aluminum AA5083‐H11612 was examined under an in‐plane biaxial tension‐tension fatigue under ambient laboratory and saltwaterenvironments. This research showed that the biaxialloading and the saltwater environment significantlyaccelerated the crack growth rates in the cruciform spec-imens. Datta et al13,14 and Neerukatti et al15 studied theeffect of a single overload on the crack propagation underbiaxial loading conditions. The results showed aretardation of crack growth after the overload, and theretardation characteristics exhibited direct dependenceon overload ratio and the instantaneous crack lengthat the occurrence of overload. Although the aforemen-tioned research provided significant insights into themicromechanisms of crack propagation under complex
biaxial loading, the accurate prediction of crack propaga-tion in the presence of various overloads and underloadsis still an unresolved and challenging issue.
In another study, the fatigue behaviors of aluminumAA7075‐T651 was modeled. A mean stress correction‐based method was developed for predicting the crackpropagation and fatigue life under a very high cyclevariable amplitude loading.16 In addition to the meanstress‐dependent approach, a time‐based subcycle formu-lation was developed for predicting fatigue crack growthand crack tip opening displacement under randomvariable loadings.17 The formulation was then validatedwith existing data in the literature and showed impressivecapabilities for predicting crack propagation underconstant amplitude load with repeated spike overload,spike overload‐underload, and continuous overload‐underload. An analytical approach18,19 was alsodeveloped for predicting the fatigue crack growth undervariable amplitude loading conditions; however, thismodel is limited to simple geometries.
A micromechanical model has been developed toaddress the crack initiation under low cycle variableamplitude loading condition for nontraditional geome-tries.20 However, the current range of available fatiguelife prediction models lack capabilities for predictingdamage under complex high cycle loading conditions.One approach to counter this limitation is through useof a recently developed hybrid prognosis algorithm,which is based on a combination of physics‐based anddata‐driven models to predict crack growth under com-plex biaxial loading conditions.21 This hybrid model wasable to overcome the challenges associated with modelingcomplex geometries by using physics‐based methodolo-gies and the need for large set of training data in data‐driven models. In this study, the authors explored therelationship between stress intensity factor (SIF) andcrack growth rate for the prediction of crack propagation.The developed model was validated through experimentsunder a variety of uniaxial fatigue loadings, includingconstant amplitude loading, constant amplitude loadingwith overloads, and random loads. The obtained resultsshowed high accuracy with limited training data. Themodel was later extended to crack prediction under biax-ial loading22; to address the combination of mode I and IImechanisms near the crack tip under biaxial loading, theenergy release rate was used, instead of SIF to explicitlyconsider these two fracture modes. However, the energyrelease rate of the cruciform used for biaxial testing couldnot be calculated analytically due to the complex geome-try. Therefore, a regression model based on Gaussian pro-cess machine learning was developed to explore thenonlinear relationship between energy release rate andthe different crack tip locations in the cruciform.23 This
LI ET AL. 1177
framework was validated through biaxial experiments onaluminum AA7075‐T651 aluminum alloy under variousloading conditions.
In this paper, the previously mentioned hybrid meth-odology is further extended as an online‐offline prognosisframework for predicting nonlinear crack propagation inaluminum AA7075‐T651 cruciform specimens underbiaxial loading conditions in the presence of overload.The online model is trained by training points from areal‐time test for crack propagation prediction, while theoffline model is trained by existing experimental dataand will provide the physics‐based parameters to theonline model in the proposed research. The influence ofa single overload on the crack propagation behavior isstudied taking into consideration different magnitudesand occurrences at different stages of fatigue crackgrowths, approximately 3 to 10 mm in this study. Thecrack propagation under constant biaxial loading is pre-dicted using the originally developed prognosis model.Three additional physics‐based parameters—minimumcrack growth rate, crack growth retardation rate, andcrack growth acceleration rate—are introduced toaddress the nonlinearity in crack growth due to the pres-ence of overload, in particular, crack retardation due tooverload. These parameters govern crack retardationbehavior and are obtained through biaxial tension‐tension experiments under overloads with differentoverload ratios, and the relationships between theseparameters and the SIF range under overloads aremodeled using the Gaussian process as an offline model.The developed framework is validated through biaxialexperiments conducted with single overloads of differentoverload ratios, including the situation of two overloadsin a single test. The predicted crack propagation behav-iors showed good agreement with the experiments.
The remainder of this paper is organized as follows. Adetailed formulation of the proposed online‐offline modelis presented in Section 2. This is followed by a descriptionof the experimental procedure (including cruciformspecimen design and test procedure) and the results inSection 3. The results from the prognosis model on crackpropagation under biaxial loading with overloadsincluding a comprehensive error analysis are presentedin Section 4. Key observations from this work are summa-rized in the concluding remarks section.
2 | ONLINE ‐OFFLINE PROGNOSISMODEL
This section presents the development of the prognosisformulations for predicting crack length with respect toloading cycle. A limited number of training points
comprising crack length with respect to loading cycledata in early stage‐II crack propagation region are used.The online‐offline model described here is expected topredict crack growth retardation after the overloads basedon the information including the instant of overloads andoverload ratios. A previously developed hybrid prognosismodel22 is modified here as an online model forpredicting crack growth in real time. However, this modelhas also shown an obvious underprediction of cracklength at a certain fatigue cycle under uniaxial loadingwith overloads; such an inaccuracy can increase the risksof structural failure risk (type‐II error).21 To handle theretardation effects due to overloads, therefore, additionalknowledge is necessary to inform this online model forimproved prediction. Based on this, an offline prognosismodel can be developed as well as integrated into theonline model, as shown in Figure 1. In a real experiment,the online model is able to predict crack growth underthe in‐phase constant biaxial loading, ie, at the instantof an overload, the developed offline model simulatesthe crack growth behavior using the three physics‐basedvariables, which are trained using experimental data.Once the effect of overload on crack growth behaviordiminishes, the online model is then used to predict thecrack growth. The detailed formulations are included inthe next two subsections.
2.1 | Online model
The online model was originally derived by the authors'group (Neerukatti et al21,22) and is briefly explained herefor the sake of completeness. In the following formula-tions, the log sign represents the natural logarithm. Thecrack growth rate da
dN
� �N , at N
th loading cycle with a crack
length aN, is written as
logdadN
� �N
¼ C1 aN ;Ms; SN;Nþ1;N� �
þ C2 aN ;Ms; SN;Nþ1;N� �
log ΔKNð Þ (1)
where MS is a material parameter, S is the load, and ΔK,which can be expressed as ΔK = Kmax – Kmin, is the SIFrange. In this study, as shown later in Section 3, the in‐phase proportional cyclic loading results in a 45° crackpropagation direction under a pure mode‐I stress‐state;as such, the ΔK specifically represents the mode I SIFrange. However, due to the complex nature of fatiguecrack growth after an overload, as reported in previousstudies,13,15 the uncertainty of the inference from log(ΔK)
to logdadN
� �has to be considered; note that the uncer-
tainties from the coefficients C1 and C2 that are included

FIGURE 1 A demonstration of the
developed online‐offline prognosis model
[Colour figure can be viewed at
wileyonlinelibrary.com]
1178 LI ET AL.
in Equation 1. In order to investigate the effects of traininginformation on prediction uncertainties in crack propaga-tion at a relatively large crack length, especially after over-loads, this prognosis model is formulated as a Gaussianprocess learning model based on a Bayesian inferencestrategy developed by Rasmussen and Williams.23 Theposterior distribution is expressed as follows:
f logdadN
� �p
jX ;ΔKp; k; θ
!
¼ 1Zexp −
log dadN
� �p−μ1
� �22σ21
0B@
1CA (2)
where k is the kernel function (also known as covariance
function), X = {logΔKi, log dadN
� �i
� �} is the training matrix
comprising the input parameter ΔK and the output
parameterdadN
, ΔKp is the input of the testing set, Z is a
normalization constant, and θ is the hyperparameter vec-tor that belongs to the kernel function. For simplification,in the rest of this paper, Ki denotes the covariance of thetraining samples k(log(ΔKi), log(ΔKj)), Kp denotes thecovariance of testing samples k(log(ΔKp), log(ΔKp)), andKip denotes the covariance between training and testingsamples k(log(ΔKp), log(ΔKi)). Therefore, the meanμ1and variance of the distribution σ21 are obtained as
μ1 ¼ KipK−1i log ΔKp
� �(3a)
and
σ21 ¼ Kp − KipK−1i KT
ip (3b)
where subscripts i, j = 1, 2, …, (n − 1) denote the trainingpoints, and the subscript p = n, (n + 1), …, m representsthe prediction points. As indicated by Rasmussen andWilliams, the accuracy of the prediction depends on thechoice of the kernel functions and their hyperparameters.

LI ET AL. 1179
The squared exponential (SE) kernel function, which isone of the most widely accepted kernels, showed robust-ness in modeling a nonlinear smooth surface with a highprediction accuracy21,22 and is used in this work. The SEkernel can be expressed as
k xi; xj� � ¼ θ21 exp
xi−xj� �2
θ22
!(4)
where the hyperparameter vector can be defined asθ = [θ1 θ2]. The θ can be tuned using known maximum aposteriori (MAP) estimation through the negativelogarithmic marginal likelihood function, which can beexpressed as
−12KT
ipK−1i Kip −
12log∣Ki∣−
m − nþ 12
log2π: (5)
Using the optimal hyperparameter vector, the crackgrowth rate can be found through the inference with aknown ΔK. It should be noted that the inference in thismodel is in a logarithmic scale, unlike the formulationsin the originally developed method. The primaryreason is that a large magnitude difference between ΔK
anddadN
results in a relatively large prediction error,
especially after the occurrence of overload. Consequently,prediction in logarithmic scale, which reduces the magni-tude difference, can improve the accuracy.
A second Gaussian process regression model is usedfor predicting the SIF range under in‐phase loading inorder to obtain the value of ΔK at a specific crack length;detailed information can be found in Neerukatti et al.22
In this research, the Gaussian process model is used tofind the ΔK corresponding to fracture mode I instead ofthe energy release rate. By implementing this model,the ΔK f can be found through the crack length a f , whichis larger than the current crack length ac at fatigue cycleNc. Therefore, da
dN
� �f can be computed using Equation 1,
and the fatigue cycle N f corresponding to a f can beexpressed as
Nf ¼ Nc þ ΔadadN
� �f
(6)
where Δa = a f − ac, which represents the assumed crackincrement.
FIGURE 2 Schematic of the three defined variables that govern
the crack propagation after overload
2.2 | Offline model
The offline model is developed for predicting the crackgrowth after the instant of overload. Based on the exper-imental observations,13 it is hypothesized that the crack
growth rate experiences a retardation after a single over-load and gradually recovers to the steady‐state crackgrowth rate in the absence of an overload. To statisticallymodel this behavior, three variables are introduced basedon this hypothesis: minimum crack growth rate, crackgrowth retardation rate, and crack growth accelerationrate in logarithmic scale. As shown in Figure 2, the min-imum crack growth rate, da
dN
� �min, represents the mini-
mum growth rate in the crack retardation process afterthe instant of an overload; the crack growth retardation
rate,_da
dN
� �d
, is the deceleration ratio of the crack growth
rate from the instant of an overload to the dadN
� �min; and
the crack growth acceleration rate,_da
dN
� �a
, denotes the
acceleration ratio of crack growth rate from dadN
� �min back
to the steady‐state crack growth rate, which is defined asthe instant of recovery.
In order to avoid an unwieldy formulation, thesevariables are expressed in vector form as,
Φ ¼ logdadN
� �min
; log_da
dN
� �d
; log_da
dN
� �a
( ): (7)
As in the online model, Φi denotes the vector of trainingset and Φp represents the output vector of the testing set.The Gaussian process model is used to model thebehaviors of crack growth in the overload region and isexpressed as follows:
f ΦpjY ; ΔKOLð Þp; k; θ� �
¼ 1W
exp −Φp−μ2� �2
2σ22
!(8)
where Y = {(ΔKOL)i, Φi} is the training matrix comprisingthe input parameter (ΔKOL)i and the output parameter Φi,(ΔKOL)p is the input of the testing set, W is a

1180 LI ET AL.
normalization constant, and each row of θ is thehyperparameter corresponding to a specific output vari-able in Φ. Because the SE kernel k is also utilized in thismodel due to its aforementioned capability, θ can beexpressed as
θ ¼θ1 θ2½ �min
θ1 θ2½ �dθ1 θ2½ �a
264
375 (9)
where [θ1 θ2]min, [θ1 θ2]d, and [θ1 θ2]a, which areobtained using a MAP estimation described in Equation 5,are the hyperparameters corresponding to log da
dN
� �min,
log_da
dN
� �d
, and log_da
dN
� �a
, respectively. It is worth men-
tioning that the input of this model is defined as the SIFrange at the instant of overload, ΔKOL, because thebehavior of the crack growth highly depends on the over-load ratio. The hypothesis made here is that these threevariables are governed by the SIF range at the instant ofoverload, ΔKOL, which can also be found through theaforementioned model.22 Statistically speaking, thechoice of ΔKOL fuses the information of ΔK with theoverload ratio, further correlating the behavior of crackgrowth with the overload ratio in addition to ΔK. There-fore, for the qth crack incrementΔa, whereΔa= aq− aq − 1,
the crack growth rate dadN
� �d
� �qat the retardation region
can be expressed as
dadN
� �d
� �q
¼ exp logdadN
� �d
� �0
þ logΔKOLð ÞqΔKOLð Þq−1
!log
_dadN
� �d
! !
(10)
where dadN
� �d
� �0is the crack growth rate at the instant of
the overload. Equation 10 governs the crack growthuntil the crack growth rate reaches the minimumvalue obtained through the developed model, ie,
dadN
� �d
� �q≤ da
dN
� �min. Following this, the crack will experi-
ence crack growth rate acceleration, and the crack growth
rate dadN
� �a
� �qcan be expressed as follows:
dadN
� �a
� �q
¼ exp logdadN
� �min
� �þ log
ΔKOLð ÞqΔKOLð Þq−1
!log
_dadN
� �a
! !:
(11)
The crack growth rate will accelerate till the steady‐state crack growth rate in the absence of an overload is
reached, ie, dadN
� �a
� �q≥ da
dN
� �q.
By merging the developed online and offline modelsfor crack propagation under in‐phase biaxial loading with
a single overload at a known fatigue cycle NOL, thefatigue life cycle N f can be obtained as follows:
Nf ¼ Nc þ ΔadadN
� �f
; if Nc ≤ NOL (12a)
Nf ¼ Nc
þ ΔadadN
� �d
; if Nc ≥ NOL&dadN
� �d
� �f
≥dadN
� �min
(12b)
Nf ¼ Nc þ ΔadadN
� �a
; if Nc ≥ NOL&dadN
� �d
� �f
≤dadN
� �a
� �f
≤dadN
� �f
(12c)
Nf ¼ Nc
þ ΔadadN
� �f
; if NOL ≤ Nc ≤ NNOL&dadN
� �a
� �f
≥dadN
� �f
(12d)
where Δa, ac, and a f are the crack increment, the currentcrack length, and the predicted crack length, respectively.NNOL denotes the instant of next overload, if there is. Itshould be noted that the Equation 12a to 12d representthe assumptions made in the developed model: (1) theoverload leads to a crack growth retardation, but it hasnegligible impact on the crack propagation after theinstant of recovery; (2) in the event of multiple overloads,the time between two overloads is long enough so thatthe effect of the first overload on the second overloadcan be ignored.
For comparing the prediction error with differentcrack increments Δa and training set, the widelyused error measurement model, ie, mean absolutepercentage error (MAPE),24 is implemented, which canbe expressed as
eMAPE ¼ 1M
∑M
j¼1
Ngt� �
j − Nf� �
j
Ngt� �
j
���������� (13)
where M is the total number of predicted points in a sin-gle test, ie, M = m − n + 1, and Ngt is the ground truththat comes from an actual experiment. However, as men-tioned by Tofallis,25 this method is no longer feasible forthe investigation of error propagation with respect tothe crack length in a single test due to its biased charac-teristics. Therefore, logarithmic accuracy ratio (AR)25,26
is implemented for the analysis of error propagationwithin a single test, and the formulation is expressed as
LI ET AL. 1181
ARf ¼ logNf
Ngt� �
f
!(14)
where AR f is the logarithmic AR when crack length is a f
while the predicted fatigue cycle is (Ngt) f . Because thepredicted data are strictly positive, this method is wellsuited in the current study; it provides quantitativeinformation of error propagation with respect to cracklength, as well as a distinguishable visualization of bothunderprediction and overprediction.
3 | BIAXIAL FATIGUEEXPERIMENT
The crack propagation behavior of aluminum AA7075‐T651 was investigated in this research as a validation ofthe developed prognosis model; biaxial tension‐tensionfatigue tests were conducted under in‐phase loading withsingle overloads with biaxiality ratio of 1.0. An MTSbiaxial/torsion load frame with a capacity of 100‐kN pla-nar bi‐axial and 1100 N‐m torsion, equipped with sixindependent controllers, was used for the fatigue testing.Fatigue tests were conducted with stress‐control loadspectra having single overloads interspersed in an other-wise constant amplitude baseline fatigue loading. Toanalyze the effect of different overload magnitudes oncrack growth behavior, tests were conducted with over-load ratios λ of 1.75, 2, and 2.25. The overload ratio wasdefined as the ratio of maximum load at the instant ofoverload to the maximum load of the constant amplitudecycles. Biaxial fatigue load spectra with a frequency of10 Hz were generated with single overload excursions
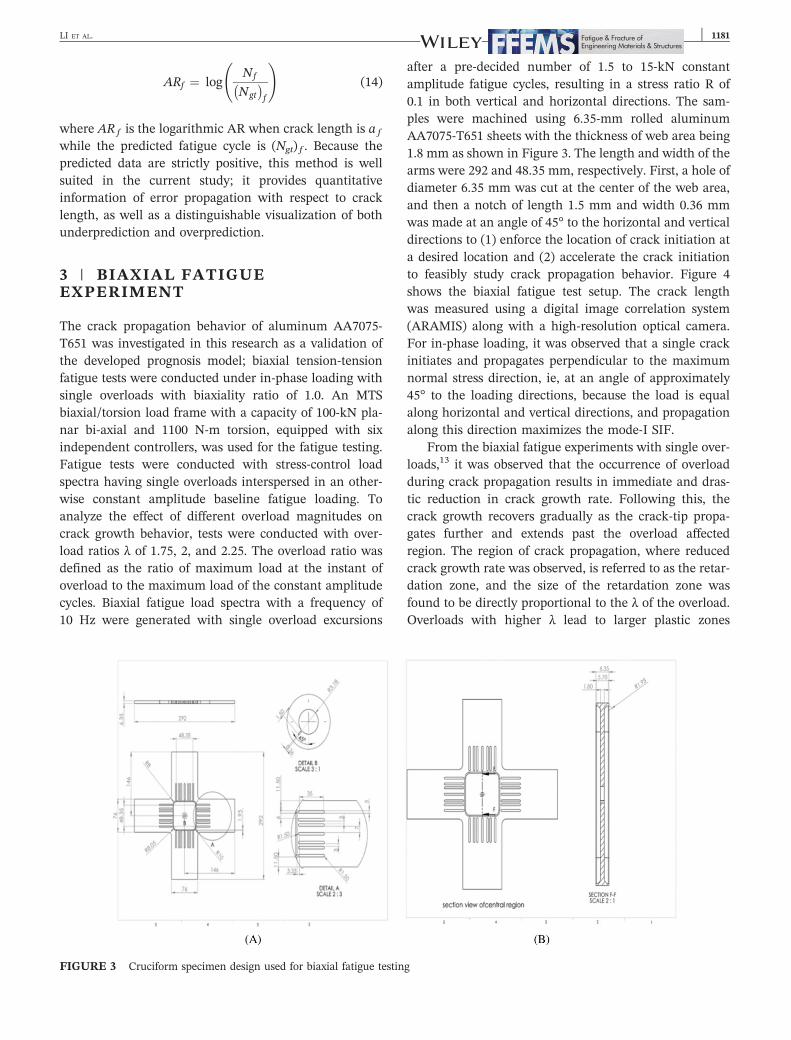
FIGURE 3 Cruciform specimen design used for biaxial fatigue testin
after a pre‐decided number of 1.5 to 15‐kN constantamplitude fatigue cycles, resulting in a stress ratio R of0.1 in both vertical and horizontal directions. The sam-ples were machined using 6.35‐mm rolled aluminumAA7075‐T651 sheets with the thickness of web area being1.8 mm as shown in Figure 3. The length and width of thearms were 292 and 48.35 mm, respectively. First, a hole ofdiameter 6.35 mm was cut at the center of the web area,and then a notch of length 1.5 mm and width 0.36 mmwas made at an angle of 45° to the horizontal and verticaldirections to (1) enforce the location of crack initiation ata desired location and (2) accelerate the crack initiationto feasibly study crack propagation behavior. Figure 4shows the biaxial fatigue test setup. The crack lengthwas measured using a digital image correlation system(ARAMIS) along with a high‐resolution optical camera.For in‐phase loading, it was observed that a single crackinitiates and propagates perpendicular to the maximumnormal stress direction, ie, at an angle of approximately45° to the loading directions, because the load is equalalong horizontal and vertical directions, and propagationalong this direction maximizes the mode‐I SIF.
From the biaxial fatigue experiments with single over-loads,13 it was observed that the occurrence of overloadduring crack propagation results in immediate and dras-tic reduction in crack growth rate. Following this, thecrack growth recovers gradually as the crack‐tip propa-gates further and extends past the overload affectedregion. The region of crack propagation, where reducedcrack growth rate was observed, is referred to as the retar-dation zone, and the size of the retardation zone wasfound to be directly proportional to the λ of the overload.Overloads with higher λ lead to larger plastic zones
g
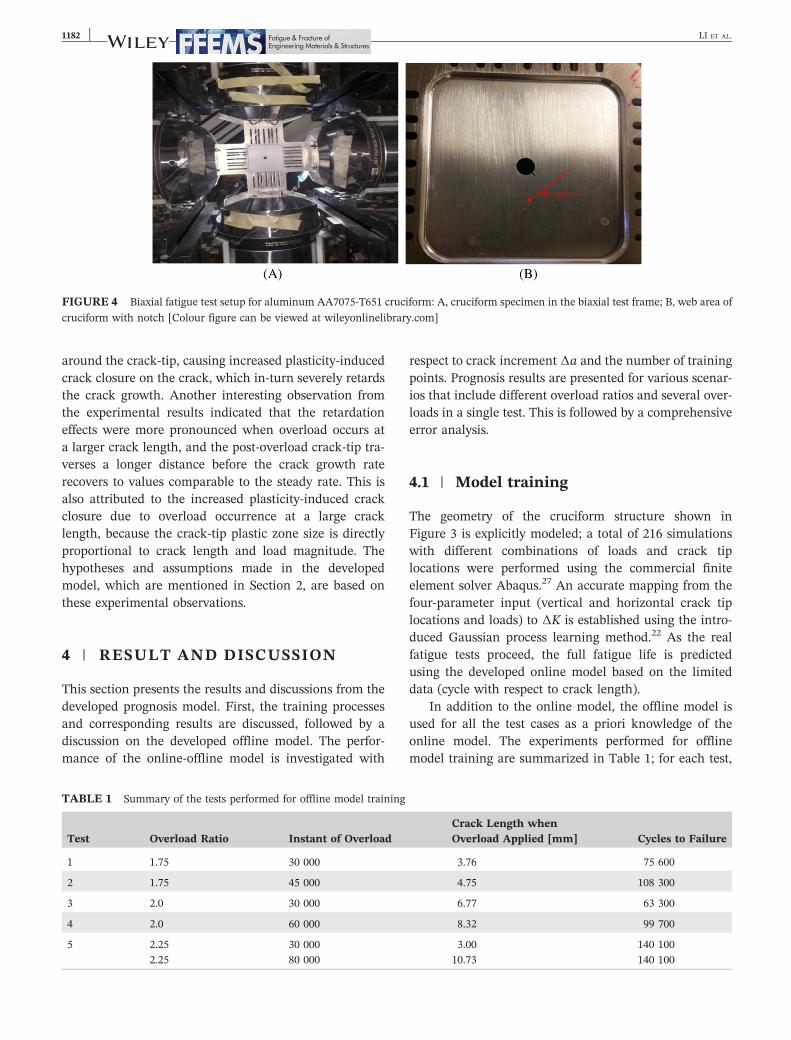
FIGURE 4 Biaxial fatigue test setup for aluminum AA7075‐T651 cruciform: A, cruciform specimen in the biaxial test frame; B, web area of
cruciform with notch [Colour figure can be viewed at wileyonlinelibrary.com]
1182 LI ET AL.
around the crack‐tip, causing increased plasticity‐inducedcrack closure on the crack, which in‐turn severely retardsthe crack growth. Another interesting observation fromthe experimental results indicated that the retardationeffects were more pronounced when overload occurs ata larger crack length, and the post‐overload crack‐tip tra-verses a longer distance before the crack growth raterecovers to values comparable to the steady rate. This isalso attributed to the increased plasticity‐induced crackclosure due to overload occurrence at a large cracklength, because the crack‐tip plastic zone size is directlyproportional to crack length and load magnitude. Thehypotheses and assumptions made in the developedmodel, which are mentioned in Section 2, are based onthese experimental observations.
4 | RESULT AND DISCUSSION
This section presents the results and discussions from thedeveloped prognosis model. First, the training processesand corresponding results are discussed, followed by adiscussion on the developed offline model. The perfor-mance of the online‐offline model is investigated with
TABLE 1 Summary of the tests performed for offline model training
Test Overload Ratio Instant of Overload
1 1.75 30 000
2 1.75 45 000
3 2.0 30 000
4 2.0 60 000
5 2.25 30 0002.25 80 000
respect to crack increment Δa and the number of trainingpoints. Prognosis results are presented for various scenar-ios that include different overload ratios and several over-loads in a single test. This is followed by a comprehensiveerror analysis.
4.1 | Model training
The geometry of the cruciform structure shown inFigure 3 is explicitly modeled; a total of 216 simulationswith different combinations of loads and crack tiplocations were performed using the commercial finiteelement solver Abaqus.27 An accurate mapping from thefour‐parameter input (vertical and horizontal crack tiplocations and loads) to ΔK is established using the intro-duced Gaussian process learning method.22 As the realfatigue tests proceed, the full fatigue life is predictedusing the developed online model based on the limiteddata (cycle with respect to crack length).
In addition to the online model, the offline model isused for all the test cases as a priori knowledge of theonline model. The experiments performed for offlinemodel training are summarized in Table 1; for each test,
Crack Length whenOverload Applied [mm] Cycles to Failure
3.76 75 600
4.75 108 300
6.77 63 300
8.32 99 700
3.00 140 10010.73 140 100

LI ET AL. 1183
the minimum crack growth rate dadN
� �min, crack growth
retardation rate_da
dN
� �d
, and crack growth acceleration
rate_da
dN
� �a
are calculated, and the corresponding ΔKOL
is obtained using the locations of crack tip and the loads,forming the training set Y. Consequently, for any newcrack length, the corresponding vector Φp can beobtained through Equation 8 using the testing set(ΔKOL)p. The crack growth behavior is then predictedusing Equations 10 and 11.
Figure 5A‐C presents the results of the minimumcrack growth rate da
dN
� �min, crack growth rate deceleration,
and acceleration, respectively, with their 95% confidenceintervals. In these figures, the range of prediction is largerthan the training set for better visualization of the nonlin-ear behavior. In addition, the logarithmic scale andfeature normalization is used because the accuracy andlearning speed of MAP estimation are improved by scal-ing the input Φ and output ΔKOL into a domain whereall features have similar scale.28 As shown in Figure 5,
the values of dadN
� �min,
_dadN
� �d
, and_da
dN
� �a
reduce with
increase in ΔKOL. As seen from these figures, the uncer-tainty associated with the offline model is small in theregion near the training data, and the prediction confi-dence reduces when testing points are far from the train-ing points. It should be noted that the tests mentioned in
FIGURE 5 Offline model of normalized
logarithmic: A, minimum crack growth
rate; B, deceleration; and C, acceleration
of crack growth after an overload [Colour
figure can be viewed at wileyonlinelibrary.
com]
this subsection are used for training only; the evaluationand validation of the developed model are conductedusing completely different tests and are presented next.
4.2 | Model evaluation
The developed model contains two parameters, the num-ber of training points and crack increment Δa, that werenot included in the optimization scheme and must beinvestigated. Before model evaluation, it is necessary tomention the definitions of underprediction and overpre-diction in this study. When the model predicts a largernumber of cycles than the actual number of cycles at acertain crack length, it is regarded as an overprediction;in this case, the crack length from the model is shorterthan the actual crack length, which is equivalent to anunderprediction of crack length. The model undergoesan underprediction if it predicts a smaller number ofcycles than the actual number of cycles at a certain cracklength; in this case, the crack length from the model islarger than the actual crack length, which is equivalentto an overprediction of crack length. It is slightly differentfrom the general definitions, because the developedmodel mathematically predicts the increment of fatiguecycles with a certain crack increment as mentionedbefore. In this section, with the hypothesis that the effectsof Δa and number of training points on the predictionaccuracy are independent, the prognosis results of a test

1184 LI ET AL.
with the instant of overload at cycle of 25 000 (overloadratio equals to 1.75) are discussed in this subsection toshow the sensitivities of these two parameters whileserving as one of the validation tests. It should be noticedthat this hypothesis will be investigated and furtherproved in this section.
4.2.1 | Convergence with respect to thenumber of training points
The sensitivity of the prediction with respect to thenumber of training points is essential to the developedprognosis model, and it is evaluated in this subsection.Maintaining the crack increment Δa to be 0.01, Figures 6and 7 show the prediction of the crack growth rate andthe fatigue cycle, respectively, using different number oftraining points. It is seen that the predicted crack propa-gation behavior is very similar to the actual experimentsstarting with three training examples. It indicates thatthe Gaussian process learning model cannot model the
behaviors of logdadN
� �with respect to log(ΔK) with only
two or less training points in the current study. Conse-quently, the inaccuracy in predicting behavior of
logdadN
� �with respect to log(ΔK) before the overload
using two training examples results in a large offset whenpredicting the later overload region, as shown in Figure 7A, due to the coupled governing equations of the constant
and overload regions, shown in Equation 12. When theconfidence intervals obtained from the model trained bydifferent number of training points are compared, a 95%confidence interval becomes narrow with respect to theincreased training set size, indicating more confidencein the prediction that has more training examples.
The MAPE of the prediction with respect to the num-ber of training points is shown in Figure 8. It can be seenthat the MAPE decreases rapidly and then converges to acertain value, 0.05 (5%) in this case. At this point, twoclarifications need to be mentioned: First, the numberof observations in this case is up to eight only. The reasonis that the maximum number of training points is notguaranteed due to the crack initiation after differentnumbers of cycles in different tests, and the overload isapplied at the ninth experimental data point in this test.However, the robustness of the developed online‐offlinemodel cannot be convincingly demonstrated, if the over-
load information ( dadN
� �min,
_dadN
� �d
, and_da
dN
� �a
) of the
current experiment is provided to the developed model.Based on this consideration, the purpose of studyingand showing the convergence of the prediction error withrespect to the number of training points is to demonstratethat the developed model can predict the crack propaga-tion accurately using very limited amount of traininginformation. For a realistic application, if the overloadregion is already known, the crack propagation can bepredicted just using the online model. Second, variationsof MAPE can be seen when the model is trained by three
FIGURE 6 Predictions of the crack
growth rate with respect to SIF range
using A, 2; B, 3; C, 4; and D, 5 training
examples [Colour figure can be viewed at
wileyonlinelibrary.com]

FIGURE 7 Predictions of the crack
propagation with an overload at the cycle
of 25 000 using A, 2; B, 3; C, 4; and D, 5
training examples [Colour figure can be
viewed at wileyonlinelibrary.com]
FIGURE 8 MAPE of the prediction with respect to the number
of training points
LI ET AL. 1185
or more data points. The reasons, which result in theunavoidable prediction variation, are as follows: (1) thedeveloped model predicts the number of fatigue cyclesusing a certain crack increment, and the scale of thefatigue cycle is significantly larger than the crack length,resulting in high sensitivity to the variations of crackgrowth rate; (2) due to the data‐driven nature, the accu-racy of developed model depends on the experimentalobservations that contain uncertainties, which results ina slight increase of MAPE when number of trainingsamples is above five in this particular case.
4.2.2 | Convergence with respect to crackincrement Δa
The sensitivity of the developed model to the crack incre-ment Δa is investigated using the same test as discussedin the previous subsection; in this study, the number oftraining points are set to be five, as it can provide areliable crack propagation behavior. The value of Δa isvaried from 0.001 to 1 mm; the MAPEs of all the casesare computed.
Figures 9 and 10 show the prediction of the crackgrowth rate and the fatigue cycle, respectively, using dif-ferent values of Δa. It is seen that the model slightlyoverpredicts the crack propagation behavior when thevalue of Δa is 0.1. When Δa equals to 0.01 or 0.001, themodel can predict the crack growth with high accuracy.From Figure 9A to D, it can be observed that the valueof Δa has a huge impact on the prediction accuracy ofthe crack growth behavior at the overload region. Theinterpretation is that a large Δa might result in a largefatigue cycle increment right before the overload and leadto a large overprediction as shown in Figure 10A,B.Comparing Figure 10C,D, it is seen that the predictionwill be almost identical. In addition, the size of confi-dence interval decreases with the decrease of Δa.
Next, the correlation between number of trainingpoints and Δa is investigated as shown in Figure 11. Itcan be seen that the prediction accuracy is large whenΔa equals to 0.5, irrespective of the number of experi-mental points used to train the model. However, when

FIGURE 9 Predictions of the crack
growth rate when the value of Δa equals
to A, 0.5; B, 0.1; C, 0.01; and D, 0.001
[Colour figure can be viewed at
wileyonlinelibrary.com]
FIGURE 10 Predictions of the crack
propagation with an overload at the cycle
of 25 000 when the value of Δa equals to
A, 0.5; B, 0.1; C, 0.01; and D, 0.001 [Colour
figure can be viewed at wileyonlinelibrary.
com]
1186 LI ET AL.
Δa is small enough, ie, Δa ≤ 0.1, the prediction error fol-lows the same tendency, and the prediction errors, whenΔa = 0.01 and Δa = 0.001, are almost identical. In addi-tion, for a certain number of training points, the accura-cies are close to each other. This observation proves thehypothesis that the number of training points and Δaare independent, when the Δa is small enough.
4.3 | Prognosis results under variousoverload conditions
In this section, the developed model is used for predictingthe crack propagation under different values of overloadratios and investigating the case that contains two over-loads in a single test. The prognosis results of a test with

FIGURE 11 Investigation of the independence between the
number of training point and Δa
LI ET AL. 1187
the instant of overload at 30 000 fatigue cycles (overloadratio equals to 2.0) are presented in Figure 12; based onthe observation in model evaluation, the number oftraining samples and the crack increment, Δa, are set tobe 5 and 0.01, respectively. It can be observed that thedeveloped model precisely predicts the crack growth ofthe experimental sample, which proves its robustnessin predicting crack propagation under differentoverload ratios.
Next, the prognosis results of a test with the instantsof overload at 30 000 and 45 000 fatigue cycles (overload
FIGURE 12 Predictions of the crack
growth rate and crack propagation with an
overload ratio of 2.0 [Colour figure can be
viewed at wileyonlinelibrary.com]
FIGURE 13 Predictions of the crack
growth rate and crack propagation with an
overload ratio of 1.75 and the scenario of
two overloads in a single test [Colour
figure can be viewed at wileyonlinelibrary.
com]
ratio equals to 1.75) are presented in Figure 13; similarto the previous case, the number of training samplesand the crack increment Δa are set to be 3 and 0.01,respectively. The reason for using less training points inthis case is that the total number of observations beforethe first overload is limited (five points) from the experi-ments. As mentioned before, to show the robustness ofboth online and offline model, a relatively smaller num-ber of training points are chosen. It can be seen that thedeveloped model successfully predicts the crack growthof the experimental sample, which proves the capabilityof the developed model in predicting crack propagationwith the overloads in a single test. Comparing with thetest containing only one overload, a relatively largerunderprediction can be found, especially after the firstoverload. In details, due to the underprediction of thecrack growth between two overload regions, a delay ofprediction is observed in predicting the retardation thatresulted from the second overload, which is clearlydemonstrated in Figure 13A. In order to obtain theinsights of such issues, an error analysis is performed toinvestigate how and why the prediction error evolveswith respect to the crack propagation.
4.4 | Discussion of error propagation withrespect to crack length
A logarithmic AR error analysis is used for investigatingthe propagation of prediction error with respect to the

FIGURE 14 Logarithmic AR
propagation with respect to crack length
in the tests: A, overload ratio of 1.75, five
training points, Δa = 0.01 and one
overload in a single test; B, overload ratio
of 2.0, five training points, Δa = 0.01 and
one overload in a single test; C, overload
ratio of 1.75, three training
points, Δa = 0.01 and two overloads in a
single test [Colour figure can be viewed at
wileyonlinelibrary.com]
1188 LI ET AL.
crack length. The purpose of this study is to assess thelong‐term prediction capability as well as to explorepotential directions that can improve the performanceof the developed model. Before discussing the error prop-agation, it is necessary to mention the potential conse-quences of underprediction and overprediction in thisstudy. When the developed model undergoes anunderprediction, an unnecessary maintenance decisionmay be suggested, because the predicted crack at a futureinstant is larger than it would be, resulting in extra main-tenance cost. When the developed model experiences anoverprediction, the risk of structural failure significantlyincreases because the predicted crack at a future instantis less severe than it would be, resulting in unexpectedloss of structural functionality. Based on these definitions,the overprediction seems to be a much more dangerousscenario for a decision‐making system.
Figure 14A to C presents the logarithmic AR propaga-tion with respect to crack length in three aforementionedtesting examples. As presented in Equation 14, a smallabsolute value of logarithmic AR indicates a precise pre-diction of the developed model. Recalling the definitionof AR, a positive AR indicates an overprediction(N f > (Ngt) f ) and a negative AR indicates anunderprediction (N f < (Ngt) f ). It is seen that there is nosignificant overprediction in these three cases; mosterrors are underpredictions, which may prevent themodel from an unexpected failure. Two observationsneed to be discussed here: First, when comparing withthe predicted crack growth far away from the overload,the predictions between the instants of overload andrecovery have relatively larger errors. The reason is that
the behavior of crack propagation immediately after anoverload is very complex, and its nonlinearity is not fullyexplored by the offline model using very limited amountof training points. The prediction accuracy of the devel-oped model is expected to be improved if a larger amountof training examples is provided to the offline model. Sec-ond, after the overload, the negative logarithmic ARkeeps decreasing with respect to the crack length, indicat-ing that the underprediction error increases as distancebetween the predicted point and first few training pointsincreases. The interpretation is that the overload has animpact on the crack growth even after the instant ofrecovery; this impact slows down the crack propagationand results in an increase in underprediction error withrespect to the crack length after overload. Even if theprediction of the developed model is very accurate, thisobservation suggests that the accuracy of this model canbe further improved by including an additional variablein the offline model to compensate for the impact ofoverload on the later stages of crack growth underconstant loading.
5 | CONCLUDING REMARKS
An online‐offline model was developed for accuratelypredicting the crack propagation under biaxial in‐phaseloading conditions with overload. The online model intel-ligently combined a physics‐based finite element modelwith a Gaussian process based data‐driven prognosismodel; the offline model was trained by the definedphysics‐based parameters including the minimum crack
LI ET AL. 1189
growth rate, crack growth retardation rate, and crackgrowth acceleration rate, which were obtained fromexisting experiments, and used to inform the onlinemodel for the prediction of crack propagation behaviorsafter the instant of overload. The developed model wasthen validated by three experiments using aluminumAA7075‐T651 alloy with varying overload ratios andnumber of overload instances in a single overload; thepredicted crack behavior showed a good agreement withthe actual tests including the crack retardation due tothe presence of overload. The sensitivities of the numberof training points and crack increment Δa to predictionaccuracy were evaluated by investigating the MAPE ofeach case. Lastly, the logarithmic AR was used to studythe propagation of prediction error with respect to thecrack length, indicating that the presence of overloadhad an impact on the crack propagation even after crackgrowth rate fully recovered. This suggests that an addi-tional variable could be included in the offline model toimprove the accuracy of the developed model inpredicting long‐term crack propagation after overloads.
ACKNOWLEDGEMENTS
This research was sponsored by the US Navy Naval AirSystems Command and Technical Data Analysis Inc.,prime contract #N68335‐16‐G‐0009, DO 0001, Programmanagers Dr Nam Phan and Dr Nagaraja Iyyer.
ORCID
Guoyi Li https://orcid.org/0000-0002-9228-4236
REFERENCES
1. Sakai T. Review and prospects for current studies on very highcycle fatigue of metallic materials for machine structural use.J Solid Mech Mater Eng. 2009;3(3):425‐439.
2. Ewing JA, Humfrey JC. The fracture of metals under repeatedalternations of stress. Proc Roy Soc Lond A. 1903;71(467–476):79‐97.
3. Vecchio1 RS, Hertzberg RW, Jaccard2 R. On the overloadinduced fatigue crack propagation behavior in aluminum andsteel alloys. Fatigue Fract Eng Mater Struct. 1984;7(3):181‐194.
4. Borrego LP, Ferreira JM, Costa JM. Fatigue crack growth andcrack closure in an AlMgSi alloy. Fatigue Fract Eng Mater Struct.2001;24(4):255‐265.
5. Sunder R, Andronik A, Biakov A, Eremin A, Panin S, Savkin A.Combined action of crack closure and residual stress under peri-odic overloads: a fractographic analysis. Int J Fatigue.2016;82:667‐675.
6. Chen G, Chen X, Niu CD. Uniaxial ratcheting behavior of63Sn37Pb solder with loading histories and stress rates. MaterSci Eng A. 2006;421(1–2):238‐244.
7. Schaff JR, Davidson BD. Life prediction methodology for com-posite structures. Part I—constant amplitude and two‐stresslevel fatigue. J Thermoplast Compos Mater. 1997;31(2):128‐157.
8. Colin J, Fatemi A. Variable amplitude cyclic deformation andfatigue behaviour of stainless steel 304L including step, periodic,and random loadings. Fatigue Fract Eng Mater Struct.2010;33(4):205‐220.
9. Hopper CD, Miller KJ. Fatigue crack propagation in biaxialstress fields. J Strain Anal Eng Des. 1977;12(1):23‐28.
10. Anderson PR, Garrett GG. Fatigue crack growth rate variationsin biaxial stress fields. Int J Fract. 1980;16(3):R111‐R116.
11. Sunder R, Ilchenko BV. Fatigue crack growth under flight spec-trum loading with superposed biaxial loading due to fuselagecabin pressure. Int J Fract. 2011;33(8):1101‐1110.
12. Perel VY, Misak HE, Mall S, Jain VK. Biaxial fatigue crackgrowth behavior in aluminum alloy 5083‐H116 under ambientlaboratory and saltwater environments. J Mater Eng Perform.2015;24(4):1565‐1572.
13. Datta S, Chattopadhyay A, Iyyer N, Phan N. Fatigue crack prop-agation under biaxial fatigue loading with single overloads. Int JFatigue. 2018;109:103‐113.
14. Datta S, Chattopadhyay A. Micromechanisms governing crackpropagation in Al 7075 under in‐plane biaxial fatigue with singleoverloads. In2018 AIAA/ASCE/AHS/ASC Structures, StructuralDynamics, and Materials Conference 2018 (p. 2004).
15. Neerukatti RK, Datta S, Chattopadhyay A, Iyyer N, Phan N.Fatigue crack propagation under in‐phase and out‐of‐phasebiaxial loading. Fatigue Fract Eng Mater Struct. 2018;41(2):387‐399.
16. Arcari A, Apetre N, Dowling N, et al. Variable amplitude fatiguelife in VHCF and probabilistic life predictions. Procedia Engi-neering. 2015;114:574‐582.
17. Liu Y, Venkatesan KR, Zhang W. Time‐based subcycle formula-tion for fatigue crack growth under arbitrary random variableloadings. Eng Fract Mech. 2017;182:1‐8.
18. Ray A, Patankar R. Fatigue crack growth under variable‐amplitude loading: part I—model formulation in state‐space set-ting. App Math Model. 2001;25(11):979‐994.
19. Ray A, Patankar R. Fatigue crack growth under variable‐amplitude loading: part II—code development and model vali-dation. App Math Model. 2001;25(11):995‐1013.
20. Kiran R, Khandelwal K. A micromechanical cyclic void growthmodel for ultra‐low cycle fatigue. Int J Fatigue. 2015;70:24‐37.
21. Neerukatti RK, Liu KC, Kovvali N, Chattopadhyay A. Fatiguelife prediction using hybrid prognosis for structural healthmonitoring. J Aerosp Inf Syst. 2014;11(4):211‐232.
22. Neerukatti RK, Chattopadhyay A, Iyyer N, Phan N. A hybridprognosis model for predicting fatigue crack propagation underbiaxial in‐phase and out‐of‐phase loading. Struct Health Monit.2018;17(4):888‐901.
23. Williams CK, Rasmussen CE. Gaussian processes for machinelearning. The MIT Press. 2006;2(3):4.
24. Hyndman RJ, Koehler AB. Another look at measures of forecastaccuracy. Int J Forecast. 2006;22(4):679‐688.

1190 LI ET AL.
25. Tofallis C. A better measure of relative prediction accuracy formodel selection and model estimation. J Oper Res Soc.2015;66(8):1352‐1362.
26. Morley SK, Brito TV, Welling DT. Measures of model perfor-mance based on the log accuracy ratio. Space Weather.2018;16(1):69‐88.
27. Hibbett, Karlsson, Sorensen. ABAQUS/standard: User's Manual.Hibbitt, Karlsson & Sorensen; 1998.
28. Aksoy S, Haralick RM. Feature normalization and likelihood‐based similarity measures for image retrieval. Pattern RecognLett. 2001;22(5):563‐582.
How to cite this article: Li G, Datta S,Chattopadhyay A, Iyyer N, Phan N. An online‐offline prognosis model for fatigue life predictionunder biaxial cyclic loading with overloads. FatigueFract Eng Mater Struct. 2019;42:1175–1190. https://doi.org/10.1111/ffe.12983