AN INVESTIGATION OF SIZE EFFECTS ON THIN SHEET FORMABILITY …
183
University of Kentucky University of Kentucky UKnowledge UKnowledge University of Kentucky Doctoral Dissertations Graduate School 2008 AN INVESTIGATION OF SIZE EFFECTS ON THIN SHEET AN INVESTIGATION OF SIZE EFFECTS ON THIN SHEET FORMABILITY FOR MICROFORMING APPLICATIONS FORMABILITY FOR MICROFORMING APPLICATIONS Nasr AbdelRahman Shuaib University of Kentucky, [email protected] Right click to open a feedback form in a new tab to let us know how this document benefits you. Right click to open a feedback form in a new tab to let us know how this document benefits you. Recommended Citation Recommended Citation Shuaib, Nasr AbdelRahman, "AN INVESTIGATION OF SIZE EFFECTS ON THIN SHEET FORMABILITY FOR MICROFORMING APPLICATIONS" (2008). University of Kentucky Doctoral Dissertations. 680. https://uknowledge.uky.edu/gradschool_diss/680 This Dissertation is brought to you for free and open access by the Graduate School at UKnowledge. It has been accepted for inclusion in University of Kentucky Doctoral Dissertations by an authorized administrator of UKnowledge. For more information, please contact [email protected].
Transcript of AN INVESTIGATION OF SIZE EFFECTS ON THIN SHEET FORMABILITY …

University of Kentucky University of Kentucky
UKnowledge UKnowledge
University of Kentucky Doctoral Dissertations Graduate School
2008
AN INVESTIGATION OF SIZE EFFECTS ON THIN SHEET AN INVESTIGATION OF SIZE EFFECTS ON THIN SHEET
FORMABILITY FOR MICROFORMING APPLICATIONS FORMABILITY FOR MICROFORMING APPLICATIONS
Nasr AbdelRahman Shuaib University of Kentucky, [email protected]
Right click to open a feedback form in a new tab to let us know how this document benefits you. Right click to open a feedback form in a new tab to let us know how this document benefits you.
Recommended Citation Recommended Citation Shuaib, Nasr AbdelRahman, "AN INVESTIGATION OF SIZE EFFECTS ON THIN SHEET FORMABILITY FOR MICROFORMING APPLICATIONS" (2008). University of Kentucky Doctoral Dissertations. 680. https://uknowledge.uky.edu/gradschool_diss/680
This Dissertation is brought to you for free and open access by the Graduate School at UKnowledge. It has been accepted for inclusion in University of Kentucky Doctoral Dissertations by an authorized administrator of UKnowledge. For more information, please contact [email protected].

ABSTRACT OF DISSERTATION
Nasr AbdelRahman Shuaib
The Graduate School
University of Kentucky
2008

AN INVESTIGATION OF SIZE EFFECTS ON THIN SHEET FORMABILITY FOR MICROFORMING APPLICATIONS
ABSTRACT OF DISSERTATION
A dissertation submitted in partial fulfillment of the requirements for the degree of Doctor of Philosophy in
the College of Engineering at the University of Kentucky
By Nasr AbdelRahman Shuaib
Lexington, Kentucky
Director: Marwan Khraisheh, Professor of Mechanical Engineering
Co-Director: I.S. Jawahir, Professor of Mechanical Engineering
Lexington, Kentucky
2008 Copyright © Nasr AbdelRahman Shuaib 2008

ABSTRACT OF DISSERTATION
AN INVESTIGATION OF SIZE EFFECTS ON THIN SHEET FORMABILITY FOR
MICROFORMING APPLICATIONS
The increasing demand for powerful miniaturized products for all industrial applications has prompted the industry to develop new and innovative manufacturing processes to fabricate miniature parts. One of the major challenges facing the industry is the dynamic market which requires continuous improvements in design and fabrication techniques. This means providing products with complex features while sustaining high functionality. As a result, microfabrication has gained a wide interest as the technology of the future, where tabletop machine systems exist. Microforming processes have the capability of achieving mass production while minimizing material waste. Microforming techniques can produce net-shape products with intricacy in fewer steps than most conventional microfabrication processes. Despite the potential advantages, the industrial utilization of microforming technology is limited. The deformation and failure modes of materials during microforming is not yet well understood and varies significantly from the behavior of materials in conventional forming operations. In order to advance the microforming technology and enable the effective fabrication of microparts, more studies on the deformation and failure of materials during microforming are needed.
In this research work, an effort to advance the current status of microforming processes for technologies of modern day essentials, is presented. The main contribution from this research is the development of a novel method for characterizing thin sheet formability by introducing a micro-mechanical bulge-forming setup. Various aspects of analyzing microscale formability, in the form of limiting strains and applied forces, along with addressing the well known size effects on miniaturization, were considered through the newly developed method. A high temperature testing method of microformed thin sheets was also developed. The aim of high temperature microforming is to study the material behavior of microformed thin sheets at elevated temperatures and to explore the capability of the known enhancement in formability at the macroscale level. The focus of this work was to develop a better understanding of tool-sheet metal interactions in microforming applications. This new knowledge would provide a predictive capability that will eliminate the current time-consuming and empirical techniques that, and this in

turn would be expected to significantly lower the overall manufacturing cost and improve product quality. KEYWORDS: Microforming, size effects, thin sheet formability, strain limits, forming
limit diagram. Nasr A. Shuaib
November 12, 2008

AN INVESTIGATION OF SIZE EFFECTS ON THIN SHEET FORMABILITY FOR MICROFORMING APPLICATIONS
By
Nasr AbdelRahman Shuaib
Dr. Marwan Khraisheh Director of Dissertation
Dr. I.S. Jawahir Co-Director of Dissertation
Dr. L. Scott Stephens Director of Graduate Studies
November 12, 2008

RULES FOR THE USE OF DISSERTATIONS
Unpublished dissertations submitted for the Doctor's degree and deposited in the University of Kentucky Library are as a rule open for inspection, but are to be used only with due regard to the rights of the authors. Bibliographical references may be noted, but quotations or summaries of parts may be published only with the permission of the author, and with the usual scholarly acknowledgments. Extensive copying or publication of the dissertation in whole or in part also requires the consent of the Dean of the Graduate School of the University of Kentucky. A library that borrows this dissertation for use by its patrons is expected to secure the signature of each user. Name Date

DISSERTATION
Nasr AbdelRahman Shuaib
The Graduate School
University of Kentucky
2008
AN INVESTIGATION OF SIZE EFFECTS ON THIN SHEET FORMABILITY FOR MICROFORMING APPLICATIONS
DISSERTATION
A dissertation submitted in partial fulfillment of the requirements for the degree of Doctor of Philosophy in
the College of Engineering at the University of Kentucky
By Nasr AbdelRahman Shuaib
Lexington, Kentucky
Director: Marwan Khraisheh, Professor of Mechanical Engineering
Co-Director: I.S. Jawahir, Professor of Mechanical Engineering
Lexington, Kentucky
2008 Copyright © Nasr AbdelRahman Shuaib 2008

Dedicated to
My father (Professor AbdelRahman Shuaib) who paved the way for me;
My mother and siblings who provided continuous moral support; and
All of you who put a mark in my wonderful life.

iii
ACKNOWLEDGEMENTS
I would like to acknowledge and express my thanks to all who assisted in the
accomplishment of this work: Professor Marwan Khraisheh, my advisor and teacher, for
his support, guidance and patience during my graduate studies. Professor Keith Rouch for
his continuous support while being a GAANN Fellowship recipient. Professor I.S.
Jawahir for his guidance, technically and morally, during my stay at the University of
Kentucky. The U.S. Department of Education for providing me with financial assistance
through the GAANN Fellowship for Areas in Assisted Needs. Dr. Liu at SECAT for his
technical support and training in my research relater work. Larry Crocket and Richard
Anderson for their assistance in critical machining tasks including experimental setups.
Dr. Osama Rawashdeh and Phillip Profitt for assisting in control aspects of my
experimental setups. Mohannad Shuaib for assisting in designing and assembling my
high temperature microforming setup. The staff of the Center for Manufacturing for their
assistance, support, and kindness. My research team (Fadi, Mohammed, Basil, and Firas)
for helping me pull it through.

iv
TABLE OF CONTENETS
ACKNOWLEDGEMENTS ............................................................................................... iii LIST OF TABLES ........................................................................................................... viii LIST OF FIGURES ............................................................................................................ x LIST OF FILES ............................................................................................................... xiii
CHAPTER ONE INTRODUCTION
1.1 Statement of the Problem .............................................................................................2
1.2 Motivations ..................................................................................................................3
1.3 Objective and Methodology .........................................................................................4
1.4 Dissertation Layout ......................................................................................................6
CHAPTER TWO
BACKGROUND
2.1 Microscale Fabrication.................................................................................................9
2.2 Microforming Processes ............................................................................................11
2.3 Size Effects in Microforming Processes ....................................................................14
2.4 Microforming at Elevated Temperatures ...................................................................20
CHAPTER THREE
CHARACTERIZATION OF SHEET FORMABILITY AT THE MACROSCALE LEVEL WITH VARYING GRAIN SIZE
3.1 Introduction ................................................................................................................26
3.2 Previous Work ...........................................................................................................26
3.3 Experimental Procedure .............................................................................................28
3.3.1 Grid marking and sheet-formability testing: ..................................... 29 3.3.2 Strain measurement ........................................................................... 31 3.3.3 Selective-grain size control ............................................................... 33
3.4 Results ........................................................................................................................34
3.5 Discussion and Data analysis .....................................................................................39

v
3.5.1 As-Received Sheets with Varying Thickness ................................... 40 3.5.2 Annealed Sheets with Varying Thickness ........................................ 41 3.5.3 As-received and Annealed Sheet of Same Thickness ....................... 43 3.5.4 As-received and Annealed Sheet of Different Thickness ................. 43
3.6 Concluding Remarks ...................................................................................................46
CHAPTER FOUR
DEVELOPMENT OF MICROFORMING SETUP 4.1 Introduction ................................................................................................................48
4.2 Microforming Setup ...................................................................................................49
4.3 Materials ....................................................................................................................54
CHAPTER FIVE
INVESTIGATIONS OF THE EFFECT OF PROCESS PARAMETERS ON THIN SHEET FORMABILITY
5.1 Introduction ................................................................................................................57
5.2 Effect of Forming Speed on Thin Sheet Formability.................................................57
5.2.1 Procedure and Experimental Data .................................................... 57 5.2.2 Discussion ......................................................................................... 61
5.3 Effect of Sheet Thickness on Thin Sheet Formability ...............................................64
5.3.1 Procedure and Experimental Data .................................................... 64 5.3.2 Discussion ......................................................................................... 64
5.4 Effect of Average Grain Size (Microstructure) on Thin Sheet Formability ..............65
5.4.1 Procedure and Experimental Data .................................................... 65 5.4.2 Discussion ......................................................................................... 68
5.5 Influence of Lubrication and Effect of Friction on Thin Sheet Formability ..............70
5.5.1 Procedure and Experimental Data .................................................... 70 5.5.2 Discussion ......................................................................................... 72
5.6 Analysis of the Effect of Combined Process Parameters on Thin Sheet Formability ................................................................................................................76
5.6.1 Constant Thickness and Grain Size with Varying Forming Speed ... 76 5.6.2 Constant Forming Speed with Varying Thickness and Grain Size ... 78 5.6.3 Constant Thickness and Grain Size with Varying Friction Effects .. 79
5.7 Concluding Remarks ..................................................................................................81

vi
CHAPTER SIX
CHARACTERIZATION OF THIN SHEET FORMABILITY AT THE MICROSCALE LEVEL
6.1 Introduction ................................................................................................................86
6.2 Experimental Procedure .............................................................................................87
6.2.1 Photolithography and Thin Sheet Marking ....................................... 88 6.2.2 Microforming of Test Specimen ....................................................... 92 6.2.3 Failure Capture by SEM Imaging ..................................................... 93 6.2.4 Analysis of Deformed Thin Sheets ................................................... 94
6.3 Characterization of Strain limits of Microformed Thin Sheets .................................98
6.3.1 Testing of automatic strain measurement and marking techniques ....................................................................................... 98
6.3.2 Results and data collection.............................................................. 101 6.4 Discussion and Data Analysis ..................................................................................105
6.4.1 Microbulged thin sheets with varying thickness ............................. 106 6.4.2 Microbulged thin sheets in dry and lubricated conditions .............. 108 6.4.3 Microbulged thin sheets vs. Macrobulged sheets ........................... 110 6.4.4 Microbulged thin sheets vs. macrobulged sheets in dry and lubricated
conditions ..................................................................................... 111 6.5 Concluding Remarks ................................................................................................112
CHAPTER SEVEN
HIGH TEMPERATURE MICROFORMING AND ANALYSIS OF MATERIAL BEHAVIOR AT ELEVATED TEMPERATURES
7.1 Introduction ..............................................................................................................116
7.2 Experimental Apparatus and Procedure ...................................................................117
7.3 Study of Effects of Warm Temperature on Parameters of Microformed Thin Sheets ......................................................................................................................119
7.3.1 Effect of Warm Temperature with Varying Forming Speeds ......... 120 7.3.2 Effect of Warm Temperature with Varying Temperature .............. 127
7.4 Study of Effects of Warm Temperature on Surface Strain Limits of Microformed Thin Sheets..............................................................................................................130
7.5 Concluding Remarks ................................................................................................134

vii
CHAPTER EIGHT
SUMMARY AND FUTURE RECOMMENDATIONS 8.1 Conclusions ..............................................................................................................137
8.2 Unique Features and Contributions .........................................................................138
8.3 Recommendations for Future Work .........................................................................140
APPENDICES ................................................................................................................ 141 REFERENCES ............................................................................................................... 151 VITA ............................................................................................................................... 162

viii
LIST OF TABLES
Table 3-1 Symbols used .................................................................................................. 34 Table 3-2 Microstructural analysis for as-received state ............................................... 35 Table 3-3 Microstructural analysis for annealed state .................................................. 35 Table 3-4 Calculated numbers of both surface and inner grains for as-received (AR) and annealed (AN) sheets ....................................................................... 38 Table 3-5 Total number of grains in deformed sheets .................................................... 39 Table 3-6 Ratios of surface grains to inner grains ......................................................... 39 Table 3-7 Characterization of sheet formability for selected scenarios ......................... 45 Table 4-1 Composition of CuZn30 alloy (wt%) [55] ...................................................... 55 Table 4-2 Composition of Al1100 alloy (wt%) [55] ....................................................... 55 Table 5-1 Numerical values of limiting dome-height and forces for CuZn30 tested sheets ............................................................................................................... 61 Table 5-2 Numerical values of limiting dome-height and forces for Al1100 tested sheets ................................................................................................... 61 Table 5-3 Grain size, d, measurement of the tested CuZn30 thin sheets ........................ 68 Table 5-4 Variation in limiting values of lubricated bugled sheets from values of dry ones ....................................................................................................... 73 Table 5-5 Characterization of parameters effect for selected scenarios ........................ 81 Table 6-1 Calculated numbers of both surface and inner grains for Micro- and Macro-bulged CuZn30 sheets along with grain size d and thickness- to-grain-size ratio λ ...................................................................................... 105 Table 6-2 Effect of lubrication on strain limits of micro- and macrobulged CuZn30 sheets ............................................................................................................. 108 Table 7-1 Numerical values of limiting dome heights for CuZn30 tested sheets at elevated temperatures ................................................................................... 123 Table 7-2 Numerical values of limiting forces for CuZn30 tested sheets at elevated temperatures ................................................................................................ 123 Table 7-3 Percent variation in limiting values from 1.5µm/s forming speed for 25µm CuZn30 at elevated temperatures ....................................................... 124 Table 7-4 Percent variation in limiting values from 1.5µm/s forming speed for 50µm CuZn30 at elevated temperatures ....................................................... 124 Table 7-5 Percent variation in limiting values of microbulged thin sheets between

ix
elevated temperatures (100˚C & 150˚C) and room temperature (25˚C) for 25µm CuZn30 ......................................................................................... 129 Table 7-6 Percent variation in limiting values of microbulged thin sheets between elevated temperatures (100˚C & 150˚C) and room temperature (25˚C) for 50µm CuZn30 ......................................................................................... 129 Table 7-7 Measurement of the increase in strain limits of microformed CuZn30 thin sheets between room temperatures and higher temperatures along with microstructural parameters .................................................................. 132

x
LIST OF FIGURES Figure 2- 1 Illustration of micromachined components [2] .......................................... 10 Figure 2- 2 Microformed (a) lead frame for microprocessors and (b) electron
gun for TVs [1] ........................................................................................... 11 Figure 2- 3 Micro-molded (a) centrifugal pump and (b) fluid flow sensor [2] .............. 12 Figure 2- 4 Miniaturization effects on flow stress of compressed CuZn15 (λ: scaling
factor) [1] ................................................................................................ 15 Figure 2- 5 Microstructure of a specimen in both macro and micro scale .................... 16 Figure 3- 1 Grid marking process ................................................................................. 30 Figure 3- 2 Tinius-Olsen BUP 200 Ductomatic sheet metal testing machine ............... 30 Figure 3- 3 Set of deformed sheet with various strain paths ......................................... 31 Figure 3- 4 A deformed sheet in biaxial strain path ...................................................... 32 Figure 3- 5 ASAME representation of a FLD ................................................................ 32 Figure 3- 6 Microstructural images of as-received (top) and annealed (bottom)
CuZn30 sheets ............................................................................................ 35 Figure 3- 7 FLDs for as-received state .......................................................................... 36 Figure 3- 8 FLDs for annealed state ............................................................................. 36 Figure 3- 9 FLDs for as-received as well as annealed states........................................ 37 Figure 3- 10 Surface and inner grains in deformed volumes .......................................... 38 Figure 3- 11 Comparison of As-Received Sheets with Varying Thickness Values .......... 40 Figure 3- 12 Comparison of Annealed Sheets with Varying Thickness........................... 41 Figure 3- 13 Comparison of As-received and Annealed Sheet of Same Thickness .......... 43 Figure 3- 14 Comparison of As-received and Annealed Sheet of Different Thickness .... 44 Figure 4- 1 Die-Frame arrangement complemented by a kinematic coupling
mechanism .................................................................................................. 52 Figure 4- 2 Microforming apparatus ............................................................................... 53 Figure 4- 3 Punch-die schematic of a 25µm microformed thin sheet ............................. 53 Figure 4- 4 Test specimen (CuZn30) before and after bulging ....................................... 54 Figure 5- 1 Force profiles of CuZn30 with varying thickness ......................................... 59 Figure 5- 2 Force profiles of Al1100 with varying thickness .......................................... 60 Figure 5- 3 Effect of varying speed on limiting height for microbulged thin sheets ....... 62 Figure 5- 4 Effect of varying speed on limiting force for microbulged thin sheets ......... 62 Figure 5- 5 Microstructural image of 25 µm (top) and 50 µm (bottom) CuZn30 thin
sheets ....................................................................................................... 67 Figure 5- 6 Microstructural image of 25 µm (top) and 50 µm (bottom) Al1100 thin
sheets ....................................................................................................... 68 Figure 5- 7 Loading profiles for dry and lubricated 25µm CuZn30 thin sheets ............. 71 Figure 5- 8 Loading profiles for dry and lubricated 50µm CuZn30 thin sheets ............. 71 Figure 5- 9 Limiting forces (top) and dome heights (bottom) for dry and lubricated
25µm CuZn30 thin sheets at 15µm/s forming speed .................................... 74 Figure 5- 10 Limiting forces (top) and dome heights (bottom) for dry and lubricated
50µm CuZn30 thin sheets at 15µm/s forming speed ............................... 75 Figure 5- 11 Comparison of limiting values of 25µm microformed CuZn30 sheets ........ 77 Figure 5- 12 Comparison of limiting values of 50µm microformed CuZn30 sheets ........ 77

xi
Figure 5- 13 Comparison of limiting values of microformed CuZn30 sheets at 15µm/s 78 Figure 5- 14 Comparison of limiting values of lubricated 25µm microformed CuZn30 79 Figure 5- 15 Comparison of limiting values of lubricated 50µm microformed CuZn30 80 Figure 5- 16 Open and closed lubricant pockets [1] ....................................................... 81 Figure 6- 1 4”x4” Micromachined Photomask with 64 separate arrangements .......... 88 Figure 6- 2 (a) Photolithography process and (b) Micro-grid pattern on a
developed thin sheet surface ....................................................................... 90 Figure 6- 3 Procedure for achieving grid markings on the tested thin sheets .............. 91 Figure 6- 4 Specimen mounting and die placement before microforming .................... 92 Figure 6- 5 HITACH S3200 SEM .................................................................................. 93 Figure 6- 6 SEM images of (a) micro-bulged thin sheet at failure and (b) chipped off
markings .................................................................................................. 94 Figure 6- 7 (a) Comparison between conventional target and micro-target
element and ............................................................................................... 96 Figure 6- 8 SEM image of microbulged thin sheet along with microtarget .................. 97 Figure 6- 9 Automatically determined strain limits using ASAME software ................. 97 Figure 6- 10 Strain limits of microbulged sheets determined by manual and
automatic calculations ............................................................................... 99 Figure 6- 11 Comparison of strain limits for S1813 and AZ5214 photoresist
markings on 25µm CuZn30 thin sheets ................................................... 101 Figure 6- 12 Strain limits of microbulged CuZn30 thin sheets ..................................... 102 Figure 6- 13 Strain limits of 25µm and 50µm CuZn30 thin sheets in dry and
lubricated (Lub) states ........................................................................... 103 Figure 6- 14 Strain limits of microbulged CuZn30 thin sheets (25µm and 50µm
thickness) and macrobulged CuZn30 sheets (2mm, 1mm, 200µm) under dry conditions .............................................................................. 104
Figure 6- 15 Strain limits of microbulged CuZn30 thin sheets (25µm and 50µm thickness) and macrobulged CuZn30 sheets (2mm, 1mm, 200µm) for both dry and lubricated states ......................................................... 106
Figure 6- 16 Comparison between parameters of microbulged thin sheets .................. 107 Figure 6- 17 Comparison between microformed and macroformed CuZn30 sheets .... 110 Figure 7- 1 Microforming setup with high temperatures testing apparatus ............... 118 Figure 7- 2 High temperature testing module along with the developed
microforming setup ................................................................................ 119 Figure 7- 3 Loading profiles for 25µm CuZn30 thin sheets at 100˚C ......................... 120 Figure 7- 4 Loading profiles for 25µm CuZn30 thin sheets at 150˚C ......................... 121 Figure 7- 5 Loading profiles for 50µm CuZn30 thin sheets at 100˚C ......................... 121 Figure 7- 6 Loading profiles for 25µm CuZn30 thin sheets at 150˚C ......................... 122 Figure 7- 7 Effect of varying speed on limiting dome height for 25µm microbulged
thin sheets at elevated temperatures ..................................................... 125 Figure 7- 8 Effect of varying speed on limiting dome height for 50µm microbulged
thin sheets at elevated temperatures ..................................................... 125 Figure 7- 9 Effect of varying speed on limiting forces for 25µm microbulged thin
sheets at elevated temperatures ............................................................. 126 Figure 7- 10 Effect of varying speed on limiting forces for 50µm microbulged thin
sheets at elevated temperatures ............................................................. 126
xii
Figure 7- 11 Bulging profiles of 25µm (left) and 50µm (right) microbulged CuZn30 at indicated forming speeds ................................................................... 128
Figure 7- 12 Strain limits of microbulged 25µm CuZn30 thin sheets at various temperatures .......................................................................................... 131
Figure 7- 13 Strain limits of microbulged 50µm CuZn30 thin sheets at various temperatures .......................................................................................... 131
Figure 7- 14 Strain limits of microbulged CuZn30 thin sheets (25µm and 50µm thicknesses) at room temperature (25˚C) and higher temperatures (100˚C and 150˚C) ................................................................................ 133

xiii
LIST OF FILES
Nasr_Shuaib_Dissertation.pdf……………………………………………………4.4 MB

1
CHAPTER ONE
INTRODUCTION
2
1.1 Statement of the Problem
The increasing demand for powerful miniaturized products in almost all industrial
applications has prompted the industry to develop new and innovative manufacturing
processes to fabricate miniature parts and structures. One of the major challenges facing
the industry is the dynamic market which requires continuous improvements and changes
to the design and fabrication techniques, as can be seen in cellular phone technology. The
reason for this is the ongoing demand by consumers for smaller and more efficient
products. This means providing more complex features in electronic devices, for
example, while sustaining the same, if not better, performance. As a result,
microfabrication, which is the fabrication of parts with at least two dimensions in the
submillimeter range, has gained a wide interest as the technology of the future, where
tabletop machine systems exist and less space is utilized for production.
Micro parts are defined as parts that have at least two dimensions in the sub-
millimeter range [1]. There are two major categories in the manufacturing industry that
are dominating in the fabrication of micro parts: micromachining and microforming. So
far, there is no standard of comparison to favor one type over the other. Most fabrication
processes are conducted from previous knowledge of a certain material behavior. Until
recently micromachining techniques had more share in the microfabrication industry than
microforming techniques. To optimize microfabrication processes we have to consider
the production rate and amount of material used for such a process. Microforming
processes have the capability of achieving mass production as well as minimizing
material waste. Microforming techniques can produce net shape products with intricate
details in fewer steps than most conventional microfabrication processes. Despite the

3
potential advantages, the industrial utilization of microforming technology is limited. The
deformation and failure of materials during microforming is not yet well understood and
varies significantly from the behavior of materials during conventional macroscale
forming operations. In order to advance the microforming technology and enable the
effective fabrication of microparts, more studies on the deformation and failure of
materials during microforming are needed.
Although microforming processes seem to be a promising alternative for some
existing microfabrication processes from a mass production point of view, the application
of these processes have been restricted by the know-how of process parameters that are
usually scaled down from conventional macroscale operations. Along with the lack of
standard procedures to efficiently perform existing microforming processes, previous
research shows that scaling forming processes from macroscale to microscale level will
yield different material deformation; contradicting with expected calculated scaling of
deformation characteristics which is expected to follow the applied geometrical scaling.
Therefore, research related to size effects, which is the phenomenon which in our current
work accompanies microforming applications by causing deviation in expected material
behavior as a result of geometrical scaling of the tool, workpiece, and die in the
microforming process, is the main focus of research related to investigations in the field
of microforming processes.
1.2 Motivations
Micro parts and products go hand in hand with future industrial applications that
are being applied in the consumers markets nowadays. Small devices that contain tiny

4
parts such as miniature screws and springs, connector pins that can be seen in CD
players, mp3 players, IC units, and microprocessors are all examples of micro-electro-
mechanical systems (MEMS) parts that are applied in the electronic industry. In
biomedical applications, micro parts and products are utilized by applying integrated
devices in the form of human implants that can replace vital organic processes. To stay
competitive, industries must utilize advanced concepts to improve their production rate of
such products and minimize their dependence on costly trial and error approaches.
So far, very little is known about the formability of materials at the microscale level.
Understanding the formability at such a scale is essential for successful forming
operations. It is also essential to develop predictive models that can be used to optimize
microforming processes and to accurately simulate the effect of various parameters on the
integrity of manufactured parts.
1.3 Objective and Methodology
The long term goal for this research area is to advance the current status of
microfabrication processes, particularly microforming, in order to advance the
technologies of modern day essentials that require mass production of effective
miniature parts. The focus of this research is to develop innovative concepts for
understanding the tool-sheet metal interactions in microforming applications. This will
supply related industries with proper predictability tools that will eliminate the time
consuming and empirical techniques that are currently employed, and this in turn would
be expected to significantly lower the overall manufacturing cost and improve the
product quality. To achieve this objective, the following stages were carried:

5
1. Investigating the characterization of sheet formability at the macroscale level:
Formability testing at the macroscale level was performed on the conventional
Olsen cup test machine. Formability ranking of tested material on forming limits
diagrams (FLDs) were compared according to grain-structure related process
parameters.
2. Due to the lack of testing equipment die microsclae testing, a testing setup for
thin sheet formability testing at the microscale level was designed and developed
for characterizing thin sheet formability. The microforming setup exhibits the
high precision and tight tolerances required for such a significantly small scale.
3. Studying the influence of process parameters on thin sheet formability in an
effort to identify size effects on thin sheet formability, and consequently,
optimize thin sheet formability techniques. A new state of the art technique was
introduced for providing surface strain measurement at the microscale level;
which has not been accomplished in a scientific way so far. Formability limits of
tested material will ultimately be used in constructing FLDs for ranking thin
sheets according to its formability.
4. Expanding the capabilities of the microforming setup to accommodate high
temperature testing and investigating the effect of high temperature testing on
thin sheet formability at the microscale and then determining if high temperature
microforming utilizes the advantage of superior forming characteristics at higher
forming temperatures similar to the macroscale level.

6
1.4 Dissertation Layout
After identifying the long term goal behind this research work and specifying the
tasks and stages that will be undertaken within the required investigation, the layout of
the dissertation was constructed. In Chapter Two, a thorough literature review is
presented to highlight the significance of micromanufacturing in our daily life necessities
and to show what impact it produces from a technological point of view. Since this work
is related to microforming, currently applied microforming techniques will be introduced
and related discoveries of the well known size effects will be referenced. Current
investigations on high temperature microforming testing will also be presented. In order
to acquire a better understanding of the characterization of sheet formability, sheet
formability testing at the macroscale using conventional testing apparatus was
investigated and the results are presented in Chapter Three. The effect of microstructure,
or average grain size in particular, on sheet formability ranking in forming limit diagrams
(FLDs) was the main focus of the study, which is also generally regarded as an important
part of size effects on sheet formability. In Chapter Four, a newly developed
microforming setup for thin sheet testing was introduced to replace the current inaccurate
and unreliable testing methods that are present when performing microscale testing on
conventional macroscale setups and apparatus. The effect of varying process parameters
on thin sheet formability at the microscale level was investigated in Chapter Five. This
study was initiated to develop a better understanding of material behavior of thin sheets
for microscale applications. Subsequently, an investigation on formability
characterization at the microscale was initiated and results are presented in Chapter Six
by introducing a method for calculating surface strain limits of microformed thin sheets.

7
The state of the art method that was developed and employed enabled the construction of
strain limits for tested sheets, which ultimately allowed the investigation of size effects
on formability at the microscale level. Size effect on friction form lubrication testing was
also investigated. In Chapter Seven, the capabilities of the developed microforming setup
were expanded to exhibit a high temperature microforming module. This module allowed
for thin sheet testing at elevated temperatures, which ultimately enables the determination
of whether or not high temperature forming offers an advantage at such a scale similar to
the superplastic forming application at the macroscale level. Finally, a summary of
conclusions and major contributions resulting from this work, as well as
recommendations for future work, are presented in Chapter Eight.
Copyright © Nasr AbdelRahman Shuaib 2008

8
CHAPTER TWO
BACKGROUND

9
2.1 Microscale Fabrication
Microfabrication of parts and components has been the focus of research in
advanced material processes and technologies for the last twenty years. Though
microfabrication processes and techniques are widely implemented in the production
sectors of most modern technologies, most of these processes are based on empirical
understanding of these processes. Miniaturization of existing larger scale techniques,
which demonstrates a top-down method, defines the design of microfabrication
processes. Micro-machining, blanking, bending, drawing, forging, extrusion, rolling, and
many similar fabrication processes are currently utilized in related industries. The two
major branches of microfabrication processes are micromachining and microforming.
Micromachining processes are based on material removal of existing raw material, while
microforming processes are material forming techniques which are divided into micro-
bulk metal forming and micro-thin sheet forming. Most microfabrication processes are
based on geometrical scaling of existing macroscale fabrication processes. However, it is
not an easy task to perform manufacturing processes at such a small scale without taking
in consideration the effect of these processes on the final product. Accurate dimensions,
surface finish, mass production, and more crucial parameters have to be considered upon
choosing a suitable process in order to obtain the desired characteristics and quantity of
the final product.
Currently, micromachining processes are the dominant branch among utilized
microfabrication techniques. In the past, micromachining processes were defined by
applying photolithography and chemical etching techniques on silicon wafers for
mechanical applications such as miniature sensors and actuators. Recently, a wide variety

10
of machining processes are performed at the microscale such as laser machining,
electron-beam machining, wire electric charge machining, and micro-CNC machining, as
seen in Figure 2-1.
Figure 2- 1 Illustration of micromachined components [2]
Since manufacturers of microparts continuously favor microfabrication processes
at high production rates while maintaining reasonable manufacturing cost, the need for
alternative techniques, which would save time and cost, is needed. This is where
microforming processes started gaining it significance.

11
2.2 Microforming Processes
Microforming processes have their share in the production of microparts in the
form of critically produced micro components of many existing products. Figure 2-2
shows parts that are microformed for modern day essentials such as TVs and computers.
Micromolding of microscale components and structures holds a major part in this branch;
facilitating product requirements for manufacturing various micro-fluid and chemical
parts and components. Figure 2-3 shows a micro molded centrifugal pump and a micro-
flow sensor.
Figure 2- 2 Microformed (a) lead frame for microprocessors and (b) electron gun for TVs [1]

12
Figure 2- 3 Micro-molded (a) centrifugal pump and (b) fluid flow sensor [2]
Metal forming is known to be an efficient manufacturing technique which
satisfies mass production along with enhanced product performance and minimal waste.
In other words, metal forming processes display high productivity and better material
utilization than many of the alternative manufacturing processes, which enables it to
satisfy the continuous demand by consumers as well as industries that are relying more
on smaller products with diverse applications [1, 3-4]. In the forming process, unlike
machining and casting, the amount of raw material used in the process is almost fully
consumed to process the final product with a very small percentage of material losses.
Some machining processes, such as chemical machining and laser beam machining, can
produce high grade micro components, but manufacturing cost and material losses could
be of significant concern. This shows why machining cannot overcome the economical
aspect of mass production. Microforming gives controlled mechanical properties of parts.
This gives the ability to obtain products in near-net shape, which means less finishing
operations.
Considering the aforementioned advantages, along with the fact that micro parts
are usually consumed at high rates to supply the continuous demand for commercial

13
products, and applying them at the microscale level, microforming processes will enable
the micro-components manufacturers to produce parts and components with intricate
geometries and configurations in fewer steps than the currently applied multi-stage
techniques. Furthermore, since high precision and tight tolerances are mandatory aspects
in micromanufacturing, microforming processes can be suitable to replace many of the
costly existing micromanufacturing processes. It is not an easy task to achieve the desired
shape of a product using other processes. Intricate details of some products require the
use of specific processes to obtain the accuracy in shape and dimensions of the final
product. Microforming enables manufacturers to design die molds with a high level of
detail and complexity to produce micro parts with complex shapes, as can be seen in
micro deep drawing.
So far, applications of microforming have covered a wide range of industrial
applications such as micro-electromechanical systems (MEMS), medical and biomedical,
micro-fluidic, and chemical applications [1-4]. More emphasis is placed on electronics
and biomedical applications due to their convergence with modern day essentials. The
products of such applications are the core of leading technological applications. The
major microforming processes currently applied are extrusion, bending, drawing, rolling,
and forging processes for both bulk and sheet materials. As discussed, these processes
have the capability of producing parts with intricate details; similar to what is known
about them in the macro scale processes. Raw materials are in the form of billets,
produced by wire drawing, or thin sheet rolls, produced by sheet rolling. The major
challenge in the field of utilizing microforming processes is to be able to understand the
process at the microscale level. This means that what is known about forming processes

14
in the macroscale, in terms of tool, die, and workpiece, will be scaled down geometrically
and functionally. For this reason, a better understanding in material behavior and related
parameters is needed in order to achieve the desired utilization of such valuable
acquisitions.
2.3 Size Effects in Microforming Processes
In order to utilize the advantages of microforming processes, material behavior
during forming must be well understood. Expected material behavior at the macroscale
level cannot be simply scaled down along with geometrical scaling of the process to
describe material flow during microforming. The deviations and unpredicted material
behavior from these expected scaled behaviors in microforming processes are known as
the “size effects” or “scaling effects” [1]. These size effects influence the process,
material behavior, tools, and equipment of the microforming process. Many researchers
focused on identifying size effects in commonly implemented microforming processes.
Their work was divided into micro-bulk forming and micro-sheet metal forming. The
experimental work conducted towards identifying size effects was carried out by scaling
down the geometry of current techniques and test apparatus applied at the conventional
macroscale level nowadays. The materials that were tested presented a wide range of
industrial materials that are being implemented in current microfabrication practices,
mainly the electronics and biomedical industries.

15
Figure 2- 4 Miniaturization effects on flow stress of compressed CuZn15 (λ: scaling factor) [1]
Geiger et al. [1, 5-8] investigated the effect of miniaturization on microforming
considering various material properties. By performing compression tests on CuZn15,
they were able to show that with increasing miniaturization, by scaling down the
geometry of the tensile specimen, the flow stress of the specimen decreased while
maintaining a fixed cross section for tested specimens as shown in Figure 2-4. This
phenomenon was explained later by the so called surface layer model demonstrated in
Figure 2-5, where the microstructure of materials consists of inner grains and surface
grains. Since more miniaturization gives more share of surface grains, which are less
restricted than inner grains, less force is needed in order to obtain the same amount of
deformation at such a scale.

16
Figure 2- 5 Microstructure of a specimen in both macro and micro scale
Kals and Eckstein [1, 9] investigated size effects on material ductility. They
conducted simple tension experiments on CuNi18Zn20 and CuZn15 brass alloys with
different grain sizes and thicknesses. Scaling down the dimensions of the specimen led to
an increasingly brittle-like behavior and a worsening in the ductility in air bending tests
that were performed on 0.5mm thin CuZn15 sheets, which resulted in almost zero
ductility at the scale factor of 0.1; defying the well-known high ductility of such an alloy.
Raulea et al. [10] discovered an interesting transition that occurred in flow stress while
bending Al 1xxx series at the microscale level. The result of this bending process showed
that although more miniaturization resulted in a decreasing yield stress, the yield stress
increased as the miniaturization increased when the thickness of the specimen was less
than the size of one grain of the specimen material; contradicting the famous Hall-Petch
relation which regards a decreasing flow stress with increasing grain size [10]. This effect
was accounted for in microforming processes that presented free deformation on the
workpiece such as blanking and forging processes. Similar results were obtained by Gau
et al [11]. They performed three-point bending tests on Al 1100 and brass 26000 and
Macro
Micro
Miniaturizing
Surface
Inner grains

17
concluded that the yield strength for both alloys decreases with increasing
miniaturization, or thickness to grain-size ratio until this ratio equals 1, where the yield
strength as well as the deviation start to increase and reverse the previous trend.
Since friction has a major influence on most forming processes, many researchers
addressed the effect of friction on microforming processes using different techniques.
The first technique was proposed by Messner [12] by implementing the conventional ring
compression test at the microscale level for micro forging applications. The results
showed an increasing friction with increasing miniaturization. To accommodate for
extrusion processes, which have more related applications than forging processes at the
microscale level, the double cup extrusion test was conducted by Tiesler and Engel [13,
14]. In this test, a cylindrical billet was deformed by penetrating a punch from one side
while another stationary punch would penetrate from the other side. The higher the
friction gets, the more the flow is prevented at the lower punch. By testing CuZn15 with
different diameters and grain sizes, they concluded that friction increased with decreasing
specimen size. The frictional behavior was explained by the “open and closed lubricant
pockets” model. Closed lubricant pockets tend to distribute pressure evenly across the
surface, contrary to the high pressure needed for open pockets that tend to concentrate
loading on hill tips. Since miniaturization comes along with more share of open pockets,
the friction effect was ascertained to be more dominant at such a scale. Krishnan et al.
[15, 16] and Cao [17] et al. investigated the friction effects in microextrusion. They
conducted extrusion tests of CuZn30 pins having various grain sizes and dimensions.
They also used different dies with different surface roughness in order to vary the
frictional effect. They showed out the variation of flow stress of specimens that had the

18
same size with different grain structure. They indicated that the size, orientation, and
distribution of grains play an important part in the extrusion process, and that the use of
coatings will reduce extrusion forces and frictional effects, and therefore will increase the
length of extruded pins.
Research on the size effects on micro-sheet metal forming has not emerged until
the last few years. Most of it covered bulging and drawing tests for investigating size
effects on flow stress. Vollertsen et al. [18, 19] performed drawing tests in thin sheets of
Al 99.5 using a 1mm diameter punch as well as thick sheets of the same material using a
50mm diameter punch for comparison, with scaled process parameters and conditions.
Due to the limited surface area of the small punch, blank holder forces could not be
applied perfectly onto the blank. The result was a high amount of wrinkling at the
microscale when compared to the ones obtains at the macroscale level. They also
observed high frictional forces that resulted in failure at the bottom part while deep
drawing at the microscale, which were significantly higher than the frictional forces that
resulted in the macro-deep drawn sheets. By applying lubrication to the process, the
coefficient of friction had a larger decrease at the microscale than that at the macroscale
level, which meant that lubrication had a different effect between both scales. Their
conclusion was that friction increases in deep drawn cups as miniaturization increases.
Michel and Picart [20] introduced technique by which the size effects on flow stress can
be verified through two parallel approaches. The first approach was simple tensile testing
of thin sheets of CuZn36. The second approach was conducting hydraulic-bulge testing of
thin sheets of the same material, since biaxial stress was proven to be more accurate than
the uniaxial stress obtained through simple tension tests. Effective diameters of the

19
bulged sheets were 20mm and 50 mm. Hydraulic pressure was supplied by using water as
the required fluid. Various sheet thicknesses and widths were tested in order to verify size
effects for a range of material characteristics. They ascertained the decreasing flow stress
with increasing miniaturization through hydraulic bulging experiments and developed a
constitutive model for flow stress. Hoffman and Hong [21] presented similar results by
testing pure copper (99.9% Cu) in simple tensile testing and air-bulge testing. Both
approached relied on an optical measurement system (ARAMIS) for calculating the flow
stress using CCD cameras. Flow stress was calculated at the pole of the bulged thin
sheets as it deformed and more accurate results of decreasing flow stress along with
increasing miniaturization were presented. The trend of decreasing flow stress with
decreasing thickness was verified in both approaches. Mahabunphachai and Koç [22]
were able to construct a hydroforming (fluid pressure based) microforming setup for
fabricating micro channels on thin sheets of SS304 stainless steel with 51µm thickness.
By testing SS304 with varying grain size on dies with varying width and depth grooves,
they were not able to correlate between these parameters and size effects. Nevertheless,
the impact of changing the parameters on the form and geometry of the formed micro
channels was detected.
A different set of investigations on micro-sheet metal forming were initiated by
Saotome et al. [23]. They developed an experimental apparatus to conduct microdeep
drawing with a 1 mm diameter punch and thin sheets as low as 0.1 mm in thickness.
Process scaling was regarded by the relative punch diameter, which is the ratio of the
punch diameter to the sheet thickness. Their study showed that the limiting drawing ratio
(LDR) decreased with increasing relative punch diameter. Saotome and Okamoto [24]

20
also performed incremental sheet metal forming of thin sheets using a hammering
mechanism. A 10 µm diameter punch directed by a piezoelectric actuator provided
incremental deformation of 10 µm thickness sheets. The accuracy of displacement of the
hammer was assured by an eddy current displacement sensor. Justinger and Hirt [25]
recorded size effects in deep drawing by measuring the peak drawing forces for different
blanks of CuZn37 with different annealing conditions. The comparisons of the resulting
drawn thin sheets were based on their grain-size-to-thickness ratio. Punch diameters were
in the range of 1 mm to 8 mm. The trend of peak forces of the drawn sheets with respect
to miniaturization was similar to the one obtained by tensile testing by previous
researchers [1, 5]. Their results showed a decreasing peak force which did not depend on
the geometrical factor, or scaling factor. It rather depended on the grain size to thickness
ratio in a proportional manner.
Since the springback behavior in macroscale sheet bending is a significant issue,
this was also investigated at the microscale level. Gau et al. [26] tested brass sheets of
thicknesses between 300 µm and 3000 µm and discovered that the trend of increasing
springback for thinner sheets at the macroscale is not true for sheets with thicknesses less
than 500 µm, and that thickness-to-grain-size ratio does not influence the amount of
spring back.
2.4 Microforming at Elevated Temperatures
All the aforementioned investigations were conducted at room temperature. New
studies aiming at applying high temperature forming or superplastic forming, at the
microscale level have been initiated. The advantage of forming at high temperatures lies

21
in the fact that at higher temperatures, usually around 0.5 to 0.7 of the melting
temperature, all materials demonstrate superior ductility while being formed, regardless
of its mechanical characteristics at room temperature. Applying this technique at the
microscale level has prompted for studies on applying superplastic microforming
processes. By implementing superplastic materials into microforming processes, various
testing apparatus and industrial application have been recognized. The following
investigations cover the majority of the ongoing effort to supply related industries with
net-shape microformed parts. Saotome et al. [27, 28] characterized amorphous alloys as
potential candidates for the fabrication of microparts in MEMS applications and even
nano-devices. They conducted forging experiments on Pd40Cu30Ni10P20 and
La60Al20Ni10Co5Cu5 amorphous alloys. They were able to utilize the viscous flow that
these alloys exhibit in the supercooled liquid state, and consequently fabricate fine 2D
and 3D structures in the with widths as low as 1µm. Saotome et al. also introduced a
technique for fabricating micro-gear shafts by forward extrusion [29] and backward
microextrusion [30] of Al-78Zn superplastic alloy. The gear shaft had a module of 10µm
for the forward extruded shaft and 20µm for the backward extruded one. They discovered
the significant effect of surface roughness and lubrication between the billet and the inner
wall of the die, where surface roughness had to be reduced and reasonable lubrication had
to be applied in order to obtain a well formed shaft with intricate details at such a scale.
Son et al. [31] performed microforging of Al5083 foils in a punch-die configuration at
elevated temperatures to employ the well known superplastic behavior of the aluminum
alloy. Al5083 foils of 2.5x2.5x1 mm size were forged into a 100 µm sized v-grooved die.
They ascertained the increasing formability of the foils with increasing forming load and

22
time. However, they pointed to the dependability of the process on the grain size of the
tested sheets. Fine grained foils tend to deform in a more accurate manner than coarse
grained foils, which need more force and time to deform grains at its preferred
orientation. Yeh et al. [32] utilized the conventional hot embossing process to be applied
to microforming applications. The material they used was a fine-grained Zn-22Al
eutectoid alloy which exhibits superplastic behavior at elevated temperatures. They
conducted compression tests on the superplastic alloy under different temperatures (150,
175, 200°C) and strain rates (0.0006-0.6s-1) and obtained flow curves based on force vs.
distance recordings. They concluded that the flow stress decreases with increasing
forming temperature, while the strain sensitivity index increased with increasing forming
temperature. Based on comparison, they were able to identify the required parameters for
optimum forming conditions. While optimal parameters were held, a micro-hot
embossing process for fabricating micro-sized gears was successfully achieved. All
fabricated gears did not show any type of internal failures, and a reduction gear train was
assembled and operated properly. Furushima and Manabe [33, 34] succeeded in
fabricating microtubes by conducting a dieless drawing process on Zn-22Al and AZ31
superplastic materials. Microtubes with outer and inner diameters of 190 µm and 91µm,
respectively, were fabricated successfully by a four-pass drawing process. The
deformation temperature was 250°C for Zn-22Al and 400°C for AZ31. The major
achievement of this work was presenting the ability to hold the same inner-to-outer-
diameter ratio and a homogeneous microstructure, which would hold the superior
mechanical properties that these alloys bear. Laser forming has also been introduced as a
forming technique for microforming thin metal sheets. Ocaña et al. [35] applied laser-

23
shock microforming, which is a non-thermal distortion technique, on AISI 304 stainless
steel. The obtained results of deformed beam-specimens were suitable for validating a
numerical approach for characterizing beam bending of the same alloy with varying pulse
energy. Thermal based laser forming was utilized by Cheng et al. [36] by combining the
advantages of laser shock peening, laser forming, and metal forming along with an ultra
high strain forming rate. They performed thin sheet bulging on thin copper sheets (with
thickness of 15 µm) by shock wave propagation of induced laser beams which makes the
specimen take the 3D shape of the mold in the bottom. They were able to prove that
materials with fine grains demonstrate a significantly higher formability than coarse ones.
Eichenhueller et al. [37] investigated size effects on microforming at elevated
temperatures, and below recrystallization temperature. They constructed flow curves of
CuZ15 and stainless steel X4CrNi-18-10 by upsetting, lateral extrusion, and backward
extrusion of billets with varying average grain size while maintaining the same specimen
size (0.5 mm in diameter) at varying temperatures up to 400˚C. They verified the
decrease in flow stress and increase in scatter which accompanies an increasing
miniaturization for both alloys. They also found that a moderate increase in the forming
temperature for microforming will result in a significant reduction in scatter, which will
ultimately lead to more stability and reliability in testing at such a scale.
As noted in the literature above, miniaturization through microforming has its
advantages in supplying alternative techniques and methods to the dynamic demand of
the market nowadays. However, disadvantages and limitations come along with this
emerging technology. Further investigations should be performed in order to develop
more understanding of the material behavior during microforming. Although a good

24
amount of knowledge is deduced in bulk metal forming at the microscale level, very little
is known about the formability issue of thin sheets at such a scale. In general,
investigations of size effects on ductility and formability of thin sheets in microforming
applications are limited to tensile tests of thin sheets and few micro deep drawing and
micro bulge forming studies. Formability during tensile tests was simply characterized by
elongation to failure [1, 5-9, 20, 21]. For the biaxial experiments, limiting drawing ratio
and maximum bulge height were used to characterize the formability during micro deep
drawing [18, 19, 22, 24] and micro bulge forming [20, 21] respectively. These limited
formability analyses are not sufficient to understand the size effects on deformation and
formability at the micro scale. More detailed analysis of strain distributions and limiting
strains during microforming of thin sheets is needed to be able to predict the formability
limits for thin sheets and minimize trial and errors runs that are conventionally performed
to master the know-how of a micro-metal forming process. Thin sheet metals are of
extensive use in the field of electronics and MEMS applications and understanding the
different aspects of formability at the microscale level is essential in order to advance the
use of microforming processes in these fields and many more that can benefit from its
advantages. The consequences of such investigations are better optimization of process
parameters and reduced overall manufacturing cost in microforming processes.
Copyright © Nasr AbdelRahman Shuaib 2008

25
CHAPTER THREE
CHARACTERIZATION OF SHEET FORMABILITY AT THE MACROSCALE
LEVEL WITH VARYING GRAIN SIZE

26
3.1 Introduction
Since most fabrication processes are initially scaled down from existing
macroscale geometries and parameters, as mentioned in the previous literature review, it
is essential to initiate research on thin sheet formability by investigating the effect of
varying parameters, which influence microscale formability, at the macroscale level.
Along this path, the characterization of sheet-metal formability was represented by
constructing forming limit diagrams (FLDs). FLDs are valuable diagnostic tools that rank
the effectiveness of sheet metal alloys in various industrial applications with respect to
their formability. Since formability is influenced by various process parameters, such as
tool geometry and material properties, extensive research has been conducted in an effort
to identify the parameters that influence the form and position of forming limits curves
(FLCs), such as strain hardening exponent n and plastic anisotropy factor r, in formability
charts. Nevertheless, few studies concentrated on correlating FLDs of different sheet
thicknesses with the microstructure of these formed sheets. In this chapter, formability
tests were conducted on a Tinius Olsen cup test machine. The tested batches, which were
of a CuZn30 alloy, were distinguished according to their thickness as well as their
average grain size which was varied according to different annealing schemes. The aim
of this study is to identify any effects of grain size on formability limits of sheet metal.
3.2 Previous Work
The automotive industry, especially in the U.S., has benefited from the concept of
forming limit diagrams since the 1960’s, when Keeler [38] emphasized the significance

27
of applying FLDs as a predictive tool for stamping applications in the automotive
industry. Since then, extensive research has been conducted on factors that influence
sheet formability in order to achieve better utilization of FLDs for sheet metal forming in
general. Since FLDs rank the effectiveness and likeliness of using certain alloys over
others according to its ease of formability, mechanical properties were the focus of
process factors that affect the formability of sheet metal. Early investigations reported the
effect of strain hardening exponent n, anisotropy factor r, and inhomogeneity on the
magnitude of strain limits [38]. Those parameters influenced the ability of deformed
sheets to distribute strain more, or less, uniformly which may increase, or decrease strain
limits at a certain strain path. Keeler and Backofen [39] stated that strain limits are
proportional to the hardening exponent n. Marciniak and Kuczynski [40] described the
effect of each of the previous properties on sheet formability. They concluded that
limiting strains increased rapidly as the inhomogeneity of the material deceased. They
also presented theoretical analysis supporting the fact that limiting stains increased as the
n exponent increased and as the anisotropy factor r decreased. Similar results were
presented in [41].
Further studies were carried out for optimizing the use of FLDs in the sheet metal
forming industry. These studies identified sheet thickness and microstructure as
parameters that affect the form and position of FLCs. Yamaguchi and Mellor [42] studied
the effect of thickness and microstructure of sheets under biaxial tension and were able to
predict the limiting strains of sheets by relating grain size to surface roughness and sheet
thickness. This was achieved by modifying the theoretical models that Marciniak and
Kuczynski [40, 41] developed for predicting limiting strains of sheet metal. Recent

28
studies showed the dependability of limiting strains to new parameters such as the
amount of heat treatment [43, 44] and thickness to grain size ratio [45]. Although the
aforementioned parameters were proven to have a significant influence on the formability
of sheets in general, more depth into the characterization of formability based on
microstructural features of sheets is needed to utilize the advantage of performing minor
modifications in sheets, such as annealing, and consequently obtain different formability
limits depending on the desired application for the formed sheets. This way, better
material utilization will be achieved and less alteration between different materials will
be necessary. This investigation emphasizes on critical properties in sheet forming
processes that related industries can benefit from applications where the microstructure of
formed sheets has low significance in their post-forming applications.
3.3 Experimental Procedure
In this study, conventional limiting dome height tests were performed on CuZn30
alloy, in as-received state, with thicknesses of 2mm, 1mm and 200μm. Consequently,
FLDs were constructed and the effect of sheet thickness and thickness-to-grain-size ratio
on sheet formability was validated based on previous literature. Furthermore, annealing
was performed on the same material samples of similar thickness values in order to
obtain a reasonable variation in the grain size of same-thickness sheets. Limiting strains
and forming limit curves were compared for each case of thickness and annealed state
with respect to their thickness-to-grain-size ratio λ as well as their volume-to-grain-size
ratio π. In an effort to append more significance to the influence of grain size and position
on the formability of sheets, the grains of deformed volumes in the formability tests were

29
classified into surface grains and inner grains depending on their relative position within
the sheet. The ratio of surface-to-inner-grains Ns/Ni was introduced as an additional factor
to study the influence of the ratio of surface grains to inner grains on sheet formability.
The specific steps taken to initiate the investigation are described as follows:
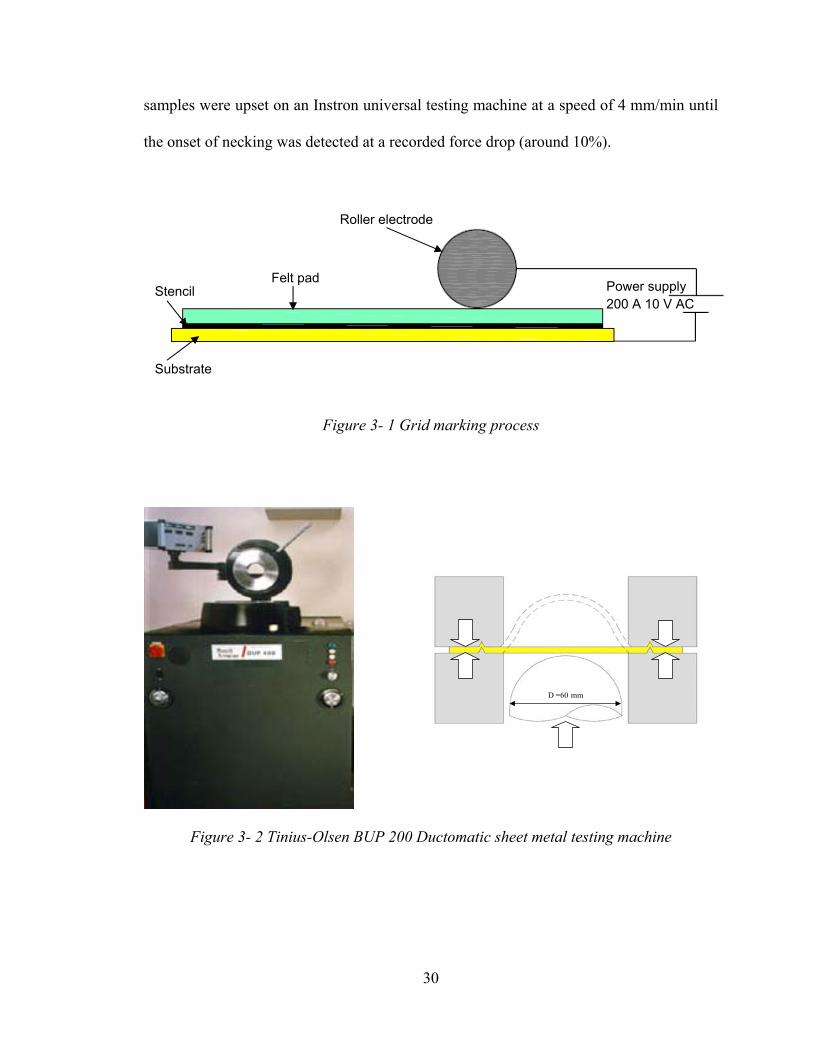
3.3.1 Grid marking and sheet-formability testing:
Before sheet formability testing, grid marking on sheet surfaces was made by an
electro-chemical etching process for facilitating the surface strain measurement of
deformed sheets. Circles of 2.54 mm in diameter were printed on all sheet specimens. An
illustration of the grid marking process is shown in Figure 3-1. The procedure for electro-
chemical marking is listed in Appendix I. A Tinius Olsen cup test machine (Figure 3-2)
was used for applying sheet bulging. CuZn30 sheets of 2mm, 1mm and 200µm
thicknesses were stretched over a hemispherical punch-tip with 60 mm in diameter at a
speed of 4 mm/min. To ensure proper clamping and restriction from sheet drawing, a
clamping bead mechanism provided sufficient pressure for clamping the tested sheets
according to their thickness (Figure 3-2). Sheets were provided for testing at various
widths to demonstrate a range of strain paths between the balanced biaxial and plane-
strain state (Figure 3-3). For each test, the punch was stopped at the onset of necking
which was detected automatically at a certain level of force drop determined by the
machine’s force sensor; which is adjusted according to sheet thickness. Tensile
specimens with a 50.8 mm gauge length and 12.7 mm width were tested for a negative
strain path which represents a uniaxial strain path on the FLD. Circle-grids were printed
on the tensile specimens following the same electro-chemical etching procedure. Tensile
30
samples were upset on an Instron universal testing machine at a speed of 4 mm/min until
the onset of necking was detected at a recorded force drop (around 10%).
Figure 3- 1 Grid marking process
Figure 3- 2 Tinius-Olsen BUP 200 Ductomatic sheet metal testing machine
D =60 mm
Stencil
Substrate
Felt pad Power supply 200 A 10 V AC
Roller electrode

31
Figure 3- 3 Set of deformed sheet with various strain paths
3.3.2 Strain measurement
Surface strain limits for every strain path were calculated using the ASAME strain
measurement software. ASAME (Automatic Strain Analysis and Measurement
Environment) is a software package by which surface strains can be calculated
automatically from actual photo images of sheets around the vicinity of the crack. In
order for the software to measure strain along curved surfaces, a cubic-target element,
which enables the software to account for curvature and three-dimensional coordinates, is
used. Figure 3-4 shows a bulged sheet along with the cubic target. Strain limits of failed
and safe regions were clearly distinguished in color representation to ensure proper
selection of limits on the FLD and plotting FLCs (Figure 3-5).

32
Figure 3- 4 A deformed sheet in biaxial strain path
Figure 3- 5 ASAME representation of a FLD
Failure region

33
3.3.3 Selective-grain size control
The formed sheets were classified into two batches. The first batch presented all
sheet thicknesses in the as-received state. The second batch presented the same sheet
thicknesses annealed at different temperatures and durations to demonstrate a reasonable
variation in grain size between all tested samples. Microstructural analysis was done on
all sheet batches to determine the average grain size d for each sheet thickness. For every
sheet thickness and annealing state, samples were polished and then etched to reveal the
microstructure for each specimen. Appendix II lists the procedure for sample mounting,
polishing, and etching. Optical microscopy was used for determining the average grain
size for each sample by applying the conventional linear intercept method; accordingly
with ASTM standard E112-96 for determining the average grain size [46]. The calculated
grain size for all samples represented the average grain size between surface grains and
through-thickness-grains. In order to have a means by which the tested sheet can be
compared, ratios between thickness and grain size λ and between deformed volume and
grain size π were calculated. Furthermore, after determining the average grain size for
each batch, the total number of deformed grains Nt was calculated assuming spherical
shaped grains. The volume for each deformed grain was calculated from the determined
average grain size which represents the average diameter of the specified grains. From Nt,
The total number of surface grains for each case was determined, assuming a total of half
a layer on the top surface and another half on the bottom surface of the sheets, as well as
half a layer on the sides in the case of plane-strain and tensile samples, assuming
unrestricted surfaces on the sides of the samples. The total number of deformed inner
grains Ni was then determined. The symbols used in this study are listed in Table 3-1.

34
Table 3-1 Symbols used
Symbol Description d Average grain size λ Thickness-to-grain-size ratio π Deformed volume-to-grain size ratio Ni Number of inner grains in deformed volume Ns Number of surface grains in deformed volume Nt Number of total grains in deformed volume
3.4 Results
The microstructural analysis conducted on CuZn30 sheets for determining the
average grain size d, the thickness-to-grain-size ratio λ, and the volume-to-grain-size-
ratio π for the as-received sheets is shown in Table 3-2.The same variables were
calculated for the annealed sheets and are presented in Table 3-3. The required statistical
analysis in this investigation is demonstrated in Appendix III. The volume-to-grain-size-
ratio π was calculated for samples that represented a strain path for the balanced biaxial,
plane-strain, and uniaxial deformation states. The plane-strain path refers to samples that
reflect stain limits in the plane-strain region in the FLD. Figure 3-6 shows microscopic
images of surface microstructure for sheets in both as-received as well as annealed sheets
for each thickness, which clearly illustrates grain variation between them. For the tested
batches, Figure 3-7 shows the FLDs obtained for the as-received state AR, while Figure
3-8 shows FLDs obtained for the annealed state AN.

35
Table 3-2 Microstructural analysis for as-received state
Thickness (µm)
d (µm) SD λ π (µm2)
Biaxial Plane-strain Uniaxial 2000 55.5 2.24 36.1 150,824.9 141,691.2 27,027.0 1000 29.9 1.07 33.5 139,979.6 131,502.7 35,535.1 200 16.0 1.03 12.5 52,317.4 49,149.1 13,281.25
Table 3-3 Microstructural analysis for annealed state Thickness
(µm) Temp.
(°C) Time(Hr)
d (µm) SD λ π (µm2)
Biaxial Plane-strain Uniaxial2000 700 7 476.2 0.21 4.2 17,578.3 16,513.8 4,462.4 1000 700 1 238.1 0.26 4.2 17,578.3 16,513.8 4,462.4 200 600 3 48.8 0.06 4.1 17,153.2 16,114.5 4,354.5
Figure 3- 6 Microstructural images of as-received (top) and annealed (bottom) CuZn30
sheets
2mm
50 µm
30 µm 150 µm
200μm 1mm
300 µm
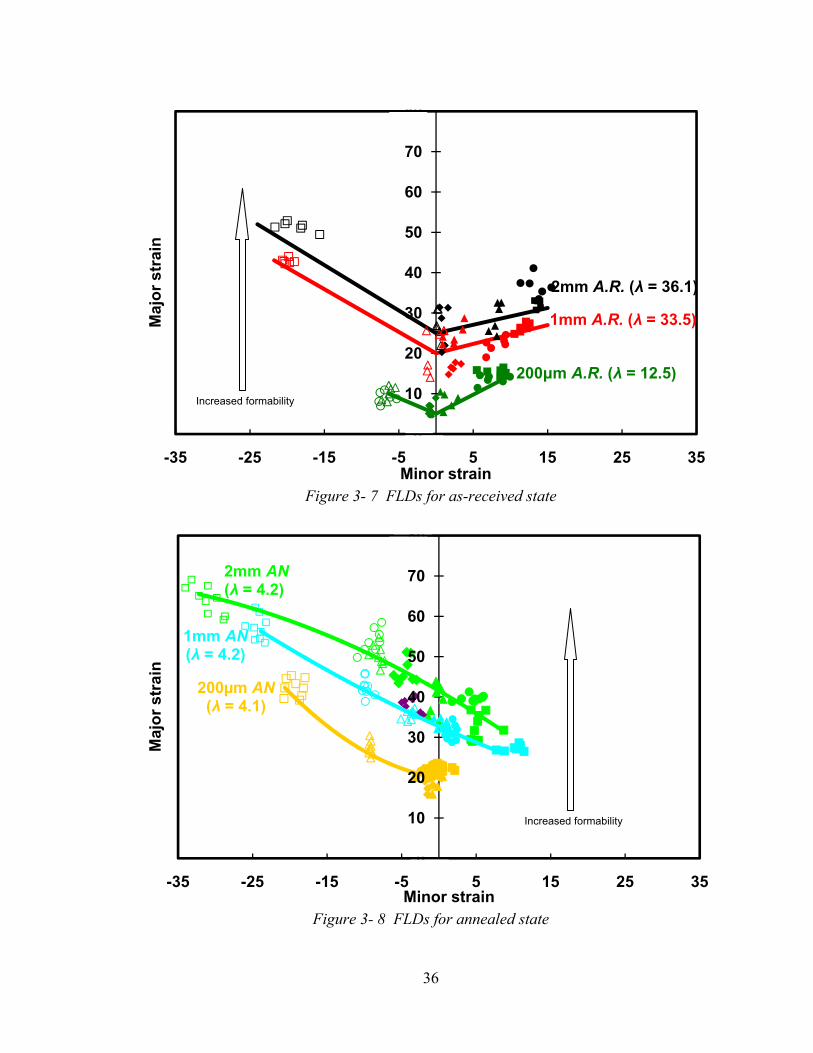
36
Figure 3- 7 FLDs for as-received state
Figure 3- 8 FLDs for annealed state
0
10
20
30
40
50
60
70
80
-35 -25 -15 -5 5 15 25 35
Maj
or s
trai
n
Minor strain
1mm A.R. (λ = 33.5)
200μm A.R. (λ = 12.5)
2mm A.R. (λ = 36.1)
0
10
20
30
40
50
60
70
80
-35 -25 -15 -5 5 15 25 35
Maj
or s
trai
n
Minor strain
200µm AN(λ = 4.1)
1mm AN(λ = 4.2)
2mm AN(λ = 4.2)
Increased formability
Increased formability

37
Figure 3- 9 FLDs for as-received as well as annealed states
The total number of surface, inner, and total deformed grains were calculated for
the deformed volume of the biaxial, plane-strain, and uniaxial strain samples. Figure 3-10
shows an illustration of how surface and inner grains were selected. Table 3-4 and 3-5
show the values of deformed grains for both cases.
0
10
20
30
40
50
60
70
80
-35 -25 -15 -5 5 15 25 35
Maj
or s
trai
n
Minor strain
1mm A.R. (λ = 33.5)
200μm A.R. (λ = 12.5)
1mm AN(λ = 4.2)
2mm AN(λ = 4.2)
2mm A.R. (λ = 36.1)200μm AN
(λ = 4.1)

38
Figure 3- 10 Surface and inner grains in deformed volumes
Table 3-4 Calculated numbers of both surface and inner grains for as-received (AR) and annealed (AN) sheets
Thickness Ns (x106) Ni (x106) Biaxial Plane-strain Uniaxial Biaxial Plane-strain Uniaxial
2mm AR 1.730 1.647 0.047 91.786 86.206 23.271 1mm AR 5.961 5.637 1.516 293.075 275.290 74.397 200µm AR 20.816 19.581 5.286 369.491 347.091 93.798 2mm AN 0.023 0.022 0.006 0.125 0.117 0.031 1mm AN 0.094 0.089 0.024 0.498 0.468 0.126 200µm AN 2.238 2.104 0.568 11.519 10.819 2.924
Free grains
Inner grains
A A B B C C
SECTION A-A SECTION B-B SECTION C-C
Biaxial
Uniaxial
Plane-strain
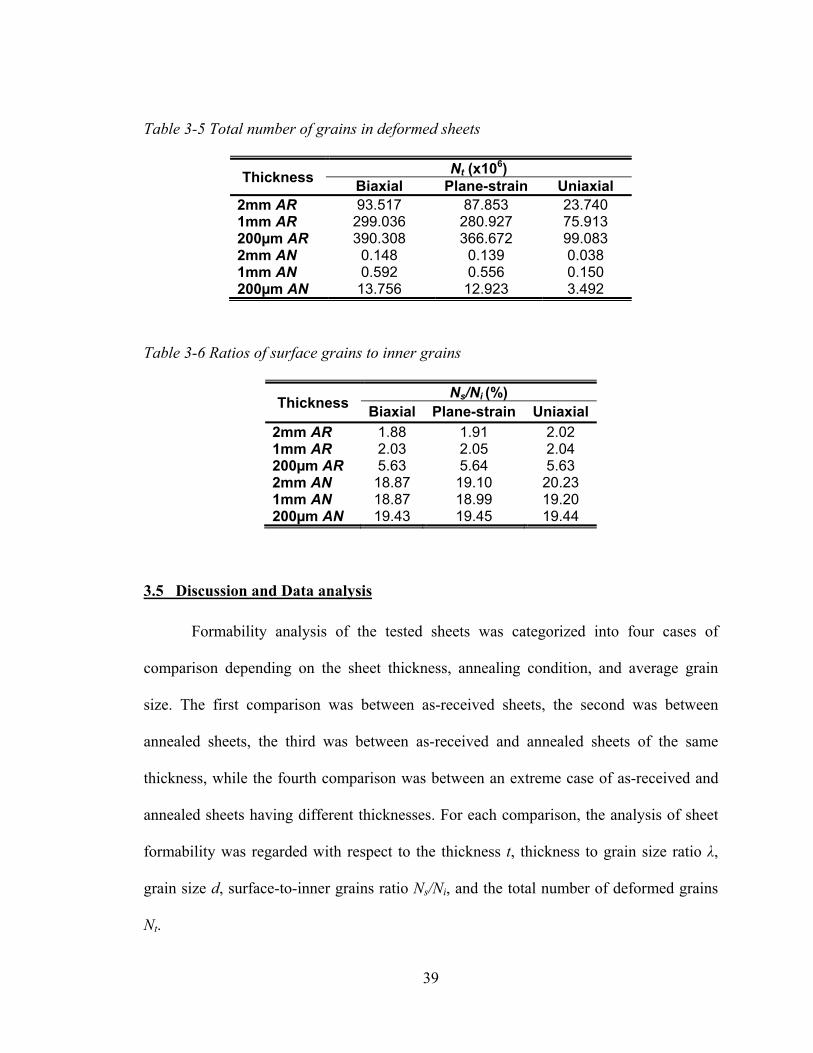
39
Table 3-5 Total number of grains in deformed sheets
Thickness Nt (x106) Biaxial Plane-strain Uniaxial
2mm AR 93.517 87.853 23.740 1mm AR 299.036 280.927 75.913 200µm AR 390.308 366.672 99.083 2mm AN 0.148 0.139 0.038 1mm AN 0.592 0.556 0.150 200µm AN 13.756 12.923 3.492
Table 3-6 Ratios of surface grains to inner grains
Thickness Ns/Ni (%)
Biaxial Plane-strain Uniaxial 2mm AR 1.88 1.91 2.02 1mm AR 2.03 2.05 2.04 200µm AR 5.63 5.64 5.63 2mm AN 18.87 19.10 20.23 1mm AN 18.87 18.99 19.20 200µm AN 19.43 19.45 19.44
3.5 Discussion and Data analysis
Formability analysis of the tested sheets was categorized into four cases of
comparison depending on the sheet thickness, annealing condition, and average grain
size. The first comparison was between as-received sheets, the second was between
annealed sheets, the third was between as-received and annealed sheets of the same
thickness, while the fourth comparison was between an extreme case of as-received and
annealed sheets having different thicknesses. For each comparison, the analysis of sheet
formability was regarded with respect to the thickness t, thickness to grain size ratio λ,
grain size d, surface-to-inner grains ratio Ns/Ni, and the total number of deformed grains
Nt.

40
3.5.1 As-Received Sheets with Varying Thickness
For the batch of as-received sheets (Figure 3-7), formability increased with
increasing thickness, λ ratio, and grain size. Although the Ns/Ni ratio was higher in
thinner sheets, which should result in a higher share of free grains, and therefore less
restriction to deformation, formability decreased along with thickness. This decrease in
formability can be regarded by the overall number of deformed grains Nt, which
increased with decreasing thickness. According to dislocation theory, dislocations tend to
pile up behind grain boundaries; which means that a higher grain boundary density will
occupy a higher dislocation density. As a result, the fewer overall deformed grains for
thicker sheets were less restricted to the deformation of the whole sheet and showed
higher formability limits. Thus, the total number of deformed grains showed more
influence on ranking formability than the share of surface grains. This observation
validated what is known about the decreasing formability with decreasing thickness and
thickness-to-grain-size ratio mentioned in [42-45].
2mm (AR) 1mm (AR) 200µm (AR)
Biaxial Plane- strain Uniaxial Biaxial Plane-
strain Uniaxial Biaxial Plane- strain Uniaxial
Ns/Ni (%) 1.88 1.91 2.02 2.03 2.05 2.04 5.63 5.64 5.63 Nt (x106) 93.517 87.853 23.740 299.517 280.927 75.913 390.308 366.672 99.083
Figure 3- 11 Comparison of As-Received Sheets with Varying Thickness Values
2mm λ = 36.1
d = 55.5µm
1mm λ = 33.5
d = 29.9 µm
200µm λ = 12.5 d = 16µm
Surface grains
Inner grains
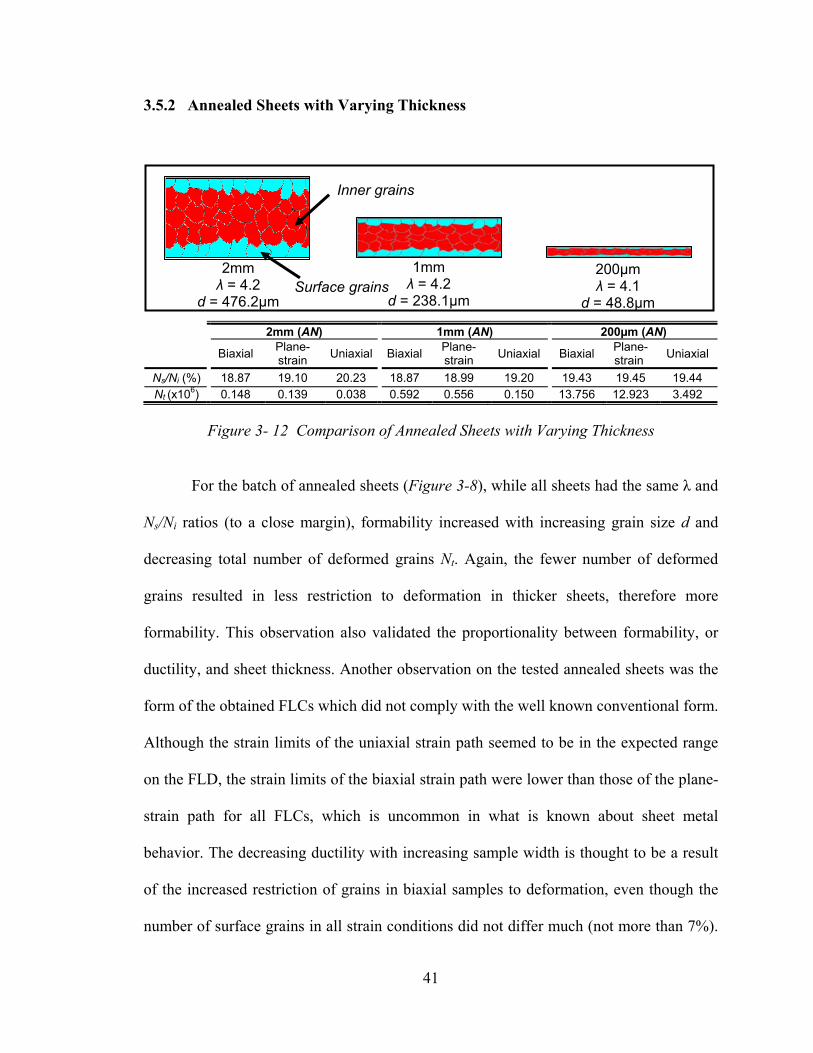
41
3.5.2 Annealed Sheets with Varying Thickness
2mm (AN) 1mm (AN) 200µm (AN)
Biaxial Plane- strain Uniaxial Biaxial Plane-
strain Uniaxial Biaxial Plane- strain Uniaxial
Ns/Ni (%) 18.87 19.10 20.23 18.87 18.99 19.20 19.43 19.45 19.44 Nt (x106) 0.148 0.139 0.038 0.592 0.556 0.150 13.756 12.923 3.492
Figure 3- 12 Comparison of Annealed Sheets with Varying Thickness
For the batch of annealed sheets (Figure 3-8), while all sheets had the same λ and
Ns/Ni ratios (to a close margin), formability increased with increasing grain size d and
decreasing total number of deformed grains Nt. Again, the fewer number of deformed
grains resulted in less restriction to deformation in thicker sheets, therefore more
formability. This observation also validated the proportionality between formability, or
ductility, and sheet thickness. Another observation on the tested annealed sheets was the
form of the obtained FLCs which did not comply with the well known conventional form.
Although the strain limits of the uniaxial strain path seemed to be in the expected range
on the FLD, the strain limits of the biaxial strain path were lower than those of the plane-
strain path for all FLCs, which is uncommon in what is known about sheet metal
behavior. The decreasing ductility with increasing sample width is thought to be a result
of the increased restriction of grains in biaxial samples to deformation, even though the
number of surface grains in all strain conditions did not differ much (not more than 7%).
2mm λ = 4.2
d = 476.2µm
1mm λ = 4.2
d = 238.1µm
200µm λ = 4.1
d = 48.8µm Surface grains
Inner grains

42
For further explanation, the designation of surface and inner grains in Figure 3-10 was
considered. From the illustration, it can be said that the grains at the perimeter of the
deformed dome in the biaxial strain path are restricted by the surrounding ones, leading
them to become inner grains at the perimeter of the deformed volume, which is not the
case in plane-strain samples that had free unrestricted grains on the sides of the samples.
Therefore, the deforming coarse grains of the biaxial specimens resulted in a restricted
forming limit on the FLD due to the retardation of adjacent grains to rotate into its
preferred orientation that enables them to deform plastically, which was not the case for
the deformed grains of the plane-strain samples which had free grain around the
deformed perimeter that will assist in the deformation of adjacent grains. This behavior
resulted in lower strain limits of biaxial samples along the major axis than that of the
plane-strain samples, which yield the unconventional trend of the FLC .The observed
restriction demonstrated low values in minor strain for the spherically bulged sheets that
decreased with decreasing thickness (Figure 3-8). In general, significantly large grains
tend to affect the behavior of sheet formability.

43
3.5.3 As-received and Annealed Sheet of Same Thickness
2mm (AR) 2mm (AN) Biaxial Plane-strain Uniaxial Biaxial Plane-strain Uniaxial
Ns/Ni (%) 1.88 1.91 2.02 18.87 19.10 20.23 Nt (x106) 93.517 87.853 23.740 0.148 0.139 0.038
Figure 3- 13 Comparison of As-received and Annealed Sheet of Same Thickness
For sheets of the same thickness, formability increased with increasing grain size
and Ns/Ni ratio, but decreasing λ ratio and total number of deformed grains. It can be said
that the share of surface grains in the annealed sheet was greater than that of the as-
received one which meant less restriction to deformation. Along with that, the number of
grains through thickness, λ, as well as the total number of deformed grains were also
fewer for the annealed sheet, which meant less restriction to the overall number of grains
in the deformed sheets for all three strain paths; according to dislocation theory.
3.5.4 As-received and Annealed Sheet of Different Thickness
An unconventional case was chosen for comparing formability with respect to
varying thickness and annealing condition, or grain size. The 1mm annealed sheet
demonstrated a higher ductility than the 2mm as-received one, which contradicts the fact
of increasing ductility with sheet thickness. The influencing factors for increased
2mm λ = 36.1
d = 55.5µm
2mm λ = 4.2
d = 476.2µm
Surface grains
Inner grains

44
formability, or ductility, are the increasing grain size and the Ns/Ni ratio along with the
decreasing number of deformed grains and λ ratio. In this case the thicker sheet
demonstrated less formability due to greater restriction to grains to deform because of
increased grain- density when compared to the thinner sheet.
2mm (AR) 1mm (AN) Biaxial Plane-strain Uniaxial Biaxial Plane-strain Uniaxial
Ns/Ni (%) 1.88 1.91 2.02 18.87 18.99 19.20 Nt (x106) 93.517 87.853 23.740 0.592 0.556 0.150
Figure 3- 14 Comparison of As-received and Annealed Sheet of Different Thickness
For all the mentioned cases of comparison, it can be said that thickness was the
dominant factor for ranking the formability of sheet metal. However, grain size and the
number of grains across thickness start to impose an effect into the mentioned ranking at
a certain value of grain size in the microstructure of tested sheets as seen in the
comparison between the 2mm as-received sheet and 1mm annealed one. Nevertheless,
sheet thickness has a more dominant effect on sheet formability ranking in the case of a
fine-grain structure, as can be seen conventionally [40-45]. By lowering the number of
grains across thickness, and consequently the total number of deformed grains, the
formability enhanced significantly, but the high surface roughness, which was clearly
identified visually by the naked eye, is a limitation to such sheet metal processing if a
smooth surface finish is a requirement. This might limit its use in industrial applications,
2mm λ = 36.1
d = 55.5µm
1mm λ = 4.2
d = 238.1µm
Surface grains
Inner grains

45
as mentioned by Yamaguchi and Mellor [42]. More detailed analysis should be
performed to understand the form and nature of FLDs for sheets with a few grains across
its thickness.
Overall, the ranking of sheet metal formability was regarded with respect to the
grain size d and the total number of deformed grains Nt. The reason for the previous
parameters being dominant factors in characterizing formability is the significant
decrease in dislocation density due to the decrease in Nt. This corresponds with the
dislocation theory which states that dislocations tend to pile up on their slip plains behind
grain boundaries [47-48]. Knowing that in the case of the more ductile sheets, which held
fewer grains than less ductile ones, the grain boundary density of the aforementioned
sheets is significantly less than that of the later mentioned ones which have smaller
grains. Therefore, applying equal punch forces will yield in higher formability for
annealed sheets because they demonstrate less restricted grains that will have to rotate to
obtain the proper orientation for material deformation meaning, fewer obstacles for grains
to deform under loading forces [47]. The influence of the selected parameters on
formability are shown in Table 3-7, where arrows pointing up represent increasing values
while arrow pointing down represent decreasing values. All the corresponding
measurement and analysis for the tested sheets with different cases are summarized in
Appendix III.
Table 3-7 Characterization of sheet formability for selected scenarios
Case Formability t λ d Ns/Ni Nt Grain boundary densityAR vs. AR (varying t) ↑ ↑ ↑ ↑ ↓ ↓ ↓ AN vs. AN (varying t) ↑ ↑ - ↑ - ↓ ↓ AN vs. AR (constant t) ↑ - ↓ ↑ ↑ ↓ ↓ AN vs. AR (varying t) ↑ ↓ ↓ ↑ ↑ ↓ ↓
46
3.6 Concluding Remarks
The effect of sheet microstructure on its formability was addressed by
characterizing sheet formability with respect to its thickness, thickness-to-grain-size ratio,
volume-to-grain-size ratio, surface-to-inner grains ratio, and total number of deformed
grains. Formability seemed to decrease with decreasing thickness along with thickness-
to-grain-size ratio and volume-to-grain-size ratio. FLDs of annealed sheets showed a
different trend with higher strain limits than as-received ones of the same thickness.
Overall, the increase in formability seemed to be a result of less number of deformed
grains in all cases which was accompanied by a lower grain boundary density, meaning
less restriction to grain deformation. The total number of deformed grains and grain size
showed more influence on sheet formability than sheet thickness at a certain grain size.
This study is regarded as a first step towards addressing size effects on thin sheet
formability from surface strain-limits point of view. In Chapter 6, size effects will be
identified through a comparison between the results in this chapter and the results of
strain analysis at the microscale level. More analysis into the effect of grain size within a
certain sheet thickness on the formability of sheet metal should be conducted for the
benefit of sheet metal formability in related industries, such as the automotive industry.
Copyright © Nasr AbdelRahman Shuaib 2008

47
CHAPTER FOUR
DEVELOPMENT OF MICROFORMING SETUP

48
4.1 Introduction
As mentioned before, the lack of knowledge in predictive models and testing
methods that can help us understand metal forming and material flow at the microscale
level calls for more extensive research in the area of characterizing formability for
microforming processes. In this work, initial efforts to make use of existing testing setups
such as the Tinius-Olsen® cup test setup and the Rheometrics Scientific Inc. ® RSAIII
nano-indentation setup were undertaken. Although results were obtained from thin sheet
bulging by those setups, a lot of limitations and undesired parameters could not be
avoided regarding testing conditions. Some of the drawbacks of the aforementioned
setups when incorporating microforming of thin sheets through bulging are:
1. Lack of accuracy in force measurement of minute amounts of loading when
considering thin sheet bulging on conventional drawing tests machines.
2. High amount of clamping forces which tend to tear thin sheets along its
deformation parameter instead of on the deformed area.
3. Lack of existing dies to accommodate forming of sheets in microscale or
mesoscale levels.
4. Lack of high precision and tight tolerances which govern thin sheet formability at
the microscale level.
5. Inability to ensure proper alignment between the punch and die, which were
developed for its use in the RSA III nano-indentation setup, although loading and
displacement readings were accurate enough.

49
In view of the above mentioned limitations, a major effort was put into identifying
and capabilities of a testing setup which can accommodate the following
requirements for characterizing thin sheet testing such as:
1. A microforming fixture that can demonstrate the required high precision and tight
tolerances for measuring formability at the microscale level.
2. A proper thin sheet clamping mechanism to assure the required stretching while
keeping the deformed sheets from drawing into the die hole.
3. A perfect alignment mechanism between the punch and die-hole, which will
ultimately eliminate any worries about proper load sensing and reading.
4. A control system for controlling the forming process while having the ability to
end testing at certain level of force drops, as exhibited by conventional large
setups, which is a challenge when considering the minute applied forces.
5. A data acquisition system for recording force and displacement readings during
testing.
In this chapter, a newly developed microforming setup, which demonstrates the above
requirements, is introduced. This setup is considered to be the back bone of this work, as
will be mentioned in the following chapters.
4.2 Microforming Setup
The purpose of developing a microforming setup was to ensure proper thin sheet
stretching for characterizing formability at the microscale level. The microforming setup
was scaled down from the actual layout of the Tinius Olsen dome test machine according
to the ASTM bulging test standard E643-84 [51]. The scaling resulted in an actual

50
microbulge forming setup with a punch-die arrangement. The hemispherical punch tip is
1.5 mm in diameter. The punch is mechanically driven by a Haydon Switch &
Instruments® stepper-motor-driven linear actuator. Two linear actuators which
demonstrate a high precision factor are used; one for forming 25µm thickness sheets at
1.5 µm per step and another for forming 50µm thickness sheets. The accuracy of the
stepper motors given by the manufacturer [52] is 6-7% per step; which translates to
0.1µm and 0.2µm per step for the smaller and bigger actuators respectively. The punch
and linear actuator are connected by a miniature Cooper Instruments and Systems® load
cell which is capable of reading minute force measurements through significantly low
voltage pulses (0.2 mV). These low voltage pulses must be amplified by a voltage
amplifier up to 5V. The resolution of the load cell is set around 450 milligram. The
linearity and hysteresis provided by the manufacturer [53] is ±0.5% with a repeatability
factor of ±0.1%. The accuracy of the voltage amplifier which delivers force readings to
the data acquisition system is 0.02%.
A die fixture with a simple screw mounting mechanism was fabricated for holding
thin sheet specimens. Although the die hole was just slightly larger than 1.5 mm (the
punch diameter), the required specimen size was 9x9 mm for facilitating handling of
samples and applying proper gripping. The die arrangement provided enough clamping
forces to restrict material movement along the clamped region, which forbids thin sheet
drawing into the die opening while forming. This conclusion was drawn upon testing thin
sheet stretchability through measuring distances between identified points on the tested
specimens before and after forming measured using an Olympus® BX41 optical
microscope. Random points were designated across the bulging area as well as same

51
sides of bulging area. Repeated measurements of three specimens were taken for
statistical purposes, as detailed in Appendix IV, and averaging the readings resulted in a
0.2% .. material deformation under the clamped region with a 0.06 standard deviation
and 0.3 coefficient of variation. From this result, we concluded that the presented
microforming setup demonstrates total stretching capabilities for limiting-strain
characterization.
In order to ensure proper alignment between the punch and the die hole, a
kinematic coupling mechanism with a six-point contact layout was fixed between the
bottom of the die and the fixture frame (Figure 4-1). An electronic processor was
developed for controlling speeds and depths of the forming punch. A data acquisition
system complemented the setup for providing in-situ force and displacement
measurements during testing. Figure 4-2 shows the layout of the microforming setup. A
unique feature which enables us to choose stopping the bulging process at a preferred
level of force drop (0-100%) after achieving the maximum point was added to the control
setup. Thin sheets were deformed into a hemisphere until the initiation of a crack on the
surface, as can be seen in Figure 4-3. It can be said that this forming setup has
microforming capabilities [1] since the cross section of the bulged thin sheets is always in
the microscale level; which is the fundamental definition of microforming processes. The
experimental procedure for thin sheet bulging can be seen in Appendix V. The outcome
of the presented apparatus is a unique feature by which thin sheet formability at the
microscale level can be characterized and results can be more accurate than using
existing testing setups which do not represent the actual deformation mechanism in a
proper way.

52
Contact spheres
V-grooves
Figure 4- 1 Die-Frame arrangement complemented by a kinematic coupling mechanism

53
Figure 4- 2 Microforming apparatus
Figure 4- 3 Punch-die schematic of a 25µm microformed thin sheet
Die
Punch
Load cell
Motor
t = 25 µm 50 µm h = 550-600µm
d = 1500µm

54
Figure 4- 4 A Test specimen (CuZn30) before and after bulging
4.3 Materials
The materials were chosen based on their significance in the micromanufacturing
field. Cartridge brass (CuZn30) was chosen due to its favorable use in micro-electro-
mechanical systems (MEMS) [1-9, 11, 13-17, 20, 25, 26, 54]. The significance of this
particular alloy comes from its excellent mechanical and electrical properties which are
essential aspects in electronic devices. Brass alloys have the advantage of demonstrating
excellent ductile behavior when cold worked, high strength and corrosion resistance, and
excellent formability characteristics for sheet metal operations. This alloy is used in
MEMS components such as IC sockets, circuit boards, and electronic connectors. Table
4-1 lists the nominal composition of CuZn30 alloy.
Before microforming After microforming
9x9 mm 9x9 mm

55
Table 4-1 Composition of CuZn30 alloy (wt%) [55]
Material Cu Zn Pb Fe Mn Al Sn
CuZn30 68.5-71.5 balance 0.05 0.1 0.05 0.02 0.05
Another alloy which holds similar significance with CuZn30 is Al 1100. This high purity
aluminum alloy demonstrates the same favorable mechanical and electrical properties for
fabricating MEMS parts [1,3,4,5,10,11,18,19,31,32,56,57]. Since Al1100 is currently
implemented in MEMS micro-structures which are fabricated by photolithography and
LIGA techniques [3,4,58,59], mastering microforming processes on such an alloy at the
microscale will enable the mass production of microparts in significantly lower lead time.
Another advantage of microforming aluminum alloys is the assurance of maintaining any
desired intricate geometries without worrying about adding more costly techniques into
the production process. The nominal composition of Al1100 is listed in Table 4-2.
Table 4-2 Composition of Al1100 alloy (wt%) [55]
Material Al Si+Fe Cu Mn Zn Other
AA1100 99 0.95 0.05-0.2 0.05 0.1 0.05
Both CuZn30 and Al1100 are supplied in the form of thin sheets, with cartridge brass in
half hardened condition (H02-tempered) [60] and Al110 in a fully annealed condition (O-
tempered) [61]. In this work, thick sheets of CuZn30 with 2mm, 1mm, and 0.2mm
thicknesses were tested. Thin sheets of CuZn30 and Al1100 with 25.4µm and 50.8µm
thicknesses were also tested.
Copyright © Nasr AbdelRahman Shuaib 2008
56
CHAPTER FIVE
INVESTIGATIONS OF THE EFFECT OF PROCESS PARAMETERS ON THIN
SHEET FORMABILITY

57
5.1 Introduction
The first step to a proper optimization approach for thin sheet microforming
processes is to identify the major process parameters that influence the nature of material
behavior at such a scale, which can ultimately lead to a better understanding of size
effects on microforming processes. In this study, loading profiles along forming
displacements were analyzed while varying specifically identified process parameters.
The chosen parameters are forming speed, sheet thickness, microstructure, and
lubrication. Identifying the existence of any influence by the aforementioned parameters
on the loading profiles will benefit the micromanufacturing industry by establishing
means of adjusting process parameters to facilitate in obtaining preferred results and
functionalities. For all conducted tests in this study, tested specimens were categorized
into four batches with two different alloys; CuZn30 and Al1100 thin sheets with 25µm
and 50 µm thicknesses for each alloy. The aim of parameter testing in this study is to
determine whether the identified parameters do have an influence on thin sheet
formability for microforming applications and processes. The effect of each parameter
was investigated separately and a cumulative comparison was made in order to establish
the effect of all identified parameters.
5.2 Effect of Forming Speed on Thin Sheet Formability
5.2.1 Procedure and Experimental Data
To investigate the effect of forming speed on microscale formability, particularly
microbulging, the previously introduced microforming setup was used (described in

58
Chapter Four). Microbulging tests for each batch of material and thickness were
performed at four forming speeds; 1.5, 15, 150, and 1500 µm/s. In each test, thin sheets
were clamped, as mentioned in Chapter Four, and bulged until failure which was detected
automatically by the microprocessor through the DAQ system after sensing a 10% force
drop from the peak force value. The recorded forces were then plotted along the punch
stroke to form loading profile of the actual bulging process. For each batch of thin sheets,
every test under a particular speed was repeated three times for assessing statistical
scatter in the data. The loading profiles were then averaged from the repeated
experiments. Figure 5-1 shows the plotted loading profiles for CuZn30 while Figure 5-2
shows the loading profiles for Al1100.

59
Figure 5- 1 Force profiles of CuZn30 with varying thickness
0
1000
2000
3000
4000
5000
6000
7000
0 100 200 300 400 500 600 700 800
Force (g)
Displacement (µm)
1.5 μm/s
15 μm/s
150 μm/s
1500 μm/s
1.5 μm/s
15 μm/s
150 μm/s
1500 μm/s25
µm
50 µm

60
Figure 5- 2 Force profiles of Al1100 with varying thickness
0
200
400
600
800
1000
1200
0 50 100 150 200 250 300 350 400
Force (g)
Displacement (µm)
1.5 μm/s
15 μm/s
150 μm/s
1500 μm/s
1.5 μm/s
15 μm/s
150 μm/s
1500 μm/s25
µm50
µm

61
5.2.2 Discussion
From the loading profiles presented above, it can be said that the form of loading
profiles with respect to the forming depth of the punch for each of the four batches was
nearly identical. This means that the loading path by which the material is deformed is
not affected by the forming speed, even though there seemed to be some variation in the
plotted curves due to measurement and acquisition errors which were quantified in
Chapter Four. From this observation, it can be said that the loading profile for a certain
material at the microscale is independent of the forming speed, at least between the
indicated range of forming speeds. This observation goes together with the less-
dependability of flow stress on forming strain rates at room temperature at the macroscale
level [48, 62, 63].
Table 5-1 Numerical values of limiting dome-height and forces for CuZn30 tested sheets
Forming Speed (µm/s)
Limiting dome-height (μm) Limiting force (gm)25μm 50μm 25μm 50μm
1.5 501.50 705.58 2829.26 6355.31 15 500.56 680.36 2709.30 6107.37
150 468.41 584.47 2579.08 5265.38 1500 404.18 451.59 2378.22 3688.09
Table 5-2 Numerical values of limiting dome-height and forces for Al1100 tested sheets
Forming Speed (µm/s)
Limiting dome-height (μm) Limiting force (gm)25μm 50μm 25μm 50μm
1.5 234.29 390.43 470.78 1066.79 15 229.80 389.01 454.95 1158.25
150 213.26 381.11 439.25 1176.18 1500 134.10 315.88 327.18 1195.84

62
Figure 5- 3 Effect of varying speed on limiting height for microbulged thin sheets
Figure 5- 4 Effect of varying speed on limiting force for microbulged thin sheets
0
100
200
300
400
500
600
700
800
1 10 100 1000 10000
Displacem
ent (μm
)
Speed (μm/sec)
CuZn30‐25μm
CuZn30‐50μm
Al1100‐25μm
Al1100‐50μm
1.5µm
/s
150µm
/s
15µm
/s
1500
µm/s
0
1000
2000
3000
4000
5000
6000
7000
1 10 100 1000 10000
Force (gm)
Speed (μm/sec)
CuZn30‐25μm
CuZn30‐50μm
Al1100‐25μm
Al1100‐50μm
1.5µm
/s
150µm
/s
15µm
/s
1500
µm/s

63
Limiting values of dome heights and forces were extracted from loading plots of
both tested alloys and quantified in Tables 5-1 & 5-2. Those values were plotted in
Figures 5-3 & 5-4 to illustrate the trend of limiting values. For CuZn30, values of
limiting dome-heights for both 25µm and 50µm thin specimens seemed to decrease with
increasing forming speed. The rate of drop in limiting dome-height was greater for
thicker sheets; having a drop of 19% and 36% between slowest (1.5µm/s) and fastest
(1500µm/s) forming speeds for 25µm and 50µm tested sheets respectively. The same
trend was observed for limiting forces with varying speeds for both tested thicknesses.
The drop in limiting force also increased for the thicker sheet, having a maximum drop of
42% for 50µm sheets versus 16% for 25µm thin sheets. In both cases, the rate of drop for
the 50µm sheets demonstrated a steeper trend than that of the 25µm ones. For limiting
values of Al1100 tested sheets, limiting dome-heights for both tested thicknesses
decreased with increasing forming speed. Again, thicker sheets showed more drop in
forming height with increasing forming speed than thinner ones; with 50µm sheets
having a maximum drop of 42% (at 1500µm/s forming speed) while 25µm thin sheets
having only a 20% drop. However, resulting limiting forces did not follow the same
trend, instead limiting forces increased with increasing forming speed with around 12%
increase in 1500µm/s forming speed from 1.5µm/s.
In general, for CuZn30 tested thin sheets, there seemed to be some dependence of
limiting heights and forces on forming speed that can be related to work hardening
effects. This observation is contrary to the increasing tensile elongation of CuZn30 and
several other metal alloys with increasing strain-rate at the macroscale [48, 62-65].
However, this dependency cannot be explained by linking limiting values to

64
corresponding materials only. The effect of other process parameters must be
incorporated in the analysis of speed dependence, such as sheet thickness and average
grain size, which have been proven to have a significant impact on formability
comparison at the macroscale [42-45]. Therefore, the mentioned dependency will be
addressed along with other parameters that will be investigated in the following sections.
5.3 Effect of Sheet Thickness on Thin Sheet Formability
5.3.1 Procedure and Experimental Data
Since the sheet thickness is the first parameter that is usually considered,
especially when investigating the extent of sheet formability for achieving a certain
formed shape or geometry, loading profiles of the two tested thicknesses, 25 and 50 µm,
were compared for each tested material; CuZn30 and Al1100.
5.3.2 Discussion
From Figures 5-1 & 5-2, the loading profiles for each tested thickness of both
alloys can be clearly distinguished. For both CuZn30 and Al1100, thicker sheets showed
superior forming dome-heights to thinner ones. The forces needed to obtain higher dome-
heights for thicker sheets were also higher than that needed for thinner ones. However, in
the analysis of the limiting dome-heights and forces for each thickness and alloy
separately, as shown in Figures 5-3 and 5-4, another trend was observed in the
comparison of formability of varying thicknesses of the same alloy. For CuZn30, the
reduction in limiting dome-heights and limiting forces between 50µm and 25µm tested
sheets seemed to decrease with increasing forming speed; having a limiting height

65
reduction of 29% at 1.5µm/s forming speed, which decreased to a 10% reduction at
1500µm/s forming speed. Limiting forces also showed the same trend in reduction
between the two tested thicknesses; having a 55% reduction at 1.5µm/s forming speed
while holding a 35% reduction at 1500µm/s forming speed. These results can be
characterized by a steeper drop in limiting values for 50µm when compared to 25µm
ones, as mentioned in previous section. For Al1100, the recorded limiting dome-height
and forces did not project the same trend as what was observed for the CuZn30 alloy. The
decrease in limiting height between 50µm sheets and 25µm ones seemed to be greater at
lower speeds (being 40% and 56% at 1.5µm/s and 1500µm/s forming speeds
respectively). The same result was found for limiting forces (having reductions of 58%
and 73% at 1.5µm/s and 1500µm/s forming speeds, respectively). From the obtained
results it can be seen that reducing sheet thicknesses for thin sheet microbulging reduces
the required forming loads, but on the other hand reduces the limiting dome-height,
which ultimately reduces the ductility of the formed thin sheets. This observation will be
incorporated with grain size investigations that will be discussed in the next section.
5.4 Effect of Average Grain Size (Microstructure) on Thin Sheet Formability
5.4.1 Procedure and Experimental Data
Due to the continuous association of microforming with the average grain size d
in most recent and current investigations [5-21], the average grain size for each alloy and
thickness was determined after performing the proper microstructural analysis that
included polishing and etching techniques. Since it is an extremely difficult task to mount
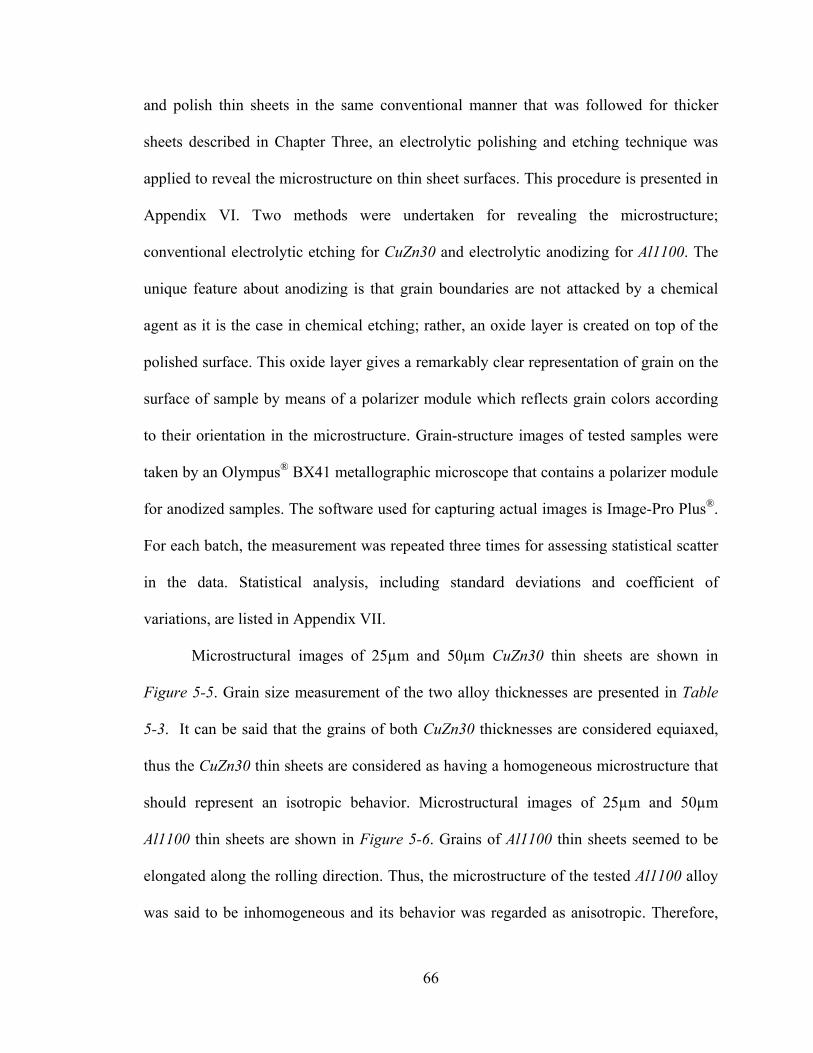
66
and polish thin sheets in the same conventional manner that was followed for thicker
sheets described in Chapter Three, an electrolytic polishing and etching technique was
applied to reveal the microstructure on thin sheet surfaces. This procedure is presented in
Appendix VI. Two methods were undertaken for revealing the microstructure;
conventional electrolytic etching for CuZn30 and electrolytic anodizing for Al1100. The
unique feature about anodizing is that grain boundaries are not attacked by a chemical
agent as it is the case in chemical etching; rather, an oxide layer is created on top of the
polished surface. This oxide layer gives a remarkably clear representation of grain on the
surface of sample by means of a polarizer module which reflects grain colors according
to their orientation in the microstructure. Grain-structure images of tested samples were
taken by an Olympus® BX41 metallographic microscope that contains a polarizer module
for anodized samples. The software used for capturing actual images is Image-Pro Plus®.
For each batch, the measurement was repeated three times for assessing statistical scatter
in the data. Statistical analysis, including standard deviations and coefficient of
variations, are listed in Appendix VII.
Microstructural images of 25µm and 50µm CuZn30 thin sheets are shown in
Figure 5-5. Grain size measurement of the two alloy thicknesses are presented in Table
5-3. It can be said that the grains of both CuZn30 thicknesses are considered equiaxed,
thus the CuZn30 thin sheets are considered as having a homogeneous microstructure that
should represent an isotropic behavior. Microstructural images of 25µm and 50µm
Al1100 thin sheets are shown in Figure 5-6. Grains of Al1100 thin sheets seemed to be
elongated along the rolling direction. Thus, the microstructure of the tested Al1100 alloy
was said to be inhomogeneous and its behavior was regarded as anisotropic. Therefore,

67
grain size measurement of tested samples was irrelevant to address the size effects
through a varying microstructure. Hence, correlation of bulging profiles and loading
limits with Al1100 grain sizes were not included in this investigation. Furthermore, any
generalization of size effects on process parameters was restricted to the tested CuZn30
alloy.
Figure 5- 5 Microstructural image of 25 µm (top) and 50 µm (bottom) CuZn30 thin sheets
15 µm
30 µm
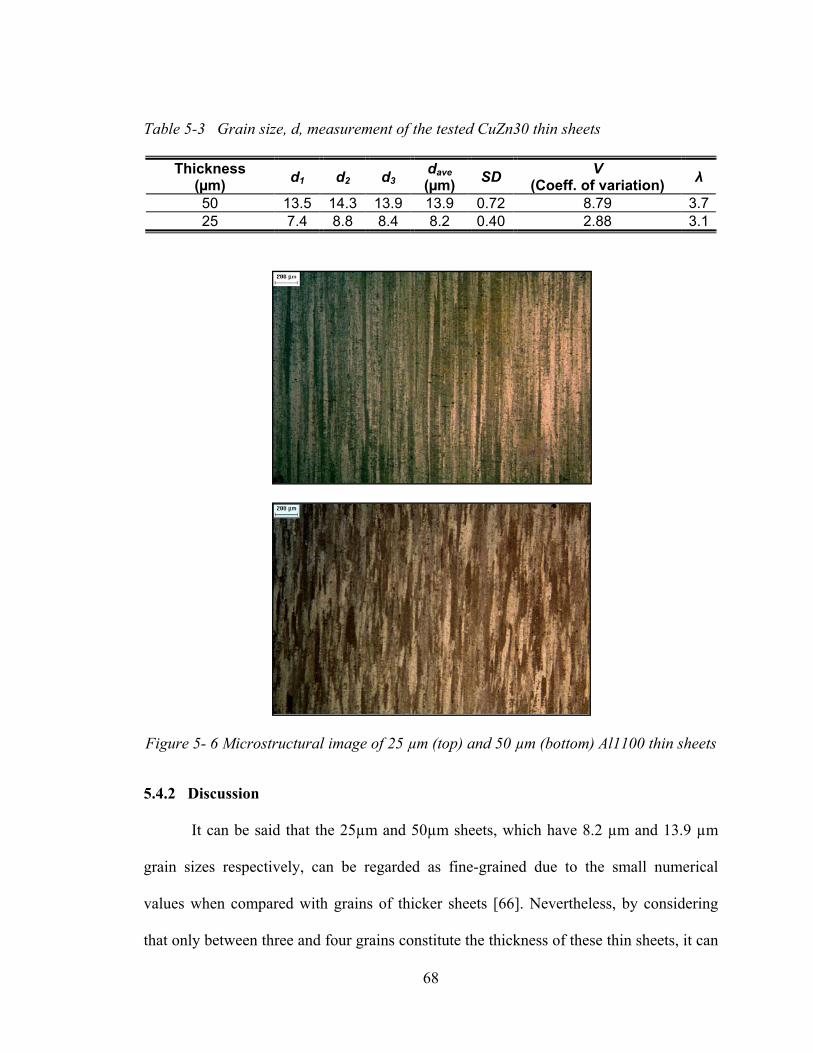
68
Table 5-3 Grain size, d, measurement of the tested CuZn30 thin sheets
Thickness (µm) d1 d2 d3
dave (µm) SD V
(Coeff. of variation) λ
50 13.5 14.3 13.9 13.9 0.72 8.79 3.725 7.4 8.8 8.4 8.2 0.40 2.88 3.1
Figure 5- 6 Microstructural image of 25 µm (top) and 50 µm (bottom) Al1100 thin sheets
5.4.2 Discussion
It can be said that the 25µm and 50µm sheets, which have 8.2 µm and 13.9 µm
grain sizes respectively, can be regarded as fine-grained due to the small numerical
values when compared with grains of thicker sheets [66]. Nevertheless, by considering
that only between three and four grains constitute the thickness of these thin sheets, it can

69
be assumed that these tested sheets of the aforementioned thicknesses are coarse-grained.
By referring to the loading profiles of CuZn30 in Figure 5-1, for both 25µm and 50µm
tested sheets, thin sheets with smaller grain size had less formability, or ductility.
However, the comparison cannot be based on grain size alone since the varying grain size
is accompanied by thickness variation too. Therefore, a more accurate parameter should
be chosen for investigating the effect of varying microstructure on thin sheet formability
at the microscale. As introduced in Chapter Three, the thickness-to-grain-size ratio λ was
applied for comparison in this study. Values of λ ratio are presented in Table 5-3. In order
to have a reasonable correlation between the λ ratio and the obtained loading profiles for
CuZn30, measured forces were compared for each thickness for the same certain punch
depth. For example, by observing the projected force value at a 400µm dome height
(Figure 5-1), it is clear to say that sheets with a higher λ ratio needed higher forces to
obtain that particular dome-height. This result can be generalized for all loading profiles
starting at 200µm dome heights and greater; since below that value the projected forces
were identical for both λ ratios of each thickness. The reason behind the mentioned trend
could be the restricted deformation caused by the presence of more grains across
thickness, as was concluded in formability analysis of CuZn30 sheets at the macroscale
level (Chapter Three) and mentioned in [1,47,48]. To generalize the effect of grain size
on thin sheet formability at the microscale, more grains through sheet thickness develop
an increasing restriction for grains to rotate to its preferred orientation for the
deformation of the continuum material.

70
5.5 Influence of Lubrication and Effect of Friction on Thin Sheet Formability
5.5.1 Procedure and Experimental Data
The effect of friction has been mentioned in Chapter Two. As established in
previous literature [12-17], friction has a great effect on some process parameters in
microforming processes. In this study, the effect of friction was investigated by analyzing
the loading profiles of dry-bulged thin sheets as well as lubricant-bulged ones and then
comparing their form and accompanying trends. In order to follow a reasonable approach
for applying the term “size effects”, which is the main concern in data analysis of
microforming, a particular forming speed of 15µm/s was chosen in this comparison. The
reason for choosing this forming speed comes from fact that it is the closest to the scaling
of the common applied speed of 1.5 in./min by 50 times (resulting in 12.7µm/s forming
speed). This scaling corresponds with the scaling of the previously introduced
microforming setup presented in Chapter Four, as well as the characterization of thin
sheet formability which will be presented in Chapter Six. The lubricants used were WD-
40® and DuPont Teflon® commercial lubricants. The compositions of both lubricants are
considered classified information; therefore their composition could not be acquired.
However, Teflon® is considered as one of the major lubricants used in numerous
applications including automotive, aerospace, agricultural, and construction applications
[67-68]. Teflon® lubricant was particularly chosen for lubrication testing because it is
commonly used in the construction of FLDs to expand the strain limits of balanced
biaxial stretching conditions beyond its limits at dry forming [49, 69-72]. Loading
profiles of the tested CuZn30 with 25µm and 50µm thicknesses are presented in Figures
5-7 & 5-8.

71
Figure 5- 7 Loading profiles for dry and lubricated 25µm CuZn30 thin sheets
Figure 5- 8 Loading profiles for dry and lubricated 50µm CuZn30 thin sheets
0
1000
2000
3000
4000
5000
6000
7000
0 200 400 600 800
Force (g)
Displacement (µm)
dry
WD40
Teflon
0
1000
2000
3000
4000
5000
6000
7000
0 200 400 600 800
Force (g)
Displacement (µm)
dry
WD40
TEFLON

72
5.5.2 Discussion
From the presented plots (Figures 5-7 & 5-8), it is clear that the lubrication did
not affect the form of loading profiles for tested CuZn30 thin sheets. However, a slight
variation between limiting dome-heights and forces for dry and lubricated sheets was
detected. Figures 5-9 & 5-10 demonstrate those variations in terms of limiting values for
both tested thicknesses respectively. A statistical analysis, in the form of data scatter of
recorded measurements, was first considered. Although it seemed that the variation of
upper limits and lower limits to averaged values were high for all tested sheets when
observing the limiting diagrams in Figures 5-9 & 5-10, indicating a high data scatter,
calculated percent variation for the mentioned values showed a variation of 0.1-4.5%.
The range can be regarded as reasonable error bounds. In other words, a large data scatter
was not observed in the results of measured limits.
The variation of limiting heights and forces of lubricated tested sheets, with both
WD-40 and Teflon, are presented in Table 5-4. For both CuZn30 thicknesses, limiting
dome height increased with lubrication. However, the decrease in limiting forces, which
is expected in macroscale testing, occurred only for 25µm lubricated sheets, while
limiting forces increased for 50µm lubricated sheets. By referring to percent variations in
limiting values in Table 5-4, variation in limiting heights was in the range of 1-3.5% for
25µm lubricated sheets and 4-5% for 50µm lubricated sheets when compared to limits of
dry conditions, while the variation in limiting forces of lubricated sheets was in the range
of 2.5-5% for 25µm thickness and 4-6.5% for 50µm thickness from limits of dry
conditions. Considering the measured outputs of dome heights maximum forces, it can be
said that the calculated percent variations for both parameters were insignificant to affect

73
the microforming process. In other words, obtained results indicate that applying
lubrication to thin sheet microbulging does not affect the formability of thin sheets when
forming depth and maximum loading are the case. Furthermore, a consistent result was
obtained from the presented study. This result is a slight increase in forming heights of
bulged thin sheets when applying a lubricant; which agrees with investigations on
microextrusion testing of CuZn15 [16,17,73,74], where the conclusion was derived from
microextrusion of micropins after coating it with CrN, TiN, and DLC-Si (diamond like
carbon) coatings to increase the extrusion length.
Table 5-4 Variation in limiting values of lubricated bugled sheets from values of dry ones
Lubricant Variation in limiting dome-height (%) Variation in limiting force (%)25μm 50μm 25μm 50μm
WD-40 +3.5 +4.3 -2.7 +3.9 Teflon +1.3 +5.1 -5.0 +6.4

74
Figure 5- 9 Limiting forces (top) and dome heights (bottom) for dry and lubricated 25µm CuZn30 thin sheets at 15µm/s forming speed
2984.6 2905.3 2841.7
0
500
1000
1500
2000
2500
3000
3500
dry WD‐40 TEF
Force (g)
549.6 569.8 557.0
0
100
200
300
400
500
600
700
dry WD‐40 TEF
Displacem
ent (µm
)

75
Figure 5- 10 Limiting forces (top) and dome heights (bottom) for dry and lubricated 50µm CuZn30 thin sheets at 15µm/s forming speed
6107.4 6347.5 6498.7
0
1000
2000
3000
4000
5000
6000
7000
dry WD‐40 TEF
Force (g)
680.36 711.03 716.79
0
100
200
300
400
500
600
700
800
dry WD‐40 TEF
Displacem
ent (µm
)

76
5.6 Analysis of the Effect of Combined Process Parameters on Thin Sheet
Formability
After investigating the effect of process parameters in a separate manner, a more
thorough analysis of thin sheet formability by combining all investigated parameters was
considered. The variation of limiting values for 25μm and 50μm CuZn30 thin sheets with
varying parameters was characterized by three cases of comparison that incorporated
forming speed, sheet thickness, average grain size, and lubrication since all of them
influence material behavior in general. The first case presented a comparison under
constant thickness and average grain size while varying forming speed. In the second
case, the comparison was made at a constant speed with varying thickness, average grain
size d, and thickness-to-grain-size ratio λ. The third case directed the comparison under
constant thicknesses and average grain size while varying friction effects.
5.6.1 Constant Thickness and Grain Size with Varying Forming Speed
In this case, forming heights and projected forces decreased with increasing forming
speed. From this observation, size effects were said to be present, this result was not
obtained for macroscale testing of CuZn30. The behavior can be explained by the
mechanism of plastic deformation for polycrystalline materials. Since grains need to
rotate into its most preferred orientation in order to deform by slipping or twins, and
dislocations that pile up behind grain boundaries have to move to a certain slip system,
increasing the forming speed will cause grains to rotate faster and dislocations to move
faster too. The result is a faster development of slip systems within the microstructure
and therefore failure is obtained at a lower forming height and force. When the

77
proportionality between strain-rate and forming speed was considered, as deduced form
the definition of strain-rate, it can be said that increasing forming speed resulted in an
increased strain-rate. As a result, higher strain-rate sensitivity resulted in restricted
deformation, contrary to what is known about material behavior at the macroscale. It can
be said that with increasing miniaturization, higher forming speeds tend to restrict
deformation depth in thin sheet microforming.
Figure 5- 11 Comparison of limiting values of 25µm microformed CuZn30 sheets
Limiting values Forming speed (μm/s) 1.5 15 150 1500
Dome height (μm) 501.50 500.56 468.41 404.18 Force (gm) 2829.26 2709.30 2578.08 2378.22
Limiting values Forming speed (μm/s) 1.5 15 150 1500
Dome height (μm) 705.58 680.36 584.47 451.59 Force (gm) 6355.31 6107.37 5265.38 3688.09
Surface grains
Inner grains
25µm d = 8.2 λ = 3.1 1.5µm/s
25µmd = 8.2 λ = 3.1 150µm/s
25µmd = 8.2 λ = 3.1 15µm/s
25µm d = 8.2 λ = 3.1
1500µm/s
Figure 5- 12 Comparison of limiting values of 50µm microformed CuZn30 sheets
50µm d = 13.9 λ = 3.7 1.5µm/s
50µmd = 13.9 λ = 3.7 150µm/s
50µmd = 13.9 λ = 3.7 15µm/s
50µm d = 13.9 λ = 3.7
1500µm/s
Surface grains
Inner grains

78
Since both tested thicknesses demonstrated the same behavior (Figures 5-11 & 5-
12), the previous explanation is generalized for microformed CuZn30 thin sheets. The
drop in limiting heights and forces was stills greater for 50µm sheets than that of 25µm
ones and a steeper rate of decrease was detected for the thicker sheets (50µm), as
indicated earlier. The detected drop increase with increasing thickness can be explained
by comparing the thickness-to-grain-size ratio λ for both tested thicknesses. From Table
5-3, the λ ratio for 50µm and 25µm were 3.7 and 3.1 respectively. In other words, 50µm
thin sheets have more grains across its thickness than 25µm ones, therefore, more
dislocation density will be present at grain boundaries, which will result in more
hindering to grain deformation [47, 48].
5.6.2 Constant Forming Speed with Varying Thickness and Grain Size
Figure 5- 13 Comparison of limiting values of microformed CuZn30 sheets at 15µm/s
In this case, limiting heights and forces of CuZn30 tested sheets decreased with
decreasing thickness along with decreasing grain size and λ ratio (Figure 5-13) for all
tested speeds. As stated earlier, grain boundaries tend to act as obstacles to slip
Thickness (μm) λ d ( μm) Limiting height (μm) Limiting force (gm)25 3.1 8.2 500.56 2709.30 50 3.7 13.9 680.36 6107.37
50µmd = 13.9 λ = 3.7 15µm/s
25µmd = 8.2 λ = 3.1 15µm/s
Surface grains Inner
grains

79
dislocations, which are responsible for plastic deformation [47]. By considering the λ
ratio for both thicknesses, there were slightly more grains through sheet thickness for
50µm thin sheets than that through 25µm ones. Knowing that the planar geometry of the
bulged area is the same for both thicknesses and considering the grain size difference
(around 70%); we can say that 50µm deformed specimens had fewer deformed grains
than 25µm specimens, due to the clear variation in grain size and λ ratio. Hence, less
grain boundary density will be present in the 50µm deformed specimens and fewer
obstacles to slip dislocations will develop, which will lead to less needed forces for
deformation. Therefore, for thin sheet testing, we can say that limiting values increase
with increasing thickness and decreasing number of deformed grains.
5.6.3 Constant Thickness and Grain Size with Varying Friction Effects
Figure 5- 14 Comparison of limiting values of lubricated 25µm microformed CuZn30
In the case of varying friction effects by means of applying lubrication to the
bulge testing process, it can be seen in Figures 5-14 & 5-15 that the limiting values of
Lubrication Limiting height (μm) Limiting force (gm) Dry 549.6 2984.6
WD-40 569.8 2905.3 Teflon 557.0 2841.7
25µm d = 8.2 λ = 3.1 15µm/s
Lub: Teflon
25µmd = 8.2 λ = 3.1 15µm/s
Lub: WD‐40
25µm d = 8.2 λ = 3.1 15µm/s Lub: none
Surface grains
Inner grains

80
dome height and accompanying loading were not affected to a large extent. As presented
in Table 5-4, the percent variation in both parameters did not exceed 6.5% which can be
considered as a negligible value when compared to present readings. The explanation to
this material behavior, which is contrary to what is known about lubrication testing at the
macroscale, can be explained by the model of open and closed lubricant pockets model
proposed by Geiger et al. [1,75,78] as seen in Figure 5-16.
Figure 5- 15 Comparison of limiting values of lubricated 50µm microformed CuZn30
Since the tested as-received CuZn30 thin sheets, which were rolled into the
obtained thicknesses, did not demonstrate a completely flat surface, roughness peaks
develop on surfaces. These roughness peaks are accompanied by roughness valleys. At
the macroscale, applying lubrication to tested sheets will cover the roughness valleys
with trapped lubricant, and will consequently redistribute forming loads that reduces the
applied normal pressure. This behavior could not be achieved for the microformed thin
sheets in this study. The reason for this is that the hemispherical geometry of the forming
punch could not cover the roughness valleys and trap the lubricant. Instead, the lubricant
Lubrication Limiting height (μm) Limiting force (gm) Dry 6107.4 680.4
WD-40 6347.5 711.0 Teflon 6498.7 716.8
50µm d = 13.9 λ = 3.7 15µm/s
Lub: Teflon
50µmd = 13.9 λ = 3.7 15µm/s
Lub: WD‐40
50µm d = 13.9 λ = 3.7 15µm/s Lub: none
Surface grains
Inner grains

81
escaped from the asperities while the punch was applying deformation forces and only
roughness peaks. The presence of open pockets in lubrication testing is said to occur
where the deformation is applied on a free-surface workpiece, as seen in the microbulged
CuZn30 thin sheets.
Figure 5- 16 Open and closed lubricant pockets [1]
Table 5-5 Characterization of parameters effect for selected scenarios
Constant parameters Dome height Max force t d λ speedThickness and grain size ↑ ↑ - - - ↑ Forming speed ↑ ↑ ↑ ↑ ↑ -
5.7 Concluding Remarks
An investigation for identifying the influence of size effects on thin sheet
formability by varying identified key process parameters in microbulging of CuZn30 and

82
Al1100 was conducted. The identified parameters were forming-punch speed, sheet
thickness, grain size, and lubrication. In all performed tests, limiting dome-heights and
limiting forces of hemispherical-microbulged thin sheets were measured and presented
for comparison. From the obtained results, it can be said that altering the process
parameters in thin sheet formability at the microscale had an effect on the outputs of the
process. Analysis of Al1100 bulging profiles was not considered since it demonstrated an
inhomogeneous microstructure with elongated grains along thin sheets’ rolling direction;
resulting in an independent sensitivity of limiting values to forming speed. For
microbulging of CuZn30, limiting dome-heights and forces were dependent on the
forming speed. Both height and force limits decreased with increasing speed, which
indicated the size effects on miniaturization. The size effect was identified by the limited
dome height or forming depth with increasing forming speeds as miniaturization in
applied, which is opposite to the behavior of the same material at the macroscale.
Although the recorded reduction was in the range of 15-40%, considering the scale at
which the process is conducted gives a reason to regard these variations as partially
significant for thin sheet formability at the microscale level. The discovered speed
dependency was explained by the mechanism of plastic deformation. Sheet thickness
showed a major influence on microforming of thin sheets, similar to the macroscale.
Thickness effects were explained by the comparison of grain boundary density and
accompanying dislocations that assist in material deformation. Thicker sheets displayed
higher limiting dome-height but required higher forming loads than thinner ones.
Therefore, if a thinner sheet is utilized for loading limitations at the microscale, designers
and manufacturers should compensate for the reduction in formality, which might

83
sometime be within the allowable range as seen in the 10% reduction in limiting dome
height between 50µm and 25µm microformed CuZn30. It was concluded that the limiting
values increased with increasing thickness along with decreasing number of deformed
grains. Thicker sheets had a steeper trend of dropping limiting values with increasing
forming speed than thinner ones. This was explained by the increased limitation for
grains to rotate and deform in thicker sheets, since they demonstrated a higher grain
boundary density through thickness. The average grain size seemed to influence the
formability of thin sheets at microscale too, especially when the thickness-to-grain-size
ratio λ is considered. In order to obtain a certain dome height in CuZn30 testing, sheets
with a higher λ ratio needed higher forces for thin sheet deformation. This was due to the
increasing number of grains across thickness which consequently increases restrictions on
deforming grains too, as mentioned in Chapter Three. Lubrication did not impose a
significant effect on limiting forming loads and heights. This conclusion is based on
recorded variations of no more than 6.5% for both parameters between lubricant tested
thin sheets and dry tested ones. Open and closed lubricant pockets were the model by
which this behavior was explained. It was concluded that with increasing miniaturization,
lubrication starts to take less effect on lowering forming loads in thin sheet formability.
From this study it can be seen that incorporating the investigated process
parameters for characterizing formability at the microscale can be sufficient for uniaxial
testing, but is not enough to address the characterization of thins sheet formability with
formability regarded as biaxial since we are dealing with microscale thicknesses.
Therefore, investigations on surface strain limits will be conducted on microbulged thin
sheets in Chapter Six in order to expand the study on size effects. Again, the presented

84
information can be of extremely vital for “design for manufacturing” (DFM) techniques
for currently applied microforming processes; which mostly utilizes such statistical and
experimental information.
Copyright © Nasr AbdelRahman Shuaib 2008

85
CHAPTER SIX
CHARACTERIZATION OF THIN SHEET FORMABILITY AT THE
MICROSCALE LEVEL

86
6.1 Introduction
The need to overcome the drawbacks of using conventional macroscale testing
equipment to measure and characterize formability at the microscale was discussed in
Chapter Four. As a result, a microforming setup which demonstrates high precision and
tight tolerances was introduced to accommodate the requirements of microscale testing
and analysis. Since the 1950s, significant efforts were put into optimizing sheet metal
forming processes, which drew a substantial interest from researchers as well as related
industries [38-45]. Eventually, several methods and apparatus were introduced for
characterizing sheet formability. In Chapter Three, one of these methods was used for
analysis. Yet again, applying any of the conventional methods cannot accommodate the
highly regarded requirements of accurate thin sheet formability at the microscale level, as
mentioned in Chapter Four. Also since there is an increasing interest in utilizing
microforming processes for the micromanufacturing industry, a more suitable method for
characterizing sheet formability at the microscale is needed. In this study, an innovative
approach towards characterizing formability of thin sheets for microforming applications
is introduced. This approach is manifested by a microforming setup which was designed
and built for conducting micro-bulge forming tests on thin sheets (Chapter Four). The
testing procedure is complemented by a photolithography process, an electron
microscopy technique, as well as a state of the art method for measuring surface strain
limits at the microsclae level using an automated-strain-measurement commercial
software package along with a designed and fabricated micro-target element which is
responsible for identifying curved surfaces for accurate measurement of strain limits. The

87
proposed method, which was based on scaling down the strain measurement technique
according to the ISO: 12004 standard for determining forming limit diagrams [76], is
ultimately meant for constructing FLDs at the microscale level, which can be applied as a
predictive tool that will eliminate the empirical techniques that are currently
administered, and is expected to eventually lower the overall manufacturing cost. In this
study, a new method for characterization of thin sheet formability is introduced.
Investigation of size effects on limiting surface strains in thin sheet formability by
considering the sheet thickness, average grain size, and lubrication was addressed as a
major part of the overall objective for optimizing thin sheet formability at the microscale
level.
6.2 Experimental Procedure
The proposed procedure is similar to the conventional method of sheet formability
testing of metal alloys in automotive applications by determining FLDs with the
exception of the varying geometrical sale. Existing microscale techniques as well as
newly developed ones were incorporated for characterizing formability at the microscale.
The procedure is divided into four major stages: Photolithography for thin sheet marking,
microforming for thin sheet deformation testing, SEM imaging for failure capturing, and
formability analysis for calculating surface strain limits. Tested material was CuZn30
with 25µm and 50µm thicknesses. Detailed description on the procedure is presented in
the subsequent sections.
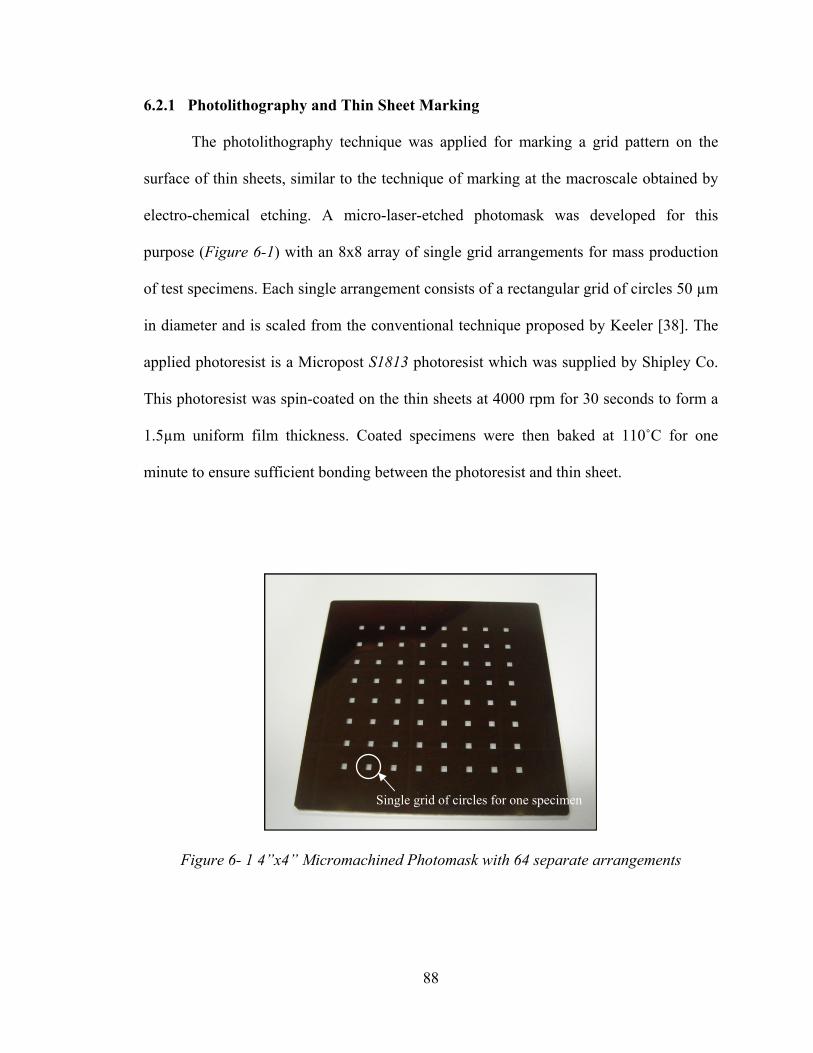
88
6.2.1 Photolithography and Thin Sheet Marking
The photolithography technique was applied for marking a grid pattern on the
surface of thin sheets, similar to the technique of marking at the macroscale obtained by
electro-chemical etching. A micro-laser-etched photomask was developed for this
purpose (Figure 6-1) with an 8x8 array of single grid arrangements for mass production
of test specimens. Each single arrangement consists of a rectangular grid of circles 50 µm
in diameter and is scaled from the conventional technique proposed by Keeler [38]. The
applied photoresist is a Micropost S1813 photoresist which was supplied by Shipley Co.
This photoresist was spin-coated on the thin sheets at 4000 rpm for 30 seconds to form a
1.5µm uniform film thickness. Coated specimens were then baked at 110˚C for one
minute to ensure sufficient bonding between the photoresist and thin sheet.
Figure 6- 1 4”x4” Micromachined Photomask with 64 separate arrangements
Single grid of circles for one specimen
89
The coated specimens were then exposed to ultra-violet rays through the
photomask and were baked at 110˚C for one minute. This caused the exposed part of the
photoresist to nucleate. The final stage of thin sheet marking was specimen developing,
where exposed coated specimens were immersed into an AZ400 positive developer
provided by DATAK Corporation for one minute. This resulted in a well bonded and
defined pattern of circles as seen in Figure 6-2. Figure 6-3 details the steps for achieving
well defined markings on the specimens. A detailed procedure for thin sheet marking is
described in Appendix VIII. This marking technique resembled the spray painting
technique for capturing in-situ deformation using the ARAMIS® [77] optical deformation
and strain measurement system where a random pattern with well defined contrast has to
be applied on the surface for characterizing formability.

90
Photo mask
(a)
(b)
Figure 6- 2(a) Photolithography process and (b) Micro-grid pattern on a developed thin sheet surface
100µm
Substrate
Substrate
Substrate
Photoresist
Photoresist
UV Light
Developed surface
Micro-grid pattern

91
Figure 6- 3 Procedure for achieving grid markings on the tested thin sheets
Uniform coating?
NO
YES
Substrate cleaning and drying
Spin coating at 4000rpm for 1 min
Baking specimen at 100˚C for 1 min
Expose UV rays through photomask
Specimen Baking at 100˚C for 1 min
Substrate developing
Microscopic inspection

92
6.2.2 Microforming of Test Specimen
For the microforming process, as described in details in Chapter Four, marked
specimens were prepared by cutting them into 9x9mm size and clamping them between
the two die halves before applying the bulging process that is controlled electronically
and is stopped at a certain level of force drop; usually between 10 and 15%. Extra care
was taken while cutting, mounting, and transferring specimens in order to preserve the
micro grid-markings before and after testing. Specimens were then stored in containers in
order to be examined in the following stage. Figure 6-4 shows how the specimen is
mounted onto the die before placing the latter onto the kinematic coupling grooves and
performing the microbulge test.
Figure 6- 4 Specimen mounting and die placement before microforming

93
6.2.3 Failure Capture by SEM Imaging
Scanning electron microscopy was used to assist in capturing the failure area on
tested thin sheets. Images of the deformed specimen at the vicinity of the formed crack
were captured using a HITACHI S3200 SEM machine (Figure 6-5). Figure 6-6 shows
an SEM image of a deformed sheet around the area of diffuse necking. By identifying
random cracking of some deformed circles, it can be said that the layer of markings was
sufficiently bonded onto the thin sheets, and according to the photoresist’s physical
properties, the marking layer should deform with the thin sheets in a continuum manner.
Experimental verification to the bonding issue will be presented in the next section.
Figure 6-6 shows some parts of a bulged specimen which had the markings chipped off
while preparing the specimen for testing as well as SEM imaging.
Figure 6- 5 HITACH S3200 SEM

94
Figure 6- 6 SEM images of (a) micro-bulged thin sheet at failure, and (b) chipped off markings
6.2.4 Analysis of Deformed Thin Sheets
Preliminary analysis of the deformed grids were conducted by manual
measurement of deformed circles around the formed crack from SEM images which
yields limiting surface strains, assuming flat surfaces around the crack region. The results
and analysis of this method of strain measurement will be presented in the following
section. To accommodate for three-dimensional measurement in calculating surface
strains of the deformed grids, which is an essential requirement for assuring proper and
correct results, the ASAME (Automated Strain Analysis and Measurement Environment)
(a)
(b)

95
software was used, as described previously in Chapter Three for determining strain limits
of bulged sheets at the macroscale. In order for the software to measure strains
accurately, a target element that enables the software to recognize accurate strain
measurement in three-dimensional space is required. The target element has a size of
25mm side and contains an identified grid as seen in Figure 6-7. The deformed grids of
microformed specimens could not be captured by a conventional digital camera, therefore
SEM imaging was used to identify the deformed grids around the crack area instead, and
a cubic target which can be viewed around the vicinity of the micro crack was needed.
For this purpose, a microscale target element was designed with a 50 times scaling factor
from the actual macroscale target resulting in a 500µm micromachined target element.
This microtarget element was scaled down accordingly with the scaling of the circular
grid pattern so that the transferred images would hold the same proportions to macroscale
dimensions. Only three faces of the micro-target were micromachined on a corner of a ¼”
steel cube. This provides the ASAME software with the required three faces for target
recognition as well as the ease of target handling due to its critical size. Figure 6-7 also
shows an SEM image of the developed micro target element along with commercial one
for size comparison. Figure 6-8 demonstrates an actual bulged specimen along with the
microtarget in an SEM image. Figure 6-9 shows the output of automatically determined
surface strain limit measurements using the ASAME software.

96
(a)
(b)
Figure 6- 7(a) Comparison between conventional target and micro-target element, and
(b) SEM image of the micro-target element
Microbulged sheet on top of target element

97
Figure 6- 8 SEM image of microbulged thin sheet along with microtarget
Figure 6- 9 Automatically determined strain limits using ASAME software

98
6.3 Characterization of Strain limits of Microformed Thin Sheets
Following the proposed method for determining surface strain limits of
microformed thin sheets, actual testing was initiated on thin sheets of CuZn30 which is,
as previously stated, of major significance in electronic and MEMS applications. The
investigation was initiated by establishing a proper justification for incorporating the
automatic strain measurement concept over manual calculation as a feasible method for
determining strain limits at the microscale. Following the procedure described above, thin
sheet formability testing was conducted on 25µm and 50µm thicknesses under varying
selected parameters: thickness, grain size, and lubrication.
6.3.1 Testing of automatic strain measurement and marking techniques
Surface strain measurements with manually calculated strain limits for the
deformed CuZn30 thin sheets are presented on the FLD shown in Figure 6-10. A
horizontal scatter in the forming limit values was identified for that range of values in the
FLD. The observed large scatter could be due to calculation errors arising from the
assumption of flat surfaces around apparent cracks. It also could be due to the size effects
on scatter in microforming processes, as described by Geiger et al. [1]. These authors
discovered an increasing data scatter with increasing miniaturization while determining
mechanical properties. Since the manual method of calculation is subjective and depends
on how the three dimensional measurement of strain limits for the deformed grids is
identified, the ASAME software was utilized to assure correct measurements. Figure 6-
10 shows two sets of automatically determined strain limits under the same process
conditions of the manually determined strain limits. The automatically calculated strain

99
limits clustered around a line with a slope which represents a biaxial strain ratio (ε1/ε2=1).
As a result, a justification for obtaining a more accurate method for determining thin
sheet formability at the microscale was made viable; especially when confirmed with
results of repeated tests.
Figure 6- 10 Strain limits of microbulged sheets determined by manual and automatic calculations
The next step in testing the new automatic method was to verify adequate bonding
between the photoresist markings and thin sheet specimens to prevent any shearing effect
between them and to ensure proper representation of thin sheet formability by grid
deformation. This was accomplished using test specimens marked by two different types
of commercial photoresists. The first one was a Micropost S1813® positive photoresist
0
10
20
30
40
-40 -30 -20 -10 0 10 20 30 40
Maj
or S
trai
n
Minor Strain
Automatic 1
Automatic 2
Manual

100
provided by Shipley Co. while the second was an AZ5214® positive/negative photoresist
provided by DATAK Corporation. The photolithography process described in Section
6.1.1 and Appendix IX was used to mark the specimens. The marked specimens for each
photoresist were then microbulged up to failure points. Consequently, automatic strain
measurements were then performed on the tested specimens to determine their surface
strain limits. Figure 6-11 shows a plot of strain limits for a microformed 25µm CuZn30
thin sheet with S1813 and AZ5214 positive photoresists. The lower bounds of strain limits
are represented by surface strains calculated at 100µm away from the diffuse necking
point, or tip of the crack. It can be concluded that the strain limits for the two types of
photoresist markings were somewhat identical because they occupied the same region on
the presented FLD (Figure 6-11), although they had different chemical compositions.
From this observation, it can be concluded that the bonding of S1813 photoresist is
sufficient enough to be regarded as part of the deformed thin sheets during the
microforming process, and that the geometrical representation of surface strains by the
photoresist marking is considered feasible under the given experimental conditions.

101
Figure 6- 11 Comparison of strain limits for S1813 and AZ5214 photoresist markings on 25µm CuZn30 thin sheets
6.3.2 Results and data collection
Formability testing using the proposed microbulging method was conducted on
CuZn30 at 25µm and 50µm thicknesses. Allowable strain limits, or lower bound limits,
were designated as surface strains of deformed circles located at 100µm away from the
developed crack. Figure 6-12 shows strain limits of 25µm and 50µm CuZn30 tested
sheets. The allowable strain ratios for hemi-spherically bulged samples are bounded by
the lines of critical strain limits, which define the critical strain ratios for biaxial
deformation, and consequently the marked safe regions were mapped on the FLD.
0
10
20
30
40
50
60
70
80
‐40 ‐30 ‐20 ‐10 0 10 20 30 40
Major Strain
Minor Strain
S1813
AZ5214

102
Figure 6- 12 Strain limits of microbulged CuZn30 thin sheets
In order to incorporate both size effects and friction on surface strain limits with
this investigation, an additional set of experiments with lubrication testing of the same
thicknesses was added. Du Pont Teflon® lubricant was particularly chosen for testing the
effect of lubrication because it is commonly used in the construction of FLDs to expand
strain limits of balanced biaxial stretching conditions beyond its dry forming limits [49,
69-72]. For each test, a marked specimen was clamped inside the die and placed on the
kinematic coupling grooves on the microforming fixture, and then a drop of Teflon was
added to punch-sheet interface side of the specimen. Due to the sufficient clamping of the
specimen between the die halves, the rest of the specimen surface was sealed from any
0
10
20
30
40
50
60
70
80
‐40 ‐30 ‐20 ‐10 0 10 20 30 40
Major Strain
Minor Strain
CuZn‐25µm
CuZn‐50µm
Safe region

103
lubricant contamination that can affect the gripping characteristics of the die. At the end
of each test, the die had to be cleaned with alcohol to eliminate any presence of lubricants
in the die cavity. For comparison and data analysis, strain limits of 25µm and 50µm
lubricated specimens were plotted along with dry tested sheets, as seen in Figure 6-13.
Again, for each case, the microbulging test was repeated three times for assessing
statistical scatter. The limiting points that are presented on the FLD represent the extreme
formability case, considering a biaxial state of deformation. Straight lines with a slope of
unity were plotted for each case as an indicator to the deformation state. To analyze size
effects on thin sheet formability from a surface strain limit point of view, strain limits of
dry macroformed thick sheets, which were determined and presented in Chapter Three,
were plotted along with the limits of the microbulged thin sheets in Figure 6-14.
Figure 6- 13 Strain limits of 25µm and 50µm CuZn30 thin sheets in dry and lubricated (Lub) states
0
10
20
30
40
50
60
70
80
‐40 ‐30 ‐20 ‐10 0 10 20 30 40
Major Strain
Minor Strain
CuZn25µm‐DryCuZn50µm‐DryCuZn25µm‐LubCuZn50µm‐Lub

104
Furthermore, to investigate size effects on friction for sheet formability, another
set of formability tests were conducted on 2mm, 1mm, and 200µm thick sheets on the
Tinius-Olsen cup test by following the same steps that were discussed in Chapter Three.
The added task in this set of experiments was applying a lubricant to the punch-sheet
interface side of the specimen. The lubricant used was Du Pont Teflon®, which was
sprayed onto the specimen surface. Strain limits of macroformed lubricated sheets were
determined automatically using the conventional method presented in Chapter Three
where the ASAME software was used. Figure 6-15 shows a FLD with strain limits of all
tested thicknesses of each scale at dry and lubricated conditions. The presented data were
considered as the required results for addressing size effect on surface strain limits, or
formability, at the microscale.
Figure 6- 14 Strain limits of microbulged CuZn30 thin sheets (25µm and 50µm thickness) and macrobulged CuZn30 sheets (2mm, 1mm, 200µm) under dry conditions
0
10
20
30
40
50
60
70
80
‐40 ‐30 ‐20 ‐10 0 10 20 30 40
Major Strain
Minor Strain
2mm
1mm
200µm
50µm
25µm
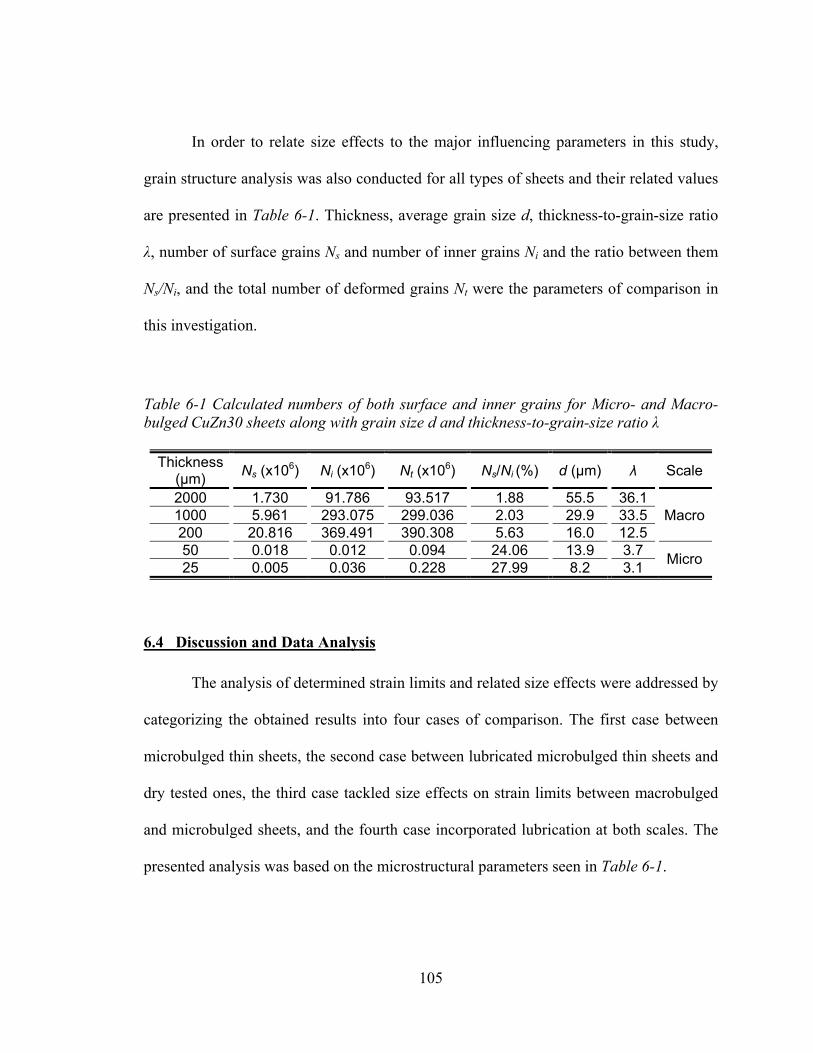
105
In order to relate size effects to the major influencing parameters in this study,
grain structure analysis was also conducted for all types of sheets and their related values
are presented in Table 6-1. Thickness, average grain size d, thickness-to-grain-size ratio
λ, number of surface grains Ns and number of inner grains Ni and the ratio between them
Ns/Ni, and the total number of deformed grains Nt were the parameters of comparison in
this investigation.
Table 6-1 Calculated numbers of both surface and inner grains for Micro- and Macro- bulged CuZn30 sheets along with grain size d and thickness-to-grain-size ratio λ
Thickness (µm) Ns (x106) Ni (x106) Nt (x106) Ns/Ni (%) d (µm) λ Scale
2000 1.730 91.786 93.517 1.88 55.5 36.1 Macro1000 5.961 293.075 299.036 2.03 29.9 33.5
200 20.816 369.491 390.308 5.63 16.0 12.5 50 0.018 0.012 0.094 24.06 13.9 3.7 Micro 25 0.005 0.036 0.228 27.99 8.2 3.1
6.4 Discussion and Data Analysis
The analysis of determined strain limits and related size effects were addressed by
categorizing the obtained results into four cases of comparison. The first case between
microbulged thin sheets, the second case between lubricated microbulged thin sheets and
dry tested ones, the third case tackled size effects on strain limits between macrobulged
and microbulged sheets, and the fourth case incorporated lubrication at both scales. The
presented analysis was based on the microstructural parameters seen in Table 6-1.

106
Figure 6- 15 Strain limits of microbulged CuZn30 thin sheets (25µm and 50µm thickness) and macrobulged CuZn30 sheets (2mm, 1mm, 200µm) for both dry and lubricated states
6.4.1 Microbulged thin sheets with varying thickness
Considering formability of CuZn30 microbulged thin sheets at the microscale,
formability decreased with decreasing sheet thickness as seen in Figure 6-12, similar to
the behavior of sheet formability at the conventional macroscale level presented in
Chapter Three [39-45]. A wider range of permissible strain ratios can be applied on 50µm
thin sheets when compared to 25µm ones; by identifying the safe region below failure
point which occupied a bigger area for 50µm tested specimens (Figure 6-12). Still, a
correlation between the allowable strain ratios taken from FLD diagrams and limiting
0
10
20
30
40
50
60
70
80
‐40 ‐30 ‐20 ‐10 0 10 20 30 40
Major Strain
Minor Strain
2mm‐Dry
1mm‐dry
200µm‐Dry50µm‐Dry
25µm‐Dry

107
force and depth analysis (Chapter Five), as well as sheet thickness, has to be established
in order to optimize the microforming process, especially knowing that part size and
weight are of significant interest when considering micro-components assembly. In terms
of values of strain limits, around 100% increase in stretchability for both major and minor
strains was achieved by doubling the thickness of a 25µm CuZn30 thin sheet (Figure 6-
12), which may provide more flexibility in the complexity of a microformed part. On the
other hand, the mass of the processed part will also double, which may exceed the weight
requirements for an assembled microscale structure.
Figure 6- 16 Comparison between parameters of microbulged thin sheets
To explain the behavior of CuZn30 in this case, microstructural parameters were
considered (Figure 6-16). The higher formability of 50µm thin sheets in comparison with
25µm, was accompanied by a lower share of surface grains, which was the case in
formability ranking of macroscale tested sheets of the same alloy, as was concluded in
Chapter Three. The total number of deformed grains seemed to influence formability
limits. Since the number of grains in the deformed volume of 50µm thin sheets was
50 μm 25 μm Ns/Ni (%) 24.06 27.99 Nt (x106) 0.094 0.228
50µmd = 13.9 λ = 3.7
25µmd = 8.2 λ = 3.1
Surface grains Inner
grains

108
almost half of that of 25µm, the accompanying lower grain boundary density, which
affects the deformation of grains by locking dislocations, allowed for higher deformation
strains and eventually better formability. From this observation, it can be said that at the
microscale, not only thickness affects the formability of thin sheets, but also the total
number of deformed grains has a significant effect on ranking the formability of
microformed thin sheets. The share of surface grains did not affect the formability limits
in this case. This effect is more dominant at the microscale than that at the macroscale
level and seems to appear in coarse-grain microstructures, which agrees with
macroformed coarse-grained CuZn30 sheets presented in Chapter Three. In general
limiting strains decreased with decreasing grains size and λ ratio.
Table 6-2 Effect of lubrication on strain limits of micro- and macrobulged CuZn30 sheets
Thickness (µm) Increase in formability (%) λ Nt (x106) Scale Major Strain Minor Strain2000 43.8 107.1 36.1 93.517
Macro1000 30.7 83.3 33.5 299.036 200 25.0 80.0 12.5 390.308 50 18.0 70.0 3.7 0.094 Micro 25 15.4 33.3 3.1 0.228
6.4.2 Microbulged thin sheets in dry and lubricated conditions
It was possible to predict that lubricating CuZn30 test specimens prior to its
forming results in better formability (Figure 6-13) although the variations in limiting
forces and dome heights were said to be negligible, as mentioned in Chapter Five.
Although the limiting dome heights of the tested CuZn30 showed a slight increase of 2%
for 25µm specimens and 5% for 50µm specimens, surface strain limits showed an

109
increase of 15% in major strain and 33% in minor strain for 25µm specimens, and an
18% in major strain and 70% in minor strain for 50µm specimens (Table 6-2).
Considering scale issues in microforming processes, it can be said that the increase in
formability can be extremely utilized for material processing at the microscale level. By
looking at the extension of strain limits by lubrication, strain limits of lubricated
specimens increased more in the minor strain axis. This might mean that formability
enhancement is also governed by the microstructure of the tested specimens; with only
three or four grains across sheet thickness in this case. In other words, enhancing the
formability of a coarse-grained thin sheet by lubrication will increase the formability in a
certain strain direction more than in the transverse direction. The explanation to the effect
of lubrication can be understood by incorporating the model of open and closed lubricant
pockets [1, 75, 78]. Although it was mentioned in Chapter Five that the microforming of
lubricated CuZn30 thin sheets, that were considered as free-surfaces, could not contain
the lubricant in roughness valleys to take advantage of the lubrication process, there
seemed to be some surface pockets that did occupy the applied lubricant; causing them to
be closed pockets. The result of such an assumption is a uniformly distributed load at the
closed pockets which can be utilized in grain deformation instead of plastically flattening
roughness peaks. Since the distributed load will act on a fewer number of deformed
grains for the 50µm thin sheet when compared with 25µm thin sheets (Figure 6-16), the
lower restriction on grain deformation will result in a higher increase in strain limits. In
general, the increased effect of strain limits by lubrication seemed to decrease with
decreasing thickness.

110
6.4.3 Microbulged thin sheets vs. Macrobulged sheets
Figure 6- 17 Comparison between microformed and macroformed CuZn30 sheets
From the FLD in Figure 6-14, the trend of decreasing formability for spherically
bulged sheets with decreasing thickness was clearly identified for both scales separately.
Interestingly, strain limits of the microformed thin sheets were superior to that of
macroformed ones, and did not follow the ranking of decreasing strain limits with
decreasing thickness for macroformed sheets. The main reason for this behavior is the
size effect in terms of a 50 fold geometrical scaling between the two scales. This is why
the ranking of formability for the tested sheets at both scales could not be compared
according to their thickness-to-grain-size ratios λ as seen in Figure 6-17. The reason for
2000 μm 1000 μm 200 μm 50 μm 25 μm Ns/Ni (%) 1.88 2.03 5.63 24.06 27.99 Nt (x106) 93.51 299.52 390.31 0.094 0.228
λ 36.1 33.5 12.5 3.7 3.1
2mm λ = 36.1
d = 55.5µm
1mm λ = 33.5
d = 29.9 µm
200µm λ = 12.5 d = 16µm
Microformed
Macroformed
50µm d = 13.9 λ = 3.7
25µm d = 8.2 λ = 3.1
111
the superior strain limits of the microformed thin sheets could be due to the significantly
lower density of grain boundaries, resulting from having a lower number of deformed
grains in its deformed volume, especially knowing that dislocations moving through
grains tend to pile up at grain boundaries and retard the initiation of slip for plastic
deformation [1, 18, 19, 37]. In this study, the surface layer model [1, 18, 19, 78] could
not be validated for microformed thin sheets. The increase in surface-to-inner grain ratio
Ns/Ni did not affect strain limits at the microscale (Figure 6-17). However, although
50µm and 25µm microformed sheets showed a high strain limit in the major strain
direction, the strain limits were more restricted in the minor strain direction. This
restriction might be due to the coarseness of the microstructure in microformed thin
sheets, where grains occupy a bigger volume in the deformed samples and can result in
an anisotropic behavior according to how grains will rotate to deform at its preferred
orientation.
6.4.4 Microbulged thin sheets vs. macrobulged sheets in dry and lubricated
conditions
The amount of increase in strain limits varied with thickness as well as
geometrical scale. From Table 6-2, the increase in strain limits for all tested cases seemed
to increase with increasing thickness and λ ratio. This relationship cannot be taken into
perspective, since the geometrical scale eliminates the basis of comparison. Instead, by
comparing the increase in strain limits of macroformed sheets to microformed thin sheets,
it can be said that the increase in formability was greater for macroformed sheets (1mm,
2mm, and 200µm). The reason for this observation is due to better utilization of the

112
applied lubricant in macroformed sheets as seen in the model of open and closed
lubricant pockets. For macroscale testing, the applied lubricant seemed to cover more
roughness valleys than that in the case of microscale testing because the depths and
widths of these valleys are almost negligible when compared surface area of the forming
punch (60mm). Therefore, the applied film of lubricant will assist more in distributing the
forming load, and consequently, increasing forming limits. On the other hand, applying
the lubricant film in microscale geometries will not assist in distributing the load as
efficient as in the case of macroscale geometries, hence, the increase in formability limits
will be limited. This observation validates what is known about the decreasing ductility
with increasing miniaturization in the form of increased brittleness. This brittleness can
affect formability limits, but is still dependent on the type of material. Independent of the
incorporating thickness and λ ratio in this comparison, a trend of decreasing ductility with
increasing miniaturization was observed in thin sheet formability testing at the
microscale. This result coincides with what is known about size effects on bulk
microforming [1, 7, 9, 12, 13, 14, 18, 19]. In all cases, strain limits of microformed thin
sheets were lower than that of macroformed sheets.
6.5 Concluding Remarks
A newly developed method for characterizing thin sheet formability at the
microscale was introduced in this chapter. This method overcomes the obstacles and
disadvantages that usually surface when considering micro-formability testing on
conventional macroscale machines and apparatus. The method consists of four separate
techniques. The first technique is a photolithography process for thin sheet marking with

113
a rectangular array of 50µm circles. The second technique is a microforming process of
thin sheets by bulging until the initiation of a crack on its surface. The third technique is
an imaging process using a SEM for failure capturing of deformed circles around the
vicinity of the identified crack. The fourth technique is an automatic strain measurement
process using ASAME commercial software and a developed microtarget to account for
curved surfaces and 3D measurements. Strain limits of CuZn30 with 25µm and 50µm
thicknesses were achieved for dry formed specimens and lubricated specimens. Size
effects were addressed from various aspects of affecting process parameters. Considering
the thickness, thicker sheets showed better formability limits than the thinner sheets. This
was due to the decreasing grain boundary density of thicker sheets resulting from the
decreasing number of deformed grains in the deformed volume, similar to the behavior of
macroformed CuZn30 sheets. Correlation of allowable strain ratios and materials’ size
and weight can be made for especially in microscale assembly, and with imposed weight
limitation. Lubrication seemed to enhance the formability of the microformed thin sheets.
From the model of open and closed lubricant pockets, it was concluded that some surface
pockets did occupy the applied lubricant, although the process was an open die forming
process that cannot trap the lubricant between the die and tool, and more loading was
distributed on the surface to act on the deformation of grains instead of plastically
deforming roughness peaks. The increase in strain limits that was obtained with
lubrication dropped with decreasing thickness due to the increasing restriction of the
grains for 25µm thin sheets which are larger in number than that of the 50µm ones. Strain
limits of the microformed thin sheets were superior to that of macroformed ones, and did
not follow the trend of decreasing formability with decreasing thickness due to the

114
geometrical size effects. Size effects on strain limits between microformed and
macroformed CuZn30 could not be deduced from comparison according to thickness,
grain size d, and thickness-to-grain-size ratio λ. However, size effects on thin sheet
formability at the microscale were identified by considering open and closed pockets
model. Lubrication had less effect with increasing miniaturization, where percent-
increase in strain limits by using lubrication decreased with decreasing geometrical scale
due to the less utilization of applied lubricants by roughness valleys at the microscale.
The identified size effects in this study should be considered when ranking the
formability of different sheet metals in favoring material selection for particular
microforming process. Determining strain limits for other strain ratios should enable
constructing FLDs which would demonstrate all allowable strain ratios for a certain
material. And this will ultimately eliminate the costly trial and error process of
determining those allowable stresses.

115
Copyright © Nasr AbdelRahman Shuaib 2008
CHAPTER SEVEN
HIGH TEMPERATURE MICROFORMING AND ANALYSIS OF MATERIAL
BEHAVIOR AT ELEVATED TEMPERATURES

116
7.1 Introduction
Early studies that focused on utilizing the advantages of achieving superior
ductility and lowering forming loads by conducting high temperature testing at the
microscale level have been reported in investigations by [27-37, 83-87]. Although their
studies covered utilizing the Newtonian viscous flow of amorphous alloys at the
microscale, applying bulk microforming techniques at higher temperatures, laser forming,
and flow stress characterization through compression tests at elevated temperatures, there
was a very minor emphasis on high temperature microforming of thin sheets. By utilizing
the advantages of high temperature forming of thin sheets at the microscale, better
optimization of material processing for microparts can be achieved, especially for
structures that require highly intricate geometries and configurations. In this study, a new
initiative to study size effects on high temperature microforming of thin sheets will be
presented. The overall objective of this initiative is to develop a suitable testing method
for characterizing thin sheet formability at high temperatures for microsclae applications.
The ultimate achievement behind this objective is to be able to produce forming maps
that could predict limits of superplasitcally formed thin sheets for more effective and
efficient microscale manufacturing of components and parts. In this study, a testing
method for performing high temperature microscale-testing of thin sheets and
characterizing formability through surface strain limits was introduced. Thin sheets of
CuZn30 were tested at 25µm and 50µm thicknesses at 100˚C and 150˚C which are
regarded as warm forming temperatures for such an alloy, since forming temperatures did
not go as high as it is for superplastic forming range, which is 0.5-0.7 of its melting

117
temperature [89]. The focus of this investigation was the analysis of size effects on thin
sheet formability through measured loading profiles and surface strain limits. The
identified key parameters in this study were forming speed, forming temperature, sheet
thickness, and microstructural parameters.
7.2 Experimental Apparatus and Procedure
In order to accomplish the goal of this study a high temperature testing module
was added to the existing microforming setup that was introduced in Chapter Four. This
module is based on heating the test specimens, or thin sheets, through heating the die
where the specimens are clamped within. Heat is conducted into the inside of the die by a
SunRod® cartridge electric heater provided by Sun Electric Heater Co. The cartridge
heater has a diameter of 1/8” and is press fit into the side of the die. Heating temperature
is controlled by a developed electronic control circuit. The control circuit induces the
required voltage and electric current for the cartridge heater to heat the die depending on
a feedback system in the form of a temperature sensor (known as a thermistor) which is
placed inside the die. Upon achieving the required temperature, the temperature sensor
gives a signal to the circuit to cut off the voltage; or turn the voltage on in case the
temperature drops below the required value. For each test, the required temperature was
set manually by setting an equivalent resistance on the potentiometer of the electronic
control unit. The setup was calibrated and monitored using an external digital
temperature-reader which is connected to a thermocouple that had contact with the base
of the test specimen through the die hole. The calculated uncertainty for acquiring a
desired heating temperature was in the range of ±3% error of the applied temperature.

118
Figure 7-1 shows how the cartridge heater and temperature sensor are connected to the
forming die. The arrangement of a typical high temperature test is presented in Figure 7-
2, showing the high temperature module integrated into the existing microforming setup.
Figure 7- 1 Microforming setup with high temperatures testing apparatus
Cartridge heater
Temperature control element
(Thermistor)
Thermocouple

119
Figure 7- 2 High temperature testing module along with the developed microforming setup
For each microforming test, test specimens were kept inside the heated die for 10
minutes prior to initiating the test in order to establish a stable forming temperature. Due
to the limitation of the heating capacity of the cartridge heater to 160˚C, testing of
CuZn30 with both 25µm and 50µm thicknesses was conducted at 100˚C and 150˚C,
which are regarded as warm forming temperature for such an alloy. Testing at these
temperatures may provide combined advantages of both cold and hot forming.
7.3 Study of Effects of Warm Temperature on Parameters of Microformed Thin
Sheets
In this study, two cases were regarded for identifying the effect of warm
temperature testing on thin sheet formability at the microscale, depending on the
Temperature control unit
High temperature microforming setup

120
variability of the following parameters; forming speed, forming temperature, and sheet
thickness.
7.3.1 Effect of Warm Temperature with Varying Forming Speeds
Loading profiles for tested CuZn30 thin sheets at 100˚C and 150˚C are shown in
Figures 7-3 & 7-4 for 25µm thicknesses and Figures 7-5 & 7-6 for 50µm thicknesses.
Numerical values of extracted limiting dome-heights and forces are presented in Tables
7-1 & 7-2 for 25µm and 50µm thicknesses respectively. From the presented plots, it is
obvious to say that for all tested sheets; higher temperature microforming affected the
form of bulging profiles with varying forming speed. Force-displacement curves were
ranked according to the applied forming speed. The result was higher forming loads
corresponding to same displacement with increasing forming speed and in some cases,
higher limiting dome height.
Figure 7- 3 Loading profiles for 25µm CuZn30 thin sheets at 100˚C
0
500
1000
1500
2000
2500
3000
0 100 200 300 400 500 600 700
Force (g)
Displacement (µm)
1.5 μm/s15 μm/s150 μm/s

121
Figure 7- 4 Loading profiles for 25µm CuZn30 thin sheets at 150˚C
Figure 7- 5 Loading profiles for 50µm CuZn30 thin sheets at 100˚C
0
500
1000
1500
2000
2500
3000
0 100 200 300 400 500 600 700
Force (g)
Displacement (µm)
1.5 μm/s
15 μm/s
150 μm/s
0
500
1000
1500
2000
2500
3000
0 100 200 300 400 500 600 700
Force (g)
Displacement (µm)
1.5 μm/s15 μm/s150 μm/s

122
Figure 7- 6 Loading profiles for 25µm CuZn30 thin sheets at 150˚C
This observation is contrary to what was obtained from testing at room
temperature (Chapter Five). The reason for the variation of bulging profiles with varying
forming speed is due to the presence of additional thermally activated slip systems, which
vary with varying heating temperature [37, 47, 48]. The resulting trend is a higher ranked
profile with increased forming speed. As forming speed is increased, the added
dislocations developed by the thermally activated slip systems will move faster behind
grain boundaries of the faster rotating grains. These dislocations will pile up and act in
opposing the applied deformation forces, resulting in higher forces for plastically
deforming those grains. This trend was not obtained for 50µm microbulged sheets at
100˚C, as seen in Figure 7-5. For the aforementioned batch, the defying behavior of
closely packed profiles at 1.5µm/s and 15µm/s forming speed could have been due to
0
500
1000
1500
2000
2500
3000
0 100 200 300 400 500 600 700
Force (g)
Displacement (µm)
1.5 μm/s15 μm/s150 μm/s

123
statistical and/or measurement errors, or it might have been due to the lack of enough
activated slip systems to induce plasticity forces on such a thicker sheet when compared
to 25µm ones.
Table 7-1Numerical values of limiting dome heights for CuZn30 tested sheets at elevated temperatures
Forming speed (μm/s)
Limiting dome height (μm) 25˚C 100˚C 150˚C
25μm 50μm 25μm 50μm 25μm 50μm 1.5 499.50 669.19 478.00 544.46 413.40 556.79 15 497.00 680.36 505.78 553.16 418.36 561.91
150 468.41 584.47 495.44 619.42 426.39 610.11
Table 7-2 Numerical values of limiting forces for CuZn30 tested sheets at elevated temperatures
Forming speed (μm/s)
Limiting force (gm) 25˚C 100˚C 150˚C
25μm 50μm 25μm 50μm 25μm 50μm 1.5 2829.26 6228.44 1893.36 2049.00 711.00 1882.41 15 2709.30 6107.37 2161.94 2119.48 898.30 2087.26
150 2579.08 5265.38 2405.47 2504.68 1131.42 2360.57
The aforementioned trend was considered in an alternative approach by
comparing limiting dome heights and forces of tested CuZn30 thin sheets for each
thickness at both high temperatures with room temperature. Percent variations between
higher forming speeds (15µm/s and 150µm/s) to the lowest forming speed (1.5µm/s)
were calculated from loading plots and are presented in Tables 7-3 & 7-4 for 25µm and
50µm thicknesses respectively. Figures 7-7, 7-8, 7-9 & 7-10 show a plot representation
to the percent variations in limiting values. Limiting dome heights and forces increased

124
with increasing forming speeds at higher temperatures, which was opposite to results of
testing at room temperature.
Table 7-3 Percent variation in limiting values from 1.5µm/s forming speed for 25µm CuZn30 at elevated temperatures
Forming speed (μm/s)
Variation in limiting dome height (%) Variation in limiting force (%)
25˚C 100˚C 150˚C 25˚C 100˚C 150˚C
15 -0.2 +5 +1 -4 +14 +26 150 -7 +4 +3 -9 +27 +59
Table 7-4 Percent variation in limiting values from 1.5µm/s forming speed for 50µm CuZn30 at elevated temperatures
Forming speeds (μm/s)
Variation in limiting dome height (%) Variation in limiting force (%)
25˚C 100˚C 150˚C 25˚C 100˚C 150˚C
15 -4 +2 +0.9 -4 +0.8 +11 150 -17 +14 +10 -17 +19 +25
In Chapter Five, it was said that for room temperature testing, higher forming
speeds did not allow for further deformation due to work hardening of tested thin sheets,
which resulted in decreased limiting values with higher speeds. At higher temperatures,
work hardening tends to impose less effect on the deformation mechanism [37].
Therefore, increasing forming speeds at higher temperatures will not impede the
deformation process. For higher temperature testing, it seemed that the thermally
activated slip systems that developed while applying heat energy took effect into the
plastic deformation mechanism by increasing the dislocation density in grain boundaries,
which resulted in higher forming forces and displacements for higher forming speeds at
both applied temperatures.

125
Figure 7- 7 Effect of varying speed on limiting dome height for 25µm microbulged thin sheets at elevated temperatures
Figure 7- 8 Effect of varying speed on limiting dome height for 50µm microbulged thin sheets at elevated temperatures
300
350
400
450
500
550
1 10 100 1000
Displacem
ent (μm
)
Speed (mm/sec)
25micron‐25C
25micron‐100C
25micron‐150C
1.5µm
/s
150µm
/s
15µm
/s
400
450
500
550
600
650
700
750
1 10 100 1000
Displacem
ent (μm
)
Speed (μm/sec)
50micron‐25C
50micron‐100C
50micron‐150C
1.5µm
/s
150µm
/s
15µm
/s

126
Figure 7- 9 Effect of varying speed on limiting forces for 25µm microbulged thin sheets at elevated temperatures
Figure 7- 10 Effect of varying speed on limiting forces for 50µm microbulged thin sheets at elevated temperatures
0
500
1000
1500
2000
2500
3000
3500
1 10 100 1000
Force (gm)
Speed (mm/sec)
25micron‐25C
25micron‐100C
25micron‐150C
1.5µm
/s
150µm
/s
15µm
/s
0
1000
2000
3000
4000
5000
6000
7000
1 10 100 1000
Force (gm)
Speed (μm/sec)
50micron‐25C
50micron‐100C
50micron‐150C
1.5µm
/s
150µm
/s
15µm
/s

127
However, for both tested thicknesses, the increase in limiting dome heights with
increasing forming speed at 100˚C was slightly higher than that at 150˚C while holding a
lower increase in limiting forces (Tables 7-3 & 7-4). The reason for such an observation
could be the releasing of more undesired slip systems at 150˚C, which may ultimately
impede the deformation of grains by the presence of more dislocations that will oppose
the applied forming loads on grains that must rotate to its proffered orientation.
Considering that testing at those temperatures was conducted on the same thickness and
microstructure, this result might indicate the consideration of optimum conditions for
attaining better thin sheet formability [88,89]; meaning that microforming of CuZn30 thin
sheets improved more at 100˚C and should be considered if forming temperature is
limited and component weight is a major factor too. Still, formability increased with
increasing forming speed at higher temperature testing.
7.3.2 Effect of Warm Temperature with Varying Temperature
By looking at bulging profiles of 25µm and 50µm thin sheets with respect to
forming speeds at different forming temperatures (Figures 7-11), significant drop in
punch force was observed in most of the higher temperature forming tests, along with
variations in maximum dome heights. Numerical values of percent variation in both
limiting dome heights and forces between high temperature and room temperature testing
of CuZn30 are presented in Tables 7-5 & 7-6.
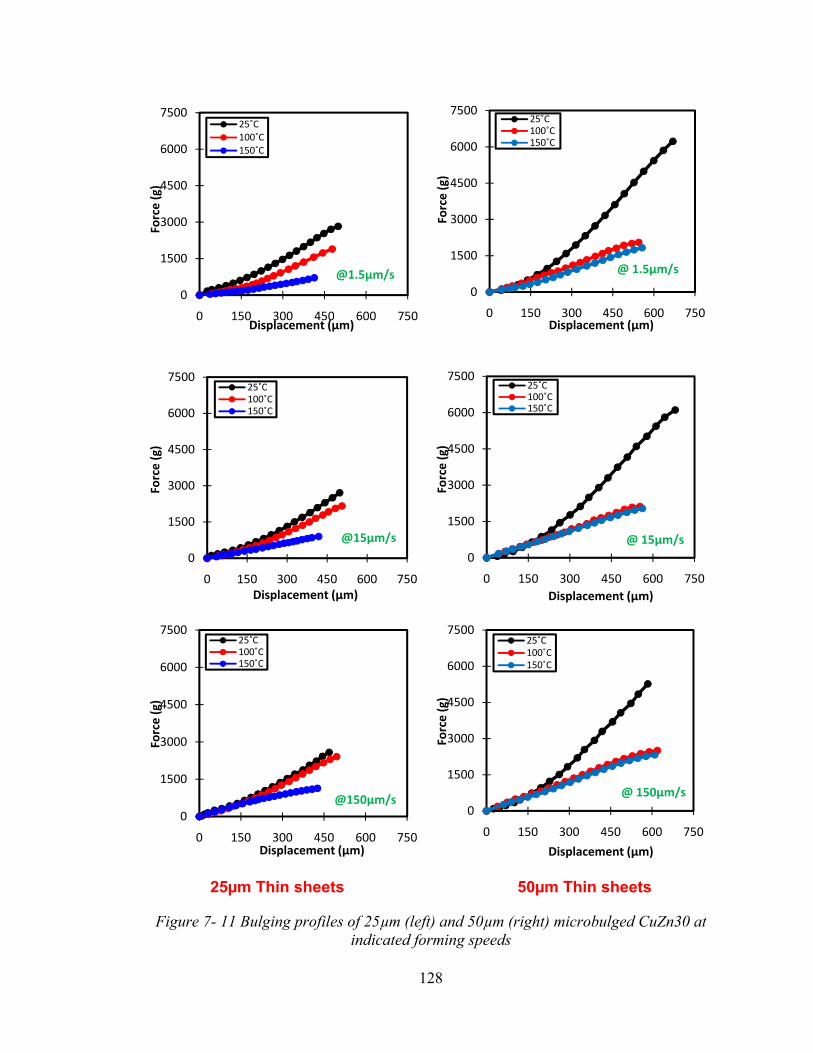
128
25µm Thin sheets 50µm Thin sheets
Figure 7- 11 Bulging profiles of 25µm (left) and 50µm (right) microbulged CuZn30 at indicated forming speeds
0
1500
3000
4500
6000
7500
0 150 300 450 600 750
Force (g)
Displacement (µm)
@1.5µm/s
25˚C100˚C150˚C
0
1500
3000
4500
6000
7500
0 150 300 450 600 750
Force (g)
Displacement (µm)
@ 1.5µm/s
25˚C100˚C150˚C
0
1500
3000
4500
6000
7500
0 150 300 450 600 750
Force (g)
Displacement (µm)
@15µm/s
25˚C100˚C150˚C
0
1500
3000
4500
6000
7500
0 150 300 450 600 750
Force (g)
Displacement (µm)
@ 15µm/s
25˚C100˚C150˚C
0
1500
3000
4500
6000
7500
0 150 300 450 600 750
Force (g)
Displacement (µm)
@150µm/s
25˚C100˚C150˚C
0
1500
3000
4500
6000
7500
0 150 300 450 600 750
Force (g)
Displacement (µm)
@ 150µm/s
25˚C100˚C150˚C

129
Table 7-5 Percent variation in limiting values of microbulged thin sheets between elevated temperatures (100˚C & 150˚C) and room temperature (25˚C) for 25µm CuZn30
Forming speed (μm/s)
Variation in limiting dome height (%)
Variation in limiting force (%)
100˚C 150˚C 100˚C 150˚C 1.5 -4 -17 -33 -75 15 +2 -16 -20 -67
150 +6 -9 -7 -56
Table 7-6 Percent variation in limiting values of microbulged thin sheets between elevated temperatures (100˚C & 150˚C) and room temperature (25˚C) for 50µm CuZn30
Forming speed (μm/s)
Variation in limiting dome height (%)
Variation in limiting force (%)
100˚C 150˚C 100˚C 150˚C 1.5 -19 -17 -67 -70 15 -19 -17 -65 -66
150 +6 +4 -52 -55
The identified decrease in dome height and limiting forces with increasing
forming temperature for both tested thicknesses was in agreement to the behavior of
similar face-centered cubic (FCC) metals that were tensile tested at the macroscale level
[47]. The scientific explanation for this behavior is the strong dependency of work
hardening in such alloys on forming temperature, demonstrated by a decreasing work
hardening with increasing forming temperature. Therefore, forming at lower temperatures
will have an increased work hardening effect and consequently would increase limiting
forces and projected dome heights. This effect was not clearly distinguished in this study,
since the applied forming temperatures were in the warm forming region and did not vary
significantly. Nevertheless, the observation of decreasing dome height with increasing
forming temperature, which is contrary to the behavior of stretched sheets at the

130
macroscale, can be considered as a size effect on high temperature testing of
microformed thin sheets, especially considering the coarsening effects of the deformed
microstructure on formability. For bulging profiles of the 25µm tested sheets at 100˚C,
they seemed to be closer to the bulging profiles of at 25˚C for all forming speeds. This
might mean that that the applied forming temperature for that particular sheet thickness
did not eliminate the effect of work hardening on the deformation process, and therefore,
with higher forming speeds, work hardening still demonstrated an effect on the resulting
limiting values. This was not the case for 50µm tested thin sheets where the initiation of
more thermally activated slip systems might have eliminated more of the work hardening
effect.
7.4 Study of Effects of Warm Temperature on Surface Strain Limits of
Microformed Thin Sheets
In order to characterize the formability of microformed thin sheets at higher
temperatures, the same approach that was introduced and followed in Chapter Six was
implemented here. For each test, specimens were marked by a photolithography process
then clamped, heated, and formed, prior to image capturing of the failed region by
electron microscopy and automatic surface strain measurement around the vicinity of the
developed crack. Again, tested specimens were deformed at a speed of 15µm/s to follow
scaling of the forming setup (Chapter Six).The obtained strain limits for 25µm and 50µm
CuZn30 thicknesses at 100˚C and 150˚C are presented in Figures 7-12 & 7-13.
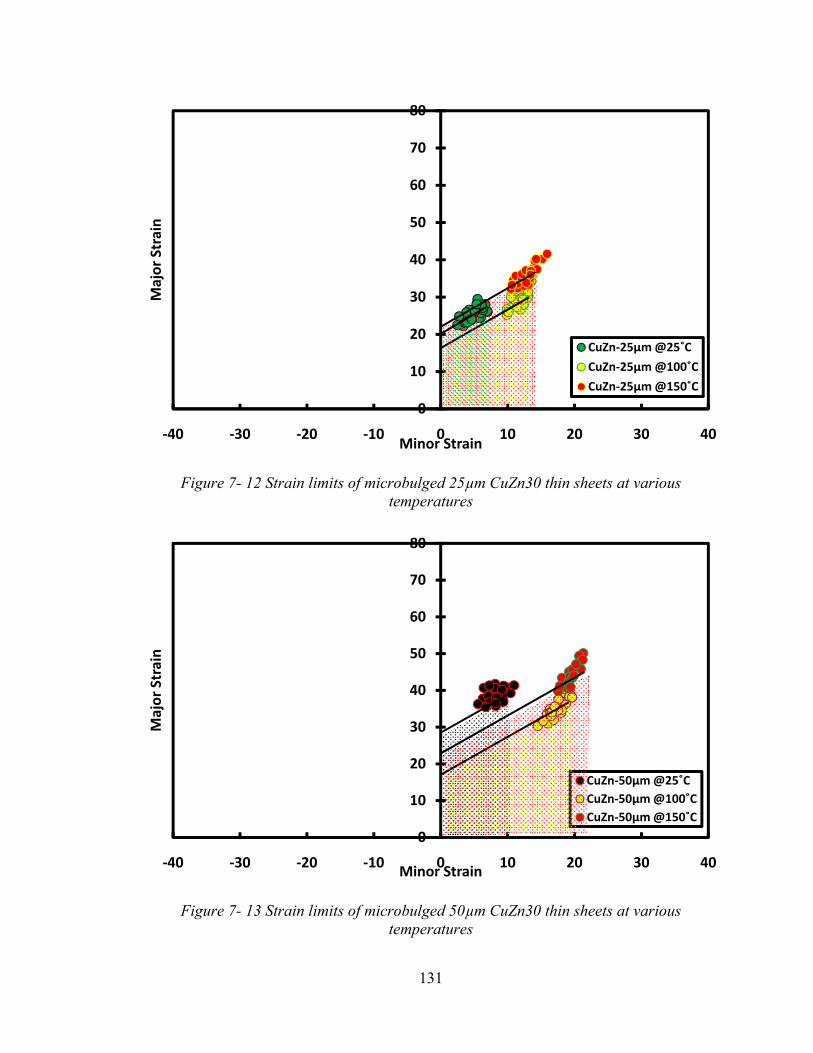
131
Figure 7- 12 Strain limits of microbulged 25µm CuZn30 thin sheets at various temperatures
Figure 7- 13 Strain limits of microbulged 50µm CuZn30 thin sheets at various temperatures
0
10
20
30
40
50
60
70
80
‐40 ‐30 ‐20 ‐10 0 10 20 30 40
Major Strain
Minor Strain
CuZn‐25µm @25˚C
CuZn‐25µm @100˚C
CuZn‐25µm @150˚C
0
10
20
30
40
50
60
70
80
‐40 ‐30 ‐20 ‐10 0 10 20 30 40
Major Strain
Minor Strain
CuZn‐50µm @25˚CCuZn‐50µm @100˚CCuZn‐50µm @150˚C

132
Increasing surface strain limits by applying high temperatures was clearly
identified in FLD plots for both tested thicknesses. This increase was also calculated in
terms of percent variation and is presented in Table 7-7. The increase in strain limits with
increasing temperature is a combined result of less work hardening and additional
thermally activated slip systems within grains as a result of inducing heat energy [37, 47,
48]. More slip systems resulting from the presence of dislocations will allow for further
deformation of grains, since slip systems are the governing mechanism for plastic
deformation, and accordingly failure is prevented by the presence of high dislocation
density. This increase in strain limits allows for applying a wider range of strain ratios
which ultimately allows for achieving more intricate details in a deformed thin sheet of
the same thickness with lower forces, as seen in the previous section. The increase in
surface strain might be the reason for decreasing dome heights with increasing forming
temperature as previously mentioned. Therefore, the limitation for achieving higher depth
for microformed thin sheets must be considered along with the increasing stretchability
when designing for such a microforming process.
Table 7-7 Measurement of the increase in strain limits of microformed CuZn30 thin sheets between room temperatures and higher temperatures along with microstructural parameters Thickness
(µm) Temperature
(˚C) Increase in formability (%) λ Nt (x106) Ns/Ni (%)Major Strain Minor Strain
25 100 14.8 85.7 3.1 0.228 13.9 150 38.9 107.1
50 100 2.6 85.7 3.7 0.094 150.0 150 15.4 90.5

133
Figure 7- 14 Strain limits of microbulged CuZn30 thin sheets (25µm and 50µm
thicknesses) at room temperature (25˚C) and higher temperatures (100˚C and 150˚C)
The above increase in surface strain limits seemed to dominate more in the minor
strain direction and was minor in the major strain direction (Figure 7-14). This
observation might be due to the coarse microstructure of the tested thin sheets.
Deforming grains seemed to elongate along the major strain direction, resulting in an
increased grain boundary density along the transverse direction (the curve of the major
strain axis of the formed ellipse). Therefore, in the transverse direction, or minor strain
direction, more grain boundary density will be available for dislocation to pile and take
advantage of the developed slip systems that should increase the formability along this
direction. When comparing between the percent increase in strain limits for 25µm and
50µm tested thicknesses (Table 7-6), 25µm thin sheets demonstrated higher formability
0
10
20
30
40
50
60
70
80
‐40 ‐30 ‐20 ‐10 0 10 20 30 40
Major Strain
Minor Strain
25µm @25˚C50µm @25˚C25µm @100˚C50µm @100˚C25µm @150˚C50µm @150˚C

134
improvement in strain limits than 50µm thin sheets even with 50µm thin sheets having
more share of surface grains than 25µm ones, which meant more unrestricted grains to
deformation. The reason for the higher improvement could be the total number of
deformed grains for 50µm which are less than that of 25µm ones (Table 7-6). The fewer
number of deformed grains at higher temperature might reduce the number of thermally
activated slip systems which affect the favorability of grain to deform plastically even
without fully rotating to its preferred orientation of deformation.
7.5 Concluding Remarks
A newly developed method for characterizing thin sheet formability at high
temperatures for microsclae applications was introduced. The method utilizes the
previously developed microforming setup with all of the required features for achieving
accurate microscale testing. A high temperature module was added to the existing
microforming setup in the form of a cartridge heater that snap-fits to the forming die and
heats the workpiece by heating the die that holds it. Heating temperature was controlled
by an electronic control system which relies on varying applied voltage and current to
achieve temperatures up to 160˚C. Formability was characterized by considering
measured bulging profiles and calculated surface strain limits of tested CuZn30 thin
sheets. Ranking of bulging profiles of tested sheets at high temperatures varied with
varying forming speed; contrary to what is observed in room temperature testing where
all bulging profiles were identical in form and only differed in limiting values. The
ranking of these profiles was a result of additional developed slip systems that were
formed by heating and showed dependency on forming speed. Limiting dome heights and

135
forces increased with increasing forming speed due to the softening effect that heating
induced on the workpiece, where the increased number of slip systems resulted in higher
deformation forces and displacements. Nevertheless, limiting values at higher
temperatures were lower than that at room temperature. Warm forming showed a
decreased work hardening effect when compared to cold forming and resulted in limited
stretchability. Therefore, it can be said that in high temperature forming of thin sheets,
forming depth decreases with increasing miniaturization. Calculated surface strain limits
of high temperature microforming were superior to strain limits obtained at room
temperature and allowed for a wider range of permissible strain ratios for obtaining more
complex forming geometries with the same thin sheet thickness. The indicated increase
resulted from the additional thermally activated slip systems which facilitates the
deformation of grains under lower applied loads. However, the limitation in limiting
dome height accompanied the increasing formability, thus it should be accounted for in
the design of the microforming process; especially when the advantage of achieving
intricate details and configuration with the same thickness is implemented. In general,
this study proved that high temperature forming can be utilized in thin sheet
microforming processes although there seemed some limitations in acquiring sufficient
forming depths, which is governed by size effects. The obtained results were also
governed by the coarseness of the specimens’ microstructure. More studies at higher
applied forming temperatures and a wider range of thicknesses and grain size range are
needed to incorporate the effect of grain size on thin sheet formability at high
temperature.

136
CHAPTER EIGHT
SUMMARY AND FUTURE RECOMMENDATIONS

137
8.1 Conclusions
A novel and comprehensive approach was developed and adapted in this research
work to obtain a better understanding of the material behavior at the microscale level,
particularly on the formability of thin sheet-metal. CuZn30 brass alloy alloys, which are
of important and wide use in microforming industries, were tested in order to obtain
optimum process parameters for improved utilization and processing of these alloys.
A special microforming setup was designed and built for conducting formability
tests on thin sheets in the form of mechanical bulging. Photolithography and chemical
etching techniques were developed for formability measurement of thin sheets at the
microscale level. The characterization of formability was done by determining forming
limits of deformed sheets through SEM imaging and dedicated software Automated
Strain Measurement and Analysis Environment (ASAME). Size effects on limiting bulge
heights, loading, and strains were identified for a group of well-defined process
parameters. The coarseness of tested thin sheets showed a significant influence on the
microformed thin sheets. The increasing share of surface grains increased the formability
when formed sheets were compared at the micro- and macroscale levels. Sheet
formability enhancement by applying lubrication seemed to diminish with increasing
miniaturization. The developed integrated technique was shown to assist in determining
and ranking thin sheet formability while exploring the effect of changing parameters for
this particular process.
A high-temperature microforming setup was developed to investigate size effects
on microforming processes and its parameters at elevated temperatures. Again, size
effects were identified in the scope of the identified parameters. The development of

138
thermally activated slip systems resulted in a detected sensitivity of measured force
profiles to forming speed. There seemed to be some limitations to thin sheet formability
at elevated temperatures concerning limiting displacement, however, surface strain
measurements indicated an enhancement of stretchability at the tested temperatures. This
part of the work will make an important contribution to industrial applications of
microforming.
The overall benefit of conducting this integrated approach is to be able to
construct forming limits diagrams (FLDs) of microformed thin sheets which will in turn,
provide us with a predictive tool for selecting materials and process parameters without
worrying about the costly trial and error techniques that are currently administered in
related microscale manufacturing industries. By optimizing microforming processes, the
advantage of demonstrating mass production and optimum material utilization will push
microforming towards replacing existing micromachining processes and ultimately
lowering the overall development and production costs.
8.2 Unique Features and Contributions
Characterization of formability of sheets by constructing FLDs under extreme
grain size emphasis: Most of the available work tackles formability issues under
a fine grain structure and excludes the appearance of coarse grains in strain limit
analysis for determining FLDs. In this work more emphasis was put on deforming
grains with respect to its restriction to deformation within the deforming volume.

139
Development of a microforming setup for thin sheet formability testing: Existing
formability testing setups demonstrated significant drawbacks and limitations to
testing methods of thin sheets at the microscale level. The developed setup
allowed for the accurate measurements and tight tolerances that are essential at
such a geometrical scale.
Identification of size effects on loading history in thin sheet bulging while
considering affecting process parameters: Existing work focuses primarily on
size effects through uniaxial testing and a few deep drawing and upsetting tests.
Development of a testing method for measuring strain limits of deformed thin
sheets: There is no current standard that identifies a procedure for measuring
strain limits of microformed thin sheets. This method will enable the
determination of FLDs for forming thin sheets at the microscale level. The
outcome is a predictive tool for thin sheet formability a the microscale level that
will provide related industries with a wide choice for selecting materials and
process parameters, hence eliminating the know-how technique of mastering
existing microforming technologies.
Development of a testing setup for high temperature microforming of thin sheets
through load recognition and strain limit determination: There is no current
standard apparatus or method for characterizing high temperature thin sheet
formability. This study is essential and can optimize, or replace, some of the

140
existing microforming processes. The approach of high temperature microforming
arises from the well known brittleness of materials at the microscale level.
8.3 Recommendations for Future Work
Incorporating thin sheet testing on a wider variety of commonly used alloys in the
microforming industry (such as brass, aluminum, and plastic materials).
Determining stain limits of thin sheets to accommodate all strain ratios in order to
construct FLDs for microformed thin sheets and ultimately develop formability
predictive data for targeted alloys.
Upgrading the capabilities of the high temperature setup to incorporate higher
temperature that can accommodate temperatures exhibiting superplastic
conditions at the microscale level and ultimately providing a superplastic
microforming setup for thin sheets.
Eliminating undesired friction effects by developing a pneumatic bulge forming
technique which is expected to overcome the unfavorable brittleness that is
always detected in microscale testing due to the presence of friction.
Copyright © Nasr AbdelRahman Shuaib 2008

141
APPENDICES
APPENDIX I: PROCEDURE FOR ELECRO-CHEMICAL MARKING OF
CuZu30
Electrochemical etching was performed on a Universal Marking Systems ME3000T Marking Unit. The procedure was as follows:
1. Sheets were cut into required dimensions and cleaned using acetone, and then samples were air blown to dry.
2. The required electrolyte (ME5 for brass) was distributed on top of the sheet and then the required stencil was placed on top of the sheet. A felt pad was then soaked by electrolyte and placed on top of the stencil.
3. The cathode was connected to the sheet by clamping it to a custom grounding where the sheet lies.
4. Test parameters were chosen from the preset program list for adjusting voltage and time.
5. A metal roller, which is the anode, was used to transmit the applied current through the arranged parts by rolling it along the sheet area and circular markings were achieved on test samples.
6. After the marking process, samples were washed with water and air blown to dry.
APPENDIX II: MOUNTING, GRINDING, AND POLISHING OF SAMPLES FOR
MICROSTRUCTURAL ANALYSIS
Procedure for Sample Mounting:
1. Sheet samples were cut to the required size in order to fit them into the mounting molds.
2. Commercial Epofix resin (EPOES by Struers Co.) was mixed with hardener (EPOAR) at a 25-3 wt% and then poured into the mounting molds with sheet samples at the bottom.
3. The epoxy was allowed to dry and cure and for 24 hours, then the mounted samples were removed from the molds.
Procedure for Grinding and Polishing Using the Struers RotoPol-22 and RotoForce-3 Machine:
1. Samples were mounted onto the mounting disk which will be placed onto the rotating shaft of the grinding machine and the automatic programming (Multidoser by Struers Co.) was set to the Al settings.

142
2. The grinding process was started by grinding samples with a 320 SiC grit-size emery paper to ensure the flatness and required leveling of all samples. Then 500, 1200, 2400 and 4000 grit-size emery paper, was used orderly in consecutive stages until a smooth surface finish was obtained.
3. Polishing clothes (MD-Dac commercial cloth provided by Struers Co.) with corresponding diamond-particulate solution (Dac) was used to polish the samples and achieve a smooth surface (around 3μm roughness).
4. Step 3 was repeated if the apparent scratches were considerably large. 5. The final polishing stage was applied using the MD-Chem polishing cloth and the
OP-U suspension solution until all visible scratches were eliminated and a smooth and shiny surface was obtained. The obtained samples can be used in microstructural analysis as well as brazing experiments.
6. If scratches were still visible, step 3-5 were repeated until a shiny and clean finish was obtained.

143
APPENDIX III: MATERIAL PARAMETERS CHART FOR CuZn30 TESTED SHEETS OF ALL THICKNESSES AND
ANNEALING STATES
Table III-1 Calculated parameters for CuZn30 Bulged Sheets
Geometry Thickness State d (µm) λ π Ns (x106) Ni (x106) Nt (x106) Ns/Ni (%) V (mm3)
2mm AR 55.5 36.1 150,824.9 1.730 91.786 93.516 1.88
8370.78AN 476.2 4.2 17,513.8 0.023 0.125 0.148 18.87
1mm AR 29.1 33.5 139,979.6 5.961 293.075 299.036 2.03 4185.39AN 238.1 4.2 17,578.3 0.094 0.498 0.592 18.87
200μm AR 16.0 12.5 52,317.4 20.816 369.491 390.307 5.63 837.08 AN 48.8 4.1 17,153.2 2.238 11.519 13.757 19.43
2mm AR 55.5 36.1 141691.2 1.647 86.206 87.853 1.91 7863.86AN 476.2 4.2 16,513.8 0.022 0.117 0.139 19.10
1mm AR 29.1 33.5 131,502.7 5.637 275.29 280.927 2.05 3931.93AN 238.1 4.2 16,513.8 0.089 0.468 0.557 18.99
200μm AR 16.0 12.5 49,149.1 19.581 347.091 366.672 5.64 786.39 AN 48.8 4.1 16,114.5 2.104 10.819 12.923 19.45
2mm AR 55.5 36.1 27,027.0 0.047 23.271 23.318 2.02 2125.00AN 476.2 4.2 4,462.4 0.006 0.031 0.037 20.23
1mm AR 29.1 33.5 35,535.1 1.516 74.397 75.913 2.04 1062.50AN 238.1 4.2 4,462.4 0.024 0.126 0.150 19.20
200μm AR 16.0 12.5 13,281.25 5.286 93.798 99.084 5.63 212.50 AN 48.8 4.1 4,354.5 0.568 2.924 3.492 19.44
154

144
Table III-2 Statistical values of grain size measurement for as-received CuZn30 Bulged Sheets
Thickness d1 d2 d3 dave (µm) SD V (Coeff. of variation) 2mm 58.0 53.6 54.9 55.5 2.24 4.03 1mm 31.0 28.8 29.9 29.9 1.07 3.58
200μm 17.1 15.0 15.9 16.0 1.03 6.47 Table III-3 Statistical values of grain size measurement for annealed CuZn30 Bulged Sheets
Thickness d1 d2 d3 dave (µm) SD V (Coeff. of variation) 2mm 4.3 4.0 4.4 4.2 0.21 4.92 1mm 4.1 4.5 4.0 4.2 0.26 6.18
200μm 4.0 4.1 4.1 4.1 0.06 1.49 Table III-4 Symbol abbreviations
Symbol Description d Average grain size λ Thickness-to-grain-size ratio π Deformed volume-to-grain size ratio Ni Number of inner grains in deformed volume Ns Number of surface grains in deformed volume Nt Number of total grains in deformed volume

145
APPENDIX IV: DATA FOR SPECIMEN SLIPPAGE TEST
- Lo : Initial length - SD : Standard deviation - Lf : Final length - V : Coefficient of variation
Test #1 Test #2 Test #3
No. Lo (µm)
Lf (µm)
% Stretch
Lo (µm)
Lf (µm)
% Stretch
Lo (µm)
Lf (µm)
% Stretch
1 2821.7 2823.2 0.05 3970.4 3970.4 0.00 4681.7 4681.5 0.00 2 2771.3 2816.7 1.64 2926.2 2944.1 0.61 3033.3 3023.5 -0.32 3 2467.2 2481.4 0.58 2306 2307.8 0.08 3164.5 3158.4 -0.19 4 2462.6 2489.9 1.11 3226.6 3226.6 0.00 3366.9 3338.7 -0.84 5 1168.1 1175.3 0.62 3359.4 3390 0.91 3170.6 3160.1 -0.33 6 1256.1 1245.9 -0.81 1786.4 1786.4 0.00 1553.9 1571.4 1.13 7 1526.2 1509.6 -1.09 1418.6 1422.6 0.28 1795.6 1806.3 0.60 8 1352.1 1341.3 -0.80 1104.6 1104.9 0.03 1592.1 1604.2 0.76 9 3540.9 3563.8 0.65 1126.8 1130 0.28 1602.8 1608.9 0.38
Average 0.22 Average 0.24 Average 0.13 SD 0.94 SD 0.32 SD 0.63
V 4.37 V 1.33 V 4.81 Average resulting values:
Average % Stretch 0.20 SD 0.06 V 0.30 Range 0.11
156

146
Figure IV- 1 Designated markings for measurement of stretchability before and after forming
APPENDIX V: PROCEDURE FOR MICROFORMING THIN SHEETS
1. Samples were cut into a 9x9 mm squares after air blowing it for cleaning purposes.
2. Sample was clamped between the die halves and tightening was applied by screw power.
3. The die was placed on the v-grooves of the kinematic coupling module so it would demonstrate the six point contact between the die and fixture.
4. Thin sheet surface, or zero point, was then determined by the control system and process parameters (percent force drop, speed, and depth) were entered into the controlling program before starting the test.
5. After performing the test, the die was taken out and Sample was removed from the die.
APPENDIX VI: PROCEDURE FOR ELECTROLYTIC POLISHING AND
ETCHING OF CuZn30 AND Al1100 THIN SHEETS
Procedure for thin sheet polishing of CuZn30 and Al1100: The process was done on a LectroPol-5 electrolytic etching module provided by Struers with custom mixed electrolytes. The procedure was the following:
1. Sample was cut into a piece bigger than 1cm2 in area and then cleaned by alcohol and air blown to dry.
2. The required electrolyte was inserted into the container slot. The mixed electrolytes were E5 for brass and A2 for aluminum.
3. The required voltage and current were set automatically from the default process menu and the pump flow was adjusted to slightly surface on the mask orifice.
Before microforming After microforming
Markings

147
4. The sample was placed on top of the provided 1cm2 mask before setting the anode on top of the sample and then the test was started.
5. After the polishing process, the sample was dipped into water for cleaning and then air blown to dry.
Procedure for electrolytic etching of CuZn30: The process was done on a LectroPol-5 electrolytic etching module provided by Struers with custom mixed electrolytes. The procedure was the following:
1. Sample was cut into a suitable size and cleaned using alcohol and then air blown for drying.
2. The required electrolyte (D2) was inserted into the container slot. 3. The required voltage and time were set manually as 2.5V and 20 seconds
respectively, and the pump flow was adjusted to slightly surface on the mask orifice.
4. The sample was placed on top of the provided 1cm2 mask before setting the anode on top of the sample and then the test was started.
6. After the etching process, the sample was dipped into water for cleaning and then air blown to dry.
Procedure for electrolytic etching of Al1100: The process was done on a Bueler®’s Electromet 4 polisher consisting of an Electropolisher power supply as well as an Electropolisher cell module. The procedure was the following:
1. Sample was cut into a suitable size and cleaned using alcohol and then air blown to dry.
2. Sample was placed on top of the cell module and the pump was turned on to adjust the solution level which has to reach the bottom surface of the tested sample.
3. The test time and voltage were adjusted as 1 minute and 18V respectively with 60% pump speed
4. The pump was turned on and the test was started by pushing the start button. 5. After the mentioned duration, the etching process was conducted and the pump
was turned off. The sample was then removed and washed by water then dried by using an air gun.

148
APPENDIX VII: STATISTICAL DATA FOR GRAIN SIZE MEASUREMENT OF CuZn30 THIN SHEETS Table VII-1 Grain size measurement of 25µm CuZn30
No.
Test #1 Test #2 Test #3 Line
length (µm)
Crossed boundaries
Grain size (µm)
Line length (µm)
Crossed boundaries
Grain size (µm)
Line length (µm)
Crossed boundaries
Grain size (µm)
1 112.4 15 7.5 133.4 16 8.3 108.2 16 6.8 2 86.4 12 7.2 112.7 14 8.1 110 13 8.5 3 154.2 19 8.1 91.1 10 9.1 116.3 18 6.5 4 98.2 12 8.2 65 7 9.3 97.6 9 10.8 5 107.7 16 6.7 76.3 8 9.5 98.8 12 8.2 6 91.7 13 7.1 83.1 9 9.2 99.5 11 9.0 7 142.7 22 6.5 119.7 16 7.5 117.9 11 10.7 8 117.4 17 6.9 99.5 13 7.7 92.8 12 7.7 9 59 8 7.4 61.4 7 8.8 65 10 6.5
10 52.6 6 8.8 50.6 5 10.1 54.2 6 9.0 Ave. Grain size 7.4 Ave. Grain size 8.8 Ave. Grain size 8.4
159

149
Table VII-2 Grain size measurement of 50µm CuZn30:
No.
Test #1 Test #2 Test #3 Line
length (µm)
Crossed boundaries
Grain size (µm)
Line length (µm)
Crossed boundaries
Grain size (µm)
Line length (µm)
Crossed boundaries
Grain size (µm)
1 221.1 13 17.0 194.6 14 13.9 213.8 14 15.3 2 203.1 14 14.5 172.2 12 14.4 192.3 12 16.0 3 212.3 14 15.2 199 14 14.2 210.7 14 15.1 4 123.6 9 13.7 114.3 7 16.3 130.9 10 13.1 5 149.6 11 13.6 124.2 8 15.5 132 9 14.7 6 123.3 9 13.7 108 7 15.4 121.2 9 13.5 7 182 13 14.0 180 11 16.4 199.3 15 13.3 8 210.9 18 11.7 170.4 10 17.0 195.2 16 12.2 9 78.8 9 8.8 66.8 8 8.4 67.1 5 13.4
10 91.6 7 13.1 71.4 6 11.9 73.9 6 12.3 Ave. Grain size 13.5 Ave. Grain size 14.3 Ave. Grain size 13.9
Table VII-3 Resulting grain size and statistical parameters:
Thickness d1 d2 d3 dave SD V CuZn30-25μm 7.4 8.8 8.4 8.2 0.72 8.79 CuZn30-50μm 13.5 14.3 13.9 13.9 0.40 2.88
- d: Average grain size - SD : Standard deviation - dave: Average value of three measurements - V : Coefficient of variation
160

150
APPENDIX VIII: PROCEDURE FOR THIN SHEET MARKING BY PHOTOLITHOGRAPHY TECHNIQUE The photolithography process was conducted in a clean room with a highly sensitive environment to ensure the proper application of photoresist. The procedure was the following:
1. A specimen (substrate) was cut to the required square area to fit under the photomask.
2. Specimen was cleaned with acetone and alcohol then air-blown. 3. Specimen was heated at 110°C for about 1 minute to dry surface. 4. Specimen was placed on a CEE (Cost Effective Equipment) spin coater machine
and the photoresist was applied in the form of drops on top of the specimen’s surface, then it was spun at 4000rpm for 30seconds.
5. Step 4 was repeated if PR was not evenly distributed. 6. Specimen was removed and bake at 110°C for 1 minute. 7. Specimen was placed inside the vacuum chamber of a Karl Suss (MJB3)
photolithography machine. 8. The photomask was placed and aligned with the thin sheet specimen. 9. Ultra violet rays were beamed at the specimen for 9 seconds through the
photomask. 10. After UV exposure, specimen was backed at 110°C for 1 minute. 11. For developing of exposed photoresist, specimen was immersed in an AZ 400K
commercial developer by Clariant (1:4 water) for 50 seconds to 1 minute. 12. Substrate was then dipped in water for final cleaning and air blown to dryness.

151
REFERENCES
1. M. Geiger, M. Kleiner, R. Eckstein, N. Tiesler and U. Engel, “Microforming”,
CIRP Annals - Manufacturing Technology, 2001, v 50, n 2, pp 445-462.
2. M. Heckele & W. Schomburg, “Review on micro molding of thermoplastic
polymers”, Journal of Micromechanics and Microengineering, (2004), v 14, pp 1-
14.
3. K.F. Ehmann, D. Bourell, M. Culpepper, R.E. DeVor, T. Hodgson, T. Kurfess,
M. Madou, K. Rajurkar, “An international assessment of micro-manufacturing
research technology”, Processing and Fabrication of Advanced Materials XIV
With Frontiers in Materials Science, 2005, pp 211-224.
4. R. Williams; S. Melkote; W. Sun, Y. Huang, B. Kinsey, D. Yao, “Recent
advances in micro/meso-scale manufacturing processes”, Proceedings of
IMECE2005, American Society of Mechanical Engineers, Manufacturing
Engineering Division, MED, v 16-2, 2005, pp 863-884.
5. M. Geiger, U. Engel, F. Vollertsen, R. Kals, A. Messner, “Metal forming of
microparts for electronics”, Production Engineering, v 2, 1994, pp 15-18.
6. M. Geiger, A. Messner, U. Engel, R. Kals, F. Vollertsen, “Design of micro-
forming processes – fundamentals, material data and friction behavior”,
Proceedings of the 9th International Cold Forging Congress, Solihull, England,
1995, pp 155-164.

152
7. M. Geiger, F. Vollertsen and R. Kals, “Fundamentals on the manufacturing of
sheet metal microparts”, CIRP Annals - Manufacturing Technology, v 45, n 1,
1996, pp 277-282.
8. M. Geiger, A. Messner, U. Engel, “Production of microparts – Size effects in bulk
metal forming, similarity theory”, Production Engineering, v 4, 1997, pp 55-58.
9. T. A. Kals and Ralf Eckstein, “ Miniaturization in sheet metal working”, Journal
of Materials Processing Technology, v 103, n 1, 2000, pp 95-101.
10. L.V. Raulea, A.M. Goijaerts, L.E. Govaert, F.P.T. Baaijens, “Size effects in the
processing of thin metal sheets”, Journal of Materials Processing Technology, v
115, 2001, pp 44-48.
11. J. Gau, C. Principe, J. Wang, “An experimental study on size effects on flow
stress and formability of aluminum and brass for microforming”, Journal of
Materials Processing Technology, v 184, 2007, pp 42-46.
12. U. Engel, A. Messner, N. Tiesler, “Cold forging of micro parts”, Proceedings of
the 1st ESAFORM Conference on Materials Forming, Sophia Antipolis, France,
1998, pp 77-80.
13. N. Tiesler and U. Engel, ‘Microforming – effects of miniaturization, Proceedings
of the Eighth International Conference on Metal Forming, 2000, pp 355-360.
14. N. Tiesler, “Microforming - Size effects in friction and their influence on
extrusion processes”, Wire, v 52, n 1, February, 2002, pp 34-38.
15. N. Krishnan, J. Cao, B. Kinsey, S. Parasiz, M. Li, “ Investigation of deformation
characteristics of micropins fabricated using microextrusion”, Proceedings of

153
IMECE2005, American Society of Mechanical Engineers, Manufacturing
Engineering Division, MED, v 16-1, 2005, pp 341-348.
16. N. Krishnan, J. Cao, K. Dohda, “Microforming: Study of friction conditions and
the impact of low friction/high strength die coatings on the extrusion of
micropins”, Proceedings of IMECE2005, American Society of Mechanical
Engineers, Manufacturing Engineering Division, MED, v 16-1, 2005, pp 331-340.
17. J. Cao, N. Krishnan, Z. Wang, H. Lu, W. Liu, A. Swanson, “Microforming:
Experimental investigation of the extrusion process for micropins and its
numerical simulation using RKEM”, Transactions of the ASME, v 126, 2004, pp
642-652.
18. F. Vollertsen, Z. Hu, H. Schulze Niehoff and C. Theiler, “ State of the art in micro
forming and investigations in micro deep drawing”, Journal of Materials
Processing Technology, v 151, n 1-3, 2004, pp 70-79.
19. F. Vollertsen, H. Schulze Niehoff and Z. Hu, “State of the art in microforming”,
International Journal of Machine Tool & Manufacture, v 46, 2006, pp 1172-1179.
20. J. F. Michel and PP Picart, “ Size effects on the constitutive behavior for brass in
sheet metal forming”, Journal of Materials Processing Technology, v 141, 2003,
pp 439-446.
21. H. Hoffman and S. Hong, “ Tensile test of very thin sheet metal and
determination of flow stress considering the scaling effect”, CIRP Annals -
Manufacturing Technology, v 55, n 1, 2006, pp 263-266.
22. S. Mahabunphachai and M. Koç, “Fabrication of micro-channel arrays on thin
metallic sheet using internal fluid pressure: Investigations on size effects and

154
development of design guidelines”, Journal of Power Sources, v 175, 2008, pp
363-371.
23. Y. Saotome, K. Yasuda, and H. Kaga, “Microdeep drawability of very thin sheet
steels”, Journal of Materials Processing Technology, v 113, n 1-3, 2001, pp 641-
647.
24. Y. Saotome and T. Okamoto, “An in-situ incremental microforming system for
three-dimensional shell structures of foil materials”, Journal of Materials
Processing Technology, v 113, n 1-3, 2001, pp 636-640.
25. H. Justinger and G. Hirt, “Analysis of size-effects in the miniaturized deep
drawing process”, Key Engineering Materials, v 344, Sheet Metal, 2007, pp 791-
798.
26. J. Gau, C. Principe, M. Yu, “ Springback behavior of brass in micro sheet
forming”, Journal of Material Processing Technology, v 191, 2007 , pp 7-10.
27. Y. Saotome, T. Hatori, T. Zhang, A. Inoue, “Superplastic micro/nano-formability
of La60Al20Ni10Co5Cu5 amorphous alloy in the supercooled liquid state”,
Materials Science and Engineering, v A304-306, 2001, pp 716-720.
28. Y. Saotome, K. Itoh, T. Zhang, A. Inoue, “Superplastic nanoforming of Pb-based
amorphous alloy”, Scripta Materialia, v 44, 2001, pp 1541-1545.
29. Y. Saotome and H. Iwazaki, “Superplastic extrusion of microgear shaft of 10μm
in module”, Microsystems Technology, v 6, 2000, pp 126-129.
30. Y. Saotome and H. Iwazaki, “Superplastic backward microextrusion of microparts
for micro-electro-mechanical systems”, Journal of Materials Processing
Technology”, v 119, 2001, pp 307-311.

155
31. S. Son, M. Kim, K. Park, W. Lee, “Micro forming characteristic of Al5083
superplastic alloy”, Proceedings - 9th Russian-Korean International Symposium
on Science and Technology, KORUS-2005, v 1, 2005, pp 556-559.
32. M.S. Yeh, H.Y. Lin, H.T. Lin, C.B. Chang, “Superplastic micro-forming with a
fine grained Zn-22Al eutectoid alloy using hot embossing technology”, Journal of
Materials Processing Technology, v 180, 2006, pp 17-22.
33. T. Furushima and K. Manabe, “Experimental and numerical study on deformation
behavior in dieless drawing process of superplastic microtubes”, Journal of
Materials Processing Technology, v 191, 2007, pp 59-63.
34. T. Furushima and K. Manabe, “Experimental study on multi-pass dieless drawing
process of superplastic Zn–22%Al alloy microtubes”, Journal of Materials
Processing Technology, v 187–188, 2007, pp 236–240.
35. J. Ocaña, M. Morales, C. Molpeceres, O. García, J. Porro, J. García-Ballesteros,
“Short pulse laser microforming of thin metal sheets for MEMS manufacturing”,
Applied Surface Science, v 254, 2007, pp 997-1001.
36. G. Cheng, D. Pizada, Z. Ming, “Microstructure and mechanical property
characterizations of metal foil after microscale laser dynamic forming”, Journal of
Applied Physics, v 101, 063108, 2007, pp 1-7.
37. B. Eichenhueller, E. Egerer, U. Engel, “Microforming at elevated temperature –
forming and material behavior”, International Journal of Advanced
Manufacturing Technology, v 33, 2007, pp 119-124.
38. S.P. Keeler, “Determination of forming limits in automotive stamping”, Sheet
Metal Industries, v 42, n 461, 1965, pp 683-691.

156
39. S.P. Keeler and W.A. Backofen, “Plastic instability and fracture in sheets
stretched over rigid punches”, ASM Transactions, v 56, n 1, 1963, pp 25-48.
40. Z. Marciniak and K. Kuczynski, “Limit strains in the processes of stretch-forming
sheet metal”, Int. J. Mech. Sci., v 9, 1967, pp 609-620.
41. Z. Marciniak, K. Kuczynski and T. Pokora, “Influence of the plastic properties of
a material on the forming limits diagram for sheet metal in tension”, International
Journal of Mechanical Sciences, v 14, 1973, pp 789-805.
42. K. Yamaguchi and P.B. Mellor, “Thickness and grain size dependence of limit
strains in sheet metal stretching”, International Journal of Mechanical Sciences, v
18, 1975, pp 85-90.
43. R. Mahmudi, “Forming limits in biaxial stretching of aluminium sheets and foils”,
Journal of Materials Processing Technology, v 37, 1993, pp 203-216.
44. M. Aghaie-Khafri and R. Mahmudi, “Optimizing homogenization parameters for
better stretch formability in an Al-Mn-Mg alloy sheet”, Materials Science
Engineering, v 399, 2005, pp 173-180.
45. F. Stachowicz, “Effect of grain size, thickness and prestrain on the forming limits
of 63-37 brass sheets”, Metalurgija, v 3, 1998, pp 179-182.
46. Annual Book of ASTM Standards, “E112-96: Standard Test Methods for
Determining Average Grain Size”, v 3.01, July, 2003, pp 256-281
47. Robert E. Reed-Hill and Reza Abbaschian, “Physical Metallurgy Principles”,
Thomson-Engineering, Third edition, 1991.
48. George E. Dieter, “Mechanical Metallurgy”, McGraw Hill, Third Edition, 1986.
157
49. A.B. Haberfield and M.W. Boyles, Laboratory determined forming limit
diagrams, Sheet Metal Industries, v 50, 1973, pp 400, 402-405, 411.
50. J.H. Schmitt and J.M. Jalinier, “Damage in sheet metal forming—II. Plastic
instability”, Acta Metallurgica, 1982, vol. 30, pp 1799-1809.
51. Annual Book of ASTM Standards, “Standard Test Method for Ball Punch
Deformation of Metallic Sheet Material”, ASTM E643-84, v 03.01, ASTM, 2000.
52. http://www.hsi-inc.com, June 5th, 2006.
53. http://www.cooperinstruments.com, June 5th, 2006.
54. http://www.copper.org, January 15th, 2005.
55. American Society for Metals, “Metals Handbook, Desk Edition”, Second Edition,
American Society for Metals, v 2, 1998, pp 427, 512.
56. http://www.aluminum.org, November 20th, 2007.
57. http://www.4m-net.org, June 5th, 2006.
58. P. Bley, W. Menz, W. Bacher, K. Feit, M. Harmening, H. Hein, J. Mohr, W.K.
Schomburg, W. Stark, “Application of LIGA process in fabrication of three-
dimensional mechanical microstructures”, 4th International Symposium on
MicroProcess Conference, Kanazawa, Japan, 1991, pp 384-389.
59. K. Dunke, H.D. Bauer, W. Ehrfeld, J. Hobfeld, L. Weber, G. Horcher, G. Muller,
“Injection-molded fiber ribbon connectors for parallel optical links fabricated by
LIGA technique”, Journal of Micromechanics and Microengineering, v 8, 1995,
pp 146-157.

158
60. Annual Book of ASTM Standards, “Standard Practice for Temper Designations
for Copper and Copper Alloys—Wrought and Cast”, ASTM B 601-99a, v 02.01,
ASTM, Jan 2000.
61. Annual Book of ASTM Standards, “Standard Practice for Heat Treatment of
Wrought Aluminum Alloys”, ASTM B918 - 01, v 02.02, ASTM, Jan 2003.
62. A. Nadai, “Plasticity; A Mechanics of the plastic state of matter”, McGraw-Hill
Book Co., New York and London, 1931.
63. A. Nadai, “Theory of flow and fracture of solids”, v 1, McGraw-Hill Book
Company, New York, 1950.
64. T. Naka, F. Yoshida, M. Ohmori, “ Flow Stress and ductility of brass with various
Zn-content range of strain rate”, Zairyo/Journal of the Society of Materials
Science, Japan, v 44, n 500, 1995, pp 591-596.
65. M. Suery, B. Baudelet, " Flow stress and microstructure in superplastic 60/40
brass”, Journal of materials Science, v 8, 1973, pp 363-369.
66. N. Shuaib, M. Khraisheh, O. Rawashdeh, “Size effects on strain limits of thin
CuZn30 brass sheets”, Proceedings of the 2nd International Conference on Micro
Manufacturing, Clemson, SC, 2007, pp 140-144.
67. http://www2.dupont.com, June 10th, 2008.
68. http://www.teflon.com, June 10th, 2008.
69. R. Pearce, “A users’ guide to forming limit diagrams”, Sheet Metal Industries,
December, 1971, pp 943-949.
70. S.S. Hecker, “Cup test for assessing stretchability”, Metals Engineering Quarterly,
v 14, n 4, Nov, 1974, pp 30-36.
159
71. S.S. Hecker, “Simple technique for determining forming limit curves”, Sheet
Metal Industries, November, 1975, pp 671-676.
72. A.K. Gosh and S. S. Hecker, “Failure in thin sheets stretched over rigid punches”,
Metallurgical Transactions A, v 6A, 1975, pp 1065-1074.
73. J. Cao, N. Krishnan, L.F. Mori, and H. Espinosa, “ Experimental investigation of
the size effects observed in the extrusion of micropins”, Proceedings of the 1st
International Conference on Micro Manufacturing, Urbana-Champaign, IL, 2006,
pp 126-131.
74. N. Krishnan, J. Cao and K.F. Ehmann, “Microforming: Study of grain size and
friction effects in the extrusion of micropins”, Proceedings of the 4th International
Workshop on Microfactory IV, Shanghai, China, October, 2004.
75. T. Sobis, U. Engel, M. Geiger, “A theoretical study of wear simulation in metal
forming processes”, Journal of Material Processing Technology, n 34, 1992, pp
233-240.
76. International Standard ISO 12004, “Metallic materials, guidelines for the
determination of forming-limits diagrams”, International Organization for
Standardization, 1997 ISO 12004:1997(E)
77. http://www.gom.com/EN/measuring.systems/aramis/system/system.html
78. U. Engel, “Tribology in microforming”, Wear, v 260, n 3, 2006, pp 265-273.
79. R. Eckstein, M. Geiger, U. Engel, “ Specific characterization of micro sheet metal
working”, Proceedings of SheMet, September 1999, pp 529-536.

160
80. D.V. Wilson, A.R. Mirshams, W.T. Roberts, “An experimental study of the effect
of sheet thickness and grain size on limit-strains in biaxial stretching”,
International Journal of mechanical Sciences, v 25, n 12, 1983, pp 859-870.
81. G. Sachs and K. Van Horn, “Practical Metallurgy”, American Society for Metals,
1951.
82. M. Gad-el-Hak, “The MEMS Handbook”, CRC Press, 2002.
83. C. Wang and K. Zhang, “Superplastic microforming of Zn-Al22 alloy ribs”,
Journal of Materials Science & Technology, v 20, n 2, 2004, pp 236-238.
84. J.P. Wulfsberg, S.E. Hilpert, A. Ostendorf, K. Samm, “Fundamentals of laser-
assisted microforming”, Proceedings of the 1st Colloquium of DFG Priority
Program Process Scaling, Bremen, October, 2003, pp 1-8.
85. J.P. Wulfsberg and M. Terzi, “ Investigation of laser heating in microforming
applying sapphire tools”, CIRP Annals-Manufacturing Technology, v 56, n 1,
2007, pp 321-326.
86. G. Kim, J. Ni, R. Mayor, H. Kim, “An experimental investigation on semi-solid
forming of micro/meso-scale features”, Transactions of the ASME, v 129, April,
2007, pp 246-251.
87. W.J. Kim, S.J. Yoo, H.K. Kim, “Superplastic microforming of Mg-9Al-1Zn alloy
with ultrafine-grained microstructure”, Scripta Materialia, v 59, 2008, pp 599-
602.
88. M. Suery and B. Baudelet, “Flow stress ad microstructure in superplastic 60/40
brass”, Journal of Materials Science, v 8, 1973, pp 363-369.

161
89. J. Pilling and N. Ridley, “Superplasticity in crystalline solids”, The Institute of
Metals, 1989.
90. K. Manabe and O. Shimomura, “ Effect of temperature and drawing speed on
warm deep drawing characteristics of AZ31 magnesium alloy sheet”, Journal of
Japan Institute of Light Metals, v 56, n 10, 2006, pp 521-526.
91. W.W. Wood, “Combined effects of high velocity and temperature on sheet metal
formability”, Proceedings of the International Production Engineering Research
Conference, 1963, pp 311-319.
92. K. Brun and R. Kurz, “Measurement uncertainties encountered during gas turbine
driven compressor field testing”, Transactions of the ASME, v 123, January,
2001, pp 62-69.
93. R.B. Abernethy, R.P. Benedict, R.B. Dowdell, “ASME measurement
uncertainty”, Journal of Fluids Engineering, Transactions of the ASME, v 107, n
2, 1983, pp 161-164.
94. R.B. Abernethy and R.P. Benedict, “Measurement uncertainty: A standard
methodology”, Instrumentation in the Aerospace Industry, v 30, 1984, pp 411-
420.
95. R.P. Benedict, “How to handle errors in measurement”, Instrumentation in the
Aerospace Industry, v 30, 1984, pp 411-420.
96. Nasr A. Shuaib and Marwan K. Khraisheh, “Method and Apparatus for Characterizing Microscale Formability of Thin Sheet Materials”, U.S. Patent 12/177,968 filed June 2008. (Patent pending)

162
VITA
Nasr AbdelRahman Shuaib Date and Place of Birth
• June 6th, 1978 / Madison, WI
Education • Bachelor’s degree in Mechanical Engineering, University Khartoum, Khartoum,
Sudan, 2002.
Experience • Teaching Assistant (August 2007- May 2008) (Mechanical Engineering
Department -University of Kentucky, Lexington, Kentucky, USA) • Research Assistant (August 2004- December 2008) (Mechanical Engineering
Department -University of Kentucky, Lexington, Kentucky, USA) • Best™ Dairy Products Co., Khartoum, Sudan (January-June 2004) • International Center for Quality, Khartoum, Sudan (January-December 2003)
Awards & Honors
• Recipient of the GAANN Fellowship for assistance in areas of national need by the Department of Education (January 2005- July 2007)
• Member of the Delta Epsilon Iota Academic Honor Society (January 2008 – Present)
Technical Publications and Conference Papers • N. A. Shuaib, M. K. Khraisheh, O. A. Rawashdeh, “Size effects on strain limits of
thin CuZn30 brass sheets”, Proceedings of the 2nd International Conference on Micro Manufacturing, Clemson, SC, 2007, pp 140-144.
• F.K. Abu-Farha, N.A. Shuaib, M.K. Khraisheh, K.J. Weinmann, “Limiting Strains of Sheet Metals Obtained by Pneumatic Stretching at Elevated Temperatures”, Annals of the CIRP, 2008, In Press.
Unique Contributions
• Nasr A. Shuaib and Marwan K. Khraisheh, “Method and Apparatus for Characterizing Microscale Formability of Thin Sheet Materials”, U.S. Patent 12/177,968, filed June 2007.