An Investigation of Multidimensional Energy Poverty in ... Ullah Awan… · Poverty head count for...
14
An Investigation of Multidimensional Energy Poverty in Pakistan Rehmat Ullah Awan 1 Department of Economics, University of Sargodha, Pakistan [email protected] Falak Sher Department of Economics, University of Sargodha, Pakistan [email protected] Akhtar Abbas Graduate Student, Department of Economics, University of Sargodha, Pakistan [email protected] Abstract This study uses Alkire and Foster’s (2007) methodology to measure Multidimensional Energy Poverty in Pakistan using Pakistan social Living standard Measurement (PSLM) data for 2007-08. This measure also satisfies the property of decomposability. Multidimensional Energy Poverty Index (MEPI) has been calculated. Value of MEP Headcount for rural Pakistan is 71% as compared to 29% in urban areas of Pakistan. Multidimensional Energy Poverty head count for rural Pakistan is 71.4% and 28.6% of the households residing in rural areas of Pakistan are energy poor. Households of Pakistan are most deprived in cooking fuel dimension (55%) while deprivation is the least in dimension of home appliances ownership (15%). In urban areas of Pakistan, households are more deprived in dimension of cooking fuels (23%) followed by indoor pollution (19%). Almost one third households of rural Pakistan are deprived in dimension of indoor pollution (69%). Contribution of indoor pollution (32%) to multidimensional energy poverty headcount in Pakistan is the highest followed by the cooking fuels dimension (31%) and collectively these two dimensions contribute up to 63% in overall Multidimensional Energy Poverty head count for Pakistan. Study further concludes that households deprivation in energy decreases with the increase in value of cut offs. Overall indoor pollution, cooking fuel and Entertainment appliances are the three major contributors, to overall MEP Headcount not only as a whole but region wise also. Based on results, the study established that there is significant and higher incidence & severity of energy poverty in rural areas as compared to urban areas, not only in overall Pakistan but in all provinces also. Key Words: Multidimensional Energy Poverty, Energy Poverty, Poverty Measurement, Multidimensional Energy Poverty Index (MEPI), Decomposability, Deprivation, Intensity of poverty, Cooking Fuel, Indoor Pollution, Home appliances, Entertainment and Education, Electricity, Pakistan. 1 Corresponding Author: +92-333-9818113, +92-48-9230816, Fax +92-48-9230817
Transcript of An Investigation of Multidimensional Energy Poverty in ... Ullah Awan… · Poverty head count for...
An Investigation of Multidimensional Energy Poverty in Pakistan
Rehmat Ullah Awan1
Department of Economics, University of Sargodha, Pakistan
Falak Sher
Department of Economics, University of Sargodha, Pakistan
Akhtar Abbas
Graduate Student, Department of Economics, University of Sargodha, Pakistan
Abstract
This study uses Alkire and Foster’s (2007) methodology to measure Multidimensional Energy Poverty in Pakistan
using Pakistan social Living standard Measurement (PSLM) data for 2007-08. This measure also satisfies the
property of decomposability. Multidimensional Energy Poverty Index (MEPI) has been calculated. Value of MEP
Headcount for rural Pakistan is 71% as compared to 29% in urban areas of Pakistan. Multidimensional Energy
Poverty head count for rural Pakistan is 71.4% and 28.6% of the households residing in rural areas of Pakistan are
energy poor. Households of Pakistan are most deprived in cooking fuel dimension (55%) while deprivation is the
least in dimension of home appliances ownership (15%). In urban areas of Pakistan, households are more deprived
in dimension of cooking fuels (23%) followed by indoor pollution (19%). Almost one third households of rural
Pakistan are deprived in dimension of indoor pollution (69%). Contribution of indoor pollution (32%) to
multidimensional energy poverty headcount in Pakistan is the highest followed by the cooking fuels dimension
(31%) and collectively these two dimensions contribute up to 63% in overall Multidimensional Energy Poverty head
count for Pakistan. Study further concludes that households deprivation in energy decreases with the increase in
value of cut offs. Overall indoor pollution, cooking fuel and Entertainment appliances are the three major
contributors, to overall MEP Headcount not only as a whole but region wise also. Based on results, the study
established that there is significant and higher incidence & severity of energy poverty in rural areas as compared to
urban areas, not only in overall Pakistan but in all provinces also.
Key Words: Multidimensional Energy Poverty, Energy Poverty, Poverty Measurement, Multidimensional
Energy Poverty Index (MEPI), Decomposability, Deprivation, Intensity of poverty, Cooking Fuel, Indoor
Pollution, Home appliances, Entertainment and Education, Electricity, Pakistan.
1 Corresponding Author: +92-333-9818113, +92-48-9230816, Fax +92-48-9230817
1. 1. INTRODUCTION
Poverty is an alarming problem all over the world. It is one of the severe challenges today faced
by not only the developing nations but by the developed nations also. However, the problem is
worst in the developing countries [United Nations and IEA (2010)]. . All these countries face
poverty in different forms such as food poverty, energy poverty, shortage of natural resources,
shortage of agricultural products, lake of shelter and clothing among others. It is persuasive to
correlate poverty with lack of energy consumption also. Such a correlation identifies that poor
use energy very inadequately (Pachauri et al. 2004). Energy helps societies to move from one
development stage to another. Worldwide energy demand is increasing while supply is
decreasing due to increase in the world population, emerging economies and economic
development. In current day to day life energy has become an essential requirement. For all of us
energy is required for lighting, transportation, cooking, health services, and to fulfill many of our
basic needs. Electricity access at household level enhances telecommunication, entertainment,
and knowledge via radio, television, and computer etc.
World Economic Forum (2010) defines energy poverty as: “The lack of access to sustainable
modern energy services and products”. The energy poverty is defined as a situation where the
absence of sufficient choice of accessing adequate, reliable, affordable, safe and environmentally
suitable energy services is found. In simple words, the energy poverty is the lake of access to
suitable traditional (fire wood, chips, dung cakes etc) and modern energy services and products
(kerosene, liquefied petroleum, gas etc). For the development of any country, the energy is the
first step. A person is considered to be energy poor if he or she not has access to at least: (a) the
equivalent of 35 Kg per capita per year LPG for cooking from liquid and/or gas fuels or from
improved supply of solid fuel sources and improved (efficient and clean) cook stoves .and (b)
120KWh electricity per capita per year for lighting, access to most basic services (drinking
water, communication, improved health services, education improved services and others) plus
some added value to local production
To enhance livelihood opportunities for all, electricity plays a major role. To change the poor’s
life in a better way, clean and efficient energy resources are required. Firewood collection for
cooking consumes a lot of women’s time. Clean energy sources for cooking like electricity, and
gas etc mean improvement in living standards and time saving also. The income poor are
possible to be energy poor, however not all of the energy poor are income poor. Energy scarcity
and poverty go hand in hand and show a strong relationship. Welfare of masses is affected by the
level of energy consumption. There is a negative correlation between access to modern energy
services and energy poverty. So in order to alleviate energy poverty, improvement in the access
to modern energy services is very essential. Availability of cheaper energy is essential.
According to United Nations, lack of electricity and heavy reliance on traditional biomass are
hallmarks of poverty in developing countries. Lack of electricity enhances poverty and
contributes to its upholding, as it prevents most industrial activities and the jobs they create
[United Nations and IEA (2010)].
To meet their survival needs in the absence of efficient energy use technologies and adequate
energy resources, majority of poor depend on biomass energy, animal power and their own labor.
To improve the level of satisfaction of basic human needs and living standard of the people and
to eradicate poverty energy resources must be improved. For the better health care facilities and

education clean energy is required. Achievement of efficient energy resources can lead to the
attainment of evenhanded, economically strong and sustainable development.
Present study aims to investigate the level of energy poverty in Pakistan and to find the extent of
energy poverty in rural and urban areas of Pakistan. And further to check the impact of different
dimensions on energy poverty in Pakistan.
2. REVIEW OF LITERATURE
Pasternak (2000) found that there is strong relationship between measures of human well-being
and consumption of energy and electricity. A roughly constant ratio of primary energy
consumption to electric energy consumption was observed for countries with high levels of
electricity use and then this ratio was used to estimate global primary energy consumption in the
Human Development Scenario. They established positive correlation between the Human
Development Index (HDI) and annual per-capita electricity consumption for 60 populous
countries comprising 90% of the world’s population. Results further showed that HDI reached a
maximum value when electricity consumption was about 4,000 KWH per person per year.
Bielecki (2002) by using a measurement of the existing state of oil security pointed out that the
threats of supply disruption had not restrained. Outlook of the oil market for the coming two
decades advocate that there is still need to take more steps for the oil security. It was also found
that with rising importance of universal demand and trade of gas, the gas security is also
becoming gradually more significant. They claimed that different severe security alarms do exist
and will probably strengthen in the future. This indicates that there is no area for gratification on
energy security. The present oil crisis measures require extension to cover up energy sources for
developing nations and for others.
Clancy et al. (2003) found that Energy security has all over turned into a central community
issue along with concerns with sky-scraping energy prices and the incidence of regional shortage
of supply. 2.8 million Households in England are classified as being in fuel poverty in 2007
(13% of all households). It is found that the fuel poverty in the UK is not going to be of the same
order or intensity as that of sub-Sahel Africa. NGOs and practitioners also point at complex
processes of energy exclusion and self-exclusion at the community, household and family level,
leading to distinct micro-cultures of energy use.
Pachauri et al.(2004) measured Energy Poverty for Indian Households using a two-dimensional
measure of energy poverty and energy distribution that combine the element of access to
different energy types and quantity of energy consumed. They found that there is significant
reduction in the level of energy poverty due to rapid development in India.
Stephen et al. (2004) studied the present and future renewable energy potential in Kenya to meet
the needs of electrification of the poor. They limited the study to solar and hydro technologies
owing to technical and socio-economic hurdles. They assessed that present Rural Electrification
Fund (REF) in Kenya realizes the solar and hydro electrification potential for poor. The results
showed that if there is 10% increase in Rural Electrification Fund (REF), annual revenue from
rural electricity connections increases by 42% in Kenya. There exists a relation between access
and use of energy and poverty.
Pachauri et al. (2004) presented different approaches for measurement of energy poverty by
using Indian household level data. They found positive relation between well being and use of
clean and efficient energy resources. They also concluded that use of access and consumption of
clean and efficient energy increases the well being.
Catherine et al. (2007) examined UK Government’s devotions to eradicate fuel poverty among
vulnerable families by year 2010 and in the common people by 2016. They explained the
relations among this measure of fuel poverty and the governmental objective definition, using an
exclusive data set and the Family Expenditure Survey. They recognized the link between two
measures. They investigated the characteristics of households in each group, and how each
measure is interrelated with different household issues.
Tennakoon (2009) analyzed the energy poverty status of Sri Lanka. Two approaches namely
Quantitative approach and Pricing approach of measuring energy poverty were used. Results of
Pricing approach showed that Sri Lanka is facing high level of energy poverty (83% energy
poverty) while results of Quantitative approach revealed that energy poverty in terms of cooking
is very high due to high in-efficiencies of cooking stoves.
Barness et al.(2010) explored the welfare impacts of household and energy use in rural
Bangladesh using cross sectional data. The result showed that although the modern and
traditional sources improved the energy consumption of rural Bangladesh households but the
impacts of modern energy sources were high as compared to the traditional energy services.58%
households in rural Bangladesh are facing energy poverty.
Shahidur et al. (2010) studied energy poverty of urban and rural areas of India. The estimates
showed that in rural area of India, 57 % households are energy wise poor and only 22 % from
total use are income poor while in urban areas of India, the energy poverty is 28% and income
poverty is 20%. The persons in energy poverty were also facing income poverty.
Marcio et al. (2010) analysed the impact of energy poverty on inequality for Brazilian Economy
using Lorenz Curve, Poverty Gap, Gini coefficient and Sen Index. It is concluded that rural
electrification leads to the improvement in energy equity.
Jain (2010) explored the problems related to energy consumption faced by the Indian rural and
urban households. The results showed that energy poverty in rural areas of India is about 89%
and 24% in urban areas of India. It was also concluded that 56% households in India has access
to the electricity facilities. Poor person spend almost 12% of their total income only on the
energy. Energy poverty disturbs all aspects of human welfare like agriculture productivity,
access to water, education, health care and job creation etc. Energy poor persons don’t have
access to clean water, electricity and they spend a large portion of their income and time to get
energy fuel. This consumption pattern of the poor persons on energy leads to the income poverty.
Mirza and Szirmai (2010) discussed the consequences and characteristics of the use of different
energy services using Energy Poverty Survey (EPS) data from 2008 to 2009. They outlined that
the rural population of Pakistan uses variety of energy services like firewood, plant waste,
kerosene oil and animal waste. Despite these sources of energy, the population of Pakistan has to
face the energy crises or energy poverty. Estimates show that 96.6 % of rural households have to
face energy short fall. In Punjab province of Pakistan, 91.7 % of rural households of the total
rural population are facing severe energy poverty.
Nussbaumer et al. (2011) reviewed the appropriate literature, and talked about sufficiency and
applicability of existing methods for measurement of energy poverty for several African
countries. They proposed a new composite index, Multidimensional Energy Poverty Index
(MEPI).It captures the incidence and intensity of energy poverty and focuses on the deprivation
of access to modern energy services. Based on MEPI for Africa, the countries are categorized
according to the level of energy poverty, ranging from sensitive energy poverty (MEPI>0.9; e.g.

Ethiopia) to modest energy poverty (MEPI<0.6; Angola, Egypt, Morocco, Namibia, Senegal). It
was concluded that the MEPI will only form one tool in monitoring improvement and designing
and executing good quality policy in the area of energy poverty.
3. Data and Methodology
The study uses Pakistan Social & Living Standards Measurement (PSLM) Survey (2007-08).
This data set includes sample of 15512 households consisting of 1113 sample
community/enumeration blocks. A two-stage stratified sample design has been adopted for this
survey. Villages and enumeration blocks in urban and rural areas, respectively have been taken
as Primary Sampling Units (PSUs). Sample PSUs have been elected from strata/sub-strata with
Probability Proportional to size (PPS) method of sampling technique. Households within sample
PSUs have been taken as Secondary Sampling Units (SSUs). A specified number of households
i.e. 16 and 12 from each sample PSU of rural & urban area have been selected, respectively
using systematic sampling technique with a random start.
3.1 Methodology
For the analysis and for the measurement of energy poverty in Pakistan, the study uses
Multidimensional Energy Poverty Index (MEPI), proposed by Nussbaumer et al (2011). The
MEPI is created by Oxford Poverty & Human Development Initiative (OPHI) with association of
United Nations Development Program (UNDP). The technique we utilize is derived from the
literature on multidimensional poverty measures, extraordinarily from the Oxford Poverty and
Human Development Initiative (OPHI) (Alkire and Foster 2007, Alkire and Foster 2009, Alkire
and Santos 2010, Alkire and Foster 2010), which is aggravated by Amartya Sen’s contribution to
the debate of deprivations and potential. Fundamentally, the MEPI takes into account the set of
energy deprivation that may have an effect on an individual. It is tranquil of five dimensions in
lieu of basic energy services with five indicators. An individual or a household is recognized as
energy poor if the combinations of the deprivations that are faced by an individual surpass a pre-
defined threshold. The Multidimensional Energy Poverty Index is the result of a headcount ratio
(share of people recognized as energy poor) and the average intensity of deprivation of the
energy poor.
Multidimensional Energy Poverty Index (MEPI) merges two features of energy poverty. On one
side is the incidence of poverty defined as the percentage of people who are energy poor, or the
headcount ratio (H) and the other is the intensity of Poverty defined as the average percentage of
dimensions in which energy poor people are deprived (A).
Let M n,d
indicates the set of all n×d matrices, and ,n dy M
stand for an achievement matrix of n
people in d different dimensions. For every i = 1, 2,…, n and j=1, 2,…, d, the typical entry yij of y
is individual i’s achievement in dimension j. The row vector 1 2( , ,..., )i i i idy y y y lists individual
i’s achievements and the column vector 1 2( , ,..., )j j j njy y y y gives the distribution of
achievements in dimension j across individuals. Let 0jz represent the cutoff below which a
person is considered to be deprived in dimension j and z represent the row vector of dimension
specific cutoffs. Following Alkire and Foster’s (2007)’s notations, any vector or matrix v, v
denotes the sum of all its elements, whereas ( )v is the mean of v.
Alkire and Foster (2007) suggest that it is useful to express the data in terms of deprivations
rather than achievements. For any matrix y, it is possible to define a matrix of deprivations 0 0
ijg g , whose typical element 0
ijg is defined by 0
ijg = 1 when ij jy z , and 0 0ijg when
ij jy z . 0g is an n×d matrix whose ij
th entry is equal to 1 when person i is deprived in jth
dimension, and 0 when person is not. go
i
is the ith
row vector of go which represent person i’s
deprivation vector. From go matrix, define a column vector of deprivation counts, whose i
th entry
0
i ic g represents the number of deprivations suffered by person i. If the variables in y are only
ordinal significant, go and c are still well defined. If the variables in y are cardinal then we have
to define a matrix of normalized gaps g1. For any y, let
1 1
ijg g be the matrix of normalized
gaps, where the typical element is defined by 1 ( ) /ij j ij jg z y z whenij jy z , and 1 0ijg
otherwise. The entries of this matrix are non-negative numbers less than or equal to 1, with 1
ijg
being a measure of the extent to which person i is deprived in dimension j. This matrix can be
generalized to ijg g , with α > 0, whose typical element ijg is normalized poverty gap
raised to the α-power.
A sensible starting is that to recognize who is poor and who is not? The majority of the
identification techniques recommended in the literature in general pursue the union/ intersection
approach. A person is considered poor according to union approach, if that person is deprived in
only one dimension. While according to intersection approach an individual i is considered to be
poor if that individual is deprived in all dimensions. If the equal weights are given to all
dimensions the technique to recognize the multidimensionally poor suggested by Alkire and
Foster deprivations are compared with a cutoff level k. where k= 1,2,…,d. Now we describe the
recognition method k such that ( , ) 1k iy z when ic k , and ( , ) 0k iy z when ic k . This
shows that an individual is known as multidimensionally poor if that individual has deprivation
level at least in k dimensions. This is called dual cutoff method because k depends upon z j
within dimension and across dimensions cutoff k. This identification principle describes the set
of the multidimensionally poor people as { : ( ; ) 1}k k iZ i y z . A censored matrix 0 ( )g k is
obtained from 0g by replacing the i
th row with a vector of zeros whenever ( , ) 0k iy z . An
analogous matrix gα(k) is obtained for α > 0, with the ij
th element ( )ij ijg k g if ic k &
( ) 0ijg k if ic k .
On the basis of this identification method, Alkire and Foster define the following poverty
measures. The first natural measure is the percentage of individuals that are multidimensionally
poor: the multidimensional Headcount Ratio ( ; )H H y z is defined by H = q/n, where q = q(y,z)
is the number of people in set Zk. This is entirely analogous to the income headcount ratio. This
method has the advantage of being easily comprehensible and estimable & this can be applied
using ordinal data.
Table.1 Selected Indicators and their Cutoffs.
Dimension/
Indicator
Indicator Variable Cutoff (Situation of Deprivation
Cooking
Modern cooking fuel Type of cooking
fuel
A household consider poor/deprived if use any fuel
beside electricity, liquefied Petroleum Gas (LPG),
kerosene oil, natural gas, or biogas for cooking
purposes.
Indoor Pollution
Indoor pollution Food cooked on
stove or
open fire if using
any fuel beside
electricity, LPG,
natural
gas, or biogas
A household consider poor/deprived if not using
modern cook stove or use three stone cook stove or if
using any fuel for cooking beside electricity,
liquefied Petroleum Gas (LPG), natural gas, or
biogas.
Lighting
Electricity access Has access to
electricity
There is no proper data for lighting; therefore for the
purpose we use electricity access. A household
consider poor/deprived if the household has no
electricity connection or access to electricity
facilities.
Services provided
by means of
household
appliances
Household appliance
Ownership
Has a fridge This dimension deals with ownership of household
appliances. A household consider poor/ deprived if
the household has not a fridge or electric fan.
Entertainment /
Education
Entertainment/education
appliance ownership
Has a radio OR
television
This dimension deals with ownership of
Entertainment/education appliance. A household
consider poor/deprived if the household has not
Radio or Television or Computer.
4. RESULTS AND DISCUSSION
Table 1 shows different Dimensions, Indicators and the Cut-offs. From a human development
point of view, a poverty indicator must be significantly and eventually measurable at the
individual, household, or community level. It must allow a classifying of these demographic
units as more or less poor. Present study uses five main dimensions and their relevant indicators
for the measurement of Multidimensional Energy Poverty Index (MEPI) based upon the
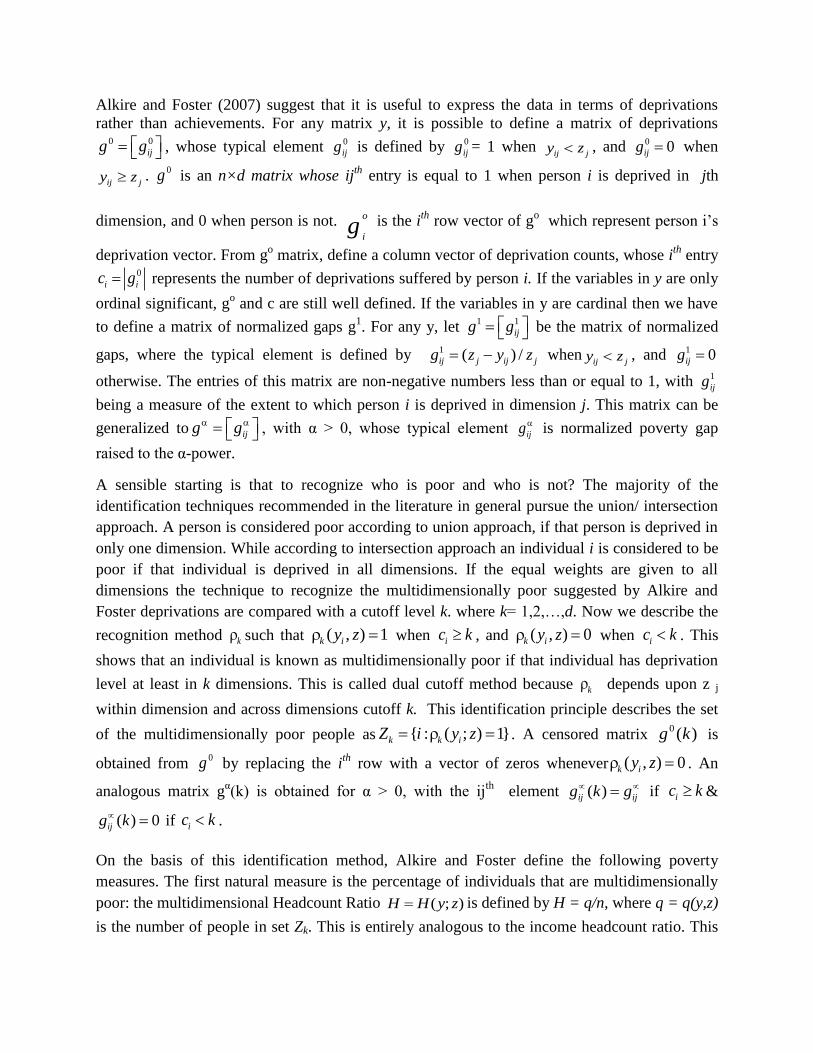
availability of nationwide data. All the five dimensions are weighted equally. Figure 1 shows the
results of Multidimensional Energy Poverty head count for overall Pakistan at dual cutoff equal
to 2 i.e. K=2. The empirical results show that in Pakistan almost 54.6% and 45.4% of households
are multidimensional energy poor and energy non poor, respectively.
Figure 1 Results of Multidimensional Energy Poverty Headcount for Overall Pakistan at K=2
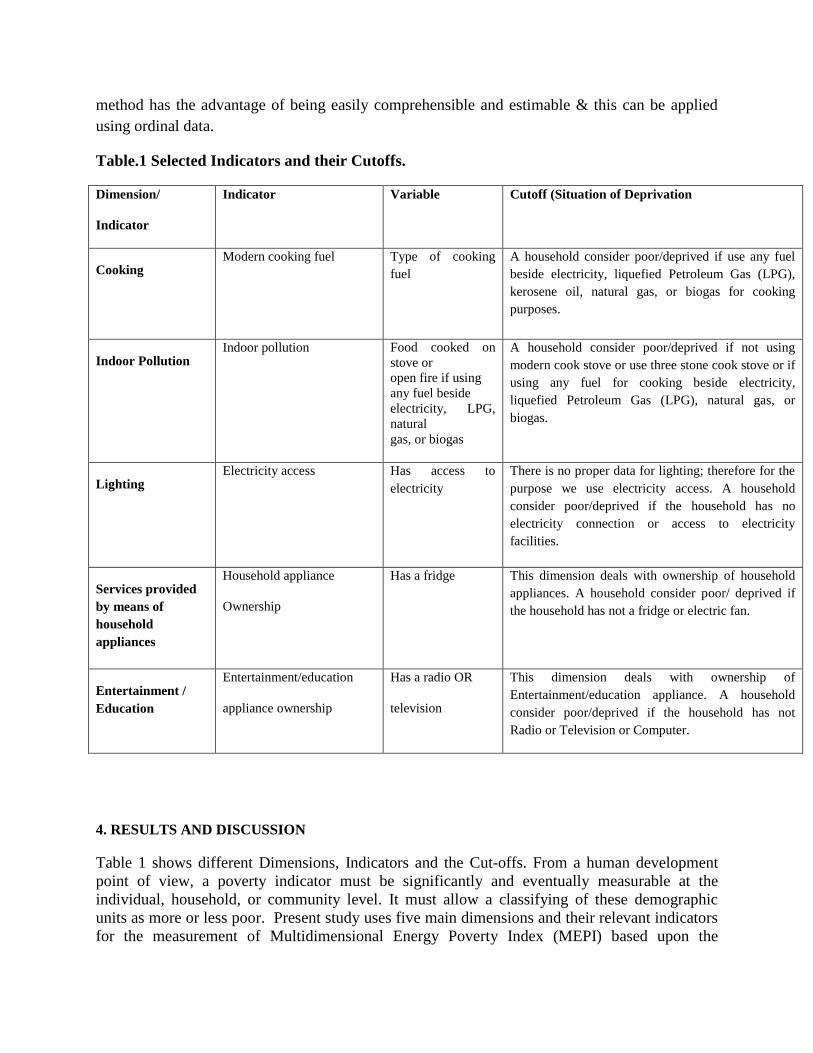
Figure 2 shows the results of Multidimensional Energy Poverty head count for urban Pakistan. It
is clear from figure that only 29% of the households are in multidimensional energy poor in
urban areas of Pakistan, while remaining 71% of the households in urban areas are energy non-
poor.
Figure 2 Results of Multidimensional Energy Poverty Headcount for Urban Pakistan at
K=2
Figure 3 depicts the results of Multidimensional Energy Poverty head count for rural areas of
Pakistan. The incidence and severity of energy poverty is significant in rural areas of Pakistan.

Results show that Multidimensional Energy Poverty head count for rural Pakistan is 71.4% and
28.6% of the households residing in rural areas of Pakistan are energy poor and non-poor.
Figure 3 Results of Multidimensional Energy Poverty Headcount for Rural Pakistan at
K=2
The analysis of breakdown of energy poverty by dimension for overall Pakistan is shown in
Figure 4. Results show that households of Pakistan are most deprived in cooking fuel dimension
(55%), while deprivation is the least in dimension of home appliances ownership (15%). Results
further show that 52%, 33% and 19% of the households in Pakistan are deprived in terms of
indoor pollution, entertainment appliances and electricity, respectively.
Figure 4 Dimension wise Breakdown of Energy Poverty for Overall Pakistan
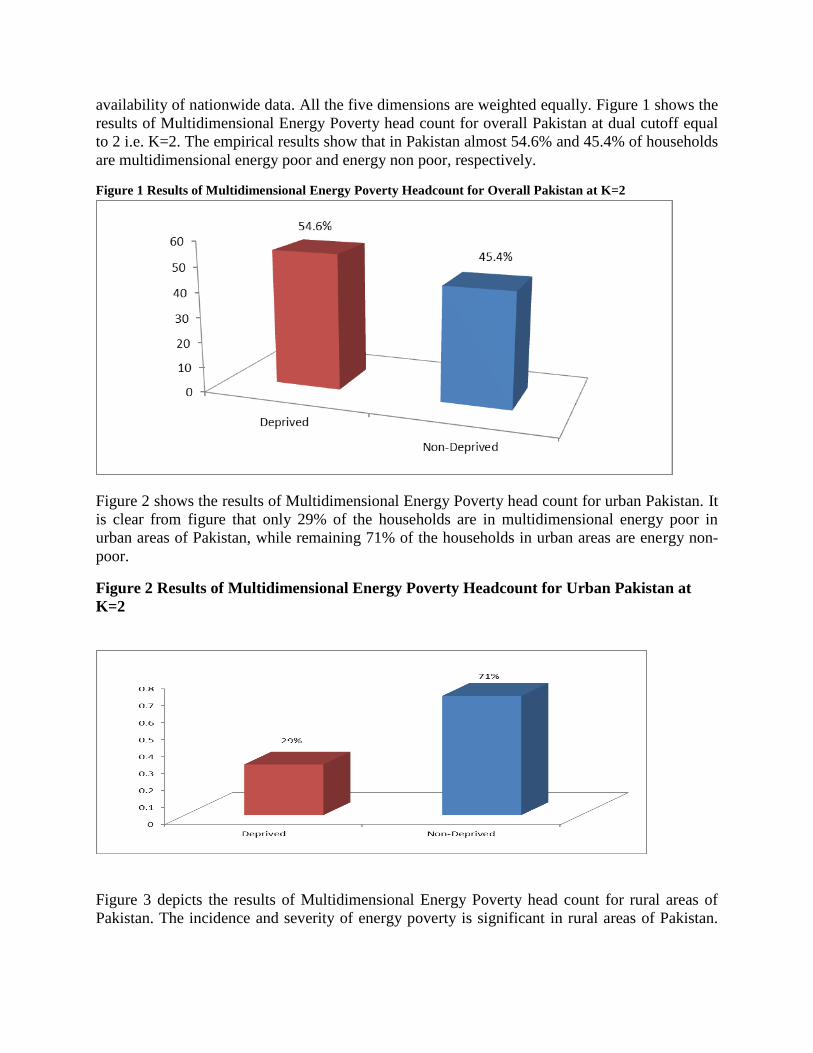
Figure 5 shows the breakdown of energy poverty by dimension for urban Pakistan. The empirical
results show that in urban areas of Pakistan households are more deprived in dimension of
cooking fuels (23%) followed by indoor pollution (19%). In urban areas of Pakistan only 3%
households are deprived in dimension of home appliances ownership. In dimensions of
entertainment appliances and electricity households are deprived by 18% and 7%, respectively.
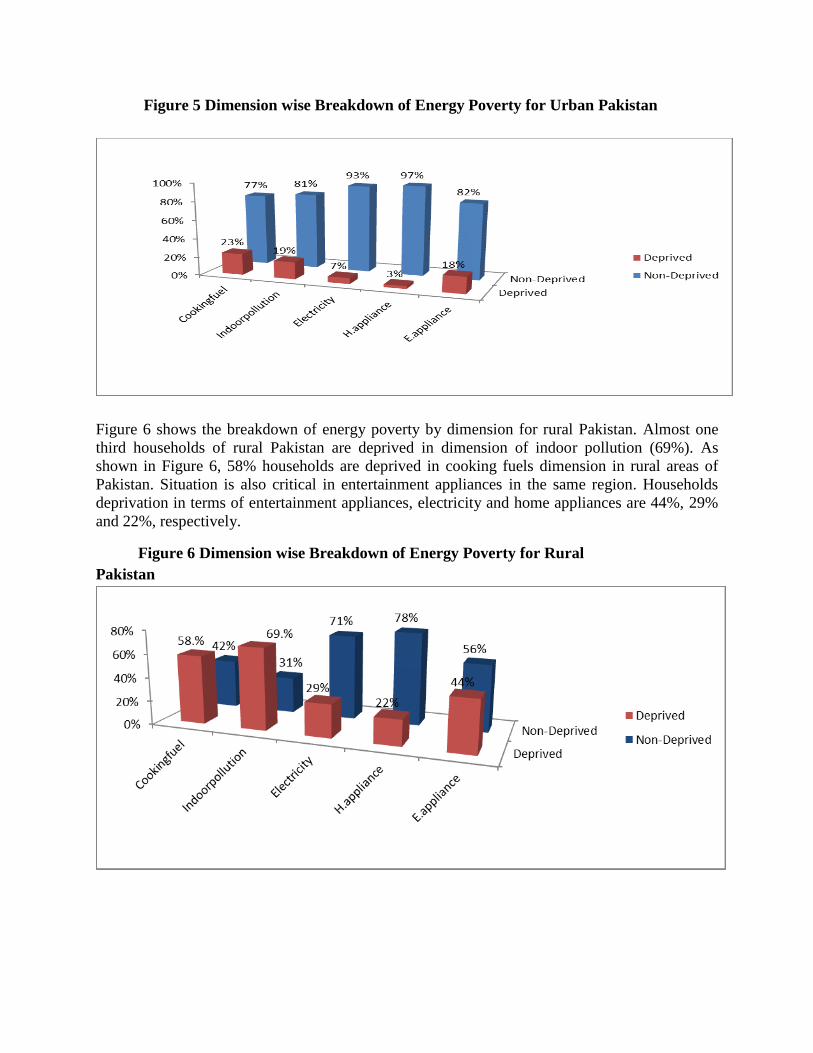
Figure 5 Dimension wise Breakdown of Energy Poverty for Urban Pakistan
Figure 6 shows the breakdown of energy poverty by dimension for rural Pakistan. Almost one
third households of rural Pakistan are deprived in dimension of indoor pollution (69%). As
shown in Figure 6, 58% households are deprived in cooking fuels dimension in rural areas of
Pakistan. Situation is also critical in entertainment appliances in the same region. Households
deprivation in terms of entertainment appliances, electricity and home appliances are 44%, 29%
and 22%, respectively.
Figure 6 Dimension wise Breakdown of Energy Poverty for Rural
Pakistan

Figure 7 shows the contribution of urban and rural deprived households to Multidimensional
Energy Poverty head count for overall Pakistan. Contribution of rural and urban deprived
households to multidimensional energy poverty in Pakistan is 71% and 29%, respectively.
Figure 7 Results of Contribution of Region wise Deprived Households to
Multidimensional Energy Poverty Headcount for Overall Pakistan
Figure 8 shows contribution of selected dimensions in multidimensional energy poverty
headcount. In the paradigm of multidimensional energy poverty in Pakistan contribution of
indoor pollution (32%) is the highest followed by the cooking fuels dimension (31%).
Collectively these two dimensions contribute up to 63% in overall Multidimensional Energy
Poverty head count for Pakistan. While electricity, home appliances and entertainment
appliances contribute to overall Multidimensional Energy Poverty head count for Pakistan 11%,
8% and 18%, respectively.
Figure 8 Results of Dimension-wise Contribution to Multidimensional Energy Poverty
Headcount for Pakistan

Figure 9 shows percentage of households deprived in exact number of deprivations in overall
Pakistan. In overall Pakistan, 95% households are deprived when we set k=1. Households
deprivation in energy decreases with the increase in value of cut offs.
Figure 9 Results of Percentage of Deprived Households at Different Cut Offs
5. CONCLUDING REMARKS AND POLICY RECMENDATION
Based on results, the study concludes that there is significant and higher incidence & severity of
energy poverty in rural areas as compared to urban areas, not only in overall Pakistan but in all
provinces also. Value of MEP Headcount is for rural Pakistan is 71% as compared to 29% in
urban areas of Pakistan. Results show that Multidimensional Energy Poverty head count for rural
Pakistan is 71.4% and 28.6% of the households residing in rural areas of Pakistan are energy
poor and non-poor. Results show that households of Pakistan are most deprived in cooking fuel
dimension (55%), while deprivation is the least in dimension of home appliances ownership
(15%). In urban areas of Pakistan households are more deprived in dimension of cooking fuels
(23%) followed by indoor pollution (19%). Almost one third households of rural Pakistan are
deprived in dimension of indoor pollution (69%). Contribution of rural and urban deprived
households to multidimensional energy poverty in Pakistan is 71% and 29%, respectively.
Contribution of indoor pollution (32%) to multidimensional energy poverty headcount in
Pakistan is the highest followed by the cooking fuels dimension (31%) and collectively these two
dimensions contribute up to 63% in overall Multidimensional Energy Poverty head count for
Pakistan. Study further concludes that households deprivation in energy decreases with the
increase in value of cut offs. Overall indoor pollution, cooking fuel and Entertainment appliances
are the three major contributors, to overall MEP Headcount not only as a whole but region wise
also.
Based on above findings, the study suggests taking special initiatives to combat Energy Poverty
in most deprived areas particularly the rural areas on priority basis by allocating more funds to
them. Indoor pollution and cooking fuel being the major contributors to overall multidimensional
energy poverty in overall Pakistan and regions also, energy poverty in these dimensions should

be individually addressed in order to reduce overall multidimensional energy poverty. Provision
of subsidized solar panels, bio-gas plants and modern cooking stoves can help a lot in this regard.
References
Alkire, S., and Foster, J. (2007). Counting and multidimensional poverty measures. Working
Paper No. 7, Oxford University: Oxford Poverty and Human Development Initiative.
Alkire, S., and Foster, J. (2009). Counting and Multidimensional Poverty Measurement
(Revised and Updated). Working Paper No. 32, Oxford Poverty and Human Development
Initiative, University of Oxford.
Alkire, S., and Santos, M.E. (2010). Acute Multidimensional Poverty: A new index for
developing countries. Working Paper No. 38, Oxford Poverty and Human Development
Initiative, University of Oxford.
Alkire, S., and Seth, S. (2009). Measuring multidimensional poverty in India: A New
Proposal. Working paper No. 15 Oxford University: Oxford Poverty and Human
Development Initiative.
Bazilian, M., Nussbaumer, P., Cabraal, A., Centurelli, R., Detchen, R., Gielen, D., Rogner,
H., Howells, M., McMahon, H., Modi, V., Nakicenovic, N., O’Gallachoir, B., Radka, M.,
Rijal, K., Takada, M. and Ziegler, F.( 2010). Measuring energy access: Supporting a global
target. Earth Institute, Columbia, N.Y., USA.
Bielecki, J. (2002). Energy security: Is the wolf at the door?. The Quarterly Review of
Economics and Finance. 42, 235–250.
Clancy, J. S. and Skutsch, M. and Batchelor, S.(2003). Finding the energy to address gender
concerns in development. UK Department for International Development DFID Project
CNTR 998521.
Elahee, K. (2010). Access to energy: The key to poverty alleviation. The Small Island
Developing States.
Goldemberg, J. and Johansson, T. B.(1983). Energy as an instrument for Socio-Economic
development. Technological Forecasting and Social Change, 24, 17-42 .
IAEA.( 2005). Energy Indicators for Sustainable Development: Guidelines and
Methodologies. Vienna: International Atomic Energy Agency.
IEA, UNDP, and UNIDO.( 2010). Energy Poverty – How to make modern energy access
universal? Special early excerpt of the world energy outlook 2010 for the UN General
Assembly on the Millennium Development Goals. Paris: International Energy Agency.
IEA. (2010). World Energy Outlook 2010. Paris: International Energy Agency.
Jain, G. (2004). Alleviating energy poverty: Indian Experience. Regulatory Studies and
Governance Division. The Energy and Resources Institute.
Marcio, G. P., Aure, M. Freitas, L. V. and Silva, N. F. (2010). Rural electrification and
energy poverty: Empirical evidences from Brazil. , 14, 1229–1240.
Mirza, B., and Szirmai, A. (2010). Towards a new measurement of energy poverty: A cross-
community analysis of rural Pakistan. UNU-MERIT Working Paper Series 024, United
Nations University, Maastricht Economic and Social Research and Training Centre on
Innovation and Technology.
Nussbaumer, P., Bazilian, M., Modi, V., and Yumkella, K.K. (2011). Measuring energy
poverty: Focusing on what matters. Working paper No. 42, Oxford University: Oxford
Poverty and Human Development Initiative.

Pachauri, S. and Spreng, D. (2004). Energy use and energy access in relation to poverty.
Centre for Energy Policy and Economics Swiss Federal Institute of Technology.
Pachauri, S., and Spreng, D. (2003). Energy use and energy access in relation to poverty.
CEPE Working Paper No. 25. Switzerland: Centre for Energy Policy and Economics.
Pachauri, S., Muller, A., Kemmler, and Spreng, D.(2004). On measuring energy poverty in
Indian households. World Development, 32(12), 2083–2104.
Stephen, K., Kimani, J., and Amenya, S. (2004). Improving energy access: Possible
contribution of RETs to poverty alleviation. Global Network on Energy for Sustainable
Development.
Tennakoon, D. (2009). Energy poverty: Estimating the level of energy poverty in Sri Lanka.
Practical Action, Intermediate Technology Development Group. United Nations.