An investigation of goodwill impairment testing practices ... · Australia are required, by the...
54
Swinburne University of Technology Faculty Business and Enterprise An investigation of goodwill impairment testing practices in Australia public companies Merina Farida Bachelor of Business (Honours) Supervisor: Dr Geoff Speight Submitted: November 2008
Transcript of An investigation of goodwill impairment testing practices ... · Australia are required, by the...
Swinburne University of Technology
Faculty Business and Enterprise
An investigation of goodwill impairment testing practices in Australia public companies
Merina Farida
Bachelor of Business (Honours)
Supervisor: Dr Geoff Speight
Submitted: November 2008

i
DECLARATION
I assert, to best of my knowledge, that this thesis does not contain any work that has
been previously submitted for a degree at any educational institution or for publication
without due reference made.
Merina Farida
7 November 2008

ii
ACKNOWLEDGEMENTS
First of all, I want to thank my beloved family, even though you all were not here
during preparation of my thesis. By knowing that you will always be there for me,
helped me went through this one year.
I would like to thank my supervisor, Geoff Speight. for his invaluable guidance. Thank
you very much for guiding me and for making me think harder.
I would also like to thank my Research Methodology lecturer, Sharon Grant, for
preparing me in writing of my thesis. Thanks a lot for your time in assisting me to write
better thesis.
Last but not least, I would like to thank my flatmate, Angeline Elias, for being there. I
really appreciate your cheering attitude and for making this year easier and more fun for
me.

iii
Table of Contents
DECLARATION ………………………………………………………………………i
ACKNOWLEDGEMENTS ……………………………………………………………ii
Table of Contents ………………………………………………………………………iii
List of Tables …………………………………………………………………………...v
ABSTRACT ……………………………………………………………………………vi
1.0 INTRODUCTION…………………………………………………………………..1
1.1 Statement of Study Focus………………………………………………………..1
1.2 Definition of Key Terms…………………………………………………………2
1.3 Background………………………………………………………………………4
1.4Review and Synthesis of Relevant Literature…………………………………….5
1.4.1 Introduction to Business Combinations and Goodwill…................................5
14.2 A Brief History and Advantages or Disadvantages of Goodwill Impairment.6
1.4.3 Overview of Goodwill Impairment………………………………………….6
1.4.4 Method for Calculating Recoverable Amount: FVLCS…..............................7
1.4.5 Method for Calculating Recoverable Amount: VIU………………………...9
1.5 Formulation of Study Objectives and Hypotheses……………………………..11
1.5.1 Study Objectives……………………………………………………………11
1.5.2 Hypotheses………………………………………………………………….11
2.0 RESEARCH METHODOLOGY…………………………………………………..12
2.1 Research Design………………………………………………………………..12
2.2 Description/Rationale for Research Methodology……………………………..14
2.2.1 Sampling……………………………………………………………………14
2.2.2 Procedure…………………………………………………………………...15
2.3 Data Analysis…………………………………………………………………...16
2.3.1 FVLCS Method…………………………………………………………….16
2.3.2 VIU Method………………………………………………………………...18
iv
2.4 Summary of Research Methods………………………………………………..18
2.5 Limitations and Constraints of Research Method……………………………...19
3.0 DATA ANALYSIS AND DISCUSSION………………………………………….20
3.1 Preferred Method……………………………………………………………….25
3.2 Adherence to AASB Guidelines………………………………………………..25
3.3 Consistency of Impairment Testing Practices………………………………….26
3.3.1 Pre-tax Discount Rates……………………………………………………..26
3.3.2 Growth Rate………………………………………………………………...31
4.0 DISCUSSION AND CONCLUSION……………………………………………...41
4.1 Impairment Testing Method……………………………………………………41
4.2 Rate of Risk…………………………………………………………………….41
4.2.1 Capital Goods Industry…………………………………………………….41
4.2.2 Commercial Supplies and Services………………………………………...41
4.2.3 Information Technology (IT) Industry……………………………………..41
4.3 Growth Rates…………………………………………………………………...42
4.3.1 Capital Goods Industry……………………………………………………..42
4.3.2 Commercial Supplies and Services………………………………………...42
4.3.3 Information Technology (IT) Industry……………………………………..42
References and Bibliography…………………………………………………………..43
Appendix……………………………………………………………………………….46

v
List of Tables
Table 1: Definition of Key Terms…..............................................................................2
Table 2: Capital Goods Industry Data………………………………………………..20
Table 3: Commercial Services and Supplies Industry Data……………………….....22
Table 4: Information Technology (IT) Industry Data………………………………..25
Table 5: Rates of Risk Used by Companies in Capital Goods Industry……………...27
Table 6: Rates of Risk Used by Commercial Services and Supplies Industry……….29
Table 7: Rates of Risk Used by Companies in IT Industry…………………………..30
vi
ABSTRACT
In 2005, Australian Accounting Standard Board (AASB) adopted International
Financial Reporting Standards (IFRS) to apply impairment testing on acquired
goodwill, instead of amortising it on straight line basis. The Australian companies can
choose either fair value less cost to sell (FVLCS) method and value in use (VIU)
method. All companies under this study (consisted of 18 companies) choose to use VIU
method to test whether their goodwill is impaired.
The 18 companies were divided into three industries, i.e. capital goods industry,
commercial services and supplies industry and information technology (IT) industry. In
order to investigate whether the companies’ impairment testing practices are consistent
with the standard and with each other, comparison between the companies (using pre-
tax discount rates) and in the company itself (using growth rate) were undertaken. For
consistency, only companies in same industry were compared with each others.
Overall, based on information provided in the companies’ annual reports, impairment
testing practice (VIU method) in Australian companies is consistent with the standard
guidelines. Furthermore, the companies’ practices in capital goods industry and
commercial services and supplies industry are consistent with each other.
However, companies’ practices in IT industry are not consistent with each other. This
may due to the fact that companies in IT industry have their own competitive advantage
which differ them from each other.

Page 1 of 47
1.0 INTRODUCTION
1.1 Statement of Study Focus
Acquired goodwill, as defined in Australian Accounting Standards, is the excess of
consideration paid over the fair value of company acquired. Acquired goodwill
represents the economic benefits expected to arise from unidentifiable assets of
company acquired. Acquired goodwill is subject to impairment testing which defined as
process of identifying whether the value of an asset or a group of assets has been
impaired.
Australian Accounting Standards provide guidelines regarding how to conduct
impairment testing for an asset and/or a group of assets. However, since the guidelines
are merely ‘guidelines’, how the testing is done may depend on management discretion.
The guidelines identify two different methods, namely fair value less cost to sell
(FVLCS) method and value in use (VIU) method. Companies with acquired goodwill in
Australia are required, by the Australian Accounting Standard Board standard no. 136
(AASB 136) - Impairment of Assets, to choose one of these methods in conducting
impairment testing of acquired goodwill.
This thesis aims to investigate differences in (acquired) goodwill impairment testing in
publicly listed Australian companies, in particular, differences in the extent to which
companies adhere to Australian Accounting Standard guidelines. This study will
compare companies’ impairment testing practices against the standard guidelines and
determine whether the companies’ practices are consistent with the guidelines and with
each other.
Furthermore, the thesis examines which method is mostly used by the companies.
Another purpose of this research is to investigate whether it is necessary for the
Australian Accounting Standard Board (AASB) should consider providing more
detailed guidelines for VIU method and whether to abolish FVLCS method, or vice
versa.
Page 2 of 47
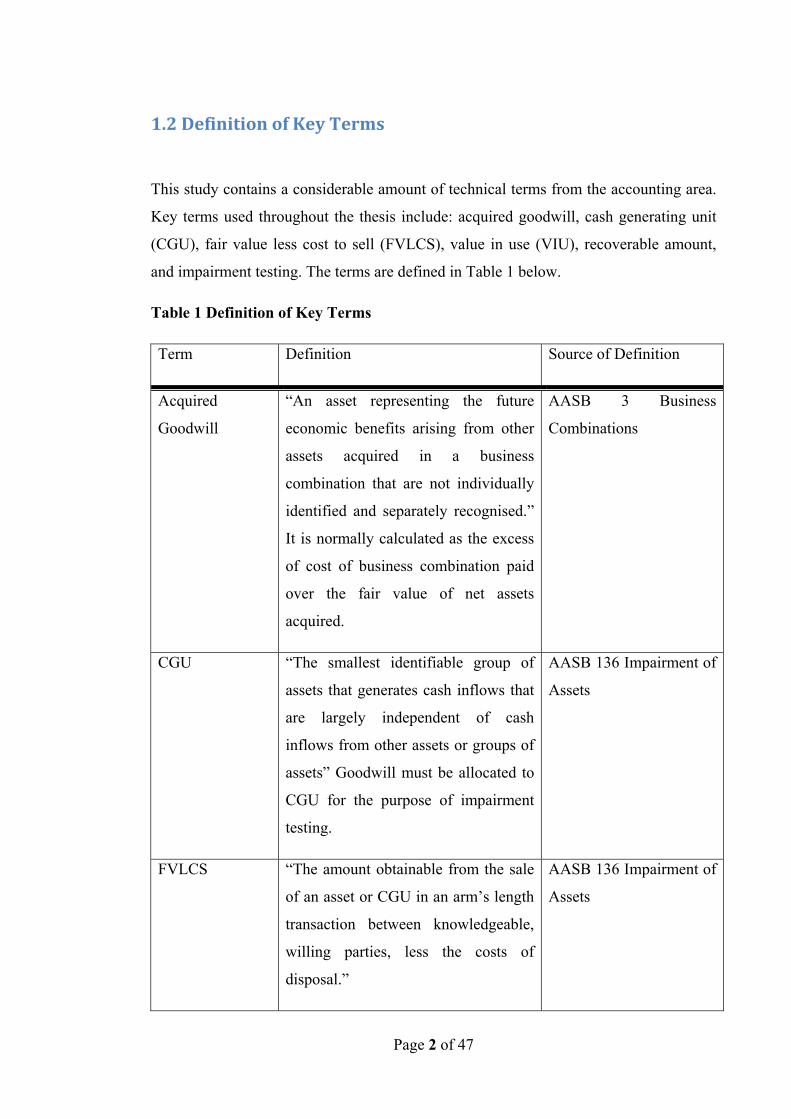
1.2 Definition of Key Terms
This study contains a considerable amount of technical terms from the accounting area.
Key terms used throughout the thesis include: acquired goodwill, cash generating unit
(CGU), fair value less cost to sell (FVLCS), value in use (VIU), recoverable amount,
and impairment testing. The terms are defined in Table 1 below.
Table 1 Definition of Key Terms
Term Definition Source of Definition
Acquired
Goodwill
“An asset representing the future
economic benefits arising from other
assets acquired in a business
combination that are not individually
identified and separately recognised.”
It is normally calculated as the excess
of cost of business combination paid
over the fair value of net assets
acquired.
AASB 3 Business
Combinations
CGU “The smallest identifiable group of
assets that generates cash inflows that
are largely independent of cash
inflows from other assets or groups of
assets” Goodwill must be allocated to
CGU for the purpose of impairment
testing.
AASB 136 Impairment of
Assets
FVLCS “The amount obtainable from the sale
of an asset or CGU in an arm’s length
transaction between knowledgeable,
willing parties, less the costs of
disposal.”
AASB 136 Impairment of
Assets

Page 3 of 47
VIU “The present value of the future pre-
tax cash flows expected to be derived
from an asset or CGU.” It’s required
by the standard to apply appropriate
discount rate to the cash flows.
AASB 136 Impairment of
Assets
Recoverable
Amount
“The higher of an asset’s or cash-
generating units’ (CGU) fair value
less cost to sell (FVLCS) and its value
in use (VIU).” However, “if either of
these amounts exceeds the asset’s
carrying amount, the asset is not
impaired and it is not necessary to
estimate the other amount.”
AASB 136 Impairment of
Assets
Impairment
Testing
“An asset is impaired if the asset’s
carrying amount exceeds the
recoverable amount of the asset, as the
asset’s value should be written down
to its recoverable amount.” Therefore,
impairment testing is the process to
identify whether the recoverable
amount of an asset is less than its
carrying amount.
AASB 136 Impairment of
Assets

Page 4 of 47
1.3 Background
In general, there are two methods of growth for a company. It can grow organically, i.e.
growing by improving and/or developing itself internally, and/or it can grow by
acquiring other companies, i.e. business combination, which eventually will result in the
acquiring company expanding its business and market share. Companies nowadays are
growing by a combination of both.
Per AASB 3, when a company purchases another company, acquired goodwill (from
this point onwards, referred as ‘goodwill’) will arise if the purchase consideration given
exceeds the fair value of net assets acquired. The amount of the excess is the value of
the goodwill. Practically, the excess represents the willingness of the acquirer to pay a
premium due to qualities of the acquired company, e.g. efficient management,
competent staff, and considerable amount of loyal customers.
Goodwill is recognised under the Australian Accounting Standards as an intangible
asset (despite the fact it is not individually identified and separately recognised) with
assumption that it has indefinite useful life. Companies are required by AASB 136 to
test their intangible assets annually to see if the value has declined, irrespective of
whether there is an indication of impairment.
AASB 136 also requires companies to recognise impairment loss in their statement of
comprehensive income (formerly known as profit and loss (P&L) statement) if the
carrying amount of any asset exceeds the asset’s recoverable amount. Therefore, after
goodwill is allocated to cash generating unit, the company is required to do impairment
testing on the goodwill allocated to cash generating unit on an annual basis. If there is
any impairment loss, the amount of loss should be deducted against the value of the
goodwill. Par. 104 of AASB 136 states that if the amount of the impairment loss
exceeds the carrying amount of the goodwill, the excess is allocated to other assets of
the unit on a pro-rata basis based on their carrying amount. As stated above, an entity
can choose either FVLCS method or VIU method to calculate the recoverable amount
of the cash generating unit.

Page 5 of 47
1.4 Review and Synthesis of Relevant Literature
1.4.1 Introduction to Business Combinations and Goodwill
Per AASB 3, business combination is the event of combining two or more businesses
where one party (the acquirer) obtains control of the combination. According to
Seetharaman, Sreenivasan, Sudha and Yee (2005), in business combination, goodwill
represents the willingness of acquirer company to pay in excess of the value of net
assets stated in the balance sheet.
Nethercott and Hanlon (2002) also state that goodwill is the remaining balance of
purchase consideration (price paid) for a company after all its identifiable assets have
been valued and deducted from the purchase consideration. For example, Company A
acquires Company B. Company A buys Company B for the amount of A$1 million.
However, the net assets value of B is A$900,000. Hence, A will report goodwill asset of
A$100,000 in its financial statement.
Seetharaman et al. (2005) state that, unlike other assets, goodwill is intangible and not
separately measurable. This means it is not possible for an acquiring company to
acquire goodwill without acquiring the whole or a considerable portion of the acquired
company as goodwill cannot be separated from the company. According to Badawi and
Dorata (2007), goodwill is a remaining value which is computed as the difference
between the fair value of the acquired company as a whole and the fair value of the net
assets actually acquired.
Furthermore, Nethercott and Hanlon (2002) argue that goodwill represents the assets
that are not capable of being individually identified and separately recognised. That is,
goodwill represents the future benefits the acquirer company expects to derive, mainly
through the efficiency and effectiveness of the acquired company which cannot be
separately recognised as an asset in the balance sheet (generally future benefits would
include superior operating teams and market penetration). Duangploy, Shelton and
Omer (2005) state that research has shown that the market perceives goodwill as an
asset.

Page 6 of 47
1.4.2 A Brief History and Advantages or Disadvantages of Goodwill
Impairment
Accounting for goodwill changed in Australia for all reports produced on or after the 1
January 2005 when Australia adopted the International Financial Reporting Standards
(IFRS) (Wines, Dagwell and Windsor 2007). Goodwill value was previously subject to
mandatory amortisation over a maximum 20-year period which would be completely
written off its value over a period of time. Lamond (1995, p.68) (cited in Wines et al.
2007, p.865) argues that “there is no explanation for the magical 20 year selection of the
maximum amortisation period for goodwill in Australia”. However, after the adoption
of the IFRS, goodwill acquired in a business combination is no longer amortised but
shall be tested for impairment whenever there is an indication that its value may have
been impaired or at least annually (Wines et al. 2007).
Wines et al. (2007, p.868) argued that the overall advantages of the adoption, from
financial statements perspective, are that the goodwill value will be more closely
aligned to “a real assessment of asset value” and “a real economic decline in value”.
Donnelly and Keys (2002) stated that, unlike goodwill amortisation, goodwill
impairment testing can adequately reflect a decline in value of goodwill. The change
provides for more valid financial statements, but also requires accountants to select
proper methods to estimate whether there is any impairment losses ( Lander and
Reinstein 2003).
The change from amortisation to annual impairment testing improves a new and
continuous responsibility on management to estimate the recoverable amount of CGU
of which the goodwill belongs, as well as a new burden on auditors, regulatory bodies,
and investors to evaluate management’s estimation (Hayn and Hughes 2006). Wines et
al. (2007) suggested the requirement for more estimation of goodwill value may
introduce increased uncertainty and decreased transparency, as the new goodwill
treatment relies on professional judgement by financial reports preparers and auditors.

Page 7 of 47
1.4.3 Overview of Goodwill Impairment
The purpose of testing goodwill for impairment annually is to determine whether it
continues maintaining its value (Massoud and Raiborn 2003). Impairment exists when
the carrying amount of goodwill exceeds its implied recoverable amount, and if there is
any impairment loss, it is stated as an expense item in the income statement (Duangploy
et al. 2005). The recoverable amount of CGU is its higher value calculated under
FVLCS and VIU methods (Romano 2008). If the value calculated under one method is
higher than the CGU’s carrying amount, then the other value does not have to be
calculated (Shoaf and Zaldivar 2005).
Romano (2008) suggested that as goodwill does not generate cash inflows
independently of other assets, it cannot be tested for impairment independently.
Furthermore, for the purpose of impairment testing, goodwill acquired in business
combination should, from business combination date, be allocated by the acquirer
company to its CGU (Shoaf and Zaldivar 2005). Hayn and Hughes (2006) argued that
identifying CGU and allocating goodwill to them is one of the most difficult tasks. This
is being so, as discussed by Shoaf and Zaldivar (2005), the acquirer should allocate the
goodwill to CGU expected to benefit from the business combination from which the
goodwill is derived.
Shoaf and Zaldivar (2005) stated that, in conducting goodwill impairment testing, the
carrying amount of CGU is compared with its recoverable amount. An impairment loss
is recognised for goodwill when its CGU recoverable amount is less than its CGU
carrying amount (Wines et al. 2007). Accordingly, goodwill value must be written down
by an amount equivalent to amount of which the CGU’s carrying amount exceeds its
recoverable amount (Shoaf and Zaldivar 2005). However, if the carrying amount of
goodwill allocated to the CGU does not cover the impairment loss, the excess of
impairment loss is allocated to other assets in the CGU on a pro rata basis (Wines et al.
2007).

Page 8 of 47
1.4.4 Method for Calculating Recoverable Amount: FVLCS
According to Romano (2008), the best evidence in determining FVLCS of a CGU is the
CGU’s binding sale agreement less any related costs to sell the CGU (excluding finance
cost, income tax expense, and costs already recognised as liability). The FVLCS method
is the only appropriate valuation of recoverable amount of a CGU held for sale under
binding sale agreement (Olde 2007). However, if there is an active market for CGUs
instead of a binding sale agreement, then the recent transaction or market price (less
costs to sell) for similar CGUs within the same industry might be the best evidence in
determining the recoverable amount of CGUs under FVLCS method. Barth and
Landsman (1995) argued that there is lack of availability of market prices for all assets
(including CGU) since not all assets are actively traded.
Furthermore, if both binding sale agreement and transaction price for similar CGUs
within the same industry are not available, companies are allowed to make an estimation
(based on best available information) for the CGU’s selling price less costs to sell
(Ivory 2006). However, this information might not be readily available and its
estimation might be costly (Shoaf and Zaldivar 2005). Nevertheless, the AASB 136
does not prescribe how the estimation should be calculated (Ivory 2006). It is suggested
that more specific information on the performance of the CGU is needed to assess the
fair value of goodwill and its change over time (Hayn and Hughes 2006).
Ivory (2006) argued that FVLCS can be divided into its component parts, namely “fair
value” and “costs to sell.” Fair value is determined from an estimation of price
obtainable from the sale of asset(s) in an arm’s length transaction between willing
parties, i.e. the seller and the buyer (Shoaf and Zaldivar 2005). The fair value computed
for CGU in the current year is allowed to be carried forward to next years if no
significant change occurs (Duangploy et al. 2006).
According to Barth and Landsman (1995), when the market is not perfect or complete,
fair values are ambiguously unique as, alternatively, it may be calculated using three
concepts; being entry value, exit value and value in use which are not likely to be equal.
Measurement of fair value involves using models, estimations and assumptions
(Schipper 2003). This statement is also supported by Wines et al. (2007), who argued
that estimation of fair value is often based on subjective assumptions and judgement

Page 9 of 47
which can lead to the determination of goodwill value (or CGU’s recoverable amount)
resulting in wide variations.
1.4.5 Method for Calculating Recoverable Amount: VIU
Donnelly and Keys (2002) define VIU as “present value of estimated future cash flows
expected to arise from continuous use of an asset and from its disposal at the end of its
useful life.” Hence, the calculation of VIU should reflect an estimation of future cash
flows based on reasonable and supportable assumptions (for example, recently approved
budgets and forecasts), and VIU should also reflect the pre-tax discount rate which is
consistent with current market assessments of the time value of money and the (rate of)
risks specific to the asset or CGU (Ivory 2006). Companies may use a steady or
declining growth rate that is consistent with that of the product, industry, or country in
calculating the future cash flows projection of the CGU (Romano 2008).
The projected future cash flows must exclude any inflows and outflows expected to
arise from future asset improvements (Ivory 2006). Furthermore, according to Ivory
(2006), if market pre-tax discount rate plus asset-specific risk rate is not available, a
surrogate must be used based on other rates such as the company’s own weighted
average cost of capital (WACC), the company’s incremental borrowing rate, or other
market borrowing rates. Even though WACC fluctuates with the entity’s capital
structure, companies often assume a constant WACC based on the firm’s target debt to
equity ratio (Lander and Reinstein 2003).
According to Barth and Landsman (1995), the VIU concept has a long history in the
accounting literature and its estimation is often difficult because it involves prediction
of future cash flows, selection of appropriate discount rate, and knowledge of asset
synergy. An estimation of recoverable amount under VIU method can be maximised by
estimating annual cash flows and salvage value (selling price of an asset at the end of its
useful life) of the CGU at the maximum amount possible, and adopting the lowest
possible discount rate (Wines et al. 2007).

Page 10 of 47
As the future cash flows can be maximised at the maximum amount possible, the
estimation of future cash flows might not be verifiable and valuation based on them are
likely to be manipulated (Watts 2003). According to Massoud and Raiborn (2003),
these incidents happen as companies might choose to recognise impairment losses in the
manner that selectively “fits” their operating results. Besides that, the amount of
goodwill impairment loss has a relatively large impact on total assets of a company as it
can reduce the company assets’ book value. This might increase the debt-to-equity ratio,
signalling the rising possible insolvency of the company which consequently will
depress the value of the company (Duangploy et al. 2006).
Lander and Reinstein (2003) argued that the discount rate is estimated with error. This
is due to measurement errors. Barth and Landsman (1995) argued there are two types of
measurement error. The first is “unsystematic error” arising from general uncertainty,
and the second is “systematic error” arising from management’s discretion in making
the estimate. The error caused by the management would reduce investors’ perception
of the company value (Barth and Landsman 1995).
However, manipulation might not always be the case for company’s management. As
described by Wines et al. (2007), it’s important for corporate governance mechanisms to
result in effective and independent oversight of management’s knowledge and economic
power regarding the goodwill valuation process.

Page 11 of 47
1.5 Formulation of Study Objectives and Hypotheses
1.5.1 Study Objectives The objectives of this study are:
to understand the practical implementation of goodwill impairment testing in
Australian publicly listed companies;
to investigate whether the companies’ practices are adhering to AASB guidelines;
to examine the consistency of companies’ practices, by comparing the practices of
companies within the same industry; and
to investigate which method (for calculating the recoverable amount of CGU) is
most commonly used by the companies under review.
The study has implications for AASB impairment testing guidelines. If the commonly
used method has been implemented according to AASB guidelines, perhaps AASB
should consider developing more guidelines for the method. If all companies use same
method, AASB should consider discarding other method.
1.5.2 Hypotheses There are no existing studies that are directly related to objectives of this study. Thus,
this research will make a contribution to the literature by investigating impairment
testing practices in Australian companies.
However, even without explicit reason, Olde (2007) believed it is more logical and
appropriate to calculate the recoverable amount of CGU under VIU method rather than
under FVLCS method. Barth and Landsman (1995) argued that estimating value-in-use
involves integrating company specific and potentially private information.
Thus, it is hypothesised that most of Australian publicly listed companies will adopt
VIU method. The rationale is that internally available information will be more relevant
in estimating the CGU’s recoverable amount (bearing in mind assets or CGU of each
company have their own uniqueness), and it will be less costly.

Page 12 of 47
2.0 RESEARCH METHODOLOGY
2.1 Research Design
This research began with the question of whether Australian public companies showing
goodwill on their balance sheet prefer to apply the value in use (VIU) method or the fair
value less cost to sell (FVLCS) method, in conducting impairment testing on their cash
generating units (CGU). This thesis aimed to investigate differences in the impairment
testing methods used by Australian companies, and the extent to which companies
adhere to Australian Accounting Standard Board (AASB) guidelines. Thus, this study
would compare companies’ impairment testing with recommended practices of the
AASB guidelines (under both VIU and FVLCS method) and/or would investigate
whether the companies’ practices were consistent with the guidelines as well as with
other companies using the same methodology (i.e. companies using VIU method would
be compared with each other and companies using FVLCS will be compared with each
other).
This thesis investigated the companies’ impairment testing practices through their
annual reports (year 2005 – 2007) and any related data and/or information available in
the market including the market interest rate for 2005 until 2007. The rationale for
examining the annual reports from year 2005 until 2007 was to identify differences and
changes in reporting practices over the time, as the goodwill impairment testing concept
was first applied in 2005. This time frame was chosen as it spans across the final year
of reporting under the ‘old’ Australian developed standards and the introduction and use
of the new international financial reporting standards (IFRS). During this transition, the
AASB ceased to implement the Australian standard requiring goodwill amortization and
replaced it with goodwill impairment testing as required under Australian International
Financial Reporting Standards (AIFRS).

Page 13 of 47
2.2 Description /Rationale for Research Methodology
2.2.1 Sampling
The population for this study was Australian publicly listed companies reporting
goodwill on their balance sheet. This study used a purposive sampling technique. This
means that companies are selected because they have been practising goodwill
impairment testing since year 2005. This research focused on a total of 18 Australian
publicly listed companies (17 of the companies are S&P/ASX300 companies). There
are sets of six companies chosen from three different industries. S&P/ASX300
companies are the top 300 public companies by market capitalisation currently listed in
ASX (Australian Securities Exchange). The companies were divided, based on industry,
in order to make the comparison more relevant, as companies in the same industry are
more likely to have similar assets (CGU) and/or business structure, as well as using
same market or industry data (Deegan, 2007).
Identification of the industry to which a company belongs was extracted from the Fin
Analysis (Aspect Huntley) database. However, all industries in ASX300 which does not
have companies reporting goodwill since year 2005 and/or companies have never
reported goodwill, were excluded from this study.
The first industry examined was the Capital Goods industry, represented by Alesco,
Hastie Group, Leighton Holdings, MacMahon Holdings, Monadelphous Group, and
United Group. The second industry was the Commercial Services and Supplies industry,
represented by Coffey International, Corporate Express Australia, Downer EDI,
Programmed Maintenance Services, Salmat, and SEEK. The last industry was the
Information Technology (IT) industry, represented by Computershare, Iress Market
Technology, MYOB, Oakton, Reckon, and UXC.
Seventeen companies of these are listed in ASX300. Reckon is a listed company but is
not in the ASX300. However, Reckon have had goodwill in their accounts since 2005.
Since there is no information how many Australian publicly listed companies have been
implementing goodwill impairment testing since 2005, the appropriate number (or
percentage) of companies required for sample representatives for this study could not be
determined. Considering the time limitation imposed, 18 companies seemed reasonable.

Page 14 of 47
The 18 companies were also chosen by considering the fact that they are market leaders
in their respective industries. As market leaders, they have responsibility to more
stakeholders who are affected by the companies’ performances.
In the Fin Analysis database, there are more than 10 industries to of which the ASX300
companies belong. After investigating annual reports of companies in the industries,
three industries were considered relevant for this study. The three industries included in
this study are the ones whose companies have been reporting goodwill in their balance
sheet since 2005. Most of the industries have less than 10 companies with goodwill.
Thus, choosing six companies from each of the three industries seemed to be an
appropriate method in selecting the sample.
2.2.2 Procedure The data collection for this study was based on publicly available information. The
sources for collecting the data would be the Fin Analysis website, companies’ official
websites, the ASX website, and government’s websites (e.g. ABS website and RBA
website). Fin Analysis database would also be used to obtain forecast data regarding the
growth of industries and companies in this study.
The data for this research was mainly collected from the companies’ annual reports. The
companies’ annual reports were obtained from Fin Analysis database. Data was also be
collected from available market information, data and/or analysis from Fin Analysis, as
well as any market and/or company announcement related to this research.
The following are the data which were collected from the annual reports:
For companies using FVLCS method, this study would identify which market data
the company used to estimate the fair value of the CGU to which the goodwill was
allocated.
For companies using VIU method, first of all, a search for the growth rate and pre-
tax discount rate used by the companies in projecting the net cash flows of the CGU
would be undertaken.
Page 15 of 47
Annual reports also provide the net profit of the company which may be used to justify
the company’s chosen growth rate. For example, if the company stated in the 2005
annual report that the projected annual growth rate for every year over the next five
years will be 9%, but, the net profit in year 2006 and 2007 only grew 1% and 2%
respectively from net profit in 2005. Then, the growth rate of 9% would be
questionable. Bear in mind, growth rate may not be growth in net profit but growth in
revenues or market share.
For consistency, a company’s growth rate would be compared with other growth rates
in the company itself, including growth rates of operating revenue and earning after tax.
The growth rates were also collected through the company’s annual reports. It would
also be compared against other companies’ (operating in the same industry) growth
rates, bearing in mind that those companies might have their own average growth rate
based on past experiences.
The CGU’s pre-tax discount rate would be compared with the market (interest) rate for
time value of money calculations, which could be collected from market available
information, i.e. Reserve Bank of Australia (RBA) website. The pre-tax discount rate
used in 2005 would be compared with market (interest) rate in 2005. However, every
company’s assets have specific risks attached to those assets. Therefore, when
estimating CGU’s pre-tax discount rate, the company must have added the rate on the
CGU’s risk into the market risk-free interest rate. If there was no market data of pre-tax
discount rate for similar CGU, comparison would be made with the companies within
the same industry.

Page 16 of 47
2.3 Data Analysis
2.3.1 FVLCS Method The 18 companies would be divided into two groups based on their impairment testing
methodology. For companies using FVLCS method, how the company determined the
amount of fair value of the CGU would be analysed. If the recoverable amount of the
CGU was based on the price under a binding sale agreement (for the CGU) less costs of
disposal, then the selling price (without deducting the costs of disposal) recorded in the
annual report of company under review (seller) would be compared to amount recorded
in the buyer company’s annual report.
Australian accounting standards describe a binding sale agreement as an agreement
between both parties to sell and to buy certain assets in the future. According to AASB
136, the costs of disposal are the amount (to be) estimated and/or actually paid by the
seller company. Further investigation of the costs of sale would not be necessary for the
purpose of this study. Hence, if the price recorded in both parties’ (of a binding sale
agreement of particular CGU) annual reports are the same (ignoring the costs of
disposal), it could be deduced that the selling company’s practice in impairment testing
has conformed to AASB guidelines. Furthermore, a company also can use the binding
sale agreement of similar CGU owned by other companies in the same industry as the
basis in estimating the recoverable amount of its own CGU under FVLCS method.
If the assets within the CGU are actively traded, the assets’ market (current bid) price
less costs of disposal will be the recoverable amount of the CGU. Therefore, the
analysis would focus on whether the company (whose CGU’s assets are actively traded)
quoted the market price less costs of disposal for that period as the recoverable amount
of the CGU in the same period. If the CGU’s assets are actively traded, then the
company would publish the costs of disposal as well.
A company can choose to determine the recoverable amount of the CGU under FVLCS
even in the absence of a binding sale agreement or transaction for similar CGU, and
even when there is no active market for assets in the CGU. In this case, the Australian
standard allows the use of a best estimate of the CGU’s market selling price less costs
of disposal, based on the best information the company can obtain. However, the
standard does not explain or provide any guidelines of how the estimation process can

Page 17 of 47
be implemented. For companies using this method, the data would be analysed by
tracking how the companies obtain the best information to estimate the selling price of
CGU.
2.3.2 VIU Method For companies using VIU method, investigation of whether they are consistent with
standard’s guidelines as well comparable with the fellow companies in the same
industry, the pre-tax discount rate and growth rate would be analysed. Based on the
standard guidelines from AASB, CGU’s pre-tax discount rate should reflect the current
market risk-free interest rate plus risks specific to the CGU. The applied risk-free
interest rate would be deducted from the pre-tax discount rates of CGU’s companies in
the same industry which are using VIU method. The deduction would show how much
(rate of) risk each company allocates to their CGU. Then, the rate of risk would be
analysed and compared among the companies within the same industry. This analysis
showed the consistency of the companies’ rate of risk, which eventually may summarise
the consistency of the companies’ impairment testing practices with standard guidelines
as well as with other companies within the same industry.
Unlike the pre-tax discount rate, the method to generate growth rate for projecting the
future cash flows is not guided by the standard. However, this study would analyse the
growth rate used by the companies within the same industry, to test their consistency
with each other. As stated by the previous example, the company’s other growth rates
would also be used to test the accuracy of the company’s CGU predicted growth rates.
It is necessary to analyse the pre-tax discount rate and growth rate of the companies.
Inappropriate values allow companies which may manipulate the rates for their own
benefit. For example, a company may choose a lower pre-tax discount rate to discount
back the projected cash flows (in calculating the value in use of the CGU) to present
value, which will lead to higher recoverable amount. Alternately, the company may
choose higher growth rate when calculating the percentage growth in cash flows from
year to year. This manipulation will also lead to higher recoverable amount.

Page 18 of 47
2.4 Summary of Research Methods
For data collection, the annual reports from 2005 to 2007 of the 18 companies were
collected from the companies’ websites. The market risk-free interest rates will be
collected from the RBA website. The industries’ growth rates will be collected from
ASX and ABS websites.
For data processing, the carrying amount of goodwill, the method for calculating the
recoverable amount, recoverable amount of CGU, the pre-tax discount rate and growth
rate of the companies under review were obtained from the companies’ annual reports.
The annual average of market risk-free interest rates from 2005 to 2007 might need to
be calculated for data collected from RBA website.
For data analysis, companies using FVLCS method would be directly compared using
any related market available information. For companies using VIU method, the pre-tax
discount rates and the companies’ growth rates needed to be calculated in order to make
meaningful comparison. This study also analysed whether FVLCS or VIU method is
mostly used by the companies under review in calculating the recoverable amount of the
CGU.

Page 19 of 47
2.5 Limitations and Constraints of Research Method
There are three limitations of this study. Firstly, as the research of this study is based on
secondary data, there may be limited information. Thus, in-depth analysis, such as
examining projected cash flows the company used in determining the recoverable
amount of its CGU, could not be conducted for this study. Ideally, it should be done by
examining the company’s budget reports which are not available to public.
Secondly, the CGU of each company has its own uniqueness which might differentiate
it from each other. This means that the comparison (directly or indirectly) may not be
that appropriate.
Thirdly, there is no information regarding the population of Australian publicly listed
companies which have been reporting goodwill in their balance sheet since 2005. The
sampling selection may be biased as the population may be under-represented.
Finally, the allocation of goodwill to the CGU is at the discretion of the company and
this data is not available publicly and can be used to manipulate the calculation system.

Page 20 of 47
3.0 DATA ANALYSIS AND DISCUSSION
Table 2 Capital Goods Industry Data
Growth Rate Pre – tax Discount RateNo. Company FV
L
CS
VIU
2005 2006 2007 2005 2006 2007
1 Alesco - YES - - - 13.2% 12.2% 11.3%
2 Hastie Group - YES - - - 13.5% 13.5% 13.5%
3 Leighton - YES - - - 11.8% 11.5% 11.5%
4 Macmahon - YES - 10% 10% - 17.7% 15.4%
5 Monadelphous - YES - - - 10% 10% 10%
6 United Group - YES - - - - - -
Table 2 shows that:
1) Alesco financial year ends at 31 May. Alesco used WACC rate instead of pre –
tax discount rate. It did not provide its WACC rates in its annual reports.
However, from information provided in Alesco’s annual reports, WACC rates
were calculated. For consistency with other companies, the WACC rates were
converted to pre – tax discount rates (please refer to Appendix A for the
calculation). There was no goodwill impairment in 2006 and 2007.
2) Hastie Group financial year ends at 30 June. There was no goodwill impairment
in 2006.
3) Leighton financial year ends at 30 June. The recoverable amount of its CGU is
calculated using 5-year cash flow projections (there is no growth rate disclosed).
Leighton had goodwill impairment in 2006, but there was no goodwill
impairment in 2005 and 2007.

Page 21 of 47
4) Macmahon financial year ends at 30 June. There was no goodwill impairment in
2005, 2006, and 2007.
5) Monadelphous financial year ends at 30 June. The growth rate of its CGU is
based on the entity’s budgeted cash flows. There was no goodwill impairment in
2005, 2006, and 2007.
6) United Group financial year ends at 30 June. There was no impairment loss on
goodwill in 2005, 2006, and 2007.
Page 22 of 47
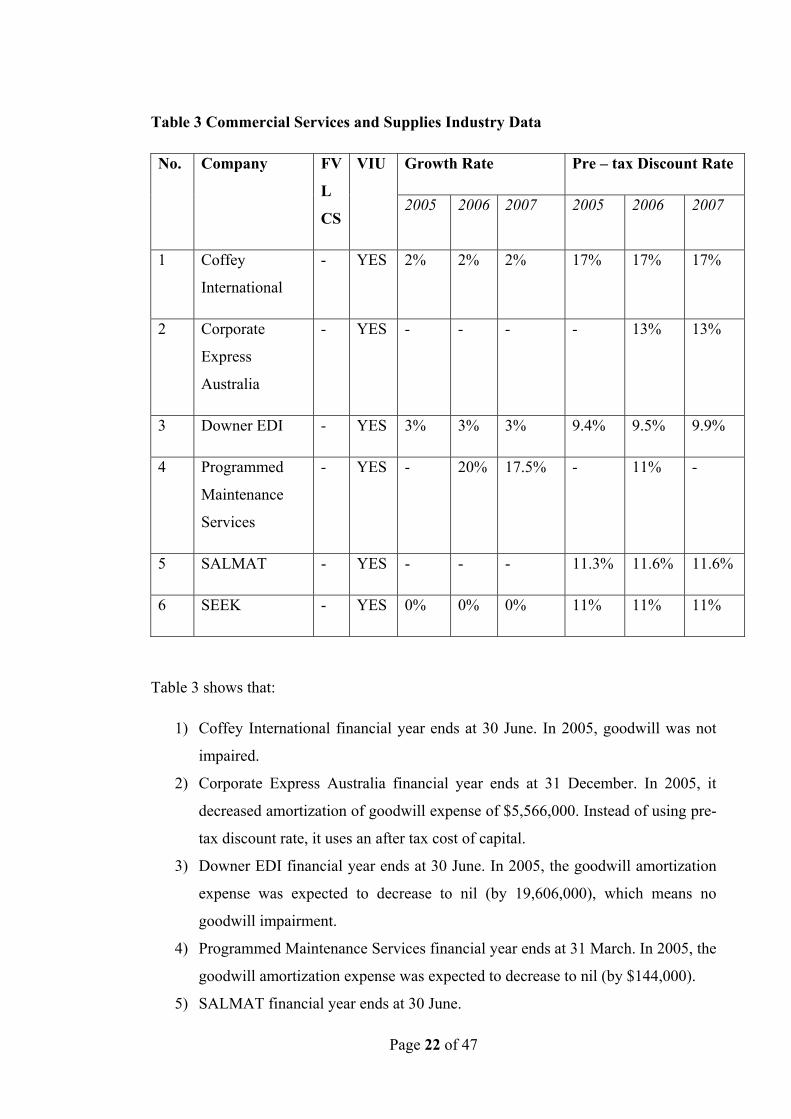
Table 3 Commercial Services and Supplies Industry Data
Growth Rate Pre – tax Discount Rate No. Company FV
L
CS
VIU
2005 2006 2007 2005 2006 2007
1 Coffey
International
- YES 2% 2% 2% 17% 17% 17%
2 Corporate
Express
Australia
- YES - - - - 13% 13%
3 Downer EDI - YES 3% 3% 3% 9.4% 9.5% 9.9%
4 Programmed
Maintenance
Services
- YES - 20% 17.5% - 11% -
5 SALMAT - YES - - - 11.3% 11.6% 11.6%
6 SEEK - YES 0% 0% 0% 11% 11% 11%
Table 3 shows that:
1) Coffey International financial year ends at 30 June. In 2005, goodwill was not
impaired.
2) Corporate Express Australia financial year ends at 31 December. In 2005, it
decreased amortization of goodwill expense of $5,566,000. Instead of using pre-
tax discount rate, it uses an after tax cost of capital.
3) Downer EDI financial year ends at 30 June. In 2005, the goodwill amortization
expense was expected to decrease to nil (by 19,606,000), which means no
goodwill impairment.
4) Programmed Maintenance Services financial year ends at 31 March. In 2005, the
goodwill amortization expense was expected to decrease to nil (by $144,000).
5) SALMAT financial year ends at 30 June.

Page 23 of 47
6) SEEK financial year ends at 30 June. There was no impairment in 2005, 2006
and 2007.

Page 24 of 47
Table 4 Information Technology (IT) Industry Data
Table 4 shows that:
1) Computershare financial year ends at 30 June. It did not have impairment loss in
2005.
2) IRESS financial year ends at 31 December. It did not have any impairment loss
in 2005, 2006, and 2007.
3) MYOB financial year ends at 31 December. In 2005, for CGU in China, MYOB
used 6% growth rate. In 2006, for CGU in China, MYOB used 5% growth rate.
In 2005, pre-tax cash flow forecasts are derived from financial projections
covering 5 years period. In 2006 and 2007, it covered respectively 14 year and
13 year period to 2020.
4) Oakton financial year ends at 30 June. It did not have any impairment loss in
2005, 2006, and 2007.
5) Reckon’s financial year ends at 31 December. It uses cash flow projections
based on annual financial budgets (5 years) for the coming year.
6) UXC financial year ends at 30 June. There was no goodwill impairment in 2005.
Growth Rate Pre – tax Discount Rate No. Company FV
L
CS
VIU
2005 2006 2007 2005 2006 2007
1 Computer
share
- YES - 1% 1% 15.4% 14.7% 15.7%
2 IRESS - YES - - - - - -
3 MYOB - YES 4% 4% 4% 14.8% 15.3% 15.3%
4 Oakton - YES - - - - 17% 13%
5 Reckon - YES 10% 10% 10% 10.5% 13.7% 13.4%
6 UXC - YES - 2% 2.5% 13.25% 11.75% 11.2%

Page 25 of 47
3.1 Preferred Method
All of the 18 companies under review have been using VIU method since 2005 in
conducting impairment test of their goodwill. Thus, VIU is the preferred method for
goodwill impairment testing, across this sample.
3.2 Adherence to AASB Guidelines
Per AASB 136 guidelines, companies in this study have allocated goodwill to their
CGU. They have been using VIU method (one of two methods allowed by AASB) in
conducting impairment test.
As required under VIU method, the companies have been applying a pre-tax discount
rate to their projected cash flows. Even though five of the companies under study stated
in their annual reports that they applied pre-tax discount rates in calculating the value in
use (recoverable amount) of their CGU, they did not state nominal values of those rates.
Companies are allowed by the AASB to use growth rate in estimating projected (future)
cash flows of their CGU to which the goodwill is allocated. Seventeen companies under
review stated that they used growth rate in estimating future cash flows of their CGU.
However, only eight companies stated nominal values of growth rates in their annual
reports.
Page 26 of 47
3.3 The Consistency of Impairment Testing Practices
3.3.1 Pre-tax Discount Rates Pre-tax discount rate will be used to examine the consistency of goodwill impairment
testing practices among companies within the same industry. As stated in the research
methods chapter, the pre-tax discount rate consists of risk-free market interest rate and
specific risk rate of which companies allocated to their CGU.
Based on Reserve Bank of Australia data, the risk-free market interest rate in 2005 was
5.5%, effective from 2 March 2005 until 3 May 2006. In 2006, there were 3 rates, i.e.
5.75% on 3 May 2006, 6% on 2 August 2006, and 6.25% on 8 November 2006.
However, in early 2006, risk-free market interest rate was still 5.5% until 3 May 2006.
Therefore, the average market interest rate for 2006 was around 5.9% (sum of 5.5%,
5.75%, 6%, and 6.25%, and then divided by 4). In 2007, there were 2 rates, i.e. 6.5% on
8 August 2007 and 6.75% on 7 November 2007. Hence, similar to calculation in 2006,
the average interest rate for 2007 was 6.5% (sum of 6.25%, 6.5%, and 6.75%, and then
divided by 3).
The risk-free market interest rates are known, therefore the percentage of risk allocated
by companies to their CGU can be calculated. Please note that, to make the comparison
between companies more relevant, the average market interest rates for each year will
be used. During the period under investigation, the Australia market interest rate was
not volatile. Thus, using average market interest rate for this data analysis can be
justified.

Page 27 of 47
Table 5 Rates of Risk Used by Companies in Capital Goods Industry
In Table 5, Leighton’s and Monadelphous’ rates of risk were under average. However,
compared to Leighton’s rates of risk, Monadelphous’ rates of risk were significantly
lower than the average which might be affected by the fact that Macmahon had much
higher rate of risk. The exact reason why Monadelphous had relatively lower rates of
risk compared to the other companies cannot be investigated due to limited information.
Macmahon had applied relatively much higher percentage of risk on its pre-tax discount
rates compared to other companies in capital goods industry. There is no information to
explain the higher percentage of risk. It might due to the uniqueness of its CGU.
However, a company will not gain any benefit by applying higher percentage of risk on
their CGU. Therefore it is not necessary to investigate why Macmahon had higher rate
of risk assigned to its CGU.
Rate of Risk No. Company
2005 2006 2007
1 Alesco 7.7% 6.3% 4.8%
2 Hastie Group 8% 7.6% 7%
3 Leighton 6.3% 5.6% 5%
4 Macmahon - 11.8% 8.9%
5 Monadelphous 4.5% 4.1% 3.5%
6 United Group - - -
Average 6.6% 7.1% 5.8%

Page 28 of 47
Nevertheless, from 2005 to 2007, it can be assumed that goodwill impairment testing
practices in capital goods industry is consistent. This being so because majority of the
companies had rates of risk which is not much difference from the average and from
each other.

Page 29 of 47
Table 6 Rates of Risk Used by Companies in Commercial Supplies and Services
Industry
Table 6 shows that majority of the companies had lower rates of risk than the average.
This due to Coffey International who applied relatively high rates of risk compared to
others. It was only Downer EDI who had significantly lower rates of risk than the
average.
Based on the industry’s averages, it can be assumed that goodwill impairment testing
practices in commercial services and supplies industry are consistent. It does not mean
that Coffey International was not consistent with the industry. Coffey International
might have relatively riskier CGU compared to others, which made it having much
higher rates of risk.
Percentage of Risk Rate No. Company
2005 2006 2007
1 Coffey International 11.5% 11.1% 10.5%
2 Corporate Express
Australia
- 7.1% 6.5%
3 Downer EDI 3.9% 3.6% 3.4%
4 Programmed
Maintenance Services
- 5.1% -
5 SALMAT 5.8% 5.7% 5.1%
6 SEEK 5.5% 5.1% 4.5%
Average 6.7% 6.3% 6%

Page 30 of 47
Table 7 Rates of Risk Used by Companies in Information Technology Industry
In 2005, it was Reckon’s rate of risk which is relatively much lower than average.
Furthermore, compared to MYOB rate of risk, UXC rate of risk was much lower than
Computershare’s.
In 2006 and 2007, compared to other companies, it was only UXC rate of risk which is
relatively much lower than average. The variation between rates of risk is also high.
It can be assumed that goodwill impairment testing practices in IT industry, in term of
allocation of rate of risk to CGU, is less consistent compared to other industries under
review. This may because of the fact that IT industry is a unique industry. Every IT
company has its own competitive advantage and expertise which differentiate them
from each other.
Rates of Risk No. Company
2005 2006 2007
1 Computershare 9.9% 8.8% 9.2%
2 IRESS - - -
3 MYOB 9.3% 9.4% 8.8%
4 Oakton - 11.1% 6.5%
5 Reckon 5% 7.8% 6.9%
6 UXC 7.75% 5.85% 4.7%
Average 8% 8.6% 7.2%

Page 31 of 47
3.3.2 Growth Rate For testing consistency of growth rates inside the company itself, the growth rate used
for projecting CGU cash flows will be compared with growths of companies operating
revenues and earning after tax (EAT).
The rationale of choosing to compare them with CGU growth rate is the relationship
between the three growth rates. CGU projected cash flows are basically the net cash
inflows from operating CGU. Operating revenues are gross cash inflows from operating
companies’ business. EAT is net (after all expenses and tax) cash inflows that a
company earns from any sources.
However, compared to EAT, operating revenue growth would be a better number in
comparing with the CGU growth rate. This due to the fact that EAT may include
extraordinary items such as interest revenue.
Most companies under review which have CGU more than one and the CGU might
have different growth rates. Nevertheless, the companies only put one growth rate in
projecting the future cash flows of their CGU. A company only have one growth rate in
their annual report as the company might have total up the growth rates or have an
average growth rates of all its CGU.
Thus, the comparison with operating revenue and EAT growth rates was made possible
by assuming of same growth rate of cash flows across all CGU in a company. This
means that only CGU growth rates provided in the annual report were used for this
study.

Page 32 of 47
A. Companies in Capital Goods Industry
1. Alesco
05/05 05/06 05/07
Operating
Revenue 31.35% -5.12% 22.73%
EAT 106.47% 4.39% 2.64%
Alesco does not provide growth rates that the company uses for projecting CGU cash
flows in its annual reports. It was stated in its 2006 and 2007 annual reports, that it did
not have goodwill impairment.
From data provided above, Alesco had have growth in operating revenue and EAT for
last three years, except for operating revenue in 2006 which was declined. The data
could not fully justify why Alesco did not have goodwill impairment in 2006 when the
company’s operating revenue had declined, unless the operating revenue of its specific
CGU increased. Nevertheless, the information was not provided in their annual reports.
2. Hastie Group
06/06 06/07
Operating
Revenue 391.47% 62.42%
EAT 945.56% 18.55%
In Hastie Group’s 2006 annual report, it stated that Hastie Group did not have goodwill
impairment. The statement could be justified by data above, as Hastie Group had high
growth rates in 2006 for operating revenue and EAT.

Page 33 of 47
3. Leighton
06/05 06/06 06/07
Operating
Revenue 29.44% 35.87% 17.22%
EAT 86.70% 34.99% 62.29%
During the three year periods, Leighton only had goodwill impairment in 2006.
Leighton had higher growth rates for EAT in 2005 and 2007. It justified why Leighton
did not have goodwill impairment in 2005 and 2007.
4. Macmahon Holdings
06/05 06/06 06/07
Operating
Revenue 54.33% 44.48% 12.28%
EAT 69.08% -61.66% 493.72%
It stated that Macmahon Holdings did not have goodwill impairment for the three years
period. However, Macmahon Holdings had high decline in EAT for 2006. The data
does not justify why Macmahon Holdings did not have goodwill impairment in 2006.
However, as stated earlier, EAT growth rate might be a less appropriate comparison for
CGU growth rate compared to growth rate of operating revenue.

Page 34 of 47
5. Monadelphous Group
06/05 06/06 06/07
Operating
Revenue 76.92% 36.20% 81.16%
EAT 95.33% 76.47% 105.53%
The data above justifies why Monadelphous Group did not have goodwill impairment in
that three years period.
6. United Group
06/05 06/06 06/07
Operating
Revenue 16.53% 77.89% 14.30%
EAT 47.80% 83.21% 17.79%
The data above justifies why United Group did not have goodwill impairment in that
three years period.

Page 35 of 47
B. Companies in Commercial Services and Supplies Industry
1. Coffey International
06/05 06/06 06/07
Operating
Revenue 28.58% 49.28% 46.60%
EAT 45.07% 13.69% 12.24%
The data above justify why Coffey International only had goodwill impairment in 2006
and 2007, regardless the operating revenue and EAT also increased in 2006 and 2007.
The higher increment for EAT in 2005 compared to increment in 2006 and 2007 makes
it reasonable for Coffey International not stating goodwill impairment in 2005.
2. Corporate Express Australia Limited
12/05 12/06 12/07
Operating
Revenue 13.48% 7.87% 5.09%
EAT 13.38% 2.43% 0.62%
The data above justifies why Corporate Express did not have goodwill impairment for
the 3 years period.

Page 36 of 47
3. Downer EDI
06/05 06/06 06/07
Operating
Revenue 19.47% 24.01% 14.97%
EAT 30.34% -- --
Downer EDI experienced loss in 2006, and then became profitable again in 2007.
However, the growth rates for both EAT in 2006 and 2007 were not provided as
calculation is difficult. The data above does not support Downer EDI statement that it
did not have goodwill impairment in 2006. However, as stated earlier, operating
revenue growth rate might be more appropriate comparison for CGU growth rate.
4. Programmed Maintenance Services
03/05 03/06 03/07
Operating
Revenue 13.57% 22.15% 17.48%
EAT 11.17% 11.37% 11.05%
The data above justifies statement of Programmed Maintenance Services that it did not
have goodwill impairment in three years period. However, its EAT in 2006 and 2007
did not support discretion of Programmed Maintenance Services to use growth rates of
20% and 17.5% in 2006 and 2007 respectively for projecting its CGU cash flows.
However, as stated earlier, operating revenue growth rate might be more appropriate
comparison for CGU growth rate.
Page 37 of 47
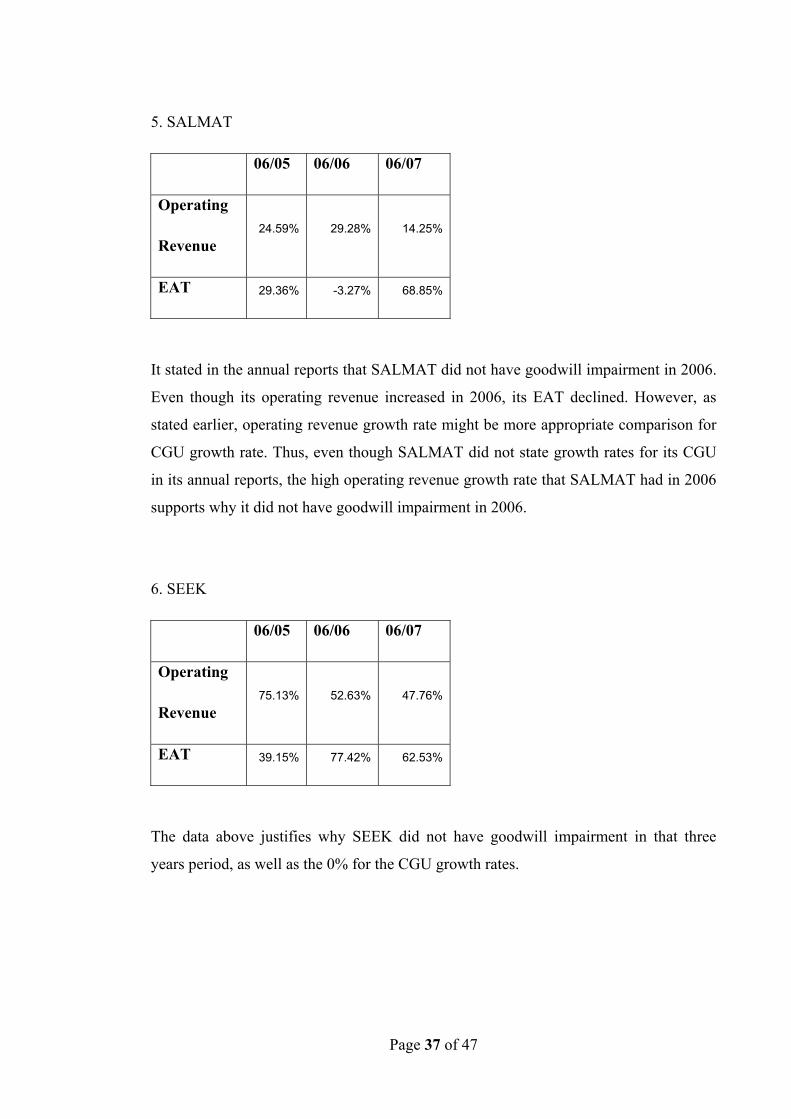
5. SALMAT
06/05 06/06 06/07
Operating
Revenue 24.59% 29.28% 14.25%
EAT 29.36% -3.27% 68.85%
It stated in the annual reports that SALMAT did not have goodwill impairment in 2006.
Even though its operating revenue increased in 2006, its EAT declined. However, as
stated earlier, operating revenue growth rate might be more appropriate comparison for
CGU growth rate. Thus, even though SALMAT did not state growth rates for its CGU
in its annual reports, the high operating revenue growth rate that SALMAT had in 2006
supports why it did not have goodwill impairment in 2006.
6. SEEK
06/05 06/06 06/07
Operating
Revenue 75.13% 52.63% 47.76%
EAT 39.15% 77.42% 62.53%
The data above justifies why SEEK did not have goodwill impairment in that three
years period, as well as the 0% for the CGU growth rates.

Page 38 of 47
C. Companies in Information Technology Industry
1. Computershare
Except for 2005 and 2006, the data does not fully support Computershare’s statement
that it did not have goodwill impairment in 2007. This being so because the operating
revenue decreased in 2007 and its EAT growth rate was lower compared to growth rates
in 2005 and 2006. Furthermore, if compared to operating revenue growth rate in 2007,
the growth rates of 1% in projecting the CGU cash flows were not reasonable.
2. IRESS
The data justifies IRESS statement that it did not have goodwill impairment in 2005,
2006, and 2007.
06/05 06/06 06/07
Operating
Revenue 21.99% 103.60% -23.51%
EAT 37.86% 145.16% 12.16%
12/05 12/06 12/07
Operating
Revenue 17.21% 30.49% 44.01%
EAT 20.10% 23.62% 5.02%

Page 39 of 47
3. MYOB
The data justifies that MYOB did not have goodwill impairment in 2005, as it had
higher growth rates compared to growth rates in 2006 and 2007. The data also supports
discretion of MYOB to use 4% for its CGU growth rate.
4. Oakton
The data supports Oakton’s statements that it did not have goodwill impairment in the
three years period.
12/05 12/06 12/07
Operating
Revenue 31.85% 13.18% 12.83%
EAT 840.40% 6.31% 8.97%
06/05 06/06 06/07
Operating
Revenue 20.81% 42.35% 49.46%
EAT 22.57% 73.19% 42.18%
Page 40 of 47
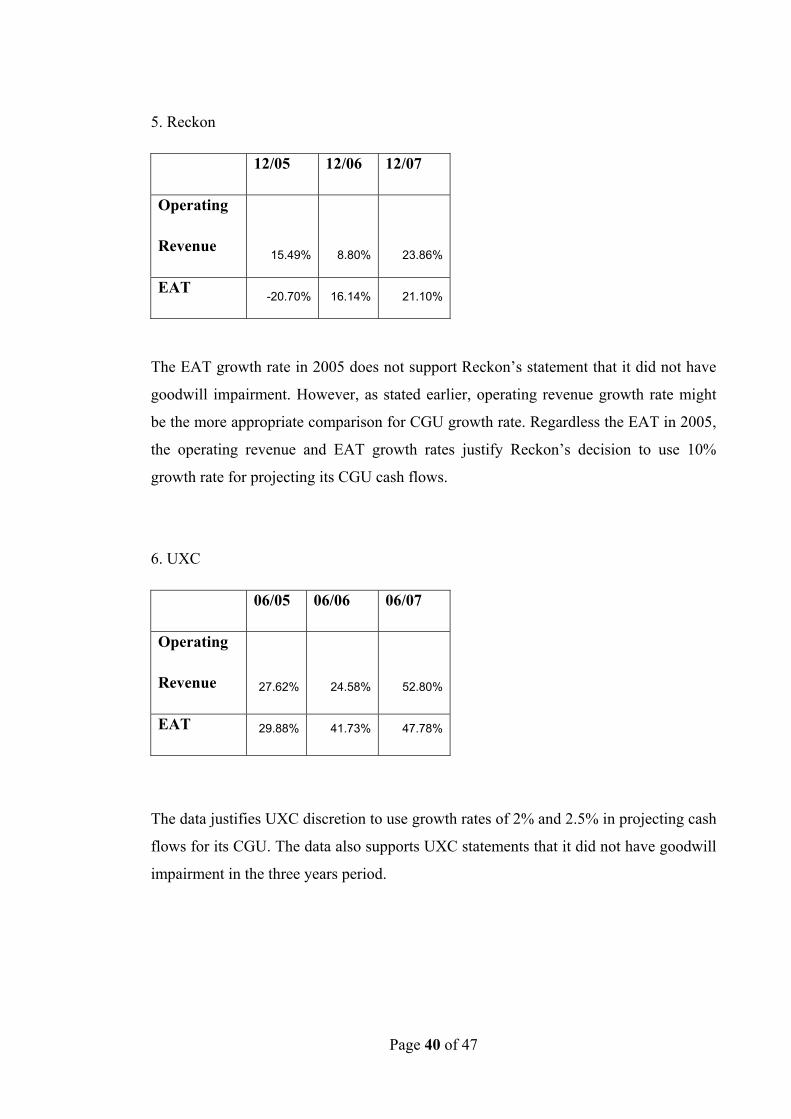
5. Reckon
The EAT growth rate in 2005 does not support Reckon’s statement that it did not have
goodwill impairment. However, as stated earlier, operating revenue growth rate might
be the more appropriate comparison for CGU growth rate. Regardless the EAT in 2005,
the operating revenue and EAT growth rates justify Reckon’s decision to use 10%
growth rate for projecting its CGU cash flows.
6. UXC
The data justifies UXC discretion to use growth rates of 2% and 2.5% in projecting cash
flows for its CGU. The data also supports UXC statements that it did not have goodwill
impairment in the three years period.
12/05 12/06 12/07
Operating
Revenue 15.49% 8.80% 23.86%
EAT -20.70% 16.14% 21.10%
06/05 06/06 06/07
Operating
Revenue 27.62% 24.58% 52.80%
EAT 29.88% 41.73% 47.78%

Page 41 of 47
4.0 DISCUSSION AND CONCLUSION
4.1 Impairment Testing Method
As stated in the result above, every company under review is using VIU method in
estimating the recoverable amount for their CGU. The data supports the hypothesis in
the earlier chapter that Australia publicly listed companies would choose VIU method
in calculating the recoverable amount of their CGU. However, the companies under
review did not give reasons (in their annual reports) as to why they opted to use VIU
method.
4.2 Rate of Risk
4.2.1 Capital Goods Industry Overall, in term of industry average, the allocation of rate of risk in capital goods
industry is consistent. It was only Leighton whose rates of risk were lower than the
industry average. This being so because Macmahon had relatively much higher rates of
risk compared to other companies in the industry which apparently made the industry
average higher than Leighton’s rates of risk.
4.2.2 Commercial Supplies and Services All companies except Coffey International, in commercial supplies and services
industry had lower rates of risk compared to the industry average. This being so because
Coffey International had much higher rates of risk compared to the other five
companies. Therefore, the allocation of rate of risk in commercial supplies and services
industry is considered consistent.
4.2.3 Information Technology (IT) Industry Overall, the allocation of rate of risk in IT industry is not consistent. The companies’
CGU rates of risk were spreading from the industry average. It is assumed that due to
the fact that each IT company has competitive advantages which differentiate them from
each other, which make is not possible to compared CGU rates of risk between
companies in IT industry.
Page 42 of 47
4.3 Growth Rate
4.3.1 Capital Goods Industry Overall, the CGU growth rates projection in companies in capital goods industry is
consistent. However, in 2006, it is noted that Alesco and Macmahon had inconsistency
goodwill impairment testing practices.
In 2006, Alesco operating revenue had declined, yet it did not have goodwill
impairment in that year. Alesco did not show its growth rates for projecting CGU cash
flows in its annual reports. Thus, it can be deduced that Alesco goodwill impairment
testing in 2006 might be questionable.
Whereas for Macmahon, its EAT declined in 2006, but it did not have goodwill
impairment. However, as stated earlier, the EAT growth rate might not be a good
comparison for CGU growth rate. The decline in EAT might not be related to
Macmahon CGU at where its goodwill was allocated.
4.3.2 Commercial Services and Supply Industry In this study, based on the companies’ growth rates, all companies in Commercial
Services and Supply industry had been consistent in practicing goodwill impairment
testing. The growth rates of the companies’ operating revenues and EAT support the
companies statement whether they had goodwill impairment in 2005 until 2007.
4.3.3 Information Technology (IT) Industry In term of growth rates, except for Computershare, all companies under study in IT
industry had been consistent in goodwill impairment testing practice. Whereas for
Computershare, its operating revenue had declined in 2007, yet Computershare stated in
its annual report that it did not have goodwill impairment in 2007

Page 43 of 47
References and Bibliography
Australian Accounting Standards Board 2008, AASB 3 Business Combinations, AASB,
Melbourne, Australia.
Australian Accounting Standards Board 2007, AASB 136 Impairment of Assets, AASB,
Melbourne, Australia.
Annual Report 2005, Reckon Limited, viewed 13 October 2008,
http://www.reckon.com.au/Portals/0/annual%20reports/FY%202005%20Reckon%20An
nual%20Report.pdf.
Annual Report 2006, Reckon Limited, viewed 13 October 2008,
http://www.reckon.com.au/Portals/0/annual%20reports/AR06_Reckon_web.pdf.
Annual Report 2007, Reckon Limited, viewed 13 October 2008,
http://www.reckon.com.au/Portals/0/annual%20reports/Reckon%20_ar_2007.pdf.
Aspect Huntley 2008, Alesco Corporation Limited, Fin Analysis, viewed 10 October
2008.
Aspect Huntley 2008, Hastie Group Limited, Fin Analysis, viewed 10 October 2008.
Aspect Huntley 2008, Leighton Holdings Limited, Fin Analysis, viewed 10 October
2008.
Aspect Huntley 2008, Macmahon Holdings Limited, Fin Analysis, viewed 11 October
2008.
Aspect Huntley 2008, Monadelphous Group Limited, Fin Analysis, viewed 11 October
2008.
Aspect Huntley 2008, United Group Limited, Fin Analysis, viewed 11 October 2008.
Aspect Huntley 2008, Coffey International Limited, Fin Analysis, viewed 12 October
2008.

Page 44 of 47
Aspect Huntley 2008, Corporate Express Australia Limited, Fin Analysis, viewed 12
October 2008.
Aspect Huntley 2008, Downer EDI Limited, Fin Analysis, viewed 12 October 2008.
Aspect Huntley 2008, Programmed Maintenance Services Limited, Fin Analysis,
viewed 13 October 2008.
Aspect Huntley 2008, SEEK Limited, Fin Analysis, viewed 13 October 2008.
Aspect Huntley 2008, Salmat Limited, Fin Analysis, viewed 13 October 2008.
Aspect Huntley 2008, Computeshare Limited, Fin Analysis, viewed 14 October 2008.
Aspect Huntley 2008, Iress Market Technology Limited, Fin Analysis, viewed 14
October 2008.
Aspect Huntley 2008, MYOB Limited, Fin Analysis, viewed 14 October 2008.
Aspect Huntley 2008, Oakton Limited, Fin Analysis, viewed 15 October 2008.
Aspect Huntley 2008, UXC Limited, Fin Analysis, viewed 15 October 2008.
Badawi, IM & Dorata, NT 2007, 'Business Combinations: Convergence and Fair Value',
Review of Business, vol. 27, no. 4, pp. 25-30.
Barth, ME & Landsman, WR 1995, 'Fundamental Issues Related to Using Fair Value
Accounting for Financial Reporting', Accounting Horizons, pp. 97-107.
Deegan, C. M. (2007). Australian Financial Accounting. Waterloo, North Ryde, NSW,
Mc-Graw Hill Australia.
Donnelly, T & Keys, R 2002, 'Business combinations and intangible assets', Australian
CPA, vol. 72, no. 4, p. 68.
Duangploy, O, Shelton, M & Omer, K 2006, 'The Value Relevance of Goodwill
Impairment Loss', Bank Accounting & Finance (08943958), vol. 19, no. 5, pp. 23-28.
Hayn, C & Hughes, PJ 2006, 'Leading Indicators of Goodwill Impairment', Journal of
Accounting, Auditing & Finance, vol. 21, no. 3, Summer, pp. 223-265.

Page 45 of 47
Ivory, N 2006, in Business Valuation and Forensic Accounting ConferenceThe Institute
of Chartered Accountants in Australia, The Westin, Sydney.
Lander, G & Reinstein, A 2003, 'Models to measure goodwill impairment',
International Advances in Economic Research, vol. 9, no. 3, pp. 227-232.
Massoud, MF & Raiborn, CA 2003, 'Accounting for Goodwill: Are We Better Off?'
Review of Business, vol. 24, no. 2, Spring, p. 26.
Monetary Policy Changes, Reserve Bank of Australia, viewed 9 October 2008,
http://www.rba.gov.au/Statistics/Bulletin/A02hist.xls.
Olde, M 2007, 'Impairment of Assets', Charter, vol. 78, no. 2, pp. 72-74.
Orapin Duangploy, MSaKO 2005, 'The Value Relevance of Goodwill Impairment
Loss', Bank Accounting and Finance, pp. 23-28.
Romano, M 2008, 'Accounting for Impairment Test in Subsidiaries and Associates', The
Journal of American Academy of Business, vol. 12, no. 2, pp. 167-173.
Schipper, K 2003, 'Principles-Based Accounting Standards', Accounting Horizons, vol.
17, no. 1, pp. 61-72.
Shoaf, V & Zaldivar, IP 2005, 'Goodwill Impairment: Convergence Not Yet Achieved',
Review of Business, vol. 26, no. 2, pp. 31-35.
Watts, RL 2003, 'Conservatism in Accounting Part I: Explanations and Implications',
Accounting Horizons, vol. 17, no. 3, pp. 207-221.
Wines, G, Dagwell, R & Windsor, C 2007, 'Implications of the IFRS goodwill
accounting treatment', Managerial Auditing Journal, vol. 22, no. 9, pp. 862-880.

Page 46 of 47
Appendix
Formula for calculating weighted average cost of capital (WACC):
WACC= (E/V x Re) + (D/V x Rd) x (1- Tc)
E = market value of firm’s equity
D = market value of firm’s debt
V = E + D
Re = cost of equity (in percentage)
Rd = cost of debt (in percentage)
Tc = corporate tax rate
As shown in the formula, WACC rate is after-tax rate. Therefore, in order to make
Alesco’s rates consistent with others, net of tax formula (1 – Tc) will not be included in
the calculation.
Calculation for 2005:
E = 309,700,000
D = 103,500,000
V = 413,200,000
Re = 14%
Rd = 10.7%
WACC (pre-tax) = (309,700,000/413,200,000 x 14%) + (103,500,000/413,200,000 x
10.7%) = 10.5% + 2.7% = 13.2%

Page 47 of 47
Calculation for 2006:
E = 332,677,000
D = 154,800,000
V = 487,477,000
Re = 14.5%
Rd = 7.4%
WACC (pre-tax) = (332,677,000/487,477,000 x 14.5%) + (154,800,000/487,477,000 x
7.4%) = 9.9% + 2.3% = 12.2%
Calculation for 2007:
E = 343,287,000
D = 294,200,000
V = 637,487,000
Re = 15.8%
Rd = 6%
WACC (pre-tax) = (343,287,000/637,487,000 x 15.8%) + (294,200,000/637,487,000 x
6%) = 8.5% + 2.8% = 11.3%