An investigation into the use of experienced utility scores to...
20
Contributed paper prepared for presentation at the 57th AARES Annual Conference, Sydney, New South Wales, 5th-8th February, 2013 An investigation into the use of experienced utility scores to assess multi-attribute changes in environmental quality. Chris Batstone 1 , Jonathan Moores 2 , James Baines 3 , and Sharleen Harper 2 1. Cawthron institute, Nelson, NZ; 2. NIWA, Auckland, NZ; 3.Taylor Baines and Associates, Christchurch NZ.
Transcript of An investigation into the use of experienced utility scores to...

Contributed paper prepared for presentation at the
57th AARES Annual Conference, Sydney,
New South Wales, 5th-8th February, 2013
An investigation into the use of experienced utility
scores to assess multi-attribute changes in
environmental quality.
Chris Batstone1, Jonathan Moores
2, James Baines
3, and Sharleen Harper
2
1. Cawthron institute, Nelson, NZ;
2. NIWA, Auckland, NZ;
3.Taylor Baines and Associates, Christchurch NZ.

ii
© Copyright 2013 by Authors’ names.
All rights reserved. Readers may make verbatim copies of this document for non-
commercial purposes by any means, provided that this copyright notice appears on all
such copies.

1
An investigation into the use of experienced utility scores
to assess multi-attribute changes in environmental quality.
Chris Batstone1, Jonathan Moores
2, James Baines
3, and Sharleen Harper
2
1. Cawthron institute, Nelson, NZ;
2. NIWA, Auckland, NZ;
3. Taylor- Baines and Associates, Christchurch NZ.
Abstract
Much contemporary socio-economic environmental policy evaluation is
undertaken using decision utility based approaches such as choice modelling and
contingent valuation. In this paper we describe an investigation into the use of the
contrasting “experienced utility” concept to assess changes in environmental
quality. The research context is the development of a spatial decision support
system that discriminates between catchment development options in terms of
their effects on the receiving water bodies of urban storm water. We report the
outcomes of the application of an expert elicitation process from the risk
assessment literature to the trial of a visual analogue method designed to elicit
experienced utility scores from consultation workshops to assess the effects of
multi-attribute changes to ecosystem services in urban estuaries.
Keywords:
Ecosystem services, experienced utility, expert elicitation

2
Introduction
Urban planning and associated decision making in New Zealand requires considerations of
changes to environmental quality impacted by development processes to be assessed in terms
of four well beings – environmental, social, economic and cultural. This paper describes an
exploratory process to develop and implement indicators for the social wellbeing associated
with the attributes of estuarine water-bodies impacted by urban storm water. The process
includes identification of experienced utility as the assessment construct, a visual analogue
approach as the data collection vehicle, an expert elicitation process approach to obtaining
data, and development of a mathematical model for a validation framework.
The context of this research frames the development of the indicator generation process. It
motivates development of a cost effective method that can be extended to multiple locations,
and has the capacity for integration with indicators of economic wellbeing. The context is a
spatial decision support system (sDSS) that discriminates between alternative urban
development scenarios in terms of their effects on urban water bodies by contrasting the
values of four indices that correspond with the four well-beings (Moores et al. 2013). The
indices are constructed using a composite index method (OECD, 2006). Their precursors are
established through the use of a combination of physical and statistical models, and Bayesian
Belief Network (BBN) models that propagate changes in catchment attributes over time that
influence the biophysical properties of the receiving water bodies.
While the sDSS addresses two receiving water body types, freshwater and estuarine impacted
by urban development in catchment level planning units, this paper considers estuarine water-
bodies and the related social wellbeing. Social wellbeing indicators are constructed based in
five kinds of relationships with the water bodies held by the community. Four of those
relationships are defined in terms of water quality categories that reflect enhancements to the
ecosystem services provided by the water bodies. A fifth relationship, defined as “sense of
place”, is a summary, multi-dimensional construct. Together they reflect the provisioning and
cultural aspects of human wellbeing proposed by the Millennium Ecosystem Assessment
(MEA, 2005).
An expert elicitation process (Burgman, 2005) that employs a visual analogue method (Gould,
2001) has been used to elicit experienced utility scores (EUS) from a broadly representative
sample of the community (Kahneman and Sugden, 2005). That information reflects the
response of community social well-being to a varying ecosystem service provision by the
water bodies under differing water body quality conditions resulting from alternate
development scenarios and storm water management regimes.
This paper is structured as follows. A research context section provides a commentary on the
sDSS, locating the development of a social wellbeing indicator in its decision support
software context. A methods section follows that explains the rationale for the method, the
construction of the data collection process, and development of a model to validate the data.
Presentation of the outcomes of data collection, model estimation and associated commentary
are followed by a discussion of the strengths and weaknesses of the method. Concluding
remarks provide a summary of the outcomes of this exploratory process with directions for
future research.

3
Methods
The research context
The research context of this paper is a New Zealand Ministry for Science and Innovation
funded project entitled “Urban planning that Sustains Waterbodies (UPSW). Figure 1
describes the structure of the sDSS developed in the course of the project. Catchments under
consideration are divided into planning units (PLU). Their development status is characterized
by a number of executive attributes – riparian management, land use, storm water
management, and transport and land development pattern. The flows and associated effects of
storm water that arise from varying configurations of these attributes impact a number of
stream receiving units (SRU) and estuary receiving units (ERU). For the SRU, those attributes
form the starting nodes of a Bayesian Belief Network (BBN) model which uses Bayesian
inference to identify the effects of storm water from the PLU into five probability based
category determinations for three attributes – naturalness, water clarity, and fauna.
Figure 1: UPSW sDSS structure (Moores at al. 2013)
These three attributes are the basis for defining scenarios under which five human
relationships with the water bodies (expressed as categories that reflect incremental
enhancements to the levels of ecosystem services available) with the SRU are assessed. For
the ERU a number of physical and statistical models are used to model the effects of storm
water from the PLU into five category determinations for three attributes – turbidity,

4
underfoot conditions defined as grain size distribution, and ecological health. These three
attributes are the basis for defining scenarios under which five human relationships (expressed
as categories that reflect incremental enhancements to the levels of ecosystem services
available) with the ERU are assessed.
The human relationships with the receiving water bodies are defined as contact, partial
contact, non-contact, extraction use, and sense of place. The levels of services available from
the water-body impact levels of satisfaction associated with a range of use and non-use
relationships which are based in changes to the biophysical / ecological attributes of the
resource. Experienced utility scores which vary according to the category levels of their pre-
cursor attributes take values over the interval {1 …10}. Similarly people’s attachment to a
location, their sense of place, is affected by changes to the underlying attributes
(characteristics) of the resources. The social wellbeing indicators for SRUs and ERUs are
determined as arithmetic weighted averages of the scores for each of the five contributing
social indicators for SRUs and ERUs, respectively. Weights are generated through an
Analytical Hierarchy Process (Saaty, 1987).
The social wellbeing indicator compliments the other wellbeing indicators by providing an
assessment of the state of the resource under differing baseline urban state (BUS) and urban
development option (UDO) combinations in terms of satisfaction or utility experienced by the
community in their relationships with the water bodies. The economic wellbeing being
indicator provides an estimate of the value and efficiency of each development option, the
social wellbeing indicator addressed in this paper an assessment of the state of the water-body.
Further, it provides an alternate avenue to cost benefit analysis to assess the efficacy and
efficiency of alternate storm water management regimes through utility / cost analyses.
The software context of sDSS is Microsoft Excel. Look-up tables contain the data for the
calculations that generate the final values for the social wellbeing indicators. Those tables
provide information for the three biophysical attributes of ERUs and SRUs, respectively
(described above), in five categories. Figure 2 provides an example of a look-up table
containing utility data.
Figure 2 portrays a 5x25 cell matrix populated with experienced utility data. Each cell defines
a scenario which is a unique combination of three biophysical attributes, each able to take five
levels. The numerical value in each cell is an Experienced Utility Score (EUS) obtained from
the process described in the subsequent section, Methods. The EUS tend to grow
progressively from minimum to maximum values from the left top cell of the matrix to the
lower right cell.
The research challenge
The method used to create this indicator of social wellbeing is developed in the context of a
software tool. The tool will be deployed in numerous locations that differ in the terms of
biophysical attributes and the nature of the relationships held by the community. The tool
assumes that the biophysical nature of water bodies at any point in time may be understood in
terms of a typology based in three attributes, each attribute taking five levels. The connection
with the corresponding socio-economic system is the assumption that human relationships
with the water bodies are effectively defined and assessed in terms of the same typology of
attributes and levels.

5
Figure 2: Look-up table example
low low/med med med/high high
low 1.18 1.55 1.91 2.31 2.71
low/med 1.58 1.95 2.27 2.64 3.02
med 1.98 2.31 2.63 2.96 3.32
med/high 2.07 2.40 2.76 3.18 3.61
high 2.05 2.43 2.82 3.37 3.92
low 2.17 2.54 2.92 3.65 4.33
low/med 2.57 2.90 3.28 4.09 4.79
med 3.16 3.49 3.95 4.45 5.17
med/high 3.57 4.12 4.45 4.99 5.51
high 3.34 3.81 4.21 4.85 5.46
low 3.16 3.54 3.92 4.71 5.38
low/med 3.75 4.13 4.60 5.10 5.66
med 4.34 4.81 5.27 5.77 6.27
med/high 4.81 5.30 5.76 6.26 6.81
high 4.97 5.55 6.26 6.81 7.35
low 4.89 5.41 5.94 6.41 7.01
low/med 4.93 5.34 5.72 6.04 6.70
med 5.37 5.93 6.39 6.89 7.22
med/high 5.83 6.35 6.89 7.44 7.76
high 6.22 6.72 7.31 7.85 8.59
low 6.47 6.92 7.41 7.91 8.53
low/med 6.62 7.02 7.42 7.81 8.18
med 6.74 7.16 7.52 7.84 8.16
med/high 6.87 7.42 7.94 8.26 8.99
high 7.00 7.67 8.35 9.09 9.82
Ecological health
low
low/med
Underfoot
condition
Water
clarity
med
med/high
high
The research challenge is to find a parsimonious way of assessing the state of streams and
estuaries in terms of the relationships that humans hold with estuaries and streams. An
approach is required that identifies changes in wellbeing as the ability of streams and estuaries
to provide a range of services changes as urban development effects them. We have adopted
the notion of experienced utility understood as satisfaction to address this requirement. The
response to the capacity of water bodies to provide ecosystem services is captured as the
utility experienced by people in past encounters with alternate water body quality scenarios.
Those scenarios are defined in terms of combinations of varying levels of the key attributes of
streams and rivers that enable ecosystem service provision. This data reflects how humans
feel, think, and how they are motivated to act toward the water bodies as they have
experienced them under varying conditions. The use of utility assessment in environmental
management is derived from the behavioural and health economics literatures (Hajkowicz et
al. 2008). The multi-attribute nature of the process has precedent in Prato (1999). The data
collection method has been formulated to provide a multi-attribute assessment method that
that minimizes the cognitive loads on workshop respondents.
Community relationships with receiving water-bodies
Five kinds of relationships with each of those water bodies are assessed. Those relationships
encompass the components of total economic value (Bateman et al. 2006). Four of the
relationships are defined in terms of water quality categories that reflect progressive
enhancements to recreation and provisioning ecosystem services provided by the water bodies
– non-contact, partial contact, extractive use, and full contact. This typology of relationship
categories is based on the water quality ladder concept developed by Vaughan (1986). The
water quality ladder features a ten point scale that reflects changes in the character of
ecosystem service available as water quality improves. For example, a score of 2.5 represents
water quality that is “boatable”, 5.1 “fishable”, and 7.0 “swimmable” (Van Houten et al.
2007). A fifth relationship, defined as “sense of place” is a summary, multi-dimensional
construct that embraces cognitive, affective and conative relationships with the streams and
estuaries (Jorgensen and Stedman, 2001).

6
Experienced Utility
The human – water body relationships are assessed from the perspective of experienced utility
or the satisfaction derived from those relationships (Kahneman and Sugden, 2005). This
approach is widespread in the health economics domain, but is limited in that it does not offer
an opportunity for full integration with cost benefit analysis processes. An example of its
application to environmental policy is in the area of water management decisions in Western
Australia (Hajkowicz et al. 2008). Tinch et al.(2010) investigated the differences between
decision and experienced utility, finding that an experienced utility approach generates
different estimates of preferences than those from decision utility, using a choice modelling
framework.
The idea of assessing the value of policy options from the perspective of levels of satisfaction
experienced in the past by individuals and, by inference communities, is complimentary to the
growing trend in the economic analysis of environmental policy to use non-market valuation
techniques such as contingent valuation and choice modelling based in the “decision utility”
construct which asks survey respondents to anticipate their preferences for alternate scenarios.
In the experienced utility approach respondents are asked about their levels of satisfaction,
responding from within their experience. In the context of socio-economic analysis of
environmental policy the approach has merit in that it avoids two contentious areas. First, the
monetization of assessments of environmental value (Kant and Lee, 2004), and second,
defining the economic jurisdiction (Bateman et al. 2006) required for aggregation of non-
market process derived estimates of value for application to cost benefit analyses. The first of
these points provides a rationale for the use of experienced utility to construct the social
wellbeing indicator in that it provides an avenue to compliment economic wellbeing
indicators based in non-market valuation of losses and gains of ecosystem services. Most
importantly however, it may be possible to generalize this tool to a wide range of locations,
avoiding the costly necessity to collect data to populate the look-up tables in each and every
implementation of the tool, a key factor in development of decision support software.
Visual analogue scores
The data collection methodology to assess experienced utility requires respondents to score
the levels of satisfaction they have experienced in their relationships with the water bodies.
To capture these scores a visual analogue score matrix has been developed. This a variant on
the visual analogue scale (VAS) widely used in the health and allied domains. A VAS is
defined as a measurement instrument designed to assess a single characteristic or attitude that
is believed to vary across a continuum of values and is not amenable to direct measurement
(Gould et al. 2001). In its simplest form the VAS is a line about 100mm long, anchored at
each end by contrasting values for the characteristic or attribute under consideration.
Respondents are asked to indicate their reply by placing a mark on the line: their score is
defined as the distance between the origin (the left hand end of the line) and their mark.
Because the level of experienced utility or satisfaction for each of the five water body
relationships is a function of more than one characteristic, the VAS linear scale concept is
extended to a matrix in which each cell defines a quality scenario expressed in terms of three
attributes, each defined in terms of three levels, low medium and high. Relationships with
estuarine water bodies are defined in terms of underfoot conditions, water clarity and
ecological health. These attributes were identified in focus groups in a choice experiment

7
development process for the Waitemata Harbour papered in Batstone et al. (2010). Figure 3
portrays the matrix for estuarine water bodies. Three levels have been used because the
literature surrounding non-market valuation emphasizes the potential for anomalous outcomes
when the cognitive burden, the complexity of the data provision tasks, becomes
overwhelming for respondents (Hensher, 2006). In this application the white coloured cells
are available for data collection; the grey coloured cells were deemed unlikely combinations
of the attributes and their constituent levels in which minimal distinctions would exist
between their utility scores and those in the cells surrounding them. In subsequent data
processing non-sampled data points in the matrices are established through interpolation.
Figure 3: Estuary data collection matrix
Populating the data collection matrix: eliciting experienced utility data
Data was collected from workshop groups of 20 respondents in Auckland. The method is
based in the use of a similar process to collect data for the non-market valuation process used
to estimate economic benefits associated with coastal storm water mitigation (Batstone et al.
2010). Workshop respondents were recruited by a commercial market research organization
and were paid a fee for their attendance. Given the exploratory nature of this process – the key
area of exploration was in the process area - no attempt has been made to provide a strong
statistical basis for the inference to the wider population. Within the constraints of a small
sample, the composition of these focus groups was designed to be broadly representative of
the diversity of populations of Auckland and Canterbury in terms of ethnicity, gender and age.
The key recruitment criterion for recruitment to the workshop was experience of at least
boating in coastal environments.
Two facilitators coordinated the workshop. A PowerPoint presentation was used to introduce
the subject area, and to introduce and to train the respondents in the data collection task. The
data collection formats were presented to the group as a whole, respondents made their
responses in task specific workbooks which were identical across all respondents. The data
collection task was framed as an expert elicitation process based in techniques from the risk
assessment and ecology literatures. It aims to minimize the potential for outcomes to be
compromised by a range of a range of cognitive biases, for example, anchoring, availability,
framing, individual dominance, group think and recall (Burgman, 2005). Data collection
involved respondents in a six step procedure to populate a three by nine cell matrix of water
body quality scenarios, defined in terms of three levels of three key water body biophysical
attributes, with experienced utility scores, for each of the five water body relationships.

8
Step One: Task definition, and context specification.
Step Two: Training
Step Three: Respondents were asked to locate the cells representing scenarios that
corresponded to their best, worst, and most frequently encountered experiences using “happy
face” symbols or equivalent, depending on their experience.
Step Four: Respondents were asked to score these key locations based on the degree of
satisfaction they recalled experiencing using an interval of {1 … 10}.
Step Five: Respondents were asked to score the remaining white cells relative to their best,
worst, and most frequently encountered scores using the same interval of {1 … 10} .
Step Six: Respondents were asked to score the reliability of the information they had provided
using an interval of {1 … 10}.
Data processing
Respondent outcomes for each water body quality scenario were aggregated by an arithmetic
weighted average scheme in which individual responses were weighted by their reliability
score to form representative experienced utility scores for each water body quality scenario.
Responses with a reliability score of less than 0.8 were excluded from further processing,
based in the Cronbach’s Alpha statistic’s standard for internal consistency (George and
Mallery, 2003) as a reference point. Initial data processing filled in values in the 3x9 cell
matrix using an interpolation scheme that related column values through identification of
power relationships for the sequence cells which held data.
Final processing of the scores used a surface interpolation process to expand the water body
quality scenario cell matrices from the three by nine cell matrices of the data collection
workshops to five by fifteen cell matrices to create correspondence with biophysical attribute
precursors in the sDSS. The expansion of the tables was affected using a predefined
MATLAB routine called TriScatteredInterp which performs linear interpolation on an
irregularly spaced three-dimensional grid (MATLAB, 2012).
Validation
In order to validate the data collected for the sDSSS we estimate value functions at the level
of the individual, and at two stages of data processing. Two aspects of economic theory have
relevance, Prospect Theory and Utility Theory. Prospect Theory (Kahneman and Tversky,
1979) suggest that at the individual level, people make decisions based on losses and gains
rather than the final outcomes, those losses and gains relate to some reference point, and that
they use a variety of heuristics to obtain those outcomes. The definition of the reference point
is not trivial, its location is critical to specification of empirical value functions that
demonstrate the “S” property While the status quo is often taken as the reference point,
Kahneman & Tversky (1979) recognise that reference points may be influenced by other
factors. A number of other studies (Suls & Wheeler, 2000; Pervin, 1989, Frederick &
Lowenstein, 1999) have examined aspects such as social comparisons, subjective expectations
and past experience, Camerer and Loweinstein (2004) conclude that how multiple reference
points are combined is still an unanswered question.
Since we have requested respondents to indicate the most often encountered water-body
attribute combination scenario there is a reasonable expectation that the individual value

9
functions are “S” shaped: concave in gains, and convex in losses in relation to the reference
point.
A number of functional forms are available to test this feature. Carter & McBride (2010) test
power regression, spline regression, and polynomial functional forms, in particular 3rd
degree
polynomials to demonstrate the presence of an “S” shaped value function in experienced
utility data. Those authors cite Luce (2000), noting that on aggregation the “S” shape is not
always evident. While a number of studies have been able to establish the “S” shape,
(Galanter, 1990), Vendrick & Woltjer, (2007) and Layard, Mayraz and Nickell (2008) report
concave value functions. This is consistent with utility theory that suggests value functions
reflecting preferences for bundles of goods and services are continuous (on the assumption
that they are transitive and complete), feature diminishing marginal utility, and are therefore
concave in shape (Carter, 2001).
Figure 4: Prospect theory “S” shaped value function (Source: Carter & McBride, 2010)
To assess the presence of an “S” shape in each of the data forms we use OLS regression to
test whether a 3rd
degree polynomial may be fitted to the data. If that test fails, then we
investigate whether a power function reveals a concave relationship between utility and each
of the attributes. In order to address the multi-attribute, multi-level nature of the data we have
taken the following approach to assessing power form relationships.
Let U = utility, and A, B, and C are environmental attributes, each with five levels where
U is defined by the following general model:

10
… (1)
In the absence of information about the power form of the relationship between utility and
each attribute, and assuming a multiplicative relationship between each of A, B, and C gives,
… (2)
Where, z = 1 to 5 is the community-water-body relationship type and a, b, and c are
coefficients to be estimated from the data. Further, z =1 represents the non-contact
relationship, z=2 the partial contact relationship, z=3 the contact relationship, z=4 the
extraction use relationship, and z=5, the sense of place relationship. This functional form
allows for interaction between the attributes in the formation of experienced utility allowing
the data to “speak for itself”.
In stochastic form equation (2) becomes:
… (3)
Where,
k is a constant term and u is the stochastic disturbance term.
In order to make equation (2) tractable for estimation using ordinary least squares (OLS)
regression it is necessary to log transform the data to achieve a linear form:
… (4)
Where, ln represents the natural logarithm operator, and e is the residual term.
Allowing A = UC, B = water clarity, and C = ecological health, then equation (4) becomes,
… (5)
Two tests may be performed to demonstrate consistency with a priori expectations in respect
of diminishing marginal returns. First, the coefficients a, b, and c are statistically significantly
different from zero. Second for the concave relationship to hold the estimated coefficients (a,
b, c) lie in the interval {0 … 1} such 0 < a < 1; 0 < b< 1; and 0 < c < 1;
In order to estimate equation (5) continuous variables representing the environmental
attributes were developed from the attribute category data, with the category levels assigned
integer values of 1 to 5 corresponding to the scheme 1=low, 3=medium, and 5=high based in
the assumption of equal intervals between the categories. The order of the observations in the
workshop and look-up table datasets was randomized to remove serial correlation effects
arising from collection and interpolation processes.
Results
In this paper we use data collected from the workshop addressing the sense of place water-
body relationship to illustrate application of the concept and the methods we trialled.
11
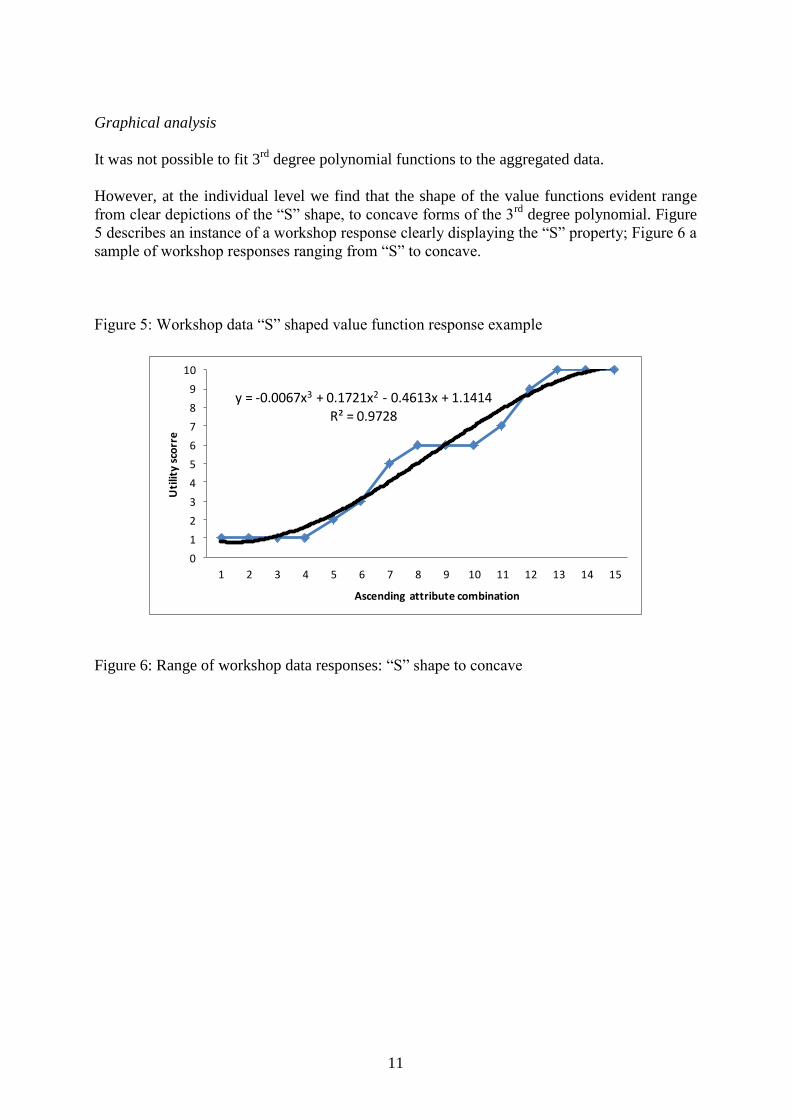
Graphical analysis
It was not possible to fit 3rd
degree polynomial functions to the aggregated data.
However, at the individual level we find that the shape of the value functions evident range
from clear depictions of the “S” shape, to concave forms of the 3rd
degree polynomial. Figure
5 describes an instance of a workshop response clearly displaying the “S” property; Figure 6 a
sample of workshop responses ranging from “S” to concave.
Figure 5: Workshop data “S” shaped value function response example
y = -0.0067x3 + 0.1721x2 - 0.4613x + 1.1414
R² = 0.9728
0
1
2
3
4
5
6
7
8
9
10
1 2 3 4 5 6 7 8 9 10 11 12 13 14 15
Uti
lity
sco
rre
Ascending attribute combination
Figure 6: Range of workshop data responses: “S” shape to concave

12
The evidence is mixed as to the presence in the data of “S” shaped value functions amongst
the individual workshop responses. Those that deviate most from this standard at least exhibit
the concave shape required by the presence of diminishing returns.
Model estimation
Twenty models of the functional form described by equation (5) were estimated using OLS
from the workshop and look-up table data. The twenty models derive from there being ten
relationships (five coastal and five freshwater) between utility and the environmental
attributes, each of which are explored in two datasets. These two datasets were: values
generated in workshops (workshop data) and by interpolation based in the workshop data
(look-up table data).
Table 1 describes the estimation outcomes. For the workshop data sets based on 3x9 cell
tables n=27, for the look-up table data sets based on 5x25 cell tables, n=125. In each table the
coefficients estimated from the workshop data and look-up table data are presented for each
relationship model.
Model
Workshop data Look-up table data Workshop data Look-up table data Workshop data Look-up table data
Non-contact 0.5976 0.7130 0.3060 0.1963 0.8151 0.2630
Partial Contact 0.4863 0.5481 0.2715 0.1693 0.7277 0.2690
Contact 0.5788 0.6435 0.2924 0.1837 0.8247 0.2927
Extraction 0.6374 0.5921 0.2446 0.1679 0.9054 0.4368
Sense of Place 0.6090 0.6991 0.3112 0.2006 0.8469 0.2931
Underfoot conditions Water clarity Ecological HealthAttribute
y = -0.0067x3 + 0.1721x2 - 0.4613x + 1.1414 R² = 0.9728
y = 0.0009x3 - 0.0383x2 + 0.9306x + 1.5201 R² = 0.7072
0
1
2
3
4
5
6
7
8
9
10
1 2 3 4 5 6 7 8 9 10 11 12 13 14 15
Uti
lity
sco
re
Ascending attribute combination

13
The explanatory power of each of the models is high, ranging from Rsq= 0.85 to 0.95 over the
twenty models in the analysis. Correlation analysis shows that that the explanatory variables
in the models are uncorrelated. Consideration of the values obtained from estimation for the
Durban Watson statistic show the randomization process has removed any serial correlation
issues that would compromise assessment of the statistical significance of the estimated
coefficients or create bias in their magnitude. Plots of the residuals do not show evidence of
any patterns associated with heteroscedasticity.
As the model variables are in log-log form, the coefficients may be interpreted as a 1%
change in the environmental attribute is associated with the coefficient value percent change
in experienced utility. For example a 1% improvement in the water clarity attribute is
associated with a 0.2488% improvement in experienced utility associated with sense of place
in freshwater workshop data.
The estimated coefficients are all statistically significant at least at the 5% level. The
statistical significance of the coefficients and their magnitudes confirm the relationship
between utility and each of the environmental attributes that reflects diminishing marginal
returns, ie demonstrating concave shape value functions in the aggregate data.
There are some inconsistencies in the relative magnitude of the coefficients between
workshop based data and the interpolated data that be indicative of the interpolation process
not preserving the underlying characteristics of the data, and / or there may be some more
fundamental issues with construction of the data collection vehicles.
Figure 7 depicts an example of those relationships using the coefficients for the sense of place
model estimated from the aggregate workshop data.
Figure 7: Expected utility response to increasing levels of environmental attributes
0.0000
0.5000
1.0000
1.5000
2.0000
2.5000
1 2 3 4 5 6 7 8 9 10
Ln(Utility Score)
Environmental Atribute Scale (Category units)
Underfoot conditions[U=0.61*ln(UC)]
Water clarity[U=0.31*ln(WC)]
Ecological Health[U=0.84*ln(EH)]

14
Discussion
The UPSW sDSS operates by defining the biophysical state of a water body in terms of a
typology consisting of three attributes each specified by five levels. Look-up tables contain
data that specify the average level of utility experienced by the community for relationships
with the water body for each biophysical state. To determine the effects on social wellbeing
that arise through urban development the tools contrast the levels of experienced utility
contained in the look-up tables for the current state of the water body and the state predicted
by models for the end point of development.
Prior to the 20th
century the utility concept was understood as a Benthamite hedonic
calculation that resulted in the net of pleasure and pain, with research effort to develop
measurement of the concept. Thereafter followed a shift in thinking (Robins, 1932) that took
the view that he hedonic qualities could not be measured, and that interpersonal comparisons
were invalid. Since utilities could be conceived as consistent choices through revealed
preferences the pursuit of the measurement of utility was held to be redundant (McBride &
Smith, 2010).
The work of Kahneman and Tversky (1979) and their development of Prospect Theory
signalled renew interest in utility. Drawing on the psychology literature Kahneman et al.
(1997) assert that “experienced utility is measureable, and that the differences between
decision utility (wanting) and experienced utility (enjoying) is important for understanding
behaviour, and in turn the design of public policy (McBride & Smith, 2010).
This research has adopted an experienced utility approach to the development of a social
wellbeing indicator because it is complimentary to economic approaches based in decision
utility in understanding the effects of alternative urban development approaches on the extent
of ecosystem services accessible by humans. In the context of the sDSS, the experienced
utility scores allow specification of the state of ecosystem services, reflected in experienced
utility. In contrast, decision utility based assessments of the economic value of gains and
losses from processes such as contingent valuation and choice modelling give depictions of
the value of the change. The use of experienced utility scores as the information base for the
social indicator compliments the sDSS information basis, providing two socio-economic
indicators based in differing cognitive processes. Psychologists understand there is a
significant difference between the two, known as the focussing illusion (Schade & Kahneman,
1998) by which decision utilities overstate post-decision experienced satisfaction.
Kahneman et al. (1997) argue that in contrast to the mainstream neoclassical view,
experiences of temporally extended episodes are measurable because “they relate subjective
intensity to physical variables that are qualitatively similar for different people”…. and that
“reported subjective intensity is often a power function of physical magnitude, with an
exponent that varies for different sensory dimensions” (Kahneman et al. 1997:380).
While Schade and Kahneman (1998) provide a justification in the focusing illusion to seek a
diverse and complimentary information basis to understand changes in ecosystem services,
Kahneman et al. (1997) provide the substantial foundation for the use of data based in the
experienced utility from temporally extended episodes ( the actions that form the basis of the
five relationships with water-bodies) and the use of power functions (equation 2) to form the

15
basis for a functional form for a value function that relates experienced utility to multi-
attribute changes to water-bodies that result in changes in ecosystem services.
Making the experienced utility concept operational involves identifying an appropriate sample,
identifying a framework for data collection and a mechanism to populate the framework, and
developing and testing a mathematical model of the experienced utility for contrasting states
of water body. Given the exploratory nature of this research, and while the sample selected is
broadly representative of the Auckland region, it is small for statistical inference purposes.
Accordingly caution should be assumed when making inference from the data described here.
The analysis recognizes the statistical weakness that lies in the small underlying sample sizes
that are the data sources, but also recognizes that expert elicitation techniques are designed to
operate with small samples. The statistical model estimation process that constitutes the
validation analysis has been conducted over data sets that are based in small original sample
sizes, and have been conducted over data that has been created from interpolation to impute
missing values. With these reservations in mind the following is relevant. Given that it is
possible to fit models of high explanatory power with highly statistically significant
parameters, this validation analysis shows that the data in both the 3x9 and 5x25 cell tables
follow an underlying model that has econometric precedent, and that they demonstrate the
presence of diminishing returns that is the expected feature of utility data. Accordingly there
is reasonable evidence to accept the data and associated processes and to proceed to identify
and remedy issues that arise in the data collection, and data processing.
The data collection process needs to be reconsidered to eliminate any order effects that may
arise from the construction of the data collection tables. Block designs or randomization of
table formats could be considered. Potentially software such as Ngene that is used to specify
choice experiment formats could be used to establish formats with minimum sample sizes.
Accessing a larger sample from the community would improve representativeness and
potentially the reliability of the data. Presentation of information in the data collection tables
should be modified so not to lead respondents. Consideration should be given to alternative
labels for the levels of the attributes other than of high, medium and low.
The expert process employed to elicit data could be reviewed: the approach taken in this
research has only partially implemented processes advocated by Burgman (2005) in that
respondents were not presented with aggregate results from the workshop, then offered the
opportunity to update their own individual data as in Delphi approaches. The interpolation
process enacted to complete the workshop data tables and to expand that data to the final
look-up table format should be reviewed in order to preserve the information in the workshop
tables. In validation processes the variables representing the attributes should have a
foundation in real data, rather than integers that represent categorical variables as has been
used in this analysis.
Conclusions
In this paper we have described the application of experienced utility in various forms to
assessing changes in wellbeing associated with changes to attributes of estuarine water-bodies
that in turn determine the level of ecosystem services available. In particular we report the
application of a visual analogue method which employs expert elicitation techniques tot eh
task of collecting experienced utility, and projected experienced utility data. Using validation
approaches based in Prospect Theory and more conventional utility theory we shown our data

16
demonstrates features required of utility data – “S” shaped, or at least concave in individual
data, and concave in aggregate data. We note avenues to improve data collection, and to
refine post data collection processing.
References
Bateman, I., Day, B.H., Stravos, G., and Lake, I., (2006) The Aggregation Of Environmental
Benefits: Welfare Measures, Distance Decay, And WTP. Discussion paper #14, September
2006, Commerce Division, Lincoln University.
Batstone, C., Stewart-Carbines, M., Kerr, G and Sharp, B. and Anton Meister, 2010,
Understanding values associated with stormwater remediation options in marine coastal
ecosystems: A case study from Auckland, New Zealand, Paper presented to Australian
Agricultural and Resource Economics Society National Conference, Adelaide, 2010.
Cammerer C., and G. Lowenstein (2004) Behavioural Economics” Past, Present, and Future,
in C. Camerer, G. Lowenstein, and M.Rabin, eds, Advances in Behavioural Economics, New
York, NY; Russell Sage Foundation.
Carter, M., (2001), Foundations of Mathematical Economics, p 340, MIT Press 639p.
Carter, S., and M. McBride (2010) Experienced Utility versus Decision Utility: Putting the
“S” in Satisfaction, unpublished paper, downloaded from the internet 20 November 2011;
http://www.economics.uci.edu/files/economics/docs/workingpapers/2008-09/mcbride-25.pdf
Frederick, S., and G. Lowenstein (1999) Hedonic Adaptation pp 302-329 in D. Kahneman, E.
Deiner, and N. Scwartz eds, Well-Being: The Foundations of Hedonic Psychology, New
York: Russell Sage Foundation.
Galanter, E., (1990) Utility Functions for Non-Monetary Events, American Journal of
Psychology 103(4) : 449-470, cited in Smith & McBride (2010)
George, D., and Mallery, P., (2003), SPSS for Windows Step by Step: A Simple Guide and
Reference, 11.0 Update (4th
ed), Boston, Allyn and Bacon.
Gould, D., Kelly, D., Goldstone, L. and Gammon, J. (2001), Examining the validity of
pressure ulcer risk assessment scales: developing and using illustrated patient simulations to
collect the data Information point: Visual Analogue Scale. Journal of Clinical Nursing, 10:
697–706.
Hajkowicz ,S., Spencer, R., Higgins, A., Marinonic, O. (2008). Evaluating Water Quality
Investments Using Cost- Utility Analysis, Journal of Environmental Management, Volume 88,
Issue 4, September 2008, Pages 1601–1610
Hensher, D.A., 2006, How do respondents process stated choice experiments? Attribute
consideration under varying information load, Journal of Applied Econometrics, Volume 21,
Issue 6, pages 861–878
Jorgensen, B.S., and Stedman, R.C., (2001) Sense Of Place As An Attitude: Lakeshore
Owner’s Attitudes To Their Properties. Journal of Environmental Psychology( 21): 233-248

17
Kahneman, D., and A. Tversky, (1997) Prospect Theory: An Analysis of Decision Making
under Risk, Econometrica 47(2): 263:292
Kahneman, D., Wakker, P., and R. Sarin (1997) Back to Bentham? Explorations of
Experienced Utility Quaterly Journal of Economics 112(2): 376-405
Kahneman, D., and Sugden, R., (2005) Experienced Utility As A Standard Of Policy
Evaluation. Environmental and Resource Economics (2005) 32: 161-181.
Kant, S., and S. Lee, 2004, A social choice approach to sustainable forest management: an
analysis of multiple forest values in Northwestern Ontario, Forest Policy and Economics,
Volume 6, Issues 3–4, June 2004, pp 215–227.
Layard, R., Mayraz, G., and S. Nickell (2008) The Marginal Utility of Income Journal of
Public Economics 92(8-9): 1846-1857.
Luce, R.D., (2000) Utility of Gains and Losses: Measurement – Theoretical and Experimental
Approaches, Mahwah NJ Lawrence Erlbaum Associates.
Matlab, (2012), http://www.mathworks.com/help/matlab/ref/triscatteredinterp.html
MEA Board, 2005, Natural Assets and Human Wellbeing: Statement from the Board,
downloaded from MAweb.org, 16 August, 2012
Moores, J., Batstone, C., Gadd, J., Green, M., Harper, S., Semadeni-Davies, A. and Storey, R.
2013. Evaluating the Sustainability of Urban Development in New Zealand in Relation to
Effects on Water Bodies. Accepted for presentation at Ninth International Conference on
Environmental, Cultural, Economic & Social Sustainability, 23-25 January 2013 Hiroshima,
Japan.
Pervin, L., (1989) Goal Concepts and Social Psychology: A Historical Perspective, pp1 – 17
in L.Pervin ed. Goal Concepts and Social Psychology, Hillsdale, New Jersey, Erlbaum
Assoicates.
Prato, T., (1999), Multi-attribute decision analysis for ecosystem management, Ecological
Economics (30) 207-222.
Samuelson & Nordhaus. 2001 Microeconomics. 17th ed. page 110. McGraw Hill
Saaty, R.W.,(1987), The Analytical Hiercahy Process – what is it, how is it used?
Mathematical Modelling 93(3-5) 161-176
Suls, J., and L. Wheeler; eds (2000) Handbook of Social Comparisons: Theory and Research.
New York: Kluwer Academic / Plenum Publishers, cited in Carter & McBride (2010)
Schade, D.A., and D.Kahneman (1998) Does Living in California Make People Happy? A
focusing Illusion in judgments of life satisfaction Psychological Science, 9,340-346

18
Tinch, D., Colombo, S., and N.Hanley (2010) Differences between Decision and Experienced
Utility: An Investigation using the Choice Experiment method, Stirling Economics
Discussion Paper 2010-13, https://dspace.stir.ac.uk/bitstream/1893/2706/1/SEDP-2010-13-
Tinch-Colombo-Hanley.pdf
Van Houten, G., Powers, J., and Pattanakak, S.K., 2007. Valuing water quality improvements
in the United States using meta-analysis: is the glass half empty or half full for national policy
analysis? Resource and Energy Economics (29): 206-228
Vaughan, W.J., (1986) The Water Quality Ladder. Included as Appendix B, in Mitchell, R.C.,
Carson, R.T., 1986. The Use of Contingent Valuation Data for Benefit/Cost Analysis inWater
Pollution Control. CR-810224-02. Prepared for U.S.Environmental Protection Agency, Office
of Policy, Planning, and Evaluation, Washington, DC; cited in Van Houten et al.2007.
Vendrick, M., and G. Woltjer (2007) Happiness and Loss Aversion: Is Utility Concave or
Convex in Relative Income? Journal of Public Economics 91(7-8): 1423-1448