An Investigation into Optimal Modes of Campus Food ...
21
UBC Social Ecological Economic Development Studies (SEEDS) Student Report Donna Wang, Mac McNicol, Vincent Tang, David Jacob, Isaiah Kim An Investigation into Optimal Modes of Campus Food Delivery APSC 262 April 10, 2014 University of British Columbia Disclaimer: “UBC SEEDS provides students with the opportunity to share the findings of their studies, as well as their opinions, conclusions and recommendations with the UBC community. The reader should bear in mind that this is a student project/report and is not an official document of UBC. Furthermore readers should bear in mind that these reports may not reflect the current status of activities at UBC. We urge you to contact the research persons mentioned in a report or the SEEDS Coordinator about the current status of the subject matter of a project/report”.
Transcript of An Investigation into Optimal Modes of Campus Food ...

UBC Social Ecological Economic Development Studies (SEEDS) Student Report
Donna Wang, Mac McNicol, Vincent Tang, David Jacob, Isaiah Kim
An Investigation into Optimal Modes of Campus Food Delivery
APSC 262
April 10, 2014
University of British Columbia
Disclaimer: “UBC SEEDS provides students with the opportunity to share the findings of their studies, as well as their opinions, conclusions and recommendations with the UBC community. The reader should bear in mind that this is a student project/report and is not an official document of UBC. Furthermore readers should bear in mind that these
reports may not reflect the current status of activities at UBC. We urge you to contact the research persons mentioned in a report or the SEEDS Coordinator about the current status of the subject matter of a project/report”.

An Investigation into Optimal Modes of Campus Food Delivery
David Jacob
Isaiah Kim
Vincent Tang
Qian Yu Wang
Mac McNicol
Submitted to: Dr. Naoko Ellis
APSC 262: Technology and Society II
10 April 2014

1
Abstract
The construction of the new UBC Student Union Building (SUB), expected to be completed
by 2015 offers an opportunity for AMS Food and Beverage to introduce changes to various aspects
of food services offered to UBC students. One of these many changes has to do with the
introduction of a campus-wide food delivery system. This research aims to investigate optimal
modes of campus food delivery and offer recommendations.
Focusing mainly on a sustainable vehicle to use for delivery, a few requirements were made
clear from the start. A suitable delivery vehicle should: have 100 cubic feet of cargo space, be able to
withstand Vancouver’s weather conditions and seasons, and have an operational range that can
cover the whole of UBC’s point grey campus. This research cites both primary and secondary
sources for information on vehicles currently available in North America as well as existing research
into the environmental and economic aspects of various vehicle types.
With the aim to evaluate the environmental, economic, and social implications of a potential
delivery vehicle, this investigation begins by looking into existing research to compare the
environmental impacts of vehicles that run on various fuels, full electric vehicles (EV), and hybrids.
Following this, the search for a suitable vehicle can be narrowed down to just one class of vehicle –
In this case, a full EV by Canadian Electric Vehicles Ltd – the Might-E Truck. The cost
effectiveness of the candidate vehicle is then analyzed with initial costs, maintenance and energy
costs among the parameters taken into account. A logistics analysis follows, making sure the vehicle
fits the physical and range requirements followed finally by an investigation into the social
implications of the chosen vehicle on members of the UBC campus community.

2
Table of Contents
List of Illustrations 3
Glossary 3
List of Abbreviations 4
1.0 Introduction 5
2.0 Analysis of Environmental Impact 6
2.1 Efficiency 6
2.2 Emissions 8
2.3 Brief Summary 9
3.0 Economics and Logistics 10
3.1 Initial Investment 10
3.2 Energy Costs 10
3.3 Maintenance 11
3.4 Range and Delivery 12
3.5 Charging, Usable Hours and Cost per Year 12
4.0 Analysis of Social Impacts 13
4.1 - Noise Pollution 13
4.2 - Electric Vehicle Infrastructure 14
4.3 - Health and Safety 15
5.0 Conclusion and Recommendations 16
References 18

3
List of Illustrations
Figure 1: Comparison of well-to-wheel efficiencies. Pg. 7
Figure 2: Comparison of well-to-wheel emissions. Pg. 8
Figure 3: Comparison of Standard Internal Combustion Engine (ICE) and Electric at constant
speed. Pg. 14
Glossary
Adapted gear - The natural gear on the vehicle for speed being tested.
Inferior gear - One gear lower than the natural gear on the vehicle for the speed being tested in
order to induce higher motor speed and noise.
Well-to-wheel energy efficiency – The efficiency derived from comparing the energy content of
the source fuel to the energy used to turn the wheels of the vehicle (hence the name). The energy
content of the source fuel is tracked from: extraction from the ground, conversion into fuel type,
energy lost from transportation of fuel, and advertised energy efficiency of the vehicle. This number
is expressed in terms of kilometres driven for each megajoule (km/MJ) in this investigation.
Well-to-wheel emissions – The emission of the vehicle when the emissions from the source fuel to
the energy used to turn the wheels of the vehicle are taken into account. The number is expressed in
grams of carbon dioxide for each kilometer driven (g/km) in this investigation.

4
List of Abbreviations
CO₂ – Carbon dioxide
EV – Electric vehicle
g/km – grams per kilometer. See glossary: well-to-wheel emissions.
g/MJ – grams per Mega joule
km/MJ – Kilometer per Mega joule. See glossary: well-to-wheel energy efficiency
Mpg – Miles per gallon
SUB – Student Union Building
UBC – University of British Columbia
Wh/km – Watt-hours per kilometer

5
1.0 Introduction
In this investigation we approach our recommendation by first analyzing the environmental
impact of vehicles that run on various energy sources, citing mainly studies that compare these
technologies to prove that full EVs should be the preferred choice when it comes to optimal energy
efficiency for a campus food delivery setup. Here, comparisons are drawn between more regular
automobiles as these are the focus of most existing research and we lean less towards the small
utility vehicle class that is of interest.
Next, we explore the logistics and economic feasibility of EVs by studying the operational
range that is expected of these vehicles as well as the number of hours in a day they will be expected
to operate. This, together with a cost analysis of our main candidate – the Might-E Truck
manufactured by Canadian Electric Vehicles Ltd. – in comparison to a similar solution – a John
Deere Gator TH 6x4 Utility Vehicle will be used to draw conclusions on whether or not the Might-
E truck fits the main requirements set by our stakeholders.
Finally, we look into the UBC community. Given the current image of UBC as a campus
with numerous initiatives towards social, economic and environmental sustainability, this
investigation will explore how the introduction of one or more Might-E Trucks as campus food
delivery vehicles will affect the community, and encourage further change within the students and
staff.
6
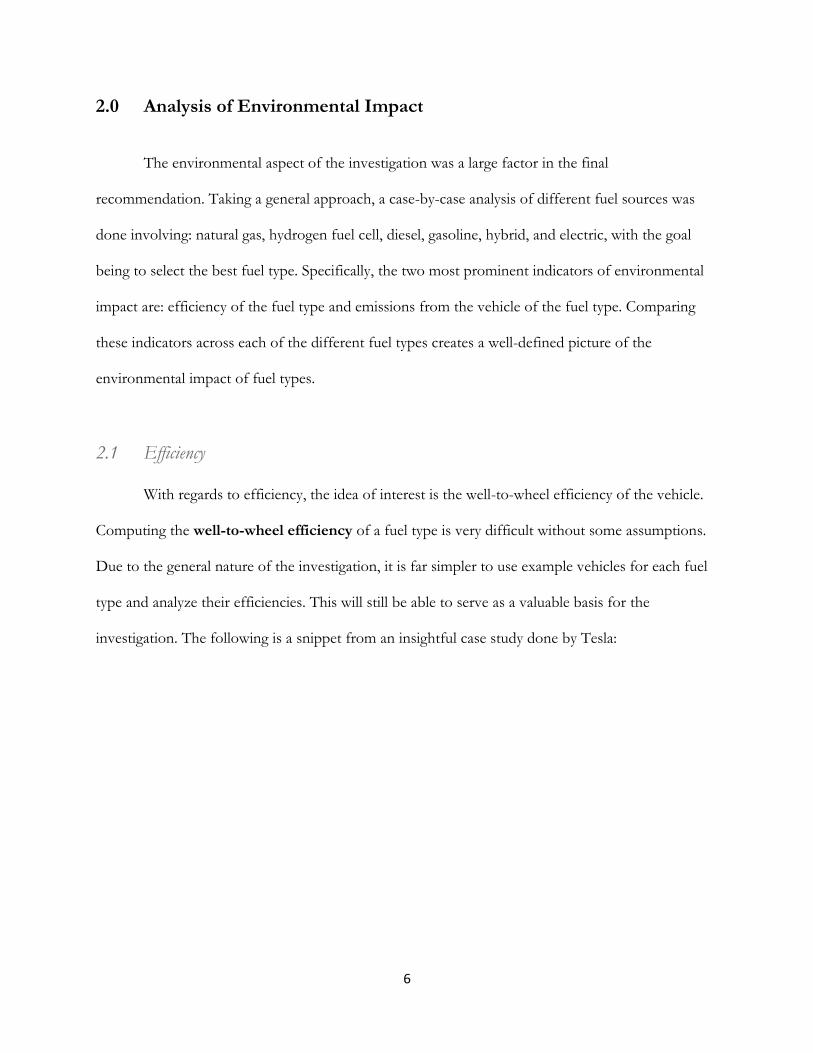
2.0 Analysis of Environmental Impact
The environmental aspect of the investigation was a large factor in the final
recommendation. Taking a general approach, a case-by-case analysis of different fuel sources was
done involving: natural gas, hydrogen fuel cell, diesel, gasoline, hybrid, and electric, with the goal
being to select the best fuel type. Specifically, the two most prominent indicators of environmental
impact are: efficiency of the fuel type and emissions from the vehicle of the fuel type. Comparing
these indicators across each of the different fuel types creates a well-defined picture of the
environmental impact of fuel types.
2.1 Efficiency
With regards to efficiency, the idea of interest is the well-to-wheel efficiency of the vehicle.
Computing the well-to-wheel efficiency of a fuel type is very difficult without some assumptions.
Due to the general nature of the investigation, it is far simpler to use example vehicles for each fuel
type and analyze their efficiencies. This will still be able to serve as a valuable basis for the
investigation. The following is a snippet from an insightful case study done by Tesla:

7
Figure 1: Comparison of well-to-wheel efficiencies.
The example vehicles used in the comparison are considered to have a very high efficiency
for their fuel type. Despite this, it is still easy to see that the EV is the clear winner with regards to
environmental impact with over twice the efficiency of the next best choice: the hybrid.
From the perspective of the investigation, it is reasonable to assume that EVs in general
have an advantage over the other fuel types. Furthermore, due to the great environmental advantage,
the EV is an excellent starting point for the rest of the investigation. It is also worth mentioning that
the comparison shown previously was done with the assumption that the source fuel for the EV
(that is, the fuel that is converted to electricity) is natural gas. Here in British Columbia, 90% of
electricity is hydroelectricity which translates to an even higher efficiency than depicted in Tesla’s
investigation.

8
2.2 Emissions
Similar to well-to wheel-efficiency, the well-to-wheel emission of vehicles is also explored.
In the same case-study as above, emissions are computed with the same considerations in mind as
the efficiency calculations. That is, the carbon content of the source fuel is compared to the carbon
emissions required to reach the wheels of the vehicle. However, the assumption here is that each
vehicle uses and ideal engine that emits only carbon dioxide and water. Of course, the CO₂
emissions are of particular concern. The following shows the data collected from the case study:
Figure 2: Comparison of well-to-wheel emissions.

9
It is evident again that the EV has the lowest environmental impact. The EV emits three
times less than the prevalent gasoline engine, and still emits nearly three times less than the next
closest competitor.
Once again, because of the magnitude of the advantage of EVs, it is not unreasonable to
assume that EVs in general have an advantage with regards to CO₂ emissions. However, EV
emissions vary in that they depend on the ease of the ability of the region to generate electricity.
Since Tesla Motors is an American company, they have likely conducted their investigation with the
US in mind. Thankfully, a study comparing EV emissions across different countries showed that for
an EV with a well-to-wheel CO₂ emission of 75g/km in the US will only have a well-to-wheel
emission of 31g/km in Canada. Since British Columbia has an especially large electricity sector, as
mentioned above, there is a great comparative advantage in using EVs here.
2.3 Brief Summary
The EV is the clear choice when considering the vehicle type with the best environmental
impact. It has great advantages in the two areas that are salient indicators for environmental impact,
namely efficiency and emission. Also, there is a regional advantage to using EVs in Canada and
particularly in British Columbia due to the prominent electricity sector. As a result, the EV will
serve as the focal point of the rest of the investigation: discussion of economic feasibility, social
acceptability and final recommendations.

10
3.0 Economics and Logistics
In terms of the price and usability of an electric vehicle, there are several factors that come
into play. First and foremost is the cost of the initial investment, then energy costs, then
maintenance, and finally the range, charging and use of the vehicle. Through looking at these factors
and comparing several vehicles, we come to the conclusion that the Might-E truck by Canadian
Electric Vehicles is the best solution for a short-range food delivery application. For a comparison
to a similar style of vehicle, but in a gasoline configuration, the specifications of a John Deere Gator
TH 6x4 Utility Vehicle will be referenced.
3.1 Initial Investment
The Might-E truck has an initial cost of $34 000 when configured with a pickup box. The
pickup box is important to the application of the vehicle because of the need to shelter food in
transportation. The price of this vehicle is justified by its custom made parts specifically for this
vehicle and because of the use of high quality, North American sourced parts. Compared to less
expensive vehicles such as the Zaptruck XL, which is a repurposed truck made in China, the Might-
E truck will be more reliable and have a higher grade build quality that will be essential for everyday
use. The John Deere vehicle, as a comparison, costs approximately $15 000.
3.2 Energy Costs
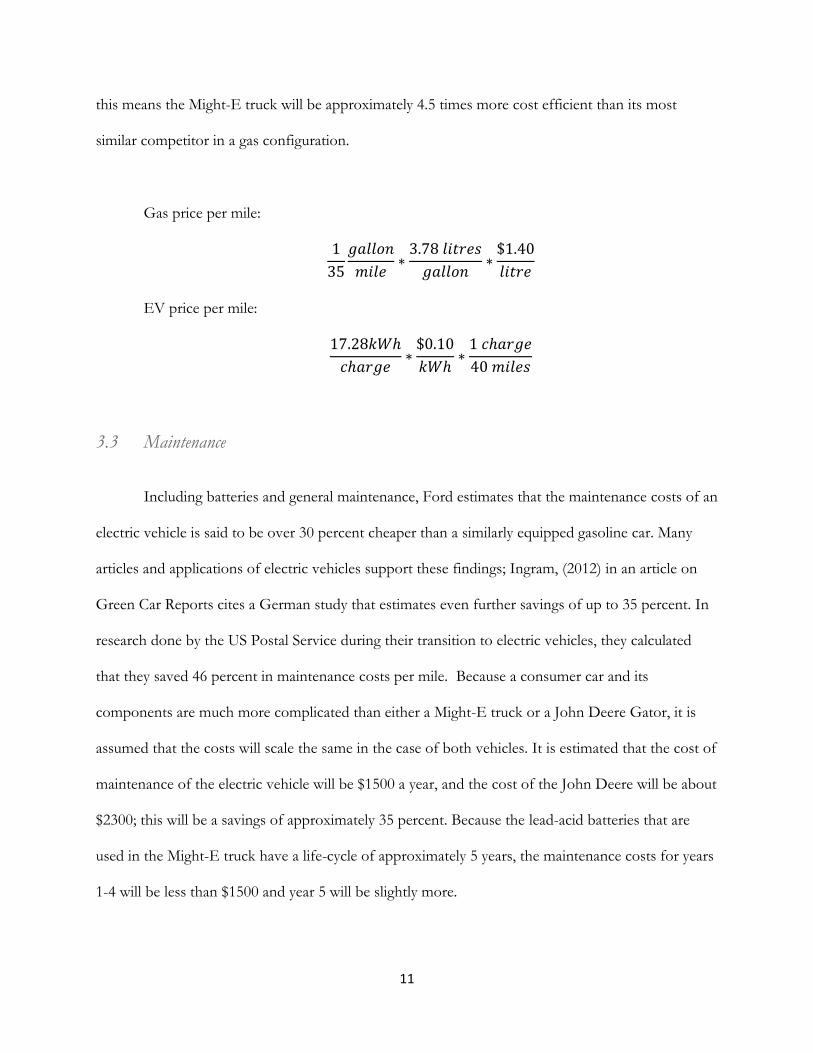
In looking at similar vehicles only in terms of fuel costs and payload, a Might-E truck costs
approximately 4 cents per mile, where a John Deere Gator gas powered vehicle costs approximately
18 cents per mile. Because the Gator vehicle has a relatively efficient estimated 25 mpg for our
application, this figure would be the minimum cost of fuel for a gasoline powered car. In conclusion,
11
this means the Might-E truck will be approximately 4.5 times more cost efficient than its most
similar competitor in a gas configuration.
Gas price per mile:
1
35
𝑔𝑎𝑙𝑙𝑜𝑛
𝑚𝑖𝑙𝑒∗
3.78 𝑙𝑖𝑡𝑟𝑒𝑠
𝑔𝑎𝑙𝑙𝑜𝑛∗
$1.40
𝑙𝑖𝑡𝑟𝑒
EV price per mile:
17.28𝑘𝑊ℎ
𝑐ℎ𝑎𝑟𝑔𝑒∗
$0.10
𝑘𝑊ℎ∗
1 𝑐ℎ𝑎𝑟𝑔𝑒
40 𝑚𝑖𝑙𝑒𝑠
3.3 Maintenance
Including batteries and general maintenance, Ford estimates that the maintenance costs of an
electric vehicle is said to be over 30 percent cheaper than a similarly equipped gasoline car. Many
articles and applications of electric vehicles support these findings; Ingram, (2012) in an article on
Green Car Reports cites a German study that estimates even further savings of up to 35 percent. In
research done by the US Postal Service during their transition to electric vehicles, they calculated
that they saved 46 percent in maintenance costs per mile. Because a consumer car and its
components are much more complicated than either a Might-E truck or a John Deere Gator, it is
assumed that the costs will scale the same in the case of both vehicles. It is estimated that the cost of
maintenance of the electric vehicle will be $1500 a year, and the cost of the John Deere will be about
$2300; this will be a savings of approximately 35 percent. Because the lead-acid batteries that are
used in the Might-E truck have a life-cycle of approximately 5 years, the maintenance costs for years
1-4 will be less than $1500 and year 5 will be slightly more.

12
3.4 Range and Delivery
When looking at distances on the UBC campus from the new Student Union building, the
farthest buildings (not using pedestrian paths) are approximately 2 km. One of the buildings that are
approximately 2 km away is the Totem Park residence. Using the approximate usable range of 72
km, it is estimated that the Might-E truck will be able to drive 18 trips to Totem Park on a single
charge. Most residences are much closer than 2km, with the majority of them being about 1 km
away, which means these residences could be delivered to approximately 36 times in one day. Using
trip consolidation techniques, this figure could be increased even further.
Usable Range:
90km max – 10% safety – 10% load
3.5 Charging, Usable Hours and Cost per Year
It is estimated that, using the charging ports to be installed at the SUB loading bay, that the
Might-E truck will take 6 hours to charge. It is assumed downtime needed to charge the vehicle will
be available from approximately 2-8am. Compared to similar vehicles, such as the Zaptruck XL,
with charging times of up to 12 hours, the Might-E truck is quite efficient.
Not including the initial costs, if the Might-E truck and the Gator were to drive 50 miles
every day and maintenance estimates are included, the Might-E truck will cost less than half that of
the Gator. It is estimated that it would take only 5 years to offset the cost of choosing the Might-E
truck over a Gator. Every year after that it is estimated that it would save over $3500 a year on fuel
and maintenance costs.

13
4.0 Analysis of Social Impacts
The University of British Columbia is becoming a worldwide leader in developing an
environmentally-friendly campus with initiatives such as the UBC Sustainability Initiative (USI),
which sets sustainability goals and targets and how to achieve them. The scope of these goals range
from what type of food is available on campus to what type of building materials the new SUB
should use. As sustainability is deeply ingrained in UBC’s culture, it is important to investigate how
different options for vehicles for the new SUB’s delivery network will affect this culture in the short
and long term.
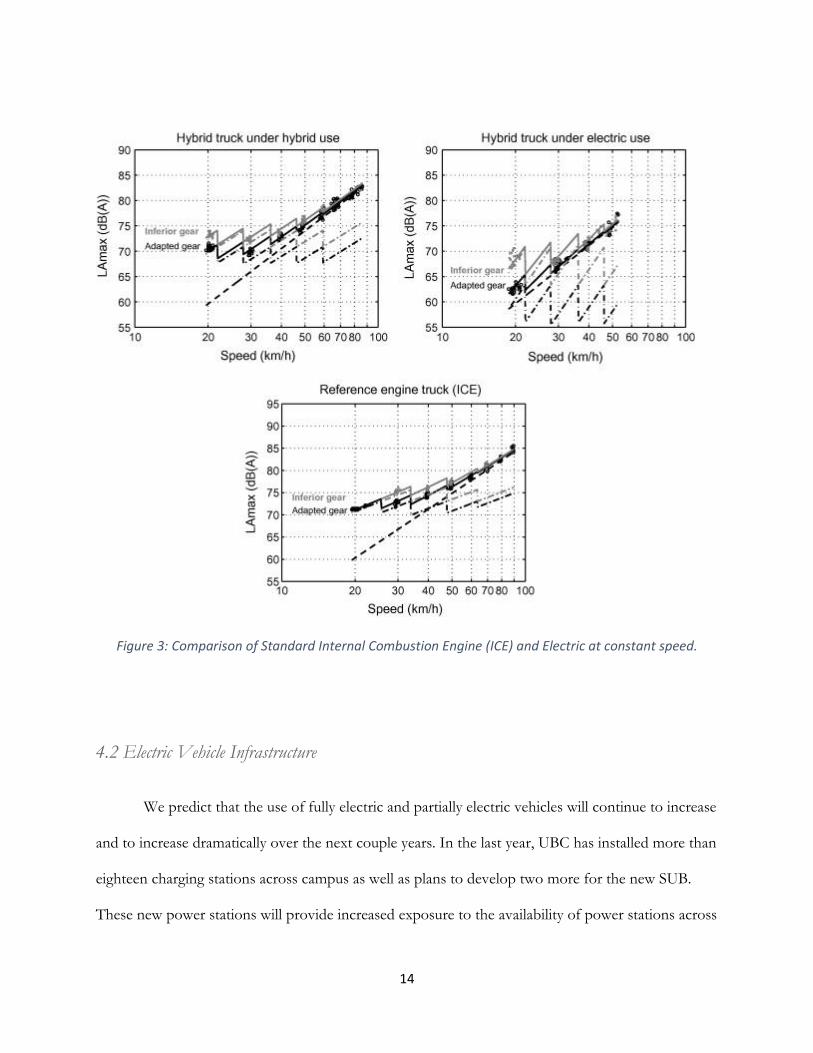
4.1 Noise Pollution
The new SUB will offer a late-night delivery service to students in all of UBC’s residences as
well as all other accommodations across campus. The late-night nature of this service developed the
need for investigation on how much noise these new campus vehicles would be emitting in order to
ensure that UBC residents will not be disturbed by the operating noise of these vehicles. In general,
electric vehicles generate much less vehicular noise than their diesel counterparts. Pallas et al. (2014)
found that at low constant speeds, electric vehicles may have a noise benefit exceeding 8dBa when
compared to their standard-engined counterparts; additionally, although smaller, the noise benefit
during acceleration and braking is still prevalent. It can be seen that electric vehicles has the
advantage when comparing noise that the vehicles produce.
14
Figure 3: Comparison of Standard Internal Combustion Engine (ICE) and Electric at constant speed.
4.2 Electric Vehicle Infrastructure
We predict that the use of fully electric and partially electric vehicles will continue to increase
and to increase dramatically over the next couple years. In the last year, UBC has installed more than
eighteen charging stations across campus as well as plans to develop two more for the new SUB.
These new power stations will provide increased exposure to the availability of power stations across

15
campus. With increased exposure to the availability of these charging stations, EV infrastructure is
continue to increase. As a result, a social plan will need to be developed on a larger scale in order to
accommodate more electric vehicles on campus and provide rules and regulations on the use of
campus charging stations.
Overall, the increased use of electric vehicles on campus provides an educational
opportunity to the students and staff on campus. It has been found that increasing the amount of
charging stations (corrected for population) statistically predicted EV adoption rates in that area
(Sierzchula, 2014). As the campus gets increased amounts of electric vehicle infrastructure, students
and staff could be more educated into more environmentally efficient transport options for use in
their daily commutes to school and work. With more infrastructure available, there will be less hassle
in finding a charging station on campus, and therefore more people will be inclined to make the
change over to either hybrid, or fully electric vehicles.
4.3 Health and Safety
Emission reduction is one of the core areas that UBC has focused on in creating a more
sustainable campus. In terms of health and safety of faculty and students at UBC, it is important to
look at how these new campus vehicles will affect particle emissions across campus. In the driving
process, standard vehicles emit organic and elemental carbon, ions, and a variety of particulate and
semivolatile organic compounds that are not only an environmental concern, but are also a long-
term health risk to humans (Zielinska, Sagebiel & McDonald, 2012). Comparatively, electric vehicles
have little to no tailpipe emissions. With the aims of developing a more sustainable campus, it is in
the best interest of UBC to limit emissions made on campus, and therefore a electric vehicle makes
the most sense when increasing their vehicle fleet on across campus.

16
5.0 Conclusion and Recommendations
The aim of the investigation is to help the AMS food delivery system at UBC to find the best
delivery vehicle for their intended service. Our investigation into the matter started with exploring
different vehicle options that utilize different energy sources which include natural gas, hydrogen
fuel cell, diesel, gasoline, electricity and hybrids. We then came to the conclusion that electric
vehicles are the most suitable option for catering to the needs of AMS food delivery systems in the
environmental, economic, and social aspects. Electric vehicles provide the highest efficiency among
all fuel types, and with 90% of the electricity produced in British Columbia being Hydroelectricity, it
translates into even higher well-to-wheel efficiency. Another study presented above illustrates that
the carbon dioxide emission is the least for electric vehicles compared to vehicles utilizing other fuel
sources. EVs have the least adverse environmental impact with low emissions and high efficiency,
especially advantageous in BC. Then having decided EVs are the most promising vehicle type, we
then investigated different EVs from various manufacturers and came to the recommendation of the
Might-E Truck manufactured by Canadian Electric Vehicles Ltd. The initial cost of $34,000 might
seem high at first, however our detailed analysis and breaking down the operational cost it came to
approximately 4 cents per mile, which is a great economic advantage in the long term. The range of
one charge can cover multiple trips that are well beyond the needs of the delivery service. Rough
estimates show potential savings up to $3500 a year on fuel and maintenance costs. As the AMS at
the new SUB is expected to implement night deliveries to residents on campus, noise pollution will
also become a significant factor for choosing the right vehicle. As research shows, EVs produce the
least amount of noise. As EV infrastructure is increasing dramatically, the use of EV vehicles for
AMS will increase the exposure and awareness of power efficiency through new and efficient

17
technologies for services at UBC. Emission reduction through incorporation of EVs will provide a
more healthy and sustainable campus. In conclusion, based on the full triple bottom line analysis
proposed above we would like to make a recommendation to our client the AMS food delivery
system to purchase the Might-E Truck manufactured by Canadian Electric Vehicles Ltd.
18
References
Abu Bakar, R., Ali, S. (2008). A Technical Review of Compressed Natural Gas as an Alternative Fuel for
Internal Combustion Engines. American Journal of Engineering and Applied Sciences. Retrieved March 4, 2014
Covington, P. (2011, March 31). New Analysis on the Carbon Impact of Electric Cars: Still Better than Gas. .April 3, 2014, Retrieved from http://www.triplepundit.com/2011/03/driving-electric-vehicle-reduce-carbon-emiss/
Eberhard, M., & Tarpenning, M. (2016). The 21st Century Electric Car. Retrieved November, 2013,
from http://www.fcinfo.jp/whitepaper/687.pdf
Girard, R. (2011). Electric Car Report: What are the Prospects for an Electric Car Industry in Canada and is this a
Real or False Solution for Climate Change (pp. 4-23). Ottawa, Canada: Polaris Institute.
Ingram, A. (2012, December 6). Electric car maintenance s third cheaper than combustion vehicles?. In
Green Car Reports. Retrieved April 1, 2014, from http://www.greencarreports.com/news/1080925 electric-car-maintenance-a-third-cheaper-than-combustion-vehicles
Larminie, J., & Lowry, J. (2012). Electric vehicle technology explained. (2nd ed.). Somerset, NJ, USA: Wiley.
Retrieved from http://site.ebrary.com/lib/ubc/docDetail.action?docID=10579519
Lloyd, A. C., & Cackette, T. A. (2011, December 27). Diesel Engines: Environmental Impact and
Control [Electronic version].Journal of the Air & Waste Management Association. doi:10.1080/10473289.2001.10464315
McConnell,V., &Harrington, W.(2003, April) Resources for the Future. (2003). Motor Vehicles and the
Environment. (Eds.). Retrieved March 4, 2014, from http://www.rff.org/rff/documents/rff-rpt-carsenviron.pdf
Pallas, M. A. (2014). Noise emission assessment of a hybrid electric mid-size truck. Applied acoustics, 76,
280. Retrived March 1, 2014, from http://www.sciencedirect.com/science/article/pii/S0003682X13002065

19
Radich, A. (2011). Biodiesel Performance, Costs, and Use. Retrieved March 4, 2014, from http://large.stanford.education /courses/2011/ph240/garcia1/docs/biodiesel.pdf
Seagrave, J., Mauderly, J. L., Zielinska, B., Sagebiel, J., Whitney, K., La, D. R., & Gurevich, M. (2000,
June 19). Comparative Toxicity of Gasoline and Diesel Engine Emissions. In SciTech Connect. Retrieved March 4, 2014, from http://www.osti.gov/scitech/servlets/purl/770970
Sierzchula, W. (2014). The influence of financial incentives and other socio-economic factors on electric
vehicle adoption. Energy Policy, 68, 183-194. Retrieved from: http://www.sciencedirect.com/science/article/pii/S0301421514000822
Zielinska, B., Sagebiel, J., & McDonald, J. D. (2012). Emission rates and comparative chemical
composition from selected in-use diesel and gasoline-fueled vehicles. Journal of Air & Waste Management Association, 54(9), 1138-1150. Retrieved from: http://dx.doi.org/10.1080/10473289.2004.10470973
Getting Charged Up Over Electric Vehicles. (n.d.). Plug in to the power of your co-op membership.. Retrieved
April 11, 2014, from http://www.touchstoneenergy.com/content/getting-charged-over-electric-vehicles