An introduction to wireline logging for geotechnical...
36
ROBERTSON GEOLOGGING Innovation, global support & services Introduction to wireline logging for geotechnical applications
Transcript of An introduction to wireline logging for geotechnical...

ROBERTSON GEOLOGGINGInnovation, global support & services
Introduction to wireline loggingfor geotechnical applications
Agenda
Robertson Geologging
PS Suspension Logging
Density/Gamma Logging
Image Logging – Acoustic & Optical Televiewers
New Developments
Capabilities
Established 1979, in North Wales
Design, develop and manufacture of downhole tools and surface equipment
Develop software
Provide contract logging service & supply wireline & surface tools
Support hotline and replacement service
Training & commissioning
Believe in maintaining a large development program for a forever changing market
The only ISO9001 certified mineral logging manufacturer

Robertson Geologging (USA)Sales, support & rentals
Robertson Geologging (ASIA)Sales, support & rentals
Operations
Operations supported by over 45 agents worldwide
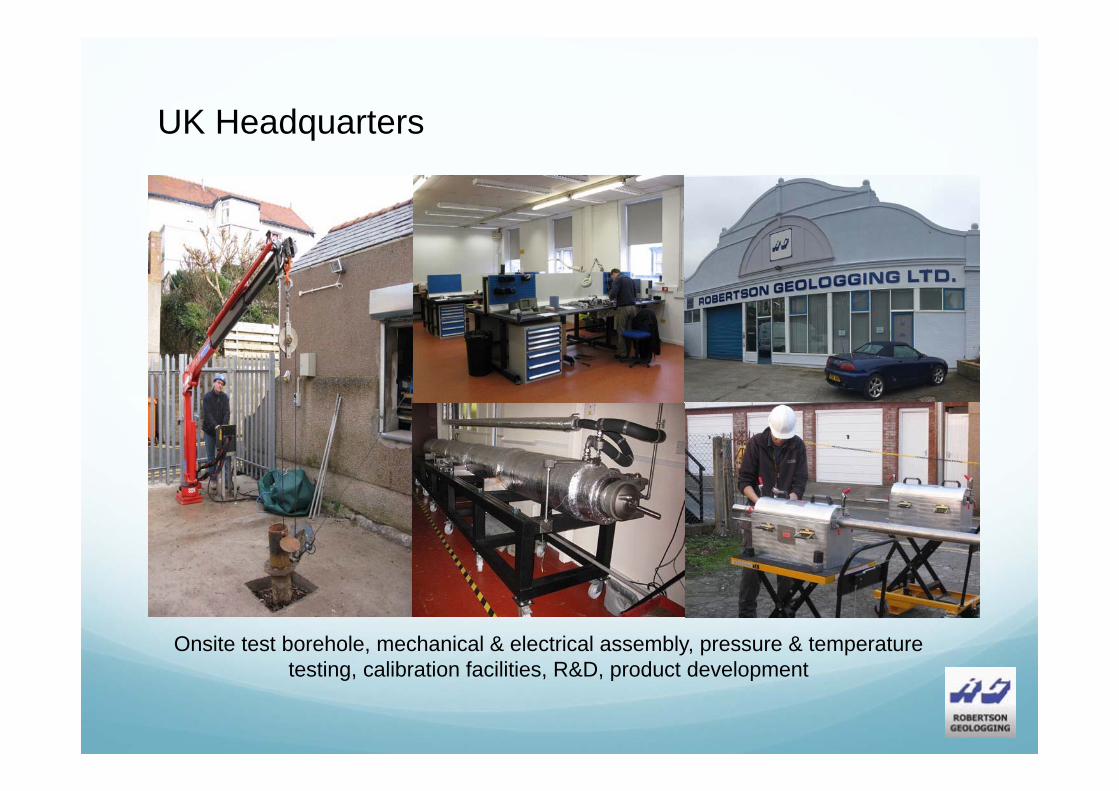
UK Headquarters
Onsite test borehole, mechanical & electrical assembly, pressure & temperature testing, calibration facilities, R&D, product development
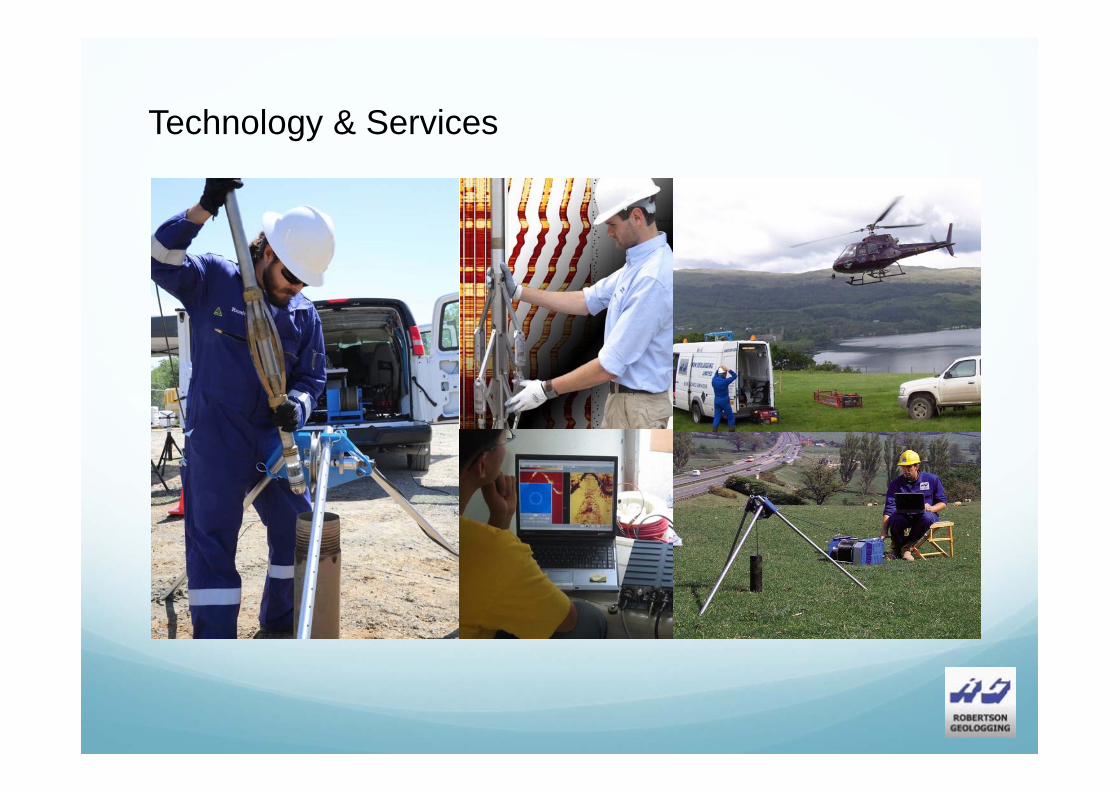
Technology & Services
PS logger
Developed by OYO Corporation Japan for domestic use in earthquake engineering
Introduced to the USA, Golden Gate Bridge & San Francisco Airport projects
2007 OYO transferred technology over to Robertson Geologging for further development
and commercialisation
Recent projects include; shallow oil/gas projects in Russia, offshore wind farm surveys
across Europe, Australia, the Mediterranean and South America, earthquake engineering
in Asia and land & offshore projects in the Arabian Gulf
PS logger - advantages
Needs only a single uncased borehole
Surveys can be performed immediately after drilling
Very mobile, moved rapidly between stations
Minimises survey time and risk of BH collapse
High vertical resolution, locate and resolve thin layers
Transmitter and receiver in the BH noise is reduced

PS Logger - operations

PS Logger - operations
Telemetry
Receivers
Filter
Source
Source driver
Weight

PS logger - operations
Powerful source, monopole and directional receivers separated by acoustic damping
tubes
Measurements typically shot at 1m intervals (1 minute)
Once fired the resultant fluid motion produces a tube wave at the BH wall
Waves propagate parallel to the BH axis, setting up corresponding fluid movements
that are detected by 3D hydrophone receivers – allowing the wave velocity to be
directly measured
Open water filled BHs between 75 – 150mm diameter. Will work through PVC with
adequate grouting – does not work with steel casing
PS logger - deliverables
Waveforms are examined and first arrival picks are made
Left and right oriented S waves are derived and averaged
Digital filtering can be used to attenuate random noise
Deliverables:P wave and S wave waveformsP wave and S wave velocity profilesVp/Vs ratio profileTabular data of arrival times, velocities and Vp/Vs ratio
If bulk density is known, the following can be derived:Shear modulusBulk modulusYoungs modulus

PS logger - picking first brake

PS logger - interpretation
Final calculation of Vp and Vs after picking first arrivals
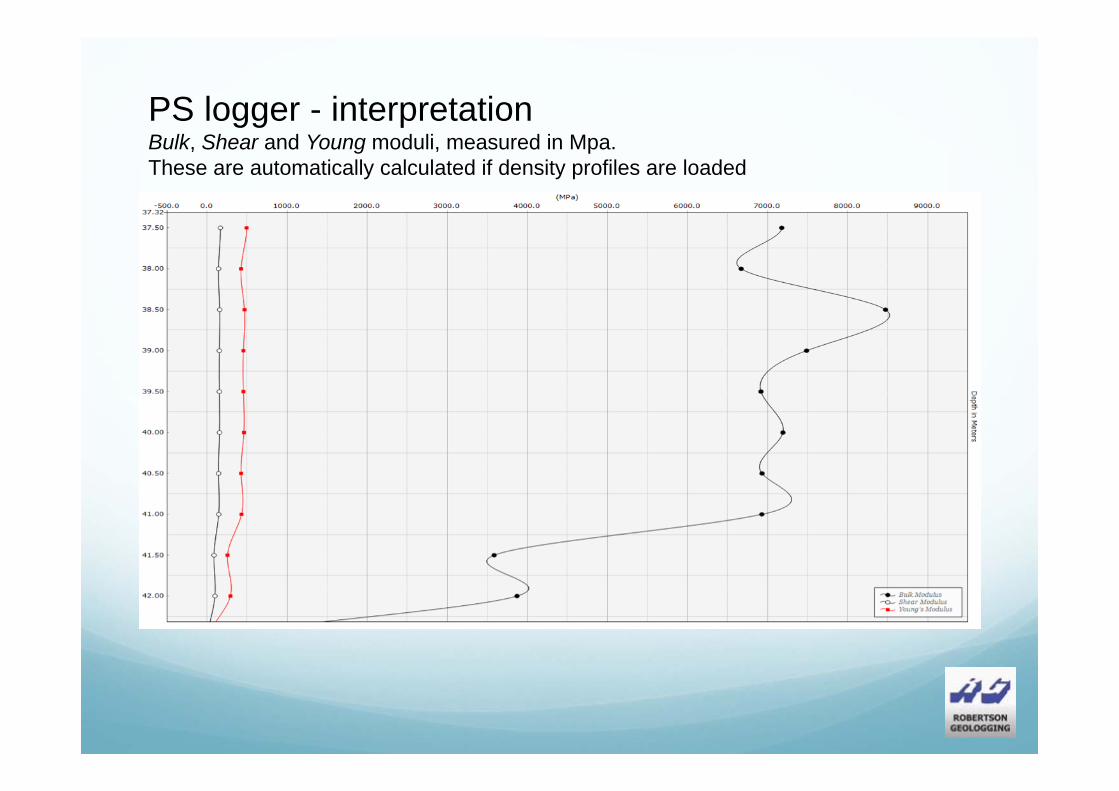
PS logger - interpretation Bulk, Shear and Young moduli, measured in Mpa.These are automatically calculated if density profiles are loaded
Final calculation of Vp and Vs after picking first arrivals
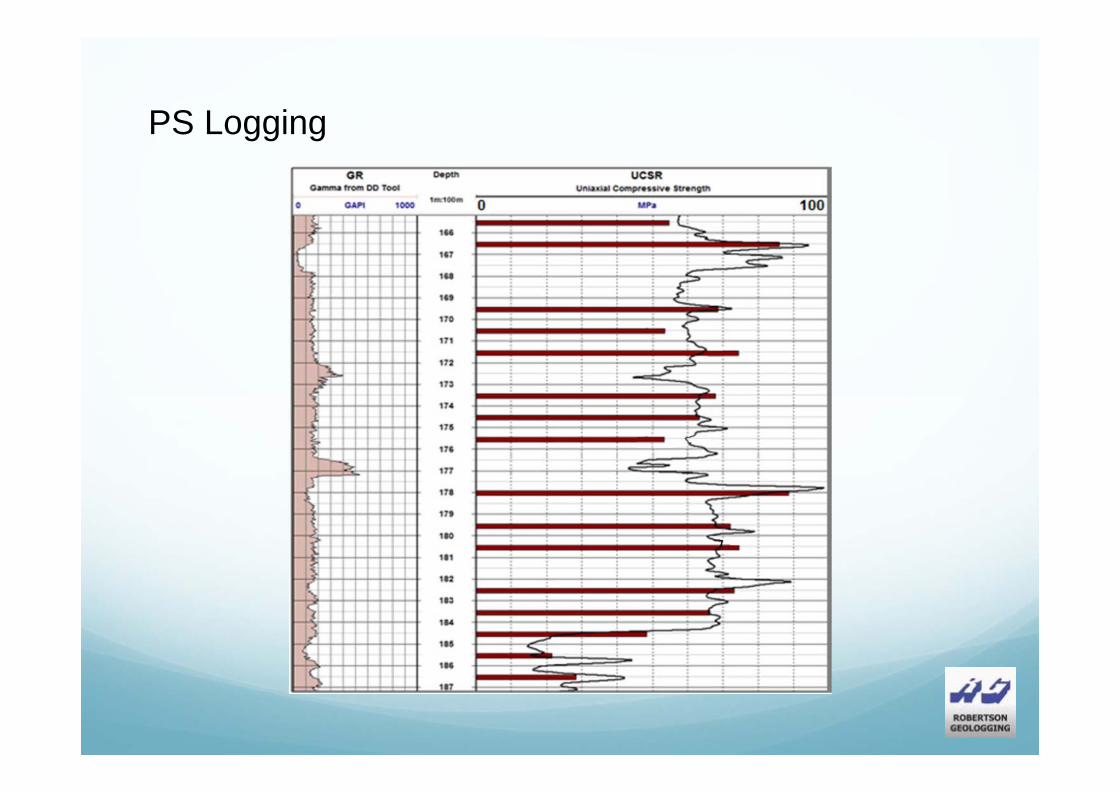
PS Logging
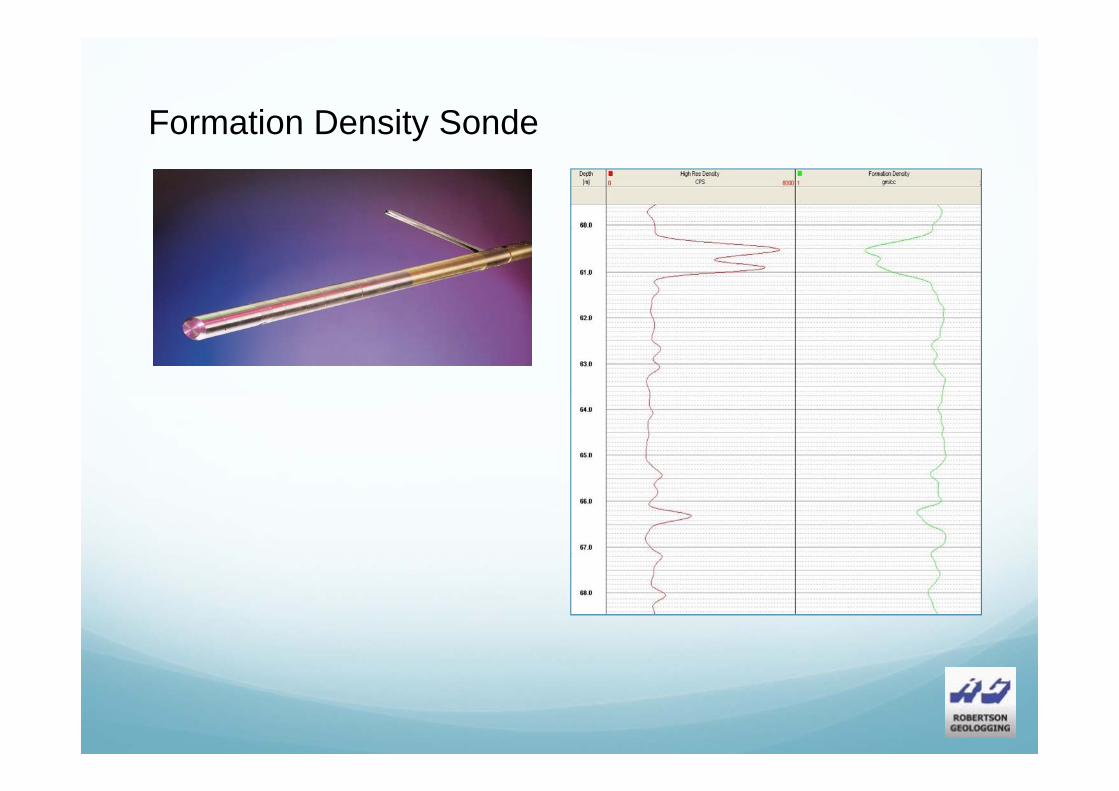
Formation Density Sonde
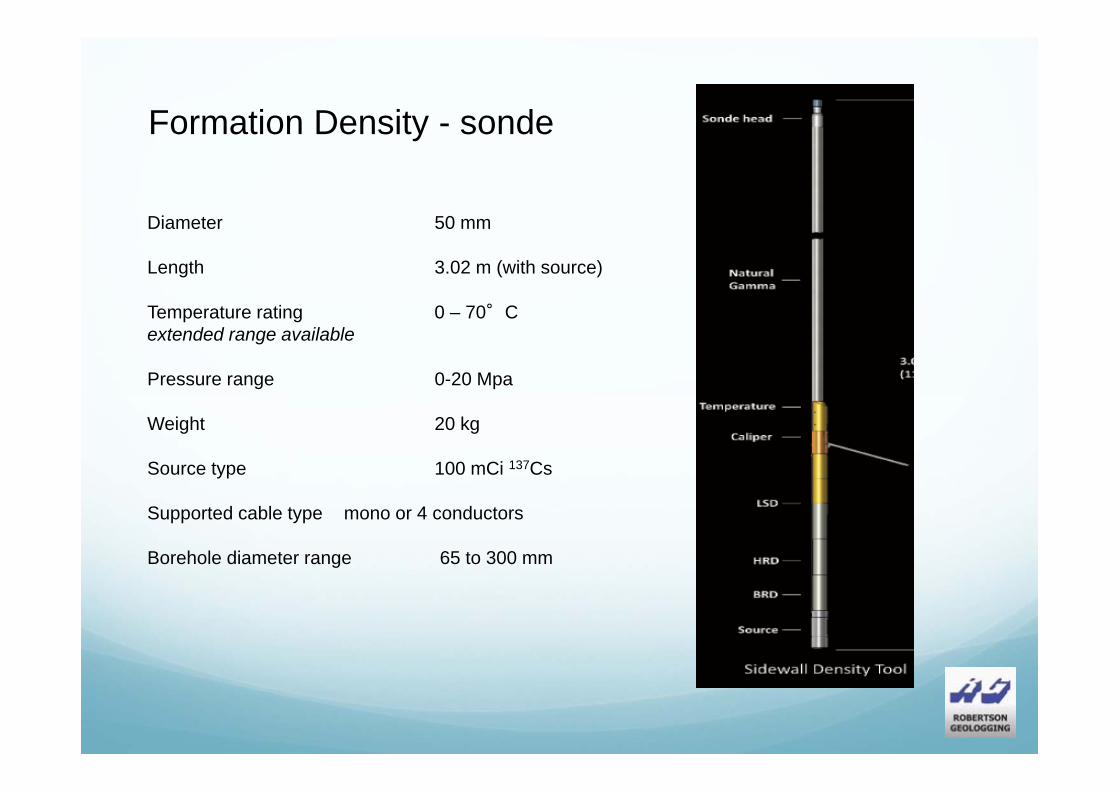
Formation Density - sonde
Diameter 50 mm
Length 3.02 m (with source)
Temperature rating 0 – 70°C extended range available
Pressure range 0-20 Mpa
Weight 20 kg
Source type 100 mCi 137Cs
Supported cable type mono or 4 conductors
Borehole diameter range 65 to 300 mm
Formation Density - applications
The in-situ measurement of electron density
Conversion of data to calculate formation bulk density & Poisons ratio
Mineral studies (coal identification)
Porosity
Fracture identification (comparison with PS Logger)
Identification of Lithological layers
Support to acoustic impedance sections and elastic moduli estimate after Sonic Log measurements

Formation Density - theory The sonde employs a radioactive source which ‘bombards’ the formation with gamma rays
The detectors measure the abundance of gamma rays
At a fixed distance from the source, the gamma count will be proportional to the formation density
The phenomenon is called Compton scattering. Gamma rays collide with electrons multiple times, gradually losing energy, until eventually they are absorbed. In denser rocks, counts are lower because most gamma rays are absorbed before they get to the detector
This process logs electron density and that is all. Whereas the geologist will measure density by establishing the weight and volume of a sample, the logger estimates the concentration of nucleons (protons and neutrons) via the electron count (one electron per nucleon pair). Denser rocks have more nucleons per volume
The relationship between electron density and bulk density is fairly constant for the major rock-forming elements like silicon, aluminium and magnesium. The Z/A ratio, electrons (and so protons)/total nucleons is about 0.5. So the conversion from electron density to bulk density is, theoretically, straightforward

Formation Density - theory
One detector very close to the source (28 cm apart), called “high resolution detector” (HRD)
One “long space detector” (LSD) bigger in size, 48 cm off whose use allows for compensation
Optional “bed resolution detector” (BRD), 14 cm from the source to resolve thin layers
The distance between the source and the detector affects the volume (depth) of investigation and the resulting cps (and density) readings
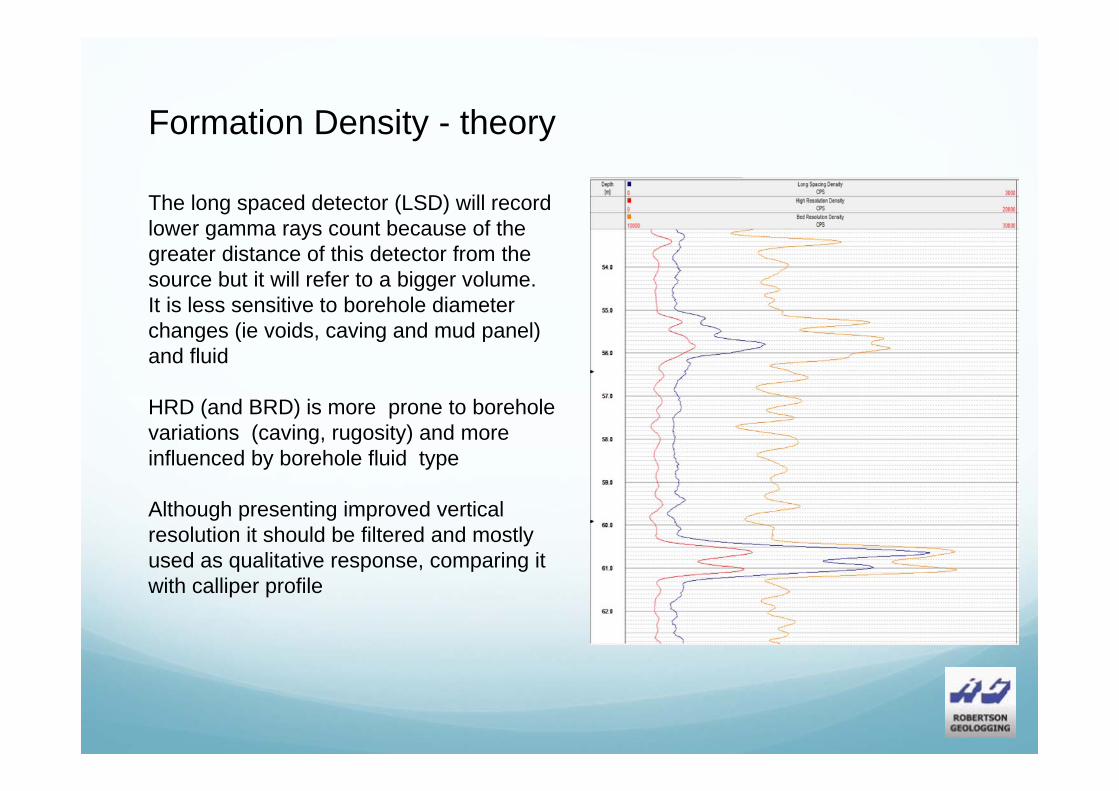
Formation Density - theory
The long spaced detector (LSD) will record lower gamma rays count because of the greater distance of this detector from the source but it will refer to a bigger volume.It is less sensitive to borehole diameter changes (ie voids, caving and mud panel) and fluid
HRD (and BRD) is more prone to borehole variations (caving, rugosity) and more influenced by borehole fluid type
Although presenting improved vertical resolution it should be filtered and mostly used as qualitative response, comparing it with calliper profile

Formation Density - theoryFactor affecting density readings:
Borehole diameter and borehole fluid density (especially for the HRD/BRD), even if the sonde is sidewall constructed and a user function is introduced to reduce borehole effect
Cavities/borehole wall roughness as well as air or light mud (< 1 g/cc) underestimate density while heavy drilling fluids overestimate the response
Deposits with very high Natural Gamma readings (Uranium ore) as introducing additional counts thus lowering final density calculation. This channel should be monitored
Certain minerals may lead to overestimate or underestimate of density.For example clays present a wide range of density and when intercalated with other lithologies amplify uncertainties
Gas saturated formation may lead to porosity overestimate while the Neutron Porosity would have lower readings

Formation Density - compensation
To achieve measurement precision in a range of borehole conditions, the logger mustemploy a logging system that provides reliable borehole compensation. That is the cruxof the issue, the difference between an average density sonde and a good one.Compensation includes the above
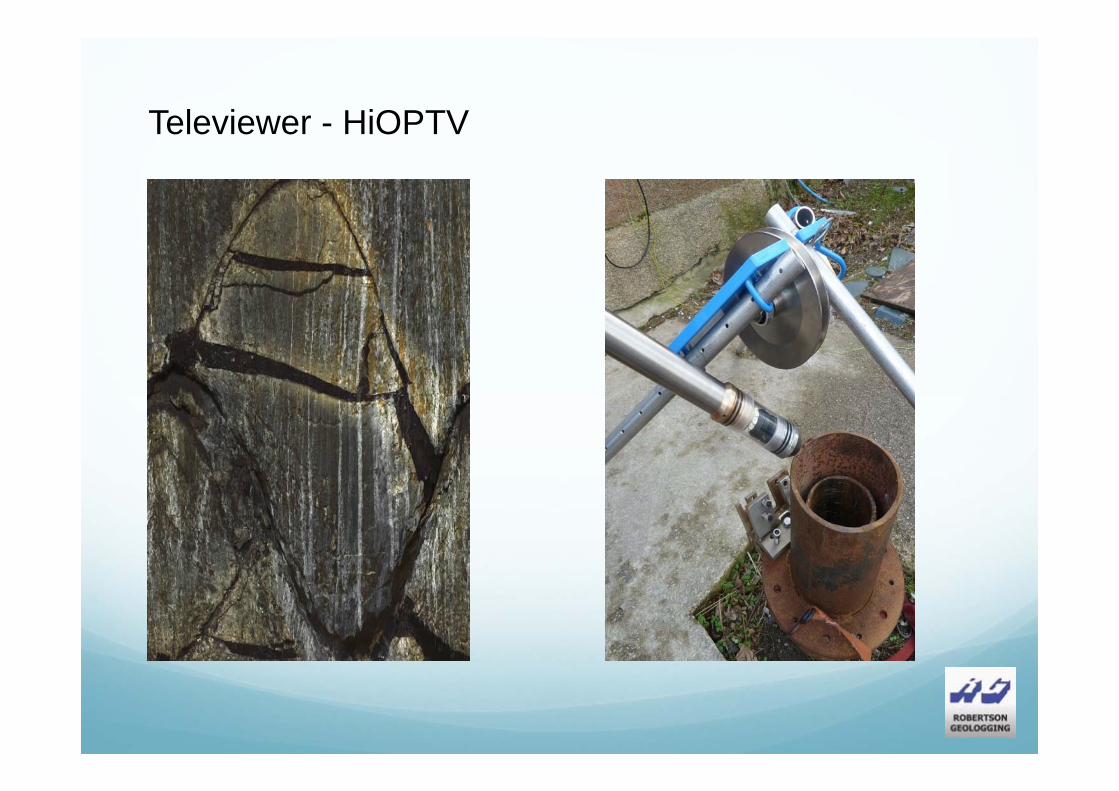
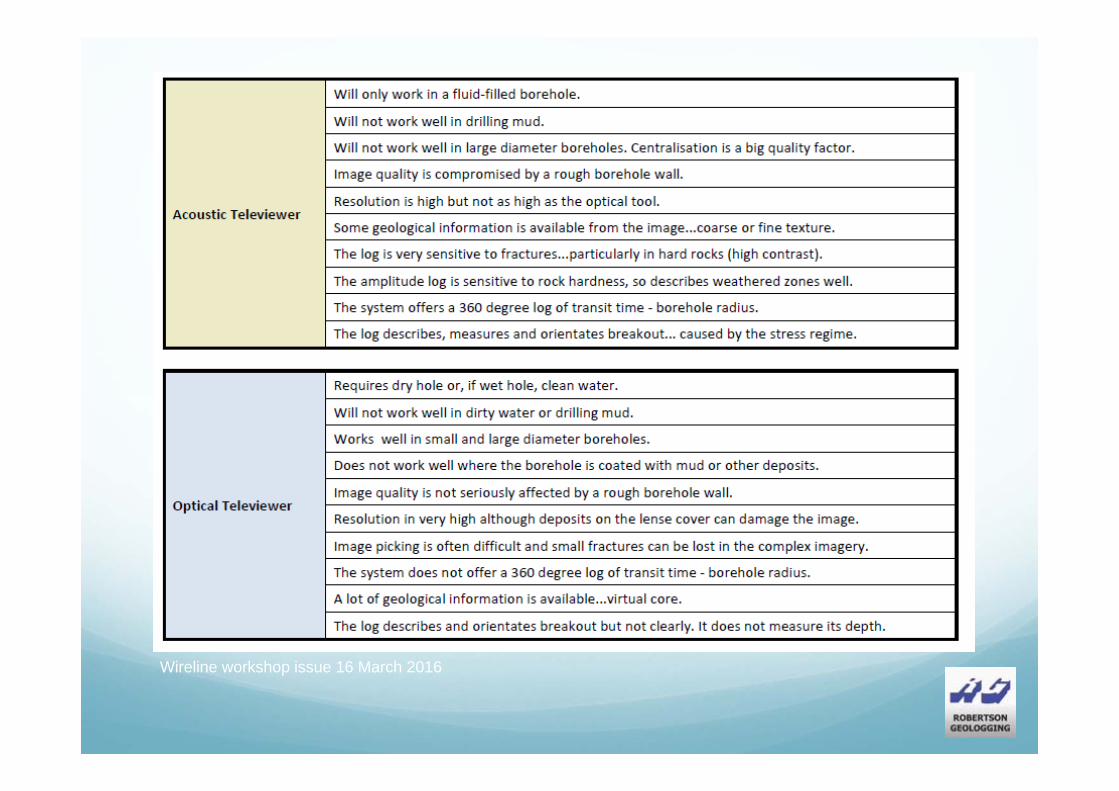
Televiewer - HiOPTV

HiOPTV - operations
Best results in clear water or air filled borehole
Thick/heavy muds and debris can obscure borehole wall images
Should allow 24-48 hours of settlement after drilling
Typically log at 2m/min, running slowly can cause the centralisers to stick and not move
fluently
If centralisation is not properly achieved, features & true orientation (azimuth and
inclination) cannot be assessed in post processing software (RGLDip or Wellcad)
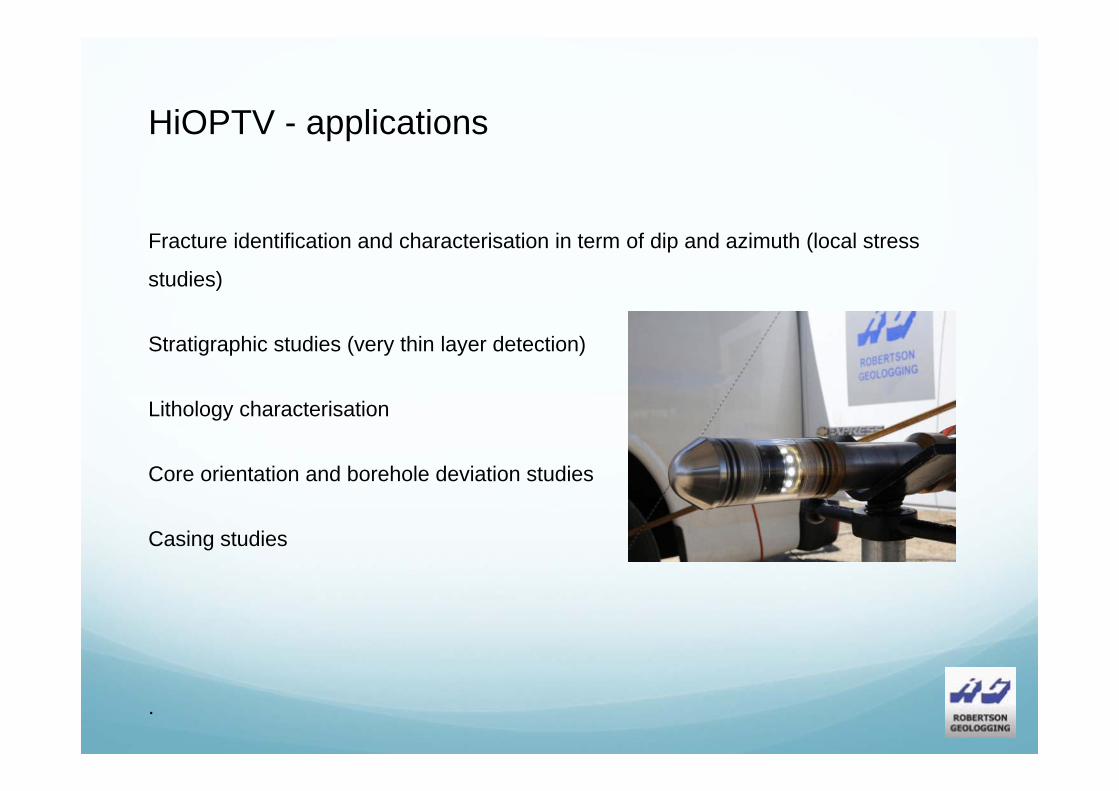
HiOPTV - applications
Fracture identification and characterisation in term of dip and azimuth (local stress
studies)
Stratigraphic studies (very thin layer detection)
Lithology characterisation
Core orientation and borehole deviation studies
Casing studies
.

HiOPTV - examples
Lithology discrimination(layers/bands & intrusions)
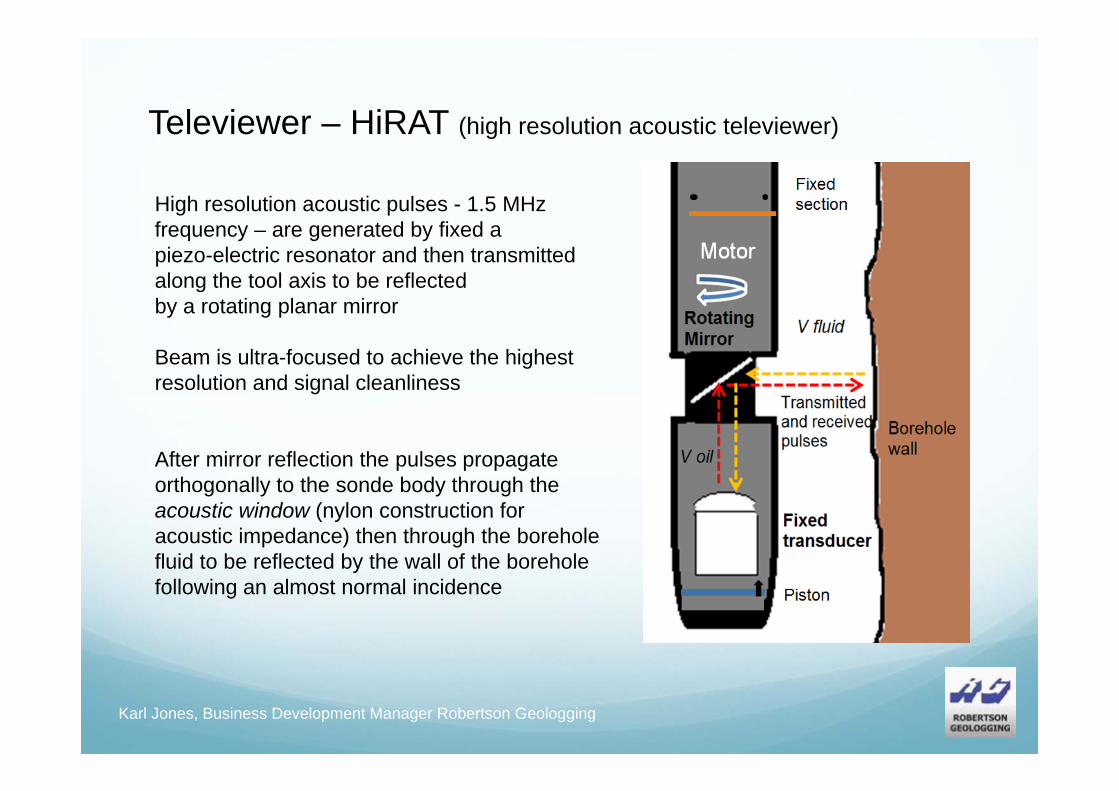
Televiewer – HiRAT (high resolution acoustic televiewer)
Karl Jones, Business Development Manager Robertson Geologging
High resolution acoustic pulses - 1.5 MHz frequency – are generated by fixed a piezo-electric resonator and then transmitted along the tool axis to be reflected by a rotating planar mirror
Beam is ultra-focused to achieve the highest resolution and signal cleanliness
After mirror reflection the pulses propagate orthogonally to the sonde body through the acoustic window (nylon construction for acoustic impedance) then through the borehole fluid to be reflected by the wall of the boreholefollowing an almost normal incidence

HiRAT - operations
)
.
Integration of HiRAT, OPTV and 3-arm calliper profiles

HiRAT – full borehole data despite poor core recovery
.

HiRAT – borehole deviation
.

HiRAT - interpretation
.
Stick-plot Arrow-Plot BH deviationNotes
Wireline workshop issue 16 March 2016
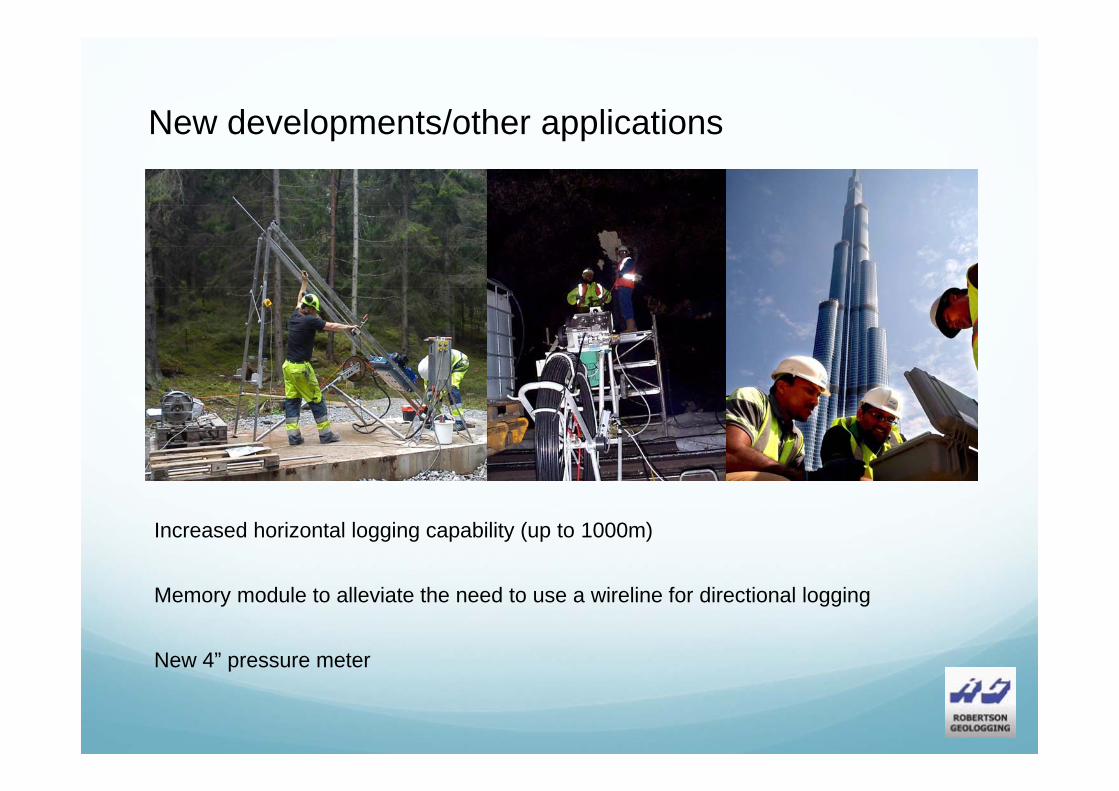
New developments/other applications
Increased horizontal logging capability (up to 1000m)
Memory module to alleviate the need to use a wireline for directional logging
New 4” pressure meter

Thank youSteve [email protected]+852 65033486
Karl Jones MScBusiness Development & Sales Manager Europe and [email protected]+44(0)771 482 5357
www.geologging.com