An Introduction to the National Income and Product Accounts
27
An Introduction to the National Income and Product Accounts Methodology P apers: U.S. National Income and Product Accounts U. S . DEP AR TMENT OF COMM ER CE C arl os M . G ut i err ez Secretary ECONOMICS AND STATISTICS ADMINISTRATION C ynt hi a A . G l as s man Under Secretary for Economic Affairs BUREAU OF ECONOMIC ANALYSIS J. Steven Landefeld Director R osemar y D . Mar cuss Deputy Director S ept ember 2007 www . bea. gov
Transcript of An Introduction to the National Income and Product Accounts

8/2/2019 An Introduction to the National Income and Product Accounts
http://slidepdf.com/reader/full/an-introduction-to-the-national-income-and-product-accounts 1/27
An Introduction to theNational Income and Product Accounts
Methodology Papers: U.S. National Income and Product Accounts
U.S. DEPARTMENT OF COMMERCECarlos M. Gut ierrez
Secretary
ECONOMICS AND STATISTICS ADMINISTRATIONCynthia A. Glassman
Under Secretary for Economic Affairs
BUREAU OF ECONOMIC ANALYSISJ. Steven Landefeld
Director
Rosemary D. MarcussDeputy Director
September 2007 www.bea.gov

8/2/2019 An Introduction to the National Income and Product Accounts
http://slidepdf.com/reader/full/an-introduction-to-the-national-income-and-product-accounts 2/27
Acknowledgments
Part I, “Overview of the NIPAs,” was prepared by Stephanie H. McCulla, an Economist in the NationalIncome and Wealth Division at the Bureau of Economic Analysis (BEA).
Part II, “Underlying Economic Accounts”; Part III, “Economic Accounts for Sectors”; and Part IV,“NIPA Summary Accounts”; were prepared by Charles Ian Mead, an Economist in the Office of theDirector at BEA.
Brent R. Moulton, Associate Director for National Economic Accounts at BEA, provided overallsupervision for the preparation of this project.
Preface
This paper provides a comprehensive explanation of the conceptual basis and framework of the U.S.national income and product accounts (NIPAs). It describes the structure and purpose of the U.S.economic accounts, discusses the relationship between business and financial accounting and nationaleconomic accounting, and presents a derivation of the seven NIPA summary accounts fromgeneralized production, income and outlay, and capital accounts for each sector of the economy.
This paper updates and replaces “An Introduction to National Economic Accounting” (MP1), whichwas published in March 1985.
Comments about this paper are invited. Please contact the BEA National Economic AccountsDirectorate, 1441 L St. NW, BE–6, Washington, DC 20230 or by e-mail at <[email protected]>.
i

8/2/2019 An Introduction to the National Income and Product Accounts
http://slidepdf.com/reader/full/an-introduction-to-the-national-income-and-product-accounts 3/27
An Introduction to the National Income and Product Accounts
THE national income and product accounts (NIPAs) produced by the Bureau of Economic Analysis (BEA)
have become a mainstay of modern macroeconomic analysis for the U.S. economy. In fact, the CommerceDepartment in 2000 named the NIPAs, and their marquee measure, gross domestic product (GDP), “its achieve-ment of the century.”1 Because these accounts provide a detailed picture of economic activity at a given time, aswell as a consistently defined series of measures over time, they are indispensable to researchers, forecasters, gov-ernment officials, academics, and investors who use them for a wide array of academic, public policy, and otherpurposes.
Given the importance of the NIPAs, users often seek a detailed explanation of the concepts that underlie them.The goal of this methodology paper is to present the conceptual basis and framework of the U.S. NIPAs.2 Specifi-cally, the paper demonstrates how the seven accounts that summarize the NIPAs are derived from conventionalaccounting statements—in particular, the balance sheet, income statements, and the statement of cash flow fa-miliar to business accounting. In deriving the summary accounts, the paper also illustrates how they reflect theactivity occurring within the entire economy.3
The rest of this paper is organized as follows:
I. Overview of the NIPAs: A look at what these accounts measure, a discussion of the larger system of national economic accounts into which the NIPAs fit, and a look at the key concepts underlying theNIPA estimates ............................................................................................................................................. Page 2
II. Underlying economic accounts: A look at the theoretical derivation of economic accounts for arepresentative business firm from familiar financial accounting statements ........................................... Page 6
III. Economic accounts for sectors: A discussion of how economic accounts are derived for each sec-tor of the economy—household, business, and government—from the theoretical economic accountsderived in section II .................................................................................................................................. Page 14
IV. NIPA summary accounts: A discussion of the derivation of the NIPA summary accounts from thetheoretical economic accounts for each sector ......................................................................................... Page 22
1. See “GDP: One of the Great Inventions of the 20th Century,” SURVEY OF CURRENT BUSINESS 80 (January 2000): 6–14.2. New users of the NIPAs may find it beneficial to first review “Measuring the Economy: A Primer on GDP and the National Income and Product
Accounts” on <www.bea.gov>.
3. Information on the data and estimating methods underlying the NIPAs is available in component methodologies available on BEA’s Web site at<www.bea.gov>.
1

8/2/2019 An Introduction to the National Income and Product Accounts
http://slidepdf.com/reader/full/an-introduction-to-the-national-income-and-product-accounts 4/27
2
I. Overview of the NIPAs
THE NIPAs are a set of economic accounts that
provide detailed measures of the value and com-position of national output and the incomes generatedin the production of that output. Essentially, the NIPAsprovide a detailed snapshot of the myriad transactionsthat make up the economy—buying and selling goodsand services, hiring of labor, investing, renting prop-erty, paying taxes, and the like. More specifically, theseven summary accounts of the NIPAs simplify boththe transactors and transactions in the economy. Thetransactors of the domestic economy are grouped intothree distinct groups, or sectors—persons, businesses,and government; a fourth sector for the rest of the
world is added to cover transactions between the Na-tion and foreigners. The seven summary accounts of the NIPAs show the contribution of each sector to theoutput of the economy, their income and outlays, andtheir saving and investment.
The bestknown NIPA measure is GDP, which is de-fined as the market value of the goods and servicesproduced by labor and property located in the UnitedStates. The NIPAs calculate GDP as the sum of familiarfinal expenditure components: Personal consumptionexpenditures, private investment, government spend-ing (consumption and investment) and net exports.
However, GDP is just one of many economic measurespresented in the NIPAs, which include seven summary accounts and nearly 300 tables of supporting data.
National Economic Accounts SystemThe NIPAs are part of an integrated system of nationaleconomic accounts that also includes the industry ac-counts and the flow of funds accounts. BEA’s industry accounts consist of the inputoutput (IO) accounts,which trace the flow of goods and services among in-dustries in the production process and which show thevalue added by each industry and the detailed com-modity composition of national output, and the GDPby industry accounts, which measure the contributionof each private industry and of government to GDP. 4
4. See U.S. Bureau of Economic Analysis, “Concepts and Methods of theU.S. InputOutput Accounts,” September 2006, at <www.bea.gov/bea/mp.htm>; and see Brian C. Moyer, Mark A. Planting, Mahnaz FahimNader, and Sherlene K.S. Lum, “Preview of the Comprehensive Revision of the Annual Industry Accounts: Integrating the Annual InputOutputAccounts and the GrossDomesticProductbyIndustry Accounts, SURVEY
84 (March 2004): 38–51.
The Federal Reserve Board’s flow of funds accounts
record the value of tangible and financial assets ac-quired and the value of liabilities incurred throughoutthe U.S. economy, and the sources of the funds used toacquire the assets.5
In addition, BEA prepares two other sets of U.S.economic accounts: The international accounts, whichconsist of the international transactions (balance of payments) accounts and the international investmentposition accounts; and the regional accounts, whichconsist of the estimates of GDP by state, of state per-sonal income, and of local area personal income. Fi-nally, the Bureau of Labor Statistics prepares estimates
of productivity for the U.S. economy (which are par-tially based on estimates of GDP). Altogether, the sys-tem of U.S. economic accounts presents a coherent,comprehensive, and consistent picture of U.S. eco-nomic activity.
An internationally accepted conceptual frameworkfor these accounts is found in the System of NationalAccounts 1993 (SNA). The SNA provides a set of guidelines for national statistical offices compiling na-tional economic accounts. Along with national ac-countants from many countries, BEA actively participated in developing these guidelines.
Many of the major improvements made to theNIPAs in recent years are consistent with the guidelinesprovided by the SNA. These include the adoption of chaintype quantity and price indexes, the capitaliza-tion of software, and the recognition of the implicitservices provided by commercial banks. BEA is cur-rently participating in the international effort to up-date these guidelines to take account of changes in theeconomic environment.6
The remainder of this section discusses the conceptsunderlying the NIPAs.
5. See U.S. Board of Governors of the Federal Reserve System, Guide to the Flow of Funds Accounts, Board of Governors, Washington, D.C., 2006; andsee Albert M. Teplin, “The U.S. Flow of Funds Accounts and Their Uses,”Federal Reserve Bulletin (July 2001): 431–441.
6. See Commission of the European Communities, International Mone-tary Fund, Organization for Economic Cooperation and Development,United Nations, and the World Bank, System of National Accounts 1993(Brussels/Luxembourg, New York, Paris, and Washington, DC, 1993). Formore on the SNA and the relationship between it and the NIPAs, seeCharles Ian Mead, Karin E. Moses, and Brent R. Moulton, “The NIPAs andthe System of National Accounts,” SURVEY 84 (December 2004): 17–32.

8/2/2019 An Introduction to the National Income and Product Accounts
http://slidepdf.com/reader/full/an-introduction-to-the-national-income-and-product-accounts 5/27
3Methodology Paper 1
Estimating Concepts and ConventionsProduction boundary. One of the fundamental ques-tions that must be addressed in preparing nationaleconomic accounts is how to define the productionboundary—that is, what parts of the myriad humanactivities are to be included in or excluded from the
measure of the economy’s production. According tothe SNA, “Economic production may be defined as anactivity carried out under the control and responsibil-ity of an institutional unit that uses inputs of labor,capital, and goods and services to produce outputs of goods or services. There must be an institutional unitthat assumes responsibility for the process and ownsany goods produced as outputs or is entitled to bepaid, or otherwise compensated, for the servicesprovided.”7
Under this definition, certain natural processes may be included in or excluded from production, depend-
ing upon whether they are under the ownership orcontrol of an entity in the economy. For example, thegrowth of trees in an uncultivated forest is not in-cluded in production, but the harvesting of the treesfrom that forest is included.
The general definition of the production boundary may then be restricted by functional considerations. Inthe SNA (and in the U.S. accounts), certain householdactivities—such as housework, doityourself projects,and care of family members—are excluded, partly be-cause by nature these activities tend to be selfcon-tained and have limited impact on the rest of the
economy and because their inclusion could diminishthe usefulness of the accounts for longstanding ana-lytical purposes, such as business cycle analysis.8
In the NIPAs, the production boundary is furtherrestricted by practical considerations about whetherthe productive activity can be accurately valued ormeasured. For example, illegal activities, such as gam-bling and prostitution in some states, should in princi-ple be included in measures of production. However,these activities are excluded from the U.S. accounts be-cause they are by their very nature conducted out of sight of public scrutiny and so data are not available tomeasure them.
Finally, the production boundary is sometimes al-tered in order to accommodate innovations and struc-tural changes in the economy. For example, in the 1999comprehensive revision of the NIPAs, the value of U.S.production was increased by a change in definitionthat recognized business and government expendituresfor software as fixed investment rather than as inter-mediate purchases for business and as consumption
7.SNA 1993: paragraph 6.15.8. SNA 1993, paragraph 6.22.
expenditures for government.9
Market value. Goods and services in the NIPAs aremeasured at market prices; the value of output is equalto the market price of the good or service times thequantity of the good or service produced during the
year. In cases where market prices do not fully reflect
the value of a good or service or where services areprovided without an actual exchange, the value of thegood or service produced may be “imputed” from sim-ilar market transactions, as described below. In caseswhere there are no similar market transactions avail-able to impute a value, such as for goods or servicesthat are provided for free (or at insignificant prices) by government and nonprofit institutions, the marketprice is estimated based on the costs of production.
Imputations. Imputations are made to include inthe accounts the value of certain goods and servicesthat have no observable price and are often not associ-
ated with any observable transaction.10
For example, in their role as an intermediary be-tween borrowers and lenders, banks provide servicesfor which they do not charge an explicit price. How-ever, they are compensated for these services throughthe payment of higher interest rates by borrowers andthe receipt of lower interest rates by savers. To keepGDP invariant to whether or not a price is explicit orimplicit, the value of the service reflected by such ex-changes is imputed. Imputations are also made to keepGDP invariant to institutional arrangements. For ex-ample, unlike the provision for payment of housing
services to a renter by a landlord, the provision of housing services to an occupant that owns the housingdoes not involve an exchange between two or moretransactors. However, excluding the value of such ser-vices would cause variations in GDP that would de-pend only on variations in institutional arrangements.Therefore, the NIPAs include an imputation of thevalue of the services provided by owneroccupiedhousing.11
Final versus intermediate products. In the NIPAs,production represents unduplicated output. That is,GDP is designed to avoid double counting the valueof goods and services that are inputs into the produc-tion of other goods and services and that are notused in future production. These intermediate inputsare already reflected in the market value of the final
9. See Brent R. Moulton, Robert P. Parker, and Eugene P. Seskin, “Previewof the 1999 Comprehensive Revision of the National Income and ProductAccounts: Definitional and Classificational Changes,” SURVEY 79 (August1999): 8–11.
10. The SNA’s definition of an imputation is restricted to estimates of goods and services for which there is no observable exchange. Estimates forwhich there is an observable exchange but no observable price are referredto simply as estimates. See paragraphs 1.72–1.75 and 3.34 of the SNA.
11. The imputations in the NIPAs are presented in NIPA table 7.12.

8/2/2019 An Introduction to the National Income and Product Accounts
http://slidepdf.com/reader/full/an-introduction-to-the-national-income-and-product-accounts 6/27
4
product and are therefore excluded so that the measureof output is an unduplicated total. This is done usingeither the final expenditures approach or the valueadded approach, as described below.
Alternative approaches to measuring GDP. GDPmeasures output as the “market value of final goods
and services”—that is, as the sum of personal con-sumption expenditures, gross private domestic invest-ment, government consumption expenditures andgross investment, and net exports of goods and ser-vices. This is known as the “expenditures” or “productside” approach to measuring GDP. Another way tomeasure GDP is as the sum of the charges generated inthe production of the final goods and services. Becausethe market price of a final good or service reflects allthe charges associated with producing that good orservice, an “incomeside” measure of output, gross do-mestic income (GDI), can be derived as the sum of the
charges against production. Specifically, GDI is mea-sured as the sum of compensation of employees (thereturn to labor), taxes on production less subsidies (anonincome charge against production), net operatingsurplus (the net return to capital and entrepreneur-ship), and consumption of fixed capital (the using upof capital).
In theory, GDP and GDI are equal. In practice, thedifferences in the data used to derive the two measureslead to a discrepancy. This “statistical discrepancy” isdefined in the NIPAs as GDP less GDI. Because thesource data used to derive productside measures of output are based on more comprehensive surveys andcensuses, BEA considers them more reliable. There-fore, the statistical discrepancy appears as a compo-nent on the income side of the account.
Another way to measure output, used by BEA’s IOaccounts, is known as the “value added” approach. Inthese accounts, value added is defined as the differencebetween an industry’s total output—that is, its salesplus the change in inventories arising from produc-tion—and its intermediate purchases from other in-dustries. When value added is aggregated across allindustries in the economy, industry sales to and pur-chases from each other cancel out, and the remainder
is industry sales to final users, or GDP.12
Geographic coverage. In the NIPAs, and in the IOaccounts, the “U.S. estimates” cover the 50 states andthe District of Columbia. This treatment aligns GDPwith other U.S. statistics, such as population and em-ployment. Transactions between the United States andPuerto Rico, the U.S. territories, and the NorthernMariana Islands are included in the “restofthe-
12. In the IO accounts, “all industries” includes government industries(such as the U. S. Postal Service) and certain “special industries” (such asowneroccupied housing).
Methodology Paper 1
world” sector.13
In the NIPAs, a distinction is made between “do-mestic” measures and “national” measures. Domesticmeasures cover activities that take place within thegeographic borders of the United States. For example,GDP measures the value of goods and services pro-
duced by labor and capital located in the United States.In contrast, national measures cover activities that areperformed using resources supplied by U.S. residents.14
For example, gross national product (GNP) measuresthe value of goods and services produced by labor andcapital supplied by U.S. residents. Thus, for an assem-bly plant that is owned by a U.S. auto company and lo-cated in Great Britain, a portion of the value of itsoutput is included in GNP, but none of its output is in-cluded in GDP. And, for an assembly plant that isowned by a Japanese auto company and located in theUnited States, all of its output is included in GDP, but
only a portion of its output is included in GNP.Capital, investment, and depreciation. Economicproduction as defined above covers all final goods andservices produced during a given period. Nondurablegoods and services are generally consumed fully withina year. In contrast, durable goods—such as equipmentand software—and structures provide services overlonger periods of time. In the NIPAs, purchases of newdurable goods and structures by businesses or govern-ment for use in production are treated as gross fixedinvestment, as are purchases of new residential hous-ing. Purchases of durable goods by individuals, on theother hand, are treated as consumption in the NIPAs,rather than as investment, in accordance with theNIPA convention that nonmarket household produc-tion is outside the scope of GDP. 15
Both consumption and investment contribute toGDP in the NIPAs, but the distinction is importantbecause investment implies a stock of fixed assets,or capital, which in turn implies depreciation, or a
13. However, in BEA’s international transactions accounts, Puerto Rico,the U.S. territories, and the Northern Mariana Islands are treated as part of the United States. See NIPA table 4.3B, “Relation of Foreign Transactions inthe National Income and Product Accounts to the Corresponding Items inthe International Transactions Accounts.”
14. “U.S. residents” includes individuals, governments, business enter-prises, trusts, associations, nonprofit organizations, and similar institutionsthat have the center of their economic interest in the United States and thatreside or expect to reside in the United States for 1 year or more. (For exam-ple, business enterprises residing in the United States include U.S. affiliatesof foreign companies.) In addition, U.S. residents include all U.S. citizenswho reside outside the United States for less than 1 year and U.S. citizensresiding abroad for 1 year or more who meet one of the following criteria:Owners or employees of U.S. business enterprises who reside abroad to fur-ther the enterprises’ business and who intend to return within a reasonableperiod; U.S. Government civilian and military employees and members of their immediate families; and students who attend foreign educationalinstitutions.
15. Households are treated as businesses for the purpose of recording theownership of and investment in housing.
8/2/2019 An Introduction to the National Income and Product Accounts
http://slidepdf.com/reader/full/an-introduction-to-the-national-income-and-product-accounts 7/27
5Methodology Paper 1
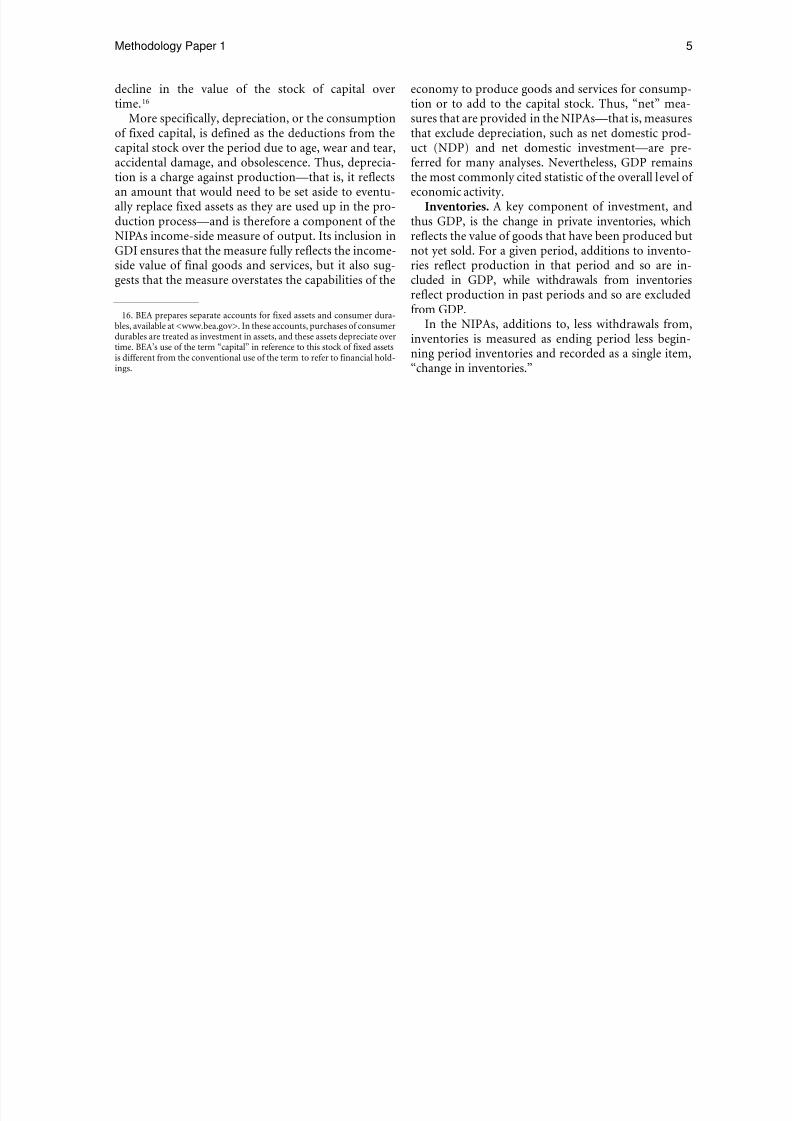
decline in the value of the stock of capital overtime.16
More specifically, depreciation, or the consumptionof fixed capital, is defined as the deductions from thecapital stock over the period due to age, wear and tear,accidental damage, and obsolescence. Thus, deprecia-
tion is a charge against production—that is, it reflectsan amount that would need to be set aside to eventu-ally replace fixed assets as they are used up in the pro-duction process—and is therefore a component of theNIPAs incomeside measure of output. Its inclusion inGDI ensures that the measure fully reflects the incomeside value of final goods and services, but it also sug-gests that the measure overstates the capabilities of the
16. BEA prepares separate accounts for fixed assets and consumer dura-bles, available at <www.bea.gov>. In these accounts, purchases of consumerdurables are treated as investment in assets, and these assets depreciate overtime. BEA’s use of the term “capital” in reference to this stock of fixed assets
is different from the conventional use of the term to refer to financial hold-ings.
economy to produce goods and services for consump-tion or to add to the capital stock. Thus, “net” mea-sures that are provided in the NIPAs—that is, measuresthat exclude depreciation, such as net domestic prod-uct (NDP) and net domestic investment—are pre-ferred for many analyses. Nevertheless, GDP remains
the most commonly cited statistic of the overall level of economic activity.
Inventories. A key component of investment, andthus GDP, is the change in private inventories, whichreflects the value of goods that have been produced butnot yet sold. For a given period, additions to invento-ries reflect production in that period and so are in-cluded in GDP, while withdrawals from inventoriesreflect production in past periods and so are excludedfrom GDP.
In the NIPAs, additions to, less withdrawals from,inventories is measured as ending period less begin-
ning period inventories and recorded as a single item,“change in inventories.”

8/2/2019 An Introduction to the National Income and Product Accounts
http://slidepdf.com/reader/full/an-introduction-to-the-national-income-and-product-accounts 8/27
6
II. Underlying Economic Accounts
MANY of the important concepts that are used in
the NIPAs can be understood by relating a theo-retical set of economic accounts for a business firm toits financial statements. This section will briefly reviewfundamental accounting principles and common fi-nancial statements before illustrating how they relateto the NIPAs.
Fundamental Accounting PrinciplesThe formal practice of financial accounting has a muchlonger history than that of national economic account-ing.17 Thus, it is no surprise that national economic ac-counting is based on many of the same fundamental
principles that were first adopted in financial account-ing. However, differences between the two fields stillexist as each serves a separate purpose.
The purpose of financial accounting is to provide aset of financial statements that convey information onthe financial position, the results of operations, andthe manner in which cash flows through an individualbusiness. The financial position includes the resourcesavailable to a business (assets), the claims of creditorson these resources (liabilities), and the claims of busi-ness owners on these resources (owners’ equity). Theresults of operations include the income received by a
business (revenue), the costs incurred while earningthis income (expenses), and the profits earned by abusiness (net earnings).
One of the most fundamental principles used inboth financial and national economic accounting isdoubleentry bookkeeping. In doubleentry book-keeping, activities that affect the resources available toa business are reflected at least twice in a general led-ger: At least once on the right side as a source of fi-nancing (credit) and at least once on the left side as ause of financing (debit). The advantage of doubleen-try bookkeeping is that it provides a means to validatethe values entered into a general ledger because thesum of entries on each side should equal.
Doubleentry bookkeeping in national economicaccounting has a somewhat different role than doubleentry bookkeeping in financial accounting. The na-tional accounts are designed to measure all transac-
17. Many of the formal accounting practices used in financial account-ing, such as doubleentry bookkeeping, can be traced all the way back tomerchants and bankers in Florence, Venice, and Genoa during the thir-teenth and fifteenth centuries. In contrast, the formal accounting frame-work for national accounting was introduced by Richard Stone in 1940 (SeeAngus Deaton, “Stone, Richard John Nicholas” in J. Eatwell, M. Milgateand P. Newman, eds., The New Palgrave: A Dictionary of Economics, Mac-millian: London, 1987, vol. 4: 509–512).
tions in the economy from the perspective of both
participants in a transaction—for example, both thebuyer and the seller. Each transaction is recorded as apayment by one sector and a receipt by another—forexample, corporate income tax is a payment by a cor-poration and a receipt of the government.18 This sys-tem not only provides a means to validate the valuesentered into a set of national economic accounts, but italso provides alternative ways to calculate a measurewhen a complete set of information is not available forone of the sectors that is involved in a set of exchanges.
Another fundamental principle used in both finan-cial and national economic accounting is that related
revenues and expenses must be recorded during thesame accounting period. To ensure this, the accrual ac-counting method is usually used. This method recordsthe sale of goods or assets when ownership passes, thesale of services when they are provided, the generationof output when goods and services are produced, andthe consumption of intermediate goods and serviceswhen they are used. The accrual accounting methoddiffers from the cash accounting method, whichrecords revenues when cash is actually received and ex-penses when cash is actually paid.
In financial accounting, assets and depreciation are
commonly (but not invariably) valued at historicalcosts, which are the actual prices that were paid in theiracquisition. Historical costs are commonly used in fi-nancial accounting because they are regarded as rela-tively objective, since they are supported by verifiablehistorical transactions, and relatively conservative,since they do not include holding gains (or losses) thathave not been realized.19
In national economic accounting, assets and depre-ciation are valued at current costs, which are the actualor estimated market prices that prevail at the time as-sets are valued or depreciation occurs. Current costsare used in national economic accounting because they serve as the best practical approximation to the eco-nomic notion of opportunity costs. Opportunity costs
18. A fully articulated set of national accounts actually leads to a quadru-pleentry system. However, transactions are usually recorded only twice inthe national income and product accounts (NIPAs) because the changes inassets or liabilities that are associated with the changes in the revenues andexpenses are recorded in the Federal Reserve Board flow of funds accounts.
19. Additional detail on financial accounting practices can be found inmany of the standard textbooks on the subject, such as John J. Wild, Finan-cial Accounting: Information for Decisions (McGrawHill College, 2006) andas Jerry J. Weygandt, Donald K. Kieso, and Paul D. Kimmel, Financial Accounting: Tools for Decision Making, with Annual Report (John Wiley &Sons Inc., 2003).

8/2/2019 An Introduction to the National Income and Product Accounts
http://slidepdf.com/reader/full/an-introduction-to-the-national-income-and-product-accounts 9/27
7Methodology Paper 1
are the foregone benefits that could have been securedwith the next best alternative use of a resource, whichserves as one of the most fundamental concepts usedin economic analysis.
Common Financial StatementsThe two principal statements that summarize the ac-
tivities that are recorded in the general ledger of a busi-ness are the balance sheet and the income statement.Although the form of these statements often differsacross businesses, their purposes are the same. A bal-ance sheet shows the financial position of a business ata given point in time. An income statement shows theoperating results of a business during an accountingperiod between two balance sheets.
Two additional statements are usually required tosupplement the information provided on the balancesheet and income statement. The first, a statement of cash flows, shows how cash streams through a business
during an accounting period. Its purpose is to allowfor an assessment of a business’ ability to settle liabili-ties, pay dividends, and respond favorably to unantici-pated events. The second, a statement of owners’equity, shows how the claims of owners on the assets of a business change during an accounting period. Itspurpose is to show how the change in retained earn-ings between two consecutive balance sheets is relatedto net earnings. Sometimes this demonstration occursat the end of an income statement, in which case, theresult is presented as a single statement of income andretained earnings.
The rest of this section introduces the financialstatements of a representative business firm and thenderives the set of economic accounts that underlie theNIPAs.
Balance sheet
The basic identity underlying the balance sheet is thatthe business firm’s assets less its liabilities are equal toowners’ equity—that is,
Assets – liabilities = owners’ equity.
Since owners’ equity is conceptually the residualclaim of the corporation’s owners on assets once all lia-
bilities have been met, its value is simply equal to thevalue of the corporation’s assets less the value of its lia-bilities. Thus, if total assets increase without an offset-ting increase in total liabilities, then owners’ equity rises; if total assets decrease without an offsetting de-crease in total liabilities, then owners’ equity falls.
On the balance sheet, there are several categoriesof assets, liabilities, and owners’ equity, which iscalled stockholders’ equity in the case of a corporation(table 1).
Current assets. These are resources that are usually converted into cash or used within the period of a
year.20 They include cash and cash equivalents, ac-counts receivable, inventories, and shortterm invest-ments. Cash and cash equivalents include coins,currency, and undeposited checks; money orders; de-mand deposits at banks; and certain highly liquid in-vestments. Accounts receivable are shortterm creditsthat have been extended to customers to cover goods
and services that the corporation has already providedbut for which payment has not yet been received.These credits are included on the balance sheet becauserelated revenue and expenses need to be reflected dur-ing the same accounting period. Shortterm invest-ments consist of other types of assets, such as securitiesof other corporations, that are expected to be con-verted back into cash within the time period that isused to define current assets.
Fixed assets. These consist of assets that are used ina productive capacity, have physical substance, are rela-tively longlived, and provide future benefits that are
readily measurable. They mainly consist of plant,equipment, and land, and they are usually valued athistorical costs less accumulated depreciation.
Long-term investments. These consist of financialassets, such as securities of other corporations, that areexpected to be converted into cash or used after the pe-riod of time that is used to measure current assets.
Current liabilities. These consist of obligations thatare either due upon demand or expected to be duewithin the same period of time that is used to de-fine current assets. Current liabilities include ac-counts payable and shortterm liabilities, such as theprincipal that must be paid during the current periodon longterm debts. Accounts payable are shortterm
20. The period of time that is used to define current assets is either theperiod of a year or an operating cycle, whichever is longer. An operatingcycle is the average period of time between the initial purchase of interme-diate goods and services and the collection of accounts receivable for therelated sales of products.
Table 1. Balance Sheet, December 31, 20__(In thousands)
AssetsCurrent assets:
Cash and cash equivalents................................................................................Accounts receivable...........................................................................................Inventories .........................................................................................................Short-term assets ..............................................................................................
280300
1010
Total current assets .....................................................................................
Fixed assets...................................................................................................Long-term investments ..................................................................................
600
1,390190
Total assets .............................................................................................. 2,180
Liabilities and stockholders’ equityCurrent liabilities:
Accounts payable...............................................................................................Short-term liabilities...........................................................................................
20070
Total current liabilities.................................................................................
Long-term liabilities........................................................................................
Stockholders’ equity:Capital stock ......................................................................................................Retained earnings . ............................................................................................
270
310
2601,340
Total stockholders’ equity ...............................................................................
Total liabilities and stockholders’ equity ...............................................
1,600
2,180

8/2/2019 An Introduction to the National Income and Product Accounts
http://slidepdf.com/reader/full/an-introduction-to-the-national-income-and-product-accounts 10/27
8 Methodology Paper 1
debts that have been assumed by the business forgoods and services already received but for which pay-ment has not yet been made.
Long-term liabilities. These consist of longtermobligations, such as note and bond payments, that arenot expected to be due until after the period of time
that is used to define current liabilities.Stockholders’ equity. The ownership stake of stock-
holders includes the amount shareholders paid fortheir stocks (capital stock) and the retained earnings of the corporation. Retained earnings are net earningsthat have been saved by the corporation for future useor investment.
Income and retained earnings
The basic identity underlying the statement of incomeand retained earnings is that the business firm’s netearnings are equal to its revenue less its expenses—that
is,
Net earnings = revenue – expenses.
However, the statement does not derive net earningsby subtracting all expenses from all revenue in a singlestep. Rather, it derives net income through a series of steps to provide a useful set of intermediate incomemeasures to investors and creditors.
Gross profits. This measure is derived by subtract-ing the costs of goods and services sold from sales,which are measured net of discounts and returns (table2). Although various accounting conventions may beused to record the costs of goods and services sold, thepurpose of this measure is to account for the costs thatcan be directly linked to the production of goods andservices.21 These expenses include purchases of inter-mediate goods and services, labor costs of production
21. An accurate determination of the costs that can be directly linked tothe production of goods and services is one of the more difficult tasks infinancial accounting. As a result, many corporations simply rely on fixedratios to allocate a certain percentage of expenses to this category.
Table 2. Statement of Income and Retained Earnings,
For Year Ending December 31, 20__ (In thousands)
Sales, net of discounts and returns ........................................................................Costs of goods a nd services sold ..........................................................................
Gross profits...................................................................................................Operating expenses ...............................................................................................
Operating income...........................................................................................Other income..........................................................................................................
2,630(1,770)
860(460)
40010
Net earnings before interest and taxes ..........................................................Interest receipts......................................................................................................Interest payments...................................................................................................
41010
(20)
Net ear nings before taxes ..............................................................................Income taxes ..........................................................................................................
400(150)
Net ear nings after taxes .................................................................................Dividends paid........................................................................................................
Additions to retained ear nings .......................................................................
250(110)
140
workers, depreciation of plants and equipment used inproduction, and changes in inventories (beginningof-period less endofperiod).
Operating income. This measure is derived by sub-tracting operating expenses and depreciation fromgross profits. Operating expenses consist of the costs
that are associated with the general operations of thecorporation but cannot be directly linked to the pro-duction of goods and services. These expenses includelabor costs of administrative staff, property taxes, de-preciation of office buildings and equipment, inspec-tion fees, charitable contributions, and royalty payments.
Other income. This consists of income that is re-ceived from activities that are not associated with nor-mal business activities, such as gains (net of losses) onsales of securities and fixed assets.
Net earnings before interest and taxes. This mea-
sure is derived by adding other income to operating in-come.Net earnings after taxes. This measure is derived by
adding interest receipts, subtracting interest payments,and then subtracting income taxes from net earningsbefore interest and taxes.
Additions to retained earnings. This measure is de-rived by subtracting dividends paid to shareholdersfrom net earnings after taxes.
Cash flows
The statement of cash flows begins by separately deriv-ing the net cash flows associated with the operating,investing, and financial activities of the corporation(table 3). Afterwards, these three measures aresummed to arrive at the net increase in cash.
Table 3. Statement of Cash Flows,
For Year Ending December 31, 20__ (In thousands)
Cash flows from operating activities:Net earnings after taxes.....................................................................................Adjustments to reconcile net earnings after taxes to cash ................................
provided by operating activities:
250
Depreciation of plant and equipment .............................................................Changes in assets and liabilities:
170
Increase in current assets.......................................................................... (30)Decrease in current liabilities..................................................................... 10
Net cash provided by operating activities ..............................................Cash flows from investing activities:
400
Sales of fixed assets .......................................................................................... 10Sales of securities.............................................................................................. 0Purchases of fixed assets .................................................................................. (100)Purchases of securities...................................................................................... (30)
Net cash used in investment activities................................................... (120)
Cash flows from financing activities:Issues of bonds.................................................................................................. 40Issues of capital stock........................................................................................ 50Retirements of bonds......................................................................................... (120)Dividend payments ............................................................................................ (110)
Net cash used in financing activities...................................................... (140)
Net increase in cash .............................................................................................. 140
Cash and cash equivalents at beginning of year ................................................... 140Cash and cash equivalents at end of year............................................................. 280
NOTE. Negative numbers in a running total are shown in parentheses. NOTE. Negative numbers in a running total are shown in parentheses.

8/2/2019 An Introduction to the National Income and Product Accounts
http://slidepdf.com/reader/full/an-introduction-to-the-national-income-and-product-accounts 11/27
9Methodology Paper 1
Net cash flows provided by operating activities.This measure is indirectly derived by applying a seriesof adjustments to the accrualbased measure of netearnings after taxes to arrive at the cashbased measureof net cash flows.22 These adjustments include addingdepreciation, subtracting increases in current assets,
and adding decreases in current liabilities.Net cash flows used in investment activities. This
measure is directly derived by subtracting cash out-flows from cash inflows. Cash inflows in this section of the statement include sales of fixed assets, along withsales of securities that have been issued by other corpo-rations. Cash outflows in this section of the statementinclude purchases of fixed assets, along with purchasesof securities that have been issued by other corpora-tions.
Net cash flows used in financing activities. Thismeasure is directly derived by subtracting cash out-
flows from cash inflows. Cash inflows in this section of the statement include the issuance of bonds and secu-rities. Cash outflows in this section of the statement in-clude the retirement of bonds and dividends paid tostockholders.
Financial Statements, EconomicAccounts for the Business Sector,
and the NIPAsThe three financial statements discussed above are re-lated to four economic accounts that provide the
22. Business firms may also calculate net cash flows from operating activ-ities using a more direct method that lists major classes of gross receipts andgross expenditures. However, the indirect method presented in this paper ismore commonly used.
building blocks for the key measures of the businesssector in the NIPAs.
The first economic account, a production account,shows the contribution that is made by the businessfirm to GDP. The second account, an enterprise in-come account, shows how net income from produc-
tion and income from the ownership of financialassets is used to fund the payment of interest to thebusiness firm’s creditors. The third account, an in-come and outlay account, shows how the businessincome that remains after interest and certain types of transfer payments have been made is either retainedby the business firm or used to pay income taxes tothe government or dividends to the business firm’sowners. The fourth account, a capital account, showshow the retained income of the business is used to pur-chase fixed assets.
All four of these economic accounts can be concep-
tually derived from the information in the businessfirm’s financial statements. In particular, the first threeof these accounts are directly related to the statementof income and retained earnings. The last of these ac-counts is directly related to the portion of the state-ment of cash flows that deals with fixed assets anddepreciation.
The derivation of each economic account from thefinancial statements of the business firm can be easily seen by first creating a ledger that organizes transac-tions into measures that appear in each of the respec-tive accounts (table 4). Afterwards, nationalaccounting identities are used to define the accounts,and few of the items in the ledger are adjusted ormoved to the other side of the account to create the fi-nal measures.
Table 4. Detailed Ledger for Sources and Uses of Revenue, For year ending December 31, 20__(In thousands)
Uses Sources
Charges against revenue in the production account: Revenue in the production account:
Compensation of employees ............................................................................. 1,610 Sales, net of discounts 1 .................................................................................... 2,740
Wages and salaries ....................................................................................... 1,380
Supplements to wages and salaries.............................................................. 230
Purchases of intermediate goods and services................................................. 400Changes in inventories ...................................................................................... 10
Taxes on production and imports 1 .................................................................... 160
Depreciation ...................................................................................................... 170
Charges against revenue in the enterprise income account: Revenue in the enterprise income account:
Interest and miscellaneous payments ............................................................... 20 Interest receipts ................................................................................................. 10
Current transfer payments (net)......................................................................... 10 Dividend receipts ............................................................................................... 20
Charges against revenue in the income and outlay account:
Taxes on corporate income................................................................................ 150
Dividend payments ............................................................................................ 110
Undistributed corporate profits 2 ........................................................................ 130
Charges against revenue .................................................................................... 2,770 Revenue ................................................................................................................ 2,770
1. This item differs from “sales, net of discounts” in table 2 because it includes sales and excise taxes.2. This item differs from retained earnings in table 2 because net capital transfers and gains (net of losses) on the sale of fixed assets and securities are excluded from both sides of the table.
8/2/2019 An Introduction to the National Income and Product Accounts
http://slidepdf.com/reader/full/an-introduction-to-the-national-income-and-product-accounts 12/27
10 Methodology Paper 1
Production account for a business firm
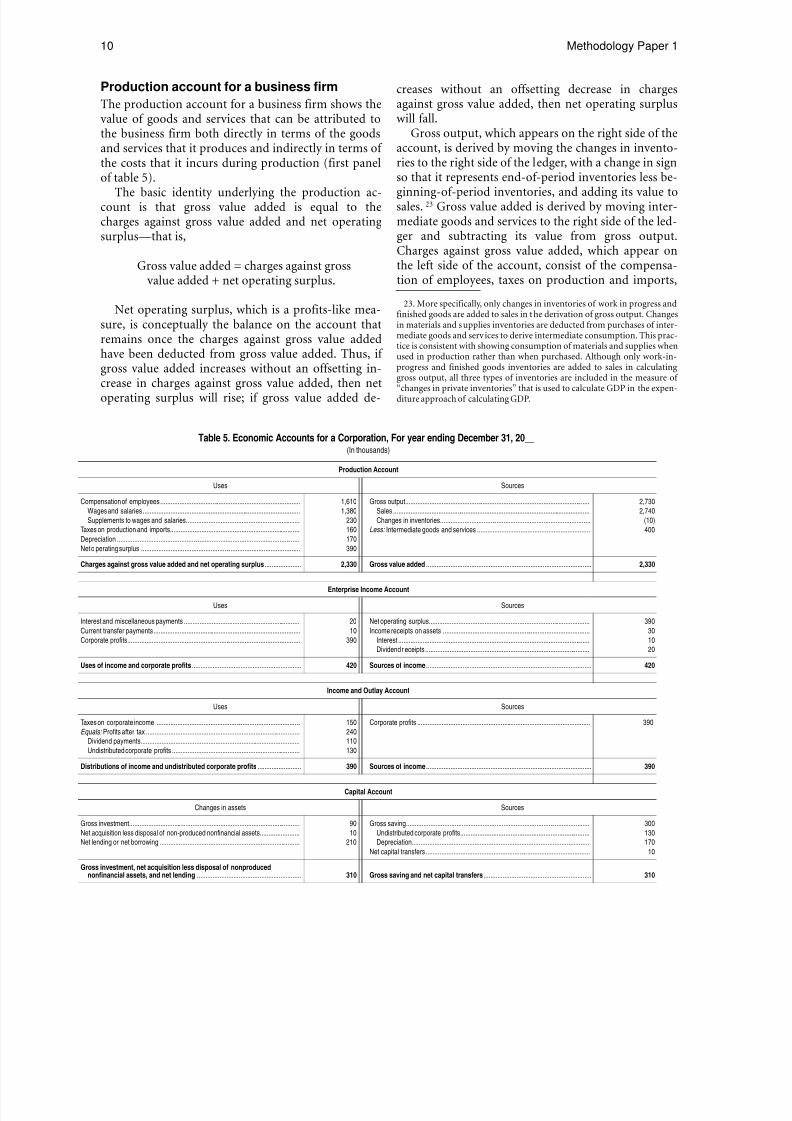
The production account for a business firm shows thevalue of goods and services that can be attributed tothe business firm both directly in terms of the goodsand services that it produces and indirectly in terms of the costs that it incurs during production (first panel
of table 5).The basic identity underlying the production ac-
count is that gross value added is equal to thecharges against gross value added and net operatingsurplus—that is,
Gross value added = charges against grossvalue added + net operating surplus.
Net operating surplus, which is a profitslike mea-sure, is conceptually the balance on the account thatremains once the charges against gross value added
have been deducted from gross value added. Thus, if gross value added increases without an offsetting in-crease in charges against gross value added, then netoperating surplus will rise; if gross value added de-
creases without an offsetting decrease in chargesagainst gross value added, then net operating surpluswill fall.
Gross output, which appears on the right side of theaccount, is derived by moving the changes in invento-ries to the right side of the ledger, with a change in sign
so that it represents endofperiod inventories less be-ginningofperiod inventories, and adding its value tosales. 23 Gross value added is derived by moving inter-mediate goods and services to the right side of the led-ger and subtracting its value from gross output.Charges against gross value added, which appear onthe left side of the account, consist of the compensa-tion of employees, taxes on production and imports,
23. More specifically, only changes in inventories of work in progress andfinished goods are added to sales in the derivation of gross output. Changesin materials and supplies inventories are deducted from purchases of inter-mediate goods and services to derive intermediate consumption. This prac-tice is consistent with showing consumption of materials and supplies when
used in production rather than when purchased. Although only workin-progress and finished goods inventories are added to sales in calculatinggross output, all three types of inventories are included in the measure of “changes in private inventories” that is used to calculate GDP in the expen-diture approach of calculating GDP.
Table 5. Economic Accounts for a Corporation, For year ending December 31, 20__(In thousands)
Production Account
Uses Sources
Compensation of employees .................................................................................
Wages and salaries ...........................................................................................
Supplements to wages and salaries..................................................................
Taxes on production and imports...........................................................................
Depreciation ..........................................................................................................Net o perating surplus ............................................................................................
1,610
1,380
230
160
170390
Gross output...........................................................................................................
Sales ..................................................................................................................
Changes in inventories.......................................................................................
Less: Intermediate goods and services .................................................................
2,730
2,740
(10)
400
Charges against gross value added and net operating surplus ..................... 2,330 Gross value added ............................................................................................... 2,330
Enterprise Income Account
Uses Sources
Interest and miscellaneous payments ...................................................................
Current transfer payments .....................................................................................
Corporate profits....................................................................................................
20
10
390
Net operating surplus.............................................................................................
Income receipts on assets .....................................................................................
Interest ...............................................................................................................
Dividend r eceipts ...............................................................................................
390
30
10
20
Uses of income and corporate profits ............................................................... 420 Sources of income ............................................................................................... 420
Income and Outlay Account
Uses Sources
Taxes on corporate income ...................................................................................
Equals: Profits after tax .........................................................................................
Dividend payments ............................................................................................
Undistributed corporate profits ..........................................................................
150
240
110
130
Corporate profits .................................................................................................... 390
Distributions of income and undistributed corporate profits ......................... 390 Sources of income ............................................................................................... 390
Capital Account
Changes in assets Sources
Gross investment...................................................................................................
Net acquisition less disposal of non-produced nonfinancial assets.......................
Net lending or net borrowing .................................................................................
90
10
210
Gross saving ..........................................................................................................
Undistributed corporate profits...........................................................................
Depreciation.......................................................................................................
Net capital transfers ...............................................................................................
300
130
170
10
Gross investment, net acquisition less disposal of nonproducednonfinancial assets, and net lending ............................................................ 310 Gross saving and net capital transfers .............................................................. 310
8/2/2019 An Introduction to the National Income and Product Accounts
http://slidepdf.com/reader/full/an-introduction-to-the-national-income-and-product-accounts 13/27
11Methodology Paper 1
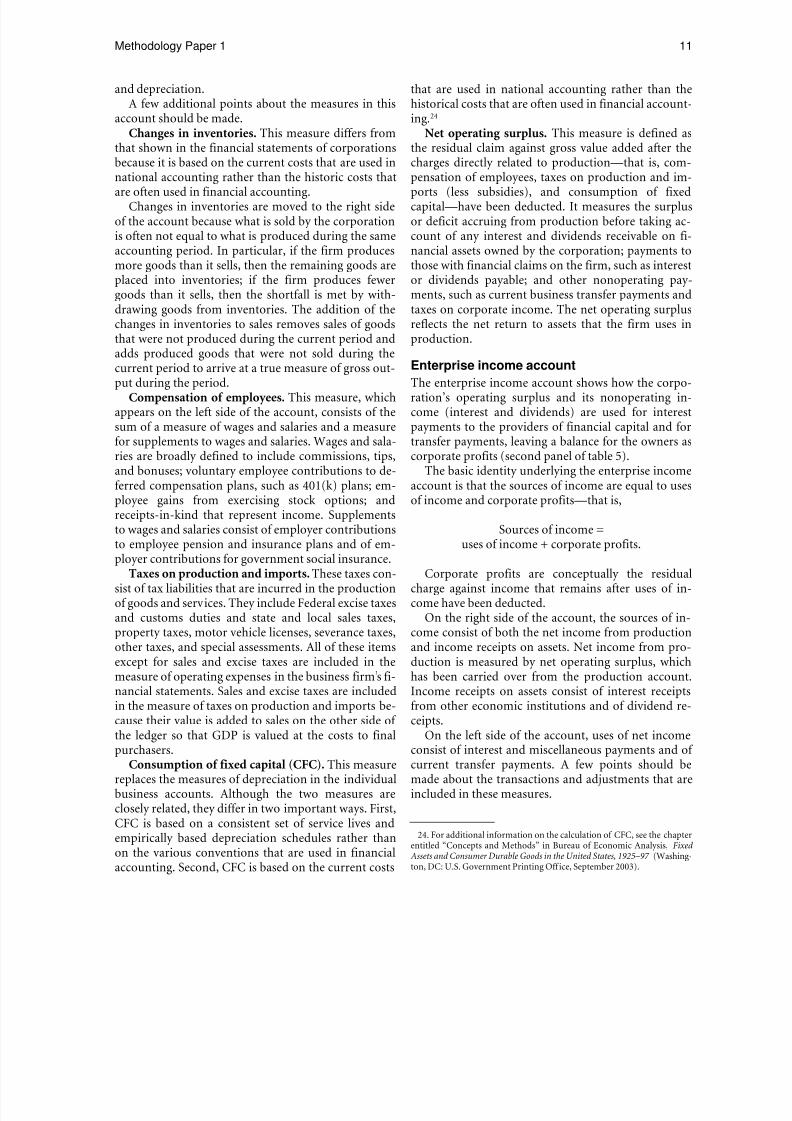
and depreciation.A few additional points about the measures in this
account should be made.Changes in inventories. This measure differs from
that shown in the financial statements of corporationsbecause it is based on the current costs that are used in
national accounting rather than the historic costs thatare often used in financial accounting.
Changes in inventories are moved to the right sideof the account because what is sold by the corporationis often not equal to what is produced during the sameaccounting period. In particular, if the firm producesmore goods than it sells, then the remaining goods areplaced into inventories; if the firm produces fewergoods than it sells, then the shortfall is met by with-drawing goods from inventories. The addition of thechanges in inventories to sales removes sales of goodsthat were not produced during the current period and
adds produced goods that were not sold during thecurrent period to arrive at a true measure of gross out-put during the period.
Compensation of employees. This measure, whichappears on the left side of the account, consists of thesum of a measure of wages and salaries and a measurefor supplements to wages and salaries. Wages and sala-ries are broadly defined to include commissions, tips,and bonuses; voluntary employee contributions to de-ferred compensation plans, such as 401(k) plans; em-ployee gains from exercising stock options; andreceiptsinkind that represent income. Supplementsto wages and salaries consist of employer contributionsto employee pension and insurance plans and of em-ployer contributions for government social insurance.
Taxes on production and imports. These taxes con-sist of tax liabilities that are incurred in the productionof goods and services. They include Federal excise taxesand customs duties and state and local sales taxes,property taxes, motor vehicle licenses, severance taxes,other taxes, and special assessments. All of these itemsexcept for sales and excise taxes are included in themeasure of operating expenses in the business firm’s fi-nancial statements. Sales and excise taxes are includedin the measure of taxes on production and imports be-
cause their value is added to sales on the other side of the ledger so that GDP is valued at the costs to finalpurchasers.
Consumption of fixed capital (CFC). This measurereplaces the measures of depreciation in the individualbusiness accounts. Although the two measures areclosely related, they differ in two important ways. First,CFC is based on a consistent set of service lives andempirically based depreciation schedules rather thanon the various conventions that are used in financialaccounting. Second, CFC is based on the current costs
that are used in national accounting rather than thehistorical costs that are often used in financial account-ing.24
Net operating surplus. This measure is defined asthe residual claim against gross value added after thecharges directly related to production—that is, com-
pensation of employees, taxes on production and im-ports (less subsidies), and consumption of fixedcapital—have been deducted. It measures the surplusor deficit accruing from production before taking ac-count of any interest and dividends receivable on fi-nancial assets owned by the corporation; payments tothose with financial claims on the firm, such as interestor dividends payable; and other nonoperating pay-ments, such as current business transfer payments andtaxes on corporate income. The net operating surplusreflects the net return to assets that the firm uses inproduction.
Enterprise income account
The enterprise income account shows how the corpo-ration’s operating surplus and its nonoperating in-come (interest and dividends) are used for interestpayments to the providers of financial capital and fortransfer payments, leaving a balance for the owners ascorporate profits (second panel of table 5).
The basic identity underlying the enterprise incomeaccount is that the sources of income are equal to usesof income and corporate profits—that is,
Sources of income = uses of income + corporate profits.
Corporate profits are conceptually the residualcharge against income that remains after uses of in-come have been deducted.
On the right side of the account, the sources of in-come consist of both the net income from productionand income receipts on assets. Net income from pro-duction is measured by net operating surplus, whichhas been carried over from the production account.Income receipts on assets consist of interest receiptsfrom other economic institutions and of dividend re-
ceipts.On the left side of the account, uses of net income
consist of interest and miscellaneous payments and of current transfer payments. A few points should bemade about the transactions and adjustments that areincluded in these measures.
24. For additional information on the calculation of CFC, see the chapterentitled “Concepts and Methods” in Bureau of Economic Analysis, Fixed Assets and Consumer Durable Goods in the United States, 1925–97 (Washing-ton, DC: U.S. Government Printing Office, September 2003).

8/2/2019 An Introduction to the National Income and Product Accounts
http://slidepdf.com/reader/full/an-introduction-to-the-national-income-and-product-accounts 14/27
12
Interest receipts. This measure differs from thatused in financial accounting because it includes boththe monetary receipts that are recorded on financialstatements and the imputed receipts that are used innational economic accounting. These imputed interestreceipts are included to account for the value of im-
plicit financial services that are provided by commer-cial banks and by property and casualty insurancecompanies.25
Interest and miscellaneous payments. This mea-sure differs from the measure of interest paymentsused in financial accounting in two ways. First it in-cludes any rents or royalties for natural resources paidto government that may be included in the measure of operating surplus in the business firm’s financial state-ments. Rents and royalties related to other items, suchas building equipment, or patented research, are ex-cluded from this measure because they are treated as
purchases of intermediate goods and services. Second,much like the measure of interest receipts in this ac-count, interest and miscellaneous payments includesimputed interest payments to account for the value of implicit financial services that are provided by com-mercial banks and by property and casualty insurancecompanies.
Current transfer payments (net). These paymentsconsist of cash or inkind payments where nothing isreceived in return. However, current transfer paymentsexclude payments that are related to acquisition ordisposal of fixed assets, such as capital gains or estateor gift taxes. These types of transfers are classified ascapital transfers and included in the capital account.For the business firm, current transfer payments in-clude fines and certain fees paid to government, theportion of insurance premiums that is not a paymentfor service (net of benefits received), charitable contri-butions to nonprofit organizations, and various otherunrequited payments. With the exception of the ad-
justed value for insurance premiums, these items areincluded as in the measure of operating expenses in thefirm’s financial statements.
Corporate profits. The measure of corporate profitsincludes adjustments so that it is based on the inven-
tory valuation and depreciation concepts that are usedin national economic accounting. 26
25. For a discussion of the treatment of the transactions associated withcommercial banks and with property and casualty insurance companies,see Brent R. Moulton and Eugene P. Seskin, “Preview of the 2003 Compre-hensive Revision of the National Income and Product Accounts,” SURVEY 83(June 2003): 17–34.
26. Since the more detailed tables of the NIPAs also provide measures of corporate profits that are based on data reported to the Internal RevenueService, the adjustments that are applied in the derivation of the measuresin this account are explicitly mentioned in the title for this measure.
Methodology Paper 1
Income and outlay account
The income and outlay account shows how corporateprofits, which have been carried forward from the en-terprise income account, are used to either pay corpo-rate income taxes or dividends to shareholders or areretained by the corporation (third panel of table 5).
The basic identity underlying the income and outlay account is that the sources of income are equal to thedistributions of income and undistributed corporateprofits—that is,
Sources of income = distributionsof income + undistributed corporate profits.
Undistributed corporate profits are the residualcharge against income that remains once distributionsof income have been made to other economic agents.
Capital account
The capital account shows how saving is used to ac-quire nonfinancial assets, such as fixed assets and in-ventories (fourth panel of table 5).
The basic identity underlying the capital account isthat the value of gross savings and net capital transfersis equal to the value of gross investment and the valueof net lending or borrowing—that is,
Gross saving and net capital transfers =gross investment + acquisition less
disposal of nonproduced nonfinancial assets+ net lending or borrowing.
Net lending or borrowing is the residual claim ongross saving once gross investment and acquisition lessdisposal of nonproduced nonfiancial assets have beendeducted. Its value can viewed as the amount availableto lend to other units if saving exceeds investment orthe amount the corporation is required to borrow tofinance investment that cannot be funded from CFCand undistributed profits.
Gross saving, which appears on the right side of theaccount, consists of both undistributed corporateprofits, which have been carried over from the income
and outlay account, and CFC. Gross investment, whichappears on the left side of the account, consists of bothpurchases of fixed assets and changes in inventories.Although the structure of the capital account is rela-tively straightforward, a few additional points shouldbe made about the measures that are shown in this ac-count and their relation to the Federal Reserve Boardflow of funds accounts (FFAs).
Net capital transfers. Net capital transfers are cashor inkind transactions that are related to the acquisi-tion or disposal of fixed assets where one of the parties

8/2/2019 An Introduction to the National Income and Product Accounts
http://slidepdf.com/reader/full/an-introduction-to-the-national-income-and-product-accounts 15/27
13Methodology Paper 1
involved in the exchange gets nothing in return. In thisaccount, they consist of investment grants receivedfrom the Federal Government.
Gross investment. This measure differs from themeasure of purchases of fixed assets in two ways. First,gross investment does not include purchases of land,
which are treated as an acquisition of a nonproducednonfinancial asset (discussed below). Second, since thenational accounts treat software expenditures as in-vestment, gross investment includes expenditures re-lated to the purchase or “inhouse” development of software used in production.27
Acquisition less disposal of nonproduced nonfi-nancial assets. Nonproduced nonfinancial assets con-sist of nonfinancial assets that are necessary forproduction but have not themselves been produced.These assets primarily consist of natural resources,such as land, electromagnetic spectrum, and offshore
drilling rights.Relation to the FFAs. Although the measure of netlending or borrowing that is presented in this accountis calculated as the residual claim on gross saving oncegross investment and acquisition less disposal of nonproduced nonfinancial assets have been deducted, itsvalue can also be calculated by subtracting the acquisi-
27. For a discussion of the treatment of software investment in the NIPAs,see Brent R. Moulton, Robert P. Parker, and Eugene P. Seskin, “A Preview of the 1999 Comprehensive Revision of the National Income and ProductAccounts: Definitional and Classification Changes,” SUR VEY 79 (August1999): 7–20.
tion of financial liabilities from the acquisition of fi-nancial assets. This alternative calculation worksbecause saving that is not spent on purchases of fixedassets results in the acquisition of financial assets, andborrowing that is used to finance the purchase of fixedassets results in the acquisition of financial liabilities.
The measure of net lending or borrowing links theNIPAs to the FFAs. In particular, the economic ac-counts that underlie the FFAs begin by subtracting theacquisition of financial liabilities from the acquisitionof financial assets to arrive at a measure of net lendingor borrowing, which in principle should equal themeasure that is calculated in the NIPAs. In practice,these measures differ because they are calculated fromdifferent source data and reflect differences in method-ologies. The remaining economic accounts then recordchanges in the value of financial assets and liabilities tofinally arrive at a measure for the change in net
wealth.28
As a result, the NIPAs and the FFAs jointly show how the changes in net wealth between balancesheets are related to income from production, muchlike what is done in financial statements.29
28. Because of data limitations, the set of balance sheets provided in theFFAs do not cover all sectors in the economy.
29. BEA and the Federal Reserve Board have been working together tofurther integrate the NIPAs and the FFAs. One outcome of these efforts isthe development of a set of integrated accounts that use consistent termi-nology for a consistently defined set of sectors. For more on this topic see,Charlotte Anne Bond, Teran Martin, Susan Hume McIntosh, and CharlesIan Mead, “Integrated Macroeconomic Accounts for the United States,”SUR VEY 87 (February 2007): 14–31.

8/2/2019 An Introduction to the National Income and Product Accounts
http://slidepdf.com/reader/full/an-introduction-to-the-national-income-and-product-accounts 16/27
8/2/2019 An Introduction to the National Income and Product Accounts
http://slidepdf.com/reader/full/an-introduction-to-the-national-income-and-product-accounts 17/27
15Methodology Paper 1
reflect the net return to assets used in production.However, for some unincorporated businesses, net op-erating surplus may also reflect the value of uncom-pensated labor contributed by owners. Because thismeasure reflects a mixture of returns to capital and la-bor, the SNA refers to this balance as “mixed income”
in the case of unincorporated household enterprises.However, the NIPAs use the term operating surplus forall types of business.
Current surplus of government enterprises. Thecurrent surplus of government enterprises consists of the net earnings of government agencies that cover asubstantial portion of their operating costs by sellinggoods and services to the public and that maintaintheir own separate accounts. Typical examples of gov-ernment enterprises include the U.S. Postal Service,state and local utility companies, and state and localtransit authorities. Although many state universities
and public parks maintain separate financial records,they are not treated as government enterprises in theaccounts because their admissions charges and feesusually cover only a small portion of their operatingexpenses. Rather, such institutions are treated as partof general government.
The treatment of the current surplus of governmententerprises in the accounts is similar to that of net op-erating surplus of private corporations. In particular,the current surplus is included on the left side of theproduction account. The only difference in treatmentis that the entire value of the current surplus is distrib-uted to the general government. In other words, gen-eral government, as the ultimate owner of governmententerprises, is assumed to have access to the resourcesderived from the current surplus of, and to be respon-sible for investment in, those enterprises.
Reinvested earnings on direct investment. Two ad-ditional measures that relate to net income receiptsfrom the rest of the world appear in the income andoutlay account for business. The first, reinvestedearnings on U.S. direct investment abroad, consists of U.S. investors’ claims on currentperiod undistributedearnings of foreign businesses in which they own orcontrol 10 percent or more of the business. This mea-
sure is included as part of income receipts on assets onthe right side of the account. The second, reinvestedearnings on foreign direct investment in the UnitedStates, consists of the foreign investors’ claims on thecurrentperiod undistributed earnings of domesticU.S. businesses in which they own or control 10 per-cent or more of the business. This measure is includedas part of the income payments on assets on the leftside of the account. These flows are included in the ac-count to attribute the earnings of foreign direct invest-ment enterprises to the country of the controlling
parent enterprise, regardless of whether the earningsare actually distributed to the parent or are retainedand reinvested by the subsidiary.
Proprietors’ income. This measure consists of thenet earnings of sole proprietorships, partnerships, andtaxexempt cooperatives that are based on the inven-
tory valuation and depreciation concepts that are usedin national economic accounting.30 Sole proprietor-ships are businesses that are owned and managed by single individuals who are personally liable for all busi-ness debts. For tax purposes, the owners and theirbusinesses are treated as single tax entities. Partner-ships are businesses that are owned and managed by two or more persons where at least one person is per-sonally liable for all business debts.31 For tax purposes,the net earnings of partnerships are “passed through”to owners who report and pay taxes on this income intheir personal income tax returns.
The treatment of proprietors’ income in the ac-counts is similar to the treatment of corporate profits.In particular, proprietors’ income is included on theleft side of the business enterprise income account. Al-though sole proprietors and partnerships may retainnet earnings for future use or investment, a simple ac-counting convention is used to record the distributionof their income, because of data limitations. In partic-ular, proprietors’ income is treated as being distributedentirely to owners in the household and institutionssector, which is consistent with the tax treatment of such income. This treatment is similar to the way thecurrent surplus of government enterprises is attributedto their owners in the government sector.
Rental income of other private business. This mea-sure consists of the income earned from the rental of properties by landlords who are not sole proprietors orassociated with a partnership or corporation and of the royalties received by persons from patents, copy-rights, and rights to natural resources. It excludes therental income of owneroccupants, which is discussedin the section on households and institutions. As withproprietors’ income, the rental income of other privatebusiness is calculated by using the depreciation con-cept that is used in national accounting. For tax pur-
poses, the rental income of persons is reported onSchedule E of an individual income tax return. For theeconomic accounts of the business sector, this incomeis treated in the same manner as proprietors’ income.
Net dividends. Dividend payments and receipts
30. Since the more detailed tables of the NIPAs also provide measures of proprietors’ income that are based on data reported to the Internal RevenueService, the adjustments that are applied in the derivation of the measuresin this account are explicitly mentioned in the title for this measure.
31. The term “persons” in this context is defined by the Uniform Partner-ship Act and covers a broad set of legal entities, including individuals, busi-ness trusts, estates, and trusts.

8/2/2019 An Introduction to the National Income and Product Accounts
http://slidepdf.com/reader/full/an-introduction-to-the-national-income-and-product-accounts 18/27
16
between domestic businesses are offset against oneanother to avoid the double counting of corporateprofits in the NIPAs. As a result, the measure of netdividends that appears at the bottom of the businessenterprise income account consists of dividend pay-ments made by corporations located in the United
States and abroad to stockholders who are U.S. resi-dents less the dividend payments received by U.S. cor-porations.
Households and Institutions SectorThe NIPA households and institutions sector consistsof households and nonprofit institutions servinghouseholds (NPISHs). The activities of these two dif-ferent types of entities are combined into a single sec-tor in the NIPAs because NPISHs provide services tohouseholds and because data on nonprofits institu-tions have traditionally been weak.32
As the primary role of households and institutionsserving households in the economy is to earn incomefor consumption or saving by providing resources forproduction, most of the income that is generated inproduction is distributed to this sector. Most sales of final goods and services are also made to this sector.
Although the structure of the accounts for house-holds and institutions is similar to that for businesses,there are enough differences to warrant a separate dis-cussion for each of the new accounts.
Production account
The production account for households and institu-tions records the value of three different types of output: The rental services provided to homeownersby owneroccupied housing, compensation paid to do-mestic workers, and nonprofit services that are pro-vided to households. The rest of this section discussesthe accounting conventions that are used to record thevalue of each type of output and the effects that theseconventions have on the measure of net operating sur-plus.
Owner-occupied housing services. As the rental of tenantoccupied housing is counted as a sale of a ser-vice and is part of the business sector’s output, the ser-
vices provided by owneroccupied housing must alsobe counted in GDP. Otherwise, the value of GDPwould change every time a housing unit switched be-
32. By combining the activities of households and of nonprofit institu-tions serving households into a single consolidated account, transactionsbetween these separate types of entities did not need to be presented. How-ever, due to increased data availability in more recent years, information onthe incomes and outlays for each of these types of entities is available inNIPA table 2.9. For a discussion of NIPA table 2.9, see Charles Ian Mead,Clinton P. McCully, and Marshall B. Reinsdorf, “Income and Outlays of Households and of Nonprofit Institutions Serving Households,” SURVEY 83(April 2003): 13–17
Methodology Paper 1
tween tenant occupied and owner occupied. To avoidthis problem an imputation is included in the produc-tion account to treat owneroccupied housing in thesame manner as rental property in the NIPAs. Al-though this is done by simply treating homeowners asif they were landlords that rented their own homes to
themselves, the actual conventions that are used torecord the value of owneroccupied housing are intri-cate.
On the right side of the account, a measure for spacerent is included in the measure of gross output (firstpanel of table 7). As there are welldeveloped rentalmarkets for housing, the imputation for space rent isbased on the rents that are charged by landlords forequivalent types of property. Spending by homeown-ers on closing costs, repairs, and property insurance isincluded in the measure of intermediate goods andservices, which is subtracted from gross output to ar-
rive at gross value added, as is done with the similarbusiness expenses for owners of rental property.On the left side of the account, property taxes paid
by homeowners are included in the measure of taxeson production and imports. The measures for subsi-dies and consumption of fixed capital also include therelevant values for owneroccupied housing. The ac-count is kept in balance by the measure of net operat-ing surplus, which is used for mortgage interestpayments and to generate rental income for owneroc-cupied housing.
Domestic services. The value of compensation thatis paid for domestic services is included in the mea-sures of gross output and gross value added on theright side of the account. This value is also included inthe measure of compensation on the left side of the ac-count.
Nonprofit services. Since nonprofit institutionsserving households (NPISHs) often rely on contribu-tions, government grants, and income receipts on as-sets to cover many of their expenses, sales are not agood measure of the value of their gross output. As aresult, the NIPAs value their gross output by the ex-penses that they incur in production.
On the right side of the account, the value of gross
output is calculated as the sum of the compensation of employees, intermediate goods and services, taxes onproduction and imports (less subsidies), CFC, andmortgage interest. The measure of intermediate goodsand services, which is subtracted from gross output toarrive at gross value added, also includes the relevantvalues for NPISHs.
On the left side of the account, the measures forcompensation of employees, taxes on production andimports (less subsidies), CFC, and net interest includethe relevant values for NPISHs. These last three types

8/2/2019 An Introduction to the National Income and Product Accounts
http://slidepdf.com/reader/full/an-introduction-to-the-national-income-and-product-accounts 19/27
17Methodology Paper 1
of expenses make up the rental value of fixed assetsthat are owned and used by NPISHs.
Enterprise income account
The enterprise income account for households and in-stitutions shares the same structure as the correspond-
ing account for the business firm, but the account forhouseholds and institutions is limited to transactionsassociated with owneroccupied housing and nonresi-dential assets owned by NPISHs (second panel of table7).
Income and outlay account
The income and outlay account for households and in-stitutions resembles the corresponding account forbusiness. However, the sources and uses of income thatare recorded in the two related accounts differ substan-tially. Whereas the primary sources of income for busi-
ness are sales revenues, the primary sources of incomefor households and institutions are income receiptsthat are associated with the provision of resources forproduction (third panel of table 7). The primary use of income for households and institutions is personalconsumption expenditures, which has no counterpartfor business.
Another difference between the two related ac-counts involves the particular accounting entries thatare offset against one another to avoid double count-ing. For business, dividend payments and receipts be-tween domestic businesses are offset against oneanother. For households and institutions, payments of charitable contributions by households are offsetagainst the receipts of such contributions by NPISHs.As a result, such contributions are excluded from therelated account, avoiding a source of double countingin personal income.
In addition to the offsetting for charitablecontributions, revenues from sales by NPISHs are de-ducted from the total expenditures of households andinstitutions in the measure of personal consumptionexpenditures that appears on the left side of the ac-count. This practice avoids double counting in GDPbecause the value of such sales are already reflected in
the measures of consumption expenditures or are con-sidered intermediate goods and services in the NIPAs.
Two additional points should be mentioned beforeturning to a more detailed discussion of the measuresin the account. First, because of data limitations, mostof the transactions in this account are recorded on acash basis rather than an accrual basis.33 Second, pay-ments that are made in households’ behalf by business
33. Most business transactions, such as interest payments and receipts, arelikely to be recorded on an accrual basis.
and government are included as both a source and ause of income in this account, even though such re-ceipts and payments are usually excluded from house-hold budgets. For instance, employerpaid healthinsurance premiums are included in supplements towages and salaries and the medical care that is paid
for by employer health plans is included in personalconsumption expenditures.34 Payments made on
34. For further examples of payments made in households’ behalf, see theBEA methodology paper Personal Consumption Expenditures at<www.bea.gov/bea/mp.htm>.
Table 7. Economic Accounts for Households and Institutions
Production Account
Uses Sources
Compensation of employees, paid
Wages and salaries
Supplements to wages and salaries
Taxes on production and imports
Less: SubsidiesConsumption of fixed capital
Net operating surplus
Gross output 1
Less: Intermediate goods and services 2
Charges against gross value added and netoperating surplus
Gross value added
Enterprise Income Account
Uses Sources
Interest and miscellaneous payments
Current transfer payments
Rental income of households and institutions withcapital consumption adjustment
Net operating surplus
Interest receipts
Interest payments, transfer payments, andrental income of persons
Sources of income
Income and Outlay Account
Uses Sources
Personal current taxes
Personal outlays
Personal consumption expenditures
Interest payments
Current transfer payments
To governmentTo the rest of the world
Personal saving
Compensation of employees, received
Wages and salaries
Domestic
Rest of the world
Supplements to wages and salaries
Proprietors’ income with inventory valuationand capital consumption adjustments
Rental income of households and institutionswith capital consumption adjustment
Income receipts on assets
Interest received
Dividends received
Current transfer receipts
From government
From business
Less: Contributions for government socialinsurance
Current taxes, outlays, and saving Personal income
Capital Account
Uses Sources
Gross investment Personal saving
Net lending or borrowing Net capital transfers
Consumption of fixed capital
Gross investment and net lending Gross saving
1. Consists of the sum of wages and salaries paid for domestic services, space rent for owner-occupiedhousing, and expenses of nonprofit institutions serving households for nonprofit services. The expenses ofnonprofit institutions consist of compensation of employees, intermediate goods and services, taxes on production and imports (less subsidies), consumption of fixed capital, and mortgage interest.
2. Consists of the spending of homeowners that would be treated as business expenses by owners of rentalproperty, and purchases of intermediate goods and services by nonprofit institutions serving households.

8/2/2019 An Introduction to the National Income and Product Accounts
http://slidepdf.com/reader/full/an-introduction-to-the-national-income-and-product-accounts 20/27

8/2/2019 An Introduction to the National Income and Product Accounts
http://slidepdf.com/reader/full/an-introduction-to-the-national-income-and-product-accounts 21/27
19Methodology Paper 1
finance current consumption. In particular, house-holds and institutions can finance current consump-tion by using savings from previous periods, by sellingfinancial or fixed assets, or by borrowing. Indeed, inthe shortrun, an individual household’s saving is un-likely to be positive when it makes a major purchase,
such as an automobile; even at the aggregate level, per-sonal saving may become negative when an unusually large number of households and institutions makesuch purchases.
As often noted, personal saving, along with personalincome, exclude capital gains. Nevertheless personalsaving is still a useful measure for examining the fundsthat are made available by households and institutionsto finance new investment. This is because capitalgains represent changes in the value of existing assetsand are not a source of new funds for the economy as awhole.
Despite its usefulness, the NIPA measure of personalsaving may not be the appropriate measure for sometypes of analyses that focus on households and institu-tions. For example, analyses that examine whetherhouseholds are saving enough for retirement may bebetter off focusing on households stocks of net wealth,which can be used to finance future consumption.36
Capital account
The structure of the capital account for householdsand institutions is almost identical to that for the busi-ness sector. Investment in this sector consists of thepurchase of housing. Net capital transfers in this sectorare equal to transfer receipts, which consist of assetsthat are brought into the United States by immigrants,less transfer payments, which consist of assets removedfrom the United States by emigrants and of estate taxesthat are paid to general government.
General Government SectorThe NIPA general government sector consists of allFederal Government and state and local governmentagencies except government enterprises.
Governments play many roles in the economy, andthe NIPAs provide measures related to at least four of
these roles. These include providing nonmarket ser-vices for consumption by the general public, investingin assets to provide infrastructure for the economy,providing social benefits to individuals in society, andcontributing to domestic saving and investment.
Many of the measures that appear in the generalgovernment accounts have already been addressed inthe previous sections. For instance, the measure of per-
36. For a further discussion of usefulness of personal saving in particulartypes of analyses, see Marshall B. Reinsdorf, “Alternative Measures of Per-sonal Savings,” SURVEY 87 (February 2007): 7–13.
sonal current taxes that appears as a source of incomefor general government is the same as the measure of personal income taxes that appear as a use of incomefor households and institutions.37 The structure of theaccounts for the general government sector also resem-bles that for households and institutions. However,
there is no enterprise income account for governmententerprises, because of limitations in source data.There are also enough differences between the remain-ing accounts to warrant a separate discussion for eachnew account.
Production account
Because governments primarily rely on tax receiptsand transfer payments to cover their expenditures,sales are not a good measure of the value of their grossoutput. As a result, gross output for general govern-ment is measured by the expenditures that are made to
provide goods and services for public consumption,but it excludes expenditures for other purposes—forexample, social benefits paid to persons, interest pay-ments, and subsidies.
Gross output for general government, which ap-pears on the right side of the account, is calculated asthe sum of compensation of employees, purchases of intermediate goods and services, and CFC (as a partialmeasure of the services of government capital; firstpanel of table 8). Since purchases of intermediategoods and services are subtracted from gross output toarrive at gross value added, the account is kept in bal-ance by including compensation of employees andCFC on the left side of the account.
BEA recognizes that the inclusion of a measure of net operating surplus in the production account forgeneral government would improve consistency withina full set of national accounts; this practice would alsoinvolve choosing a model and using independentsource data to estimate the value of a net return tofixed assets. Since the advisory group that has beentasked to recommend updates to the SNA has calledfor research on to how to measure such a net return ina set of national economic accounts, the productionaccount for this sector presently only includes a mea-
sure of CFC, which is an incomplete measure of thecost of capital services derived from such goods.
Income and outlay account
The income and outlay account for general govern-ment resembles the corresponding account for house-holds and institutions. However, the nature of incomereceipts and expenditures that are recorded in the two
37. Since each measure in the summary accounts of the NIPAs has acounterentry, additional examples of such relationships can be found intable 9.

8/2/2019 An Introduction to the National Income and Product Accounts
http://slidepdf.com/reader/full/an-introduction-to-the-national-income-and-product-accounts 22/27
20
Table 8. Economic Accounts for General Government
Production Account
Uses Sources
Compensation of employees, paid Gross output 1
Wages and salaries Less: Intermediate goods and services
Supplements to wages and salaries
Consumption of fixed capital
Charges against gross value added Gross value added
Income and Outlay Account
Uses Sources
Consumption expenditures
Current transfer payments
Government social benefits
To persons
To the rest of the world
Other current transfer payments to the rest ofthe world
Interest payments
Subsidies
Less: Wage accruals less disbursements
Government saving
Current tax receipts
Personal current taxes
Taxes on production and imports
Taxes on corporate income
Taxes from the rest of the world
Contributions for government social insuranceIncome receipts on assets
Interest and miscellaneous receipts
Dividends
Current transfer receipts
From business (net)
From persons
Current surplus of government enterprises
Current expenditures and net saving Current receipts
Capital Account
Uses Sources
Gross investment Government saving
Acquisition less disposal of non-produced Net capital transfersnonfinancial assets Consumption of fixed capital
Net lending or borrowing
Gross investment and net lending Gross saving
1. Consists of compensation of employees, intermediate goods and services, and consumption of fixedcapital.
accounts differ. Whereas the primary sources of in-come for households and institutions are income re-ceipts from providing resources for production, theprimary sources of income for the general governmentare current tax receipts and contributions for govern-ment social insurance (second panel of table 8). Gen-eral government also does not use income receiptsmainly for financing consumption expenditures.Rather, much of the income received by general gov-ernment is also used to provide current transfer pay-ments to households.
Another difference between the two accounts in-volves the particular accounting entries that are offset
against one another to avoid double counting. Forhouseholds, payments and receipts of charitable con-tributions between households and institutions areoffset against one another. For general government, in-come payments and receipts between the Federal Gov-ernment and the state and local governments, whichare called grantsinaid in the NIPAs, are offset againstone another. As a result, grantsinaid are excludedfrom the measures of the consolidated government ac-count, though they are included in the separate ac
Methodology Paper 1
counts for the Federal Government and for state andlocal governments. This practice avoids a potentialsource of double counting in the measures of govern-ment receipts and expenditures.
In addition to the offsetting of grantsinaid, rev-enue from sales to other sectors is deducted from the
total expenditures of general government in the forma-tion of the measure of government consumption ex-penditures. As with the offsetting of the sales of NPISHs against the expenditures of households andinstitution expenditures, this practice avoids doublecounting in GDP because such sales are already re-flected in the measures of PCE and exports or are con-sidered purchases of intermediate goods and servicesby business.
Government consumption expenditures. Thisitem, which appears on the right side of the account,provides a measure of the value of services produced
by government for the benefit of society as a whole.Examples of such services include national defense,public education, and police and fire protection. Thevalue of government consumption expenditures is in-directly calculated by subtracting ownaccount invest-ment, which is counted as part of government grossinvestment, and sales to other sectors from the mea-sure of government gross output for the reason men-tioned above.
Wage accruals less disbursements. This item con-sists of wages and salaries earned less wages and sala-ries paid. It is subtracted from expenditures on the leftside of account so that the measure of net governmentsaving on an accounting basis is comparable to that of personal saving. This can be understood by noting thatthe wages and salaries in government consumption ex-penditures are on an accrual basis..
Net government saving. This item is the residualclaim on government current receipts once current ex-penditures have been deducted. This measure reflects,among other factors, the transactions that are covered(for example, transactions of government employee re-tirement plans) and the time at which transactions arerecorded that make it different from measures of sur-pluses or deficits that are included in government bud-
gets.38
Capital account
The structure of the capital account for general gov-ernment is almost identical to that for households andinstitutions. In fact, the only structural difference is
38. For a more detailed discussion of the relationship between the Federaldeficits or surpluses and NIPA net saving, see Mary L. Roy and Andrew P.Cairns, “Federal Budget Estimates for Fiscal Year 2009,” SURVEY 87 (March2007): 10–21.

8/2/2019 An Introduction to the National Income and Product Accounts
http://slidepdf.com/reader/full/an-introduction-to-the-national-income-and-product-accounts 23/27
21Methodology Paper 1
that the account for the general government includes ameasure for the net acquisition of nonproduced nonfi-nancial assets from the business sector.
Although the structure of the related accounts issimilar to those of the business sector, the measure of
gross investment differs because it excludes changes ininventories. Although their inclusion would improveoverall consistency in the NIPAs, a complete set of datathat could be used to construct such a related measureis not available.

8/2/2019 An Introduction to the National Income and Product Accounts
http://slidepdf.com/reader/full/an-introduction-to-the-national-income-and-product-accounts 24/27
22
IV. NIPA Summary Accounts
THIS section provides the conceptual framework
for the NIPA summary accounts:
● The domestic income and product account
● The private enterprise income account
● The personal income and outlay account
● The government receipts and expenditures account
● The foreign transactions current account
● The domestic capital account
● The foreign transactions capital account
Since the personal income and outlay account andthe government receipts and expenditure account areidentical to the related income and outlay accountsthat were presented for each of the related sectors inthe last section, only the remaining accounts need fur-ther discussion.
Domestic income and product account
This account mainly consists of an aggregation of theunderlying production accounts for all domestic sec-tors. However, a major difference between the relatedaccounts is that the right side of the domestic income
and product account measures GDP by using the ex-penditure approach rather than the valueadded ap-proach (first panel of table 9). This means that GDP iscalculated in the NIPAs as the sum of PCE, gross pri-vate domestic investment, net exports of goods andservices, and government consumption expendituresand gross investment. Longtime users of the accountsare familiar with this derivation of GDP.
Although measures of gross output, intermediategoods and services, and gross value added by sector arenot presented in the domestic income and product ac-count, measures of gross value added by sector can befound in NIPA table 1.3.5. In addition, measures of gross output, intermediate goods and services, andgross value added by industry can be found in theBEA’s industry accounts.
GDI, which appears on the left side of the account,includes a measure of wage and salary accruals. How-ever, the account also provides measures for wage andsalary disbursements and for wage accruals less dis-bursements to identify counterentries in the completeset of summary accounts.
Although most of the measures that appear in the
domestic income and product account have already been introduced, a few of the new measures should beexplained.
Gross private domestic investment. This item,which appears on the right side of the account, consistsof the sum of gross private fixed investment andchange in private inventories. Gross private fixed in-vestment consists of purchases of fixed assets by busi-nesses and NPISHs and of the construction of newhousing for households.
Net exports of goods and services. This measure isdefined as exports less imports. Exports are added on
the right side of the account because they are part of the value of final goods and services produced in theUnited States that are not included in the other mea-sures of final expenditures in the account. Imports,which include purchases of both final and intermedi-ate goods and services, are subtracted on the right sideof the account because they are produced outside of the United States but are included in the other mea-sures of final expenditures.
Statistical discrepancy. Although the value of GDIshould equal the value of GDP, in practice, the valuesof these measures often differ. This is because each is
calculated using a different set of methodologies anddata sources. The statistical discrepancy that appearson the left side of the account shows how much thetwo measures differ.
BEA views GDP as a more reliable measure of out-put than GDI because it considers the source data un-derlying GDP to be more timely and accurate. Forinstance, most of the annual source data used for esti-mating GDP are based on complete enumerations,such as Federal Government budget data, or are regu-larly adjusted to such enumerations, such as the quin-quennial economic and government censuses. GDP is
also based largely on the detailed benchmark inputoutput accounts that are available every five years. ForGDI, only the annual tabulations of employment taxreturns and Federal Government budget data arebased on complete enumerations, and only farmproprietors’ income and state and local governmentbudget data are adjusted to complete enumeration.Most of the remaining components of GDI are cal-culated using tabulations of samples of tax returns,which become available for a given year with a more

8/2/2019 An Introduction to the National Income and Product Accounts
http://slidepdf.com/reader/full/an-introduction-to-the-national-income-and-product-accounts 25/27
23Methodology Paper 1
considerable lag than much of the data that is used toestimate GDP.39
Private enterprise income account
There are two main differences between the private en-terprise income account and the business enterprise
income account that was presented in the last section.First, the private enterprise income account consists of an aggregation of the private income accounts for boththe business and the households and institutions sec-tors (second panel of table 9). Second, the private en-terprise income account excludes interest and transfertransactions and the surplus associated with govern-ment enterprises, which are shown in the governmentreceipts and expenditures account.
As noted earlier, the right side of the private enter-prise income account shows the sources of income asthe net operating surplus and income receipts of busi-nesses on assets (such as financial assets and equity inother businesses). The left side of the account showsthe uses of income as income payments on assets (suchas holders of financial liabilities and equity claims of other businesses), business current transfer payments,and income that accrues to the owners of business(namely proprietors’ income, rental income of per-sons, and corporate profits). Corporate profits, awidely used measure in the United States, is distributedto government (taxes on corporate income) and toshareholders (net dividends), or is retained by the cor-porations (undistributed corporate profits).
Foreign transactions current accountThis account shows the current payments receivedfrom the United States by the rest of the world and thecurrent receipts received by the United States from therest of the world. The balance on this account is equalto U.S. exports of goods and services and income re-ceipts from the rest of the world less U.S. imports of goods and services, income payments to the rest of theworld, and current tax and net current transfer pay-ments made to the rest of the world. This balance is
39. For a further discussion of the statistical discrepancy, see Robert B.Parker and Eugene P. Seskin, “Annual Revision of the National Income andProduct Accounts,” SURVEY 77 (August, 1997): 6–35.
closely related to the current account in the interna-tional transactions accounts. The current account bal-ance can be viewed as the acquisition of foreign assetsby U.S. residents less the acquisition of U.S. assets by foreign residents.
Domestic capital accountThis account consists of an aggregation of the capitalaccounts for each sector that contributes to domesticoutput, where net saving is equal to the sum of per-sonal saving, undistributed corporate profits, wage ac-cruals less disbursements, and net government saving.However, there are two notable differences betweenthis account and those presented for each individualsector.
The first difference is that the domestic capital ac-count combines the measures of net capital transfersand of acquisitions and disposals of nonproduced
nonfinancial assets into a single measure of “capitalaccount transactions” on the left side of the ac-count (sixth panel of table 9). This practice simpli-fies the structure of the domestic capital account andthe system of counterentries in the summary ac-counts.
The second difference is that the domestic capitalaccount includes the statistical discrepancy on theright side of the account. The measures of saving thatare carried forward into this account are ultimately based on measures of income that is generated fromproduction. By including the statistical discrepancy,the measure of saving at the bottom of the account be-comes more consistent with the measure of the valueof final goods and services that BEA believes is moreaccurate.
Foreign transactions capital account
This account subtracts net capital transactions withthe rest of the world from the balance on the foreigntransactions current account to derive the net lendingor borrowing position that the United States has withthe rest of the world. The measures of net capital trans-actions and of net lending or borrowing in this ac-count are identical to those included in the domestic
capital account.

8/2/2019 An Introduction to the National Income and Product Accounts
http://slidepdf.com/reader/full/an-introduction-to-the-national-income-and-product-accounts 26/27
24 Methodology Paper 1
Table 9. Summary National Income and Product Accounts, 2006 [Billions of dollars]
Account 1. Domestic Income and Product Account
Line Line
1 Compensation of employees, paid ......................................................................... 7,454.8 15 Personal consumption expenditures (3–3) ............................................................ 9,224.5 2 Wage and salary accruals.................................................................................. 6,032.2 16 Durable goods ................................................................................................... 1,048.9
3 Disbursements (3–12 and 5–11).................................................................... 6,024.7 17 Nondurable goods ............................................................................................. 2,688.0 4 Wage accruals less disbursements (4–9 and 6–11) ...................................... 7.5 18 Services............................................................................................................. 5,487.6 5 Supplements to wages and salaries (3–14) ....................................................... 1,422.6 19 Gross private domestic investment........................................................................ 2,209.2 6 Taxes on production and imports (4–16) ................................................................ 967.3 20 Fixed investment (6–2) ...................................................................................... 2,162.5 7 Less: Subsidies (4–8)............................................................................................. 49.7 21 Nonresidential................................................................................................ 1,397.7 8 Net operating surplus............................................................................................. 3,225.3 22 Structures .................................................................................................. 405.1 9 Private enterprises (2–19).................................................................................. 3,239.2 23 Equipment and software............................................................................ 992.6
10 Current surplus of government enterprises (4–26) ............................................ –13.9 24 Residential..................................................................................................... 764.8 11 Consumption of fixed capital (6–13)....................................................................... 1,615.2 25 Change in private inventories (6–4)................................................................... 46.7
26 Net exports of goods and services ........................................................................ –762.0 12 Gross domestic income ...................................................................................... 13,212.8 27 Exports (5–1)..................................................................................................... 1,467.6
28 Imports (5–9) ..................................................................................................... 2,229.6 13 Statistical discrepancy (6–19) ................................................................................ –18.1 29 Government consumption expenditures and gross investment (4–1 and 6–3)...... 2,523.0
30 Federal............................................................................................................... 932.5 31 National defense............................................................................................ 624.3 32 Nondefense ................................................................................................... 308.2 33 State and local................................................................................................... 1,590.5
14 GROSS DOMESTIC PRODUCT............................................................................ 13,194.7 34 GROSS DOMESTIC PRODUCT ........................................................................... 13,194.7
Account 2. Private Enterprise Income Account
Line Line
1 Income payments on assets................................................................................... 3,109.3 19 Net operating surplus (1–9) ................................................................................... 3,239.22 Interest and miscellaneous payments (3–20 and 4–21) .................................... 2,946.8 20 Income receipts on assets..................................................................................... 2,575.33 Dividend payments to the rest of the world (5–14)............................................. 91.4 21 Interest (3–20) ................................................................................................... 2,155.54 Reinvested earnings on foreign direct investment in the United States (5–15) 71.1 22 Dividend receipts from the rest of the world (5–6)............................................. 167.25 Business current transfer payments (net) .............................................................. 90.2 23 Reinvested earnings on U.S. direct investment abroad (5–7)............................ 252.66 To persons (net) (3–24) ...................................................................................... 27.2 7 To government (net) (4–24)................................................................................ 60.6 8 To the rest of the world (net) (5–19) ................................................................... 2.5 9 Proprietors’ income with inventory valuation and capital consumption
adjustments (3–17) ............................................................................................ 1,006.7 10 Rental income of persons with capital consumption adjustment (3–18) ................ 54.5 11 Corporate profits with inventory valuation and capital consumption adjustments 1,553.7 12 Taxes on corporate income ................................................................................ 453.9 13 To government (4–17) .................................................................................... 435.5 14 To the rest of the world (5–19) ....................................................................... 18.4 15 Profits after tax with inventory valuation and capital consumption adjustments 1,099.8 16 Net dividends (3–21 and 4–22) ...................................................................... 698.9 17 Undistributed corporate profits with inventory valuation and capital
consumption adjustments (6–10)............................................................... 400.9
18 USES OF PRIVATE ENTERPRISE INCOME ........................................................ 5,814.5 24 SOURCES OF PRIVATE ENTERPRISE INCOME ................................................ 5,814.5
Account 3. Personal Income and Outlay Account
Line Line
1 Personal current taxes (4–15) ................................................................................ 1,354.3 10 Compensation of employees, received .................................................................. 7,440.82 Personal outlays ..................................................................................................... 9,590.3 11 Wage and salary disbursements ....................................................................... 6,018.23 Personal consumption expenditures (1–15) ....................................................... 9,224.5 12 Domestic (1–3 less 5–11).............................................................................. 6,015.34 Personal interest payments (3–20) .................................................................... 238.0 13 Rest of the world (5–3) .................................................................................. 2.95 Personal current transfer payments ................................................................... 127.8 14 Supplements to wages and salaries (1–5) ........................................................ 1,422.66 To government (4–25) .................................................................................... 78.9 15 Employer contributions for employee pension and insurance funds.............. 970.77 To the rest of the world (net) (5–17) ............................................................... 48.9 16 Employer contributions for government social insurance............................... 451.8
17 Proprietors’ income with inventory valuation and capital consumption 8 Personal saving (6–9) ............................................................................................ 38.8 adjustments (2–9).............................................................................................. 1,006.7
18 Rental income of persons with capital consumption adjustment (2–10)................ 54.519 Personal income receipts on assets ...................................................................... 1,796.520 Personal interest income (2–2 and 3–4 and 4–7 and 5–5 less 2–21 less 4–21
less 5–13) ...................................................................................................... 1,100.221 Personal dividend income (2–16 less 4–22)...................................................... 696.322 Personal current transfer receipts .......................................................................... 1,612.523 Government social benefits (4–4)...................................................................... 1,585.324 From business (net) (2–6).................................................................................. 27.225 Less: Contributions for government social insurance (4–19)................................. 927.6
9 PERSONAL TAXES, OUTLAYS, AND SAVING.................................................... 10,983.4 26 PERSONAL INCOME ........................................................................................... 10,983.4

8/2/2019 An Introduction to the National Income and Product Accounts
http://slidepdf.com/reader/full/an-introduction-to-the-national-income-and-product-accounts 27/27
25Methodology Paper 1
Account 4. Government Receipts and Expenditures Account
Line Line
1 Consumption expenditures (1–29) ......................................................................... 2,089.3 14 Current tax receipts ............................................................................................... 2,769.82 Current transfer payments...................................................................................... 1,618.3 15 Personal current taxes (3–1) ............................................................................. 1,354.3
3 Government social benefits ............................................................................... 1,588.7 16 Taxes on production and imports (1–6) ............................................................. 967.34 To persons (3–23) .......................................................................................... 1,585.3 17 Taxes on corporate income (2–13) .................................................................... 435.55 To the rest of the world (5–18) ....................................................................... 3.3 18 Taxes from the rest of the world (5–18) ............................................................. 12.66 Other current transfer payments to the rest of the world (net) (5–18) ................ 29.6 19 Contributions for government social insurance (3–25) .......................................... 927.67 Interest payments (3–20) ....................................................................................... 372.9 20 Income receipts on assets..................................................................................... 111.98 Subsidies (1–7) ...................................................................................................... 49.7 21 Interest and miscellaneous receipts (2–2 and 3–20)......................................... 109.39 Less: Wage accruals less disbursements (1–4)..................................................... 0.0 22 Dividends (3–21) ............................................................................................... 2.6
10 Net government saving (6–12)............................................................................... –195.4 23 Current transfer receipts ........................................................................................ 139.511 Federal ............................................................................................................... –220.0 24 From business (net) (2–7) ................................................................................. 60.612 S tate and local ................................................................................................... 24.6 25 From persons (3–6) ........................................................................................... 78.9
26 Current surplus of government enterprises (1–10)................................................ –13.9
13 GOVERNMENT CURRENT EXPENDITURES AND NET SAVING....................... 3,934.8 27 GOVERNMENT CURRENT RECEIPTS ............................................................... 3,934.8
Account 5. Foreign Transactions Current Account
Line Line
1 Exports of goods and services (1–27) ...................................................................2 Income receipts from the rest of the world.............................................................3 Wage and salary receipts (3–13) .......................................................................
4 Income receipts on assets .................................................................................5 Interest (3–20)................................................................................................6 Dividends (2–22)............................................................................................7 Reinvested earnings on U.S. direct investment abroad (2–23) ......................
1,467.6691.4
2.9
688.6268.8167.2252.6
9 Imports of goods and services (1–28) ...................................................................10 Income payments to the rest of the world..............................................................11 Wage and salary payments (1–3)......................................................................
12 Income payments on assets ..............................................................................13 Interest (3–20) ...............................................................................................14 Dividends (2–3) .............................................................................................15 Reinvested earnings on foreign direct investment in the United States (2–4)16 Current taxes and transfer payments to the rest of the world (net)........................17 From persons (net) (3–7)...................................................................................18 From government (net) (4–5 and 4–6 less 4–18) ..............................................19 From business (net) (2–8 and 2–14) .................................................................20 Balance on current account, national income and product accounts (7–1)...........
2,229.6633.4
9.4
624.0461.591.471.190.148.920.320.9
–794.1
8 CURRENT RECEIPTS FROM THE REST OF THE WORLD................................ 2,159.021 CURRENT PAYMENTS TO THE REST OF THE WORLD AND BALANCE ON
CURRENT ACCOUNT ...................................................................................... 2,159.0
Account 6. Domestic Capital Account
Line Line
1 Gross domestic investment.................................................................................... 2,642.9 8 Net saving.............................................................................................................. 251.72 Private fixed investment (1–20).......................................................................... 2,162.5 9 Personal saving (3–8)........................................................................................ 38.83 Government fixed investment (1–29) ................................................................. 433.8 10 Undistributed corporate profits with inventory valuation and capital4 Change in private inventories (1–25) ................................................................. 46.7 consumption adjustments (2–17) .................................................................. 400.9
5 Capital account transactions (net) (7–2) ................................................................ 3.9 11 Wage accruals less disbursements (private) (1–4) ........................................... 7.56 Net lending or net borrowing (–), national income and product accounts (7–3)..... –798.0 12 Net government saving (4–10) .......................................................................... –195.413 Plus: Consumption of fixed capital (1–11) ............................................................. 1,615.214 Private ............................................................................................................... 1,347.515 Government....................................................................................................... 267.716 General government...................................................................................... 223.617 Government enterprises................................................................................ 44.118 Equals: Gross saving............................................................................................. 1,866.9
7 GROSS DOMESTIC INVESTMENT, CAPITAL ACCOUNT TRANSACTIONS,19 Statistical discrepancy (1–13) ............................................................................... –18.1
AND NET LENDING .......................................................................................... 1,848.8 20 GROSS SAVING AND STATISTICAL DISCREPANCY ........................................ 1,848.8
Account 7. Foreign Transactions Capital Account
Line Line
1 BALANCE ON CURRENT ACCOUNT, NATIONAL INCOME AND PRODUCTACCOUNTS (5–20) ........................................................................................... –794.1
2 Capital account transactions (net) (6–5)................................................................3 Net lending or net borrowing (–), national income and product accounts (6–6) ....
4 CAPITAL ACCOUNT TRANSACTIONS (NET) AND N ET LENDING, NATIONALINCOME AND PRODUCT ACCOUNTS ...........................................................
3.9–798.0
–794.1
NOTE. Numbers in parentheses indicate accounts and items of counterentry in the accounts. For example, line 5 of account 1 is shown as “Supplements to wages and salaries (3–14)”; the counterentry is shown in account 3,line 14.