An Introduction to SCADA Systems and Substation …sasidharan.webs.com/documents/Power System...
99
Power System – SCADA Dr. Sasidharan Sreedharan www.sasidharan.webs.com
Transcript of An Introduction to SCADA Systems and Substation …sasidharan.webs.com/documents/Power System...

Power System – SCADA
Dr. Sasidharan Sreedharan
www.sasidharan.webs.com

2
Syllabus progress

SCADA In Power Sector
It is used for Managing Power System Networks
Generation – Transmission – Distribution – Metering – Billing etc.
Monitoring & Managing the Power Network up to
the Level of Transmission Network

Power Sector - Milestones….
• Evolution – Small islanded utilities
– Vertically integrated utilities
• Bifurcation into Regions
• Opening up for competition
• Generation companies
• Distribution licensees
• Transmission Utilities and Licensees
• Independent System Operator

GDP and Per Capita Consumption
Growth of Economy – 7 to 8%
Power sector growth required – 10-12%
Per capita consumption 2012 – 900kWh
Indian Case Study
There is close correlation between GDP and per capita consumption

Per capita Consumption Trend analysis (Polynomial 2nd order)
500
550
600
650
700
750
800
850
900
2002-0
3
2003-0
4
2004-0
5
2005-0
6
2006-0
7
2007-0
8
2008-0
9
2009-1
0
2010-1
1
2011-1
2

Power sector in nutshell
• Per capita consumption is a Key index to economic growth
• Growth can be correlated to growth of GDP
• Per capita consumption – much low
• Restructuring and New Business models – world wide
• Vibrant field
• Changes by regulations and acts

Power Sector Future
• Decentralization of generation
• Micro grids, Smart grids
• Penetration of Non - conventional energy sources
• Probability of competition in wires – in distribution
• Need for competitiveness

AIM OF POWER SYSTEM ENGINEERS
• EARLIER STATEMENT
– To provide Reliable, Stable and Secured Power supply to the end user with Least possible cost
• PRESENT STATEMENT
– To provide Reliable, Stable and Secured Power supply to the end user with Least possible cost WITH Maximizing profit to all stake holders
How do we relate Internationally to the
Other Grid Operators Worldwide ?
Associations Worldwide • Very Large Power Grid Operators (VLPGO)
• TSO-Comparison Group
• CIGRE - C2 and C5 committees
• International Interconnections - SAARC

Formation of the VLPGO • A voluntary initiative of the world’s largest Power Grid Operators
• Representing together more than 60% of the electricity demand in the
world.
• Created in 2004
– Not-for-profit organization
– Followed several blackouts across the world
– To investigate fundamental issues of common interest to its
members
– To develop joint action plans addressing the improvement of
power system security.
• Formalized in 2009
• Specific Focus
– Issues related to Very Large Power Grids
• Membership
– Size > 50 GW

• Work constantly to plan, monitor, supervise and
control the energy delivered as a continuous
process 24 hours a day
• Delivering the electricity that powers modern
societies
• Critical role of Grid Operators includes – acting on behalf of Consumers, to ensure quality while minimizing
costs and recognizing economic and societal dependence on electricity;
– a technical role in planning, designing, and managing the Power
Systems;
– an interface role with generators, market participants and distributors,
which are the most direct users of the transmission grid;
– a natural role of interlocutors with power exchanges, regulators and
governments.
VLPGO Aims and Objectives

Very Large Power Grid Operators (VLPGO)
National Grid (UK)
68GW
Capita: 65m
MidWest ISO (USA)
159GW
Capita: 40m
RTE (France)
93GW
Capita: 65m
PJM (USA)
165GW
Capita: 51m
Red Electrica (Spain)
93GW
Capita: 47m
ONS (Brazil)
100GW
Capita: 170m
SO - UPS (Russia)
146 GW
Capita: 144m
Tepco (Japan)
64GW
Capita: 45m
KPX (South Korea)
70GW
Capita: 49m
Terna (Italy)
57GW
Capita: 60m
SGCC (China)
900GW
Capita: 1000m
PGCIL (India)
163GW
Capita: 1200m Eskom
(South Africa)
43.5GW
Capita: 49m
Source: VLPGO, 2010
The largest close to us is
India and hence we are
analyzing the case of India
http://www.vlpgo.org

Website of System Operators Worldwide
14
S.No. Name of the TSO Country Web Presence 1 ESKOM South Africa www.eskom.co.za
2 Red Eléctrica de España* Spain www.ree.es
3 Landsnet Iceland www.landsnet.is
4 Fingrid* Finland www.fingrid.com
5 Amprion* Germany www.amprion.net
6 Transpower NZ Newzealand www.transpower.co.nz
7 Saudi Electricity Company Saudi Arabia www.se.com.sa
8 TenneT Netherlands www.tennet.org
9 Statnett SF Norway www.statnett.no
10 PJM Interconnection** PA,USA www.pjm.com
11 National Grid Electricity Transmission* UK www.nationalgrid.com
12 CLP Power Hong Kong www.clpgroup.com.hk
13 ESB NG Ireland www.eirgrid.com
14 Transpower Germany www.transpower.de
15 Swisssgrid Switzerland www.swissgrid.ch
16 Rede Eléctrica Nacional Portugal www.ren.pt
17 Hydro Québec Canada www.hydroquebec.com
18 Svenska Kraftnät Sweden www.svk.se
19 PSE Poland www.pse-operator.pl
20 EWA Bahrain www.mew.gov.bh
21 China Southern Power Grid China www.eng.csg.cn
22 Power Grid Corporation of India Ltd. India www.powergridindia.com / www.nldc.in

Common Challenges for VLPGO
• Providing power system reliability and security
• Smart Grid development
• Integration of Renewables
• Integration of Electric Vehicles
• Capacity development and optimization including system
renovation and development, equipment upgrading.
• Reducing CO2 emissions
• Improve productivity and energy efficiency
• Power system visualization
• Demand Side Management
• Interconnections
– Development of new technologies and HVDC
• Establishment and coordination of new control centers 15

16
VLPGO 2011 Joint Activities
Working Groups • WG #1 – Wide Area Monitoring Applications
• WG #2 – Enhanced Security
–WG 2a – Security vs. Operation Costs
–WG 2b – Enhanced Network Restoration
–WG 2c – Equipment Overstressing
–WG 2d –Security of Supply to large metro areas
• WG #3 – Integration of Renewables
• WG #4 – Load Forecasting
• WG #5 – HVDC
• WG #6 – Electric Vehicles
• WG #7 – Storage
Joint Projects • Visualization
Workshops • WS #1 – KPIs
• WS #2 – Smart Grid (KPX)

VLPGO Work plan … Road Ahead
NLDC 17

18
VLPGO Current Activities - mapped
Enduring Drivers
Principle Drivers
Smart WS #1: Smart Grids
Renewable
WG #3: Integration of
Renewable Technologies
Security and Safety
of Supply
WG #2a: Enhanced
Security - Vulnerability
Efficient Operation
New Technology WG #1: SynchroPhasors (Wide Area
Monitoring)
JP #2: HVDC in
Synchronous Power
Systems
JP #1: Asset
Management
JP #3: Plug-in Hybrid
Electric Vehicles JP #4: Monitoring and
Automation
#5: Visualization
WS #2 – Key Performance Indicators
(KPIs)
WG #2b: Enhanced
Security - Restoration
WG #2c: Equipment Overstresses

Snapshot
Of Indian Power System


Peculiarities of Indian Power
System • High Growth Rate
• Shortage – both (MW & MU)
• Federal Structure
• Decentralized Scheduling & Despatch
• Diversity
• Unique Holding pattern
• Floating Frequency
• Large Hydro Variation
• Large Demand Variation

Electricity Regions in India
23
NORTHERN REGION
DELHI
HARYANA
HIMACHAL PRADESH
JAMMU & KASHMIR
PUNJAB
RAJASTHAN
UTTAR PRADESH
UTTARANCHAL
CHANDIGARH
WESTERN REGION
GOA
DAMAN & DIU
GUJARATH
MADHYA PRADESH
CHATTISGARH
MAHARASHTRA
DADRA & NAGARHAVELI
EASTERN REGION
BIHAR
JHARKHAND
WEST BENGAL
ORISSA
SIKKIM
SOUTHERN REGION
ANDHRA PRADESH
KARNATAKA
KERALA
TAMIL NADU
PONDICHERRY
NORTH EASTERN REGION
ASSAM
ARUNACHAL PRADESH
MEGHALAYA
TRIPURA
MANIPUR
NAGALAND
MIZORAM

International Interconnections (Future Plans)
Maps not to scale
Bhutan Nepal
Tala: 1020 MW
Chukha: 336 MW
Kurichu: 60 MW
Net import by India
India- Bhutan synchronous links
400 kV Tala-Binaguri D/C
400 kV Tala-Malbase-Binaguri
220 kV Chukha-Birpara D/C
220 kV Chukha-Malbase-Birpara
132 kV Kurichu-Bongaigaon
Over 16 links of 132/33/11 KV
Radial links with Nepal
Net import by Nepal
Bangladesh
400 KV AC line between
Baharampur(India) and
Bheramara(Bangladesh) with 500 MW
HVDC sub-station at Bheramara
Sri – Lanka
Madurai(India) and Anura
dhapura(Sri-Lanka) through
±500 KV HVDC under sea
cable

APTRANSCO SYSTEM
KPTCL SYSTEM
KSEB SYSTEM
Ramagundam
2480 MW
ER ISGS
143 MW
MAPS Nuclear
265 MW TALCHER STG II
1640 MW
KAIGA Nuclear
450 MW
NEYVELI II
NEY EXP
1642 MW
GAZUWAKA HVDC BHADRAWATI HVDC
TALCHER-KOLAR HVDC
895 MW
Pondy
262 MW
585 MW
800 MW
1480MW
180 MW
TNEB SYSTEM
3 Nos. 400 kV lines &
2 Nos 220 kV lines
Goa 95 MW
4 Nos. 400 kV lines &
3 Nos 230 kV line
6 Nos. 400 kV lines &
2 Nos 220 kV lines
4 Nos. 400 kV lines &
1 Nos 220 kV line
ENT: 1728 MW
ENT: 2185 MW ENT: 1385 MW
ENT: 965 MW
TYPICAL INTER STATE FLOWS DURING A SAMPLE PEAK HOUR

Transmission System
• Inter state Transmission system (ISTS)
– Lines by Central Transmission Utility (CTU) , State Transmission Utility (STU) , Licensees
– 400V & Above – ISTS
– Next level – 1200kV
• Regional network transforming to National network
• FACTS, SVC, HVDC – already in use

EASTERN
REGION
SOUTHERN
REGION
WESTERN
REGION
NORTHERN
REGION
NORTH-
EASTERN
REGION
THE NATIONAL GRID : PHASE 1
ER
500 MW VINDHYACHAL
WR-NR HVDC B2B LINK
Commissioned in Nov. 1989
BIRPARA(ER) – SALAKATI(NER)
220 KV AC LINK in April 87
500 MW SASARAM
WR-NR HVDC B2B LINK
Commissioned in June 2001
500 MW GAZUWAKA
ER-SR HVDC B2B LINK
Commissioned in Sep. 1999
500 MW BHADRAWATI
WR-SR HVDC B2B LINK
Commissioned in Sept. 1997
NATIONAL GRID PHASE-1 COMPLETE
400 KV Siliguri-Boangigaon in April 2000
Bhadrawathi 2nd pole in March, 1998
SOUTHERN
REGION
WESTERNRE
GION
EASTERN
REGION
NORTHERN
REGION
NORTH-
EASTERN
REGION
‘ELECTRICAL’
REGIONS
1
2SOUTHERN
REGION
WESTERNRE
GION
EASTERN
REGION
NORTHERN
REGION
NORTH-
EASTERN
REGION
‘ELECTRICAL’
REGIONS
1
2
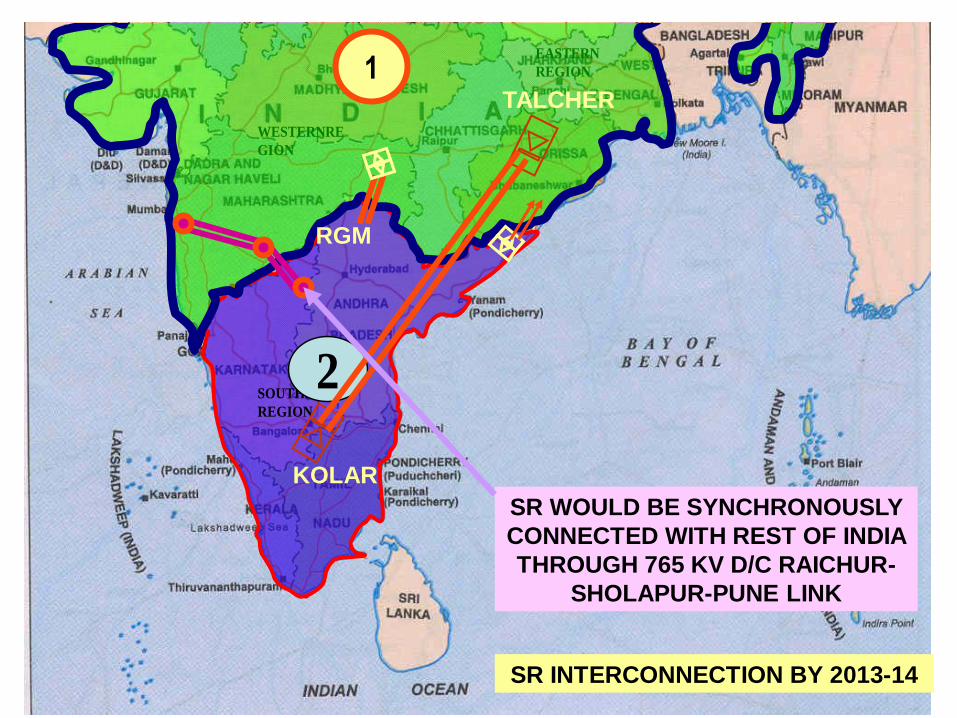
1
SR INTERCONNECTION BY 2013-14
KOLAR
TALCHER
RGM
SR WOULD BE SYNCHRONOUSLY
CONNECTED WITH REST OF INDIA
THROUGH 765 KV D/C RAICHUR-
SHOLAPUR-PUNE LINK


31

Kerala grid - Interstate lines
K era la pow er S ystem
IS TS
K arna taka TN
TV M
PCO DEDM N
(Now 220)
MDK A PK KD ARK D
MJSR KNP A PRS A SB GR
IDKI

Peak Analysis
Installed
capacity (MW)
Availability
(Peak) (MW)
Hydel 1920 1600
Thermal 234 160
IPP/ co gen 378 340
Wind 29
Central sector 1012 800
Total 3573 2800

Evening Peak Availability Hydro 1780 MW
Thermal 82 MW
IPPs 163 MW
CGS 925 MW
Total Availability 2950 MW
Expected Demand 3100 MW
Power Shortage 150 MW

35
Kerala Grid – Generating Stations Hydel Stations Small Hydels
Kuttiady 125 Madupetty 2
Poringal 48 Peppara 3
Sholayar 54 Kallada 15
Idamalayar 75 Chembukadavu, Urmi 12.6
Pallivasal 37.5 Lower Meenmutty, KTR 6
Sengulam 48 Malampuzha 2.5
Neriamangalam 77.5 Malankara 10.5
Panniar 30 Thermal
Lower Periyar 180 BDPP 106.6
Idukki 780 KDPP 128
Sabarigiri 330 IPP
Kakkad 50 BSES 157
Captives 33 NTPC 180
Co Gen 10 KPCL 22
Wind 29 Ullumkal 10
Total 2562MW
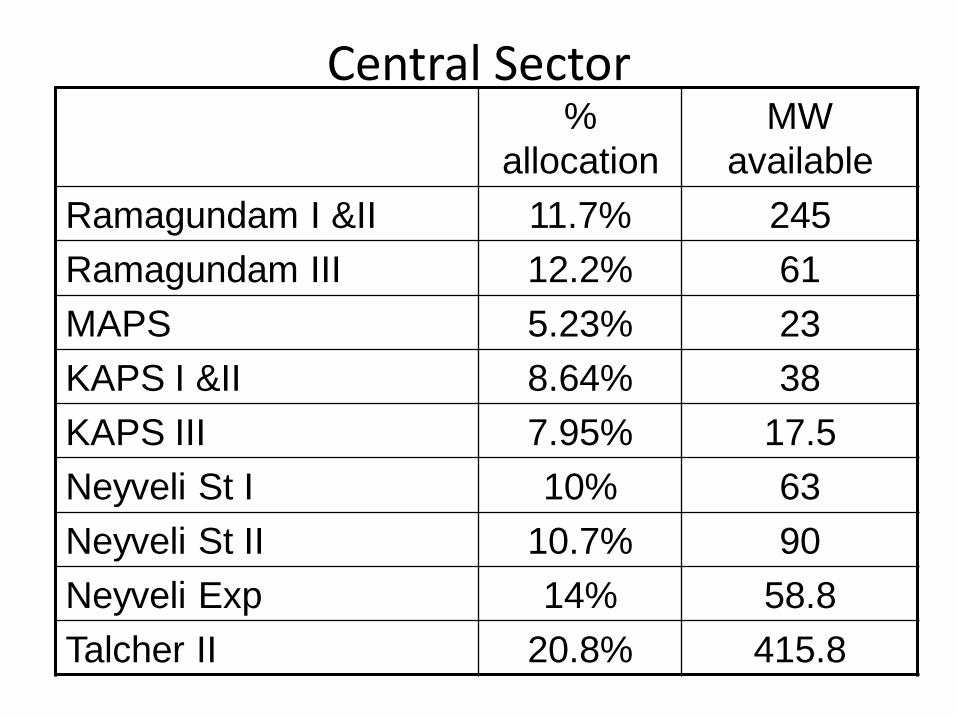
Central Sector %
allocation
MW
available
Ramagundam I &II 11.7% 245
Ramagundam III 12.2% 61
MAPS 5.23% 23
KAPS I &II 8.64% 38
KAPS III 7.95% 17.5
Neyveli St I 10% 63
Neyveli St II 10.7% 90
Neyveli Exp 14% 58.8
Talcher II 20.8% 415.8
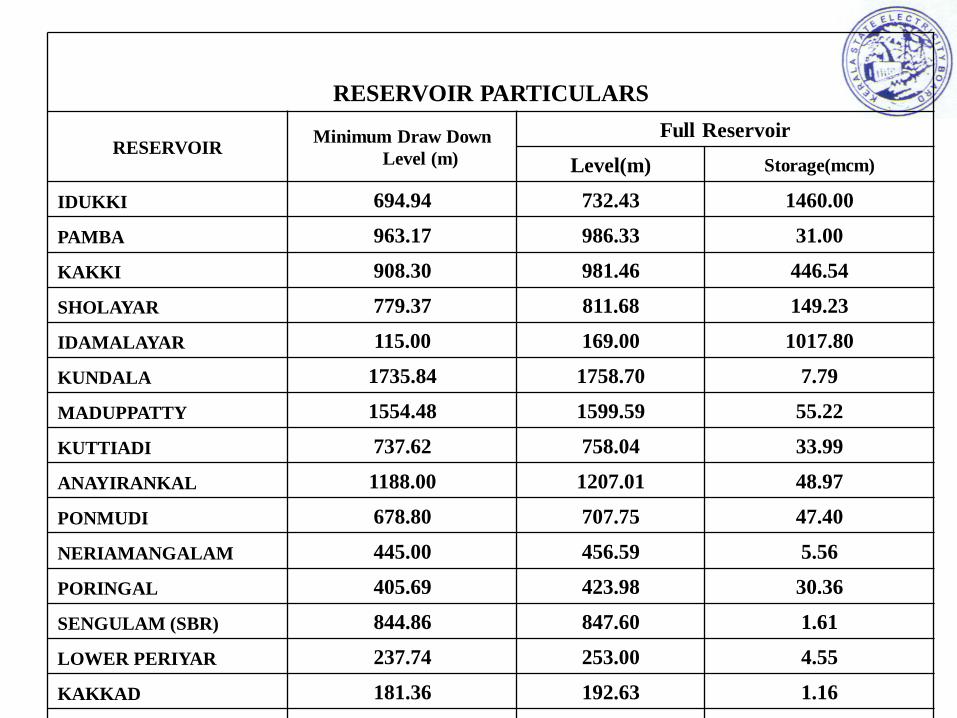
RESERVOIR PARTICULARS
RESERVOIR Minimum Draw Down
Level (m)
Full Reservoir
Level(m) Storage(mcm)
IDUKKI 694.94 732.43 1460.00
PAMBA 963.17 986.33 31.00
KAKKI 908.30 981.46 446.54
SHOLAYAR 779.37 811.68 149.23
IDAMALAYAR 115.00 169.00 1017.80
KUNDALA 1735.84 1758.70 7.79
MADUPPATTY 1554.48 1599.59 55.22
KUTTIADI 737.62 758.04 33.99
ANAYIRANKAL 1188.00 1207.01 48.97
PONMUDI 678.80 707.75 47.40
NERIAMANGALAM 445.00 456.59 5.56
PORINGAL 405.69 423.98 30.36
SENGULAM (SBR) 844.86 847.60 1.61
LOWER PERIYAR 237.74 253.00 4.55
KAKKAD 181.36 192.63 1.16
MALANKARA 36.00 42.00 18.80

Evening Peak Availability
Hydro 1780 MW
Thermal 82 MW
IPPs 163 MW
CGS 925 MW
Total Availability 2950 MW
Expected Demand 3100 MW
Power Shortage 150 MW

SCADA
• Data Acquisition
• Remote Control
• User Interface
• Areas of Responsibility
• Historical Data Analysis
• Report Writer 39

40
Power System SCADA - Components
SCADA
SCADA/ AGC EMS
DMS DA
Distribution
Automation
Distribution
Management
systems
Energy Management systems
AGC Control

SCADA / AGC
• Automatic Generation Control
• Economic Dispatch Calculation/Hydro Allocator.
• Interchange Transaction Scheduling
• Transaction Evaluation ( Area A and Area B)
• Unit Commitment
• Short-Term Load Forecasting
41

EMS
• Network Configuration/Topology Processor
• State Estimation
• Contingency Analysis
• Three Phase Balanced Operator Power Flow
• Optimal Power Flow
• Dispatcher Training Simulator
42

DA
• Voltage Reduction
• Load Management
• Power Factor Control
• Two-Way Distribution Communications
• Short-Term Load Forecasting
• Fault ID/Fault Isolation/Service Restoration
• Interface to Intelligent Electronic Devices (IEDs)
43

DMS
• Three Phase Unbalanced Operator Power Flow
• Interface To/Integration With Automated Mapping/Facilities Management (AM/FM)
• Interface To Customer Information System (CIS)
• Map Series Graphics
• Trouble Call/Outage Management 44

Dispatcher Console 300 MHz RISC Processor
256MB RAM, 9GB HDD,
CD-ROM, (2) 21” CRTs
SCADA System – Configuration overview
SCADA Workstation/Servers
Dispatcher Consoles 300 MHz RISC Processor
256MB RAM, (2) 9GB HDD,
CD-ROM, (2) 21” CRTs
Historical Data Server 300 MHz RISC Processor
512MB RAM, (2) 9GB HDD
CD-ROM
Dispatcher Consoles 700 MHz Pentium III PC
128MB RAM, 9.1GB HDD
CD-ROM, (2) 21” CRTs
Remote User Stations 600 MHz Pentium II PC
64MB RAM, 6GB HDD
CD-ROM, 56k Modem,
13.3” Active Color LCD
PSTN
Remote Access
Router
Laser Printer
10/100 Ethernet
Hubs
RTU Communication
Ports
Diagnostic Modem
LAN
Router
To Corporate
LAN
Port
Servers
Front-End
Processors
ICCP Node 700 MHz Pentium III PC
128MB RAM, 6.4GB HDD
CD-ROM, 17” CRT
Reduced instruction set computing, or RISC Processor used in super
computers

Operator Consoles
• User Interface (UI) devices – Color CRT monitors
– Alphanumeric (PC) keyboard
– Cursor control device (mouse, trackball)
– Audible alarm
• Monitors – Minimum 21 inch diagonal
– Glare reduction features (anti-glare screen coatings)
– Provide display of multiple viewports (windows)
46

User Interface Devices
• Full graphics capabilities – World coordinate space
– Zoom with decluttering
– Translation (Panning)
• Keyboard and cursor pointing device shared among all monitors at each console – Cursor moves across all screens without switching by
user
• Printers – Dot matrix Alarm/Event printer
– Color report printer
– B&W laser report printer 47

One Line Display
48

Feeder Map Display
49

World Coordinate Display Schematic Diagram
50

Full Graphics (Feeder map)
51

User Interface Devices
• Video Wall Board – Large screen display with full SCADA operability
– Multiple screens
• Mosaic Mapboard – Dynamic or static tile mapboard
– Dynamic mapboard lamps updated by SCADA
• Magnetic Mapboard – Static magnetic ‘tiles’
52

Map board/Projection Screens
53

Mapboard/Projection Screens • Mosaic:
54

Magnetic Map board
55

Processors and Auxiliary Memory
• Should be able to upgrade or replace without changing software
• Include facilities for orderly shutdown & resumption of operation on loss & restoration of power
• User Interface processors tend to be Pentium class machines
• Servers tend to be UNIX Workstations
56

Archive Storage
• Uses:
– Backup of SCADA system data and software
– Archive storage for Information Storage and Retrieval function
• Devices Used:
– Rewriteable single platter Digital Video Disk (DVD)
– Rewriteable Compact Disk (CD-ROM)
– Digital Linear Tape (DLT)
57

Local Area Networks
• SCADA System Network – Connects the SCADA master station
components
– Typically based on Ethernet (IEEE 802 series)
– Typically implemented using intelligent switches
– Category 5 UTP ( STP) cabling / FOC preferred
– LAN components can be redundant
58

Local Area Networks
• Interface to Corporate IT Network – Provides support for
• Corporate Data Repository
• Interfaces to external systems (GIS, Outage management, etc.)
– Firewall required for security purposes • Allows access from SCADA to IT systems
• Provides limited access form IT LAN to SCADA
• Provides limited access to SCADA user interface functions
59

Interface to Field Devices
• Provides interface between SCADA system LAN and communication circuits to substation devices
• Modems required for analog communication circuits
• Functions performed: – Manage communications over the channel
– Check for and report protocol and communication errors
– Convert RTU protocol to a common internal format compatible with SCADA Data Processing functions
– Process the retrieved data
– Pass data on to other SCADA resources for further processing and storage
60

Time/Date Reference
• Facility obtains time and date from the Global Positioning System (GPS) satellite constellation
• Overall accuracy ± 1.5ms ideal ( 5 msec)
• Installed at substations (many options)
• Useful for time stamping data acquired at remote locations to a consistent time base.
61

GPS Time Reference Unit
62

Substation Local Area Network (LAN)
• The S/S LAN provides the means connecting components of the system architecture: – IEDs (Intelligent Electronic devices)
– Substation Host Processor
– Interface to Wide Area Network
63

Substation Distributed LAN Architecture
SUBSTATION I/O SOURCES
ENTERPRISE
WAN
CIRCUIT BREAKERS SWITCHES CAPACITORS BATTERIES ELECTRO-MECHANICAL DEVICES TRANSFORMERS
I/O Node
N
I
M
RTU
I/O Node
N
I
M
Digital Recorder
N
I
M
Digital Controller
Protective Relay
N
I
M
Protective Relay
Protective Relay
Digital Meter
N
I
M
Digital Meter
Digital Meter
N
I
M
Other IEDs
I/O Node
N
I
M
PLC
I/O Node
N
I
M
SUBSTATION COMPUTER
HM
I SCADA Modem
SCADA Modem
To: SCADA/EMS
Remote Modem
To: Remote Users
N
I
M
Remote Modem
N
I
M Network Master
Back-Up
N/W Master
“Data Collection” LAN
“Loop-Thru” Bus
“Control” Bus
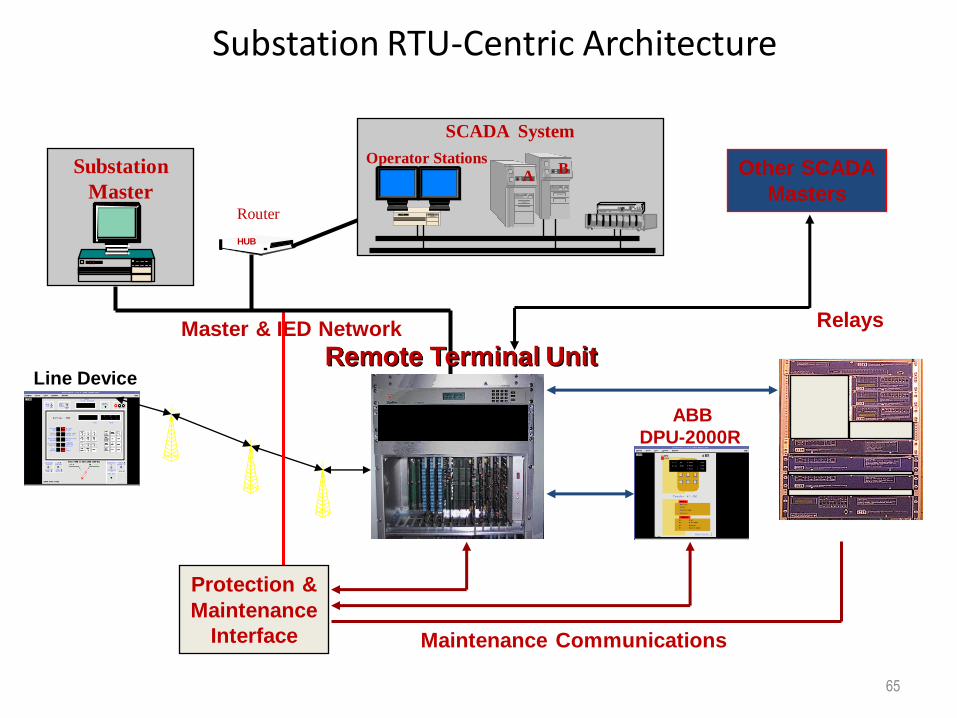
Substation RTU-Centric Architecture
65
Line Device
Maintenance Communications
Master & IED Network
HUB
Relays
Substation
Master
Other SCADA
Masters
Protection &
Maintenance
Interface
Operator Stations
SCADA System
B A
Remote Terminal Unit
ABB
DPU-2000R
Router

DNP / TCP / IP 100MB
Ethernet
to SCADA
DNP / TCP / IP 100MB
Dual LAN Routes
Multi-port
Router
SA System for a Typical City
Substation Master
Relays
Metricom
Feeder
Devices Modicon PLC
IED Gateway

Local User Interface
• Provides mechanism for:
–Viewing data
• meter readings
• load tap changer position
• relay targets
• alarms
• equipment status
• oscillographic (waveform) data
• power quality information

Control Devices/User Interface
• Provides mechanism for: –Controlling substation equipment
• circuit breakers
• motorized disconnect switches
• substation capacitor banks
• load tap changer
–Viewing/Changing settings • Protective relays
• Programmable controllers

Control Panel Mounted Interface
69

Substation One-Line Display
70

Control Devices/User Interface
• Other Displays
– Control panel mimic
• resembles conventional control panel
– Alarm Annunciator mimic • resembles conventional alarm annunciator
– Log sheet display
– Operations summary

Alarm/Event Processing
• Knowledge-Based Alarm Suppression
– Direct Linkages (can use pseudo status points)
– Indirect Linkages
• Area of Responsibility
– Use for each alarm window and each printer
– Use to route alarms to proper windows/dispatchers and/or printers
72

Intelligent Electronic Devices (IED)
• ABB 2000R – Protective Relays
73

Intelligent Electronic Devices
• Bitronics Meter
74

Intelligent Electronic Devices
• Programmable Logic Controller – Acquires status inputs from devices that don’t
have IED interfaces (motor operated disconnects)
– Performs control actions for devices that don’t have IEDs
– Performs sequenced control actions using ladder logic
75
Modicon PLC

Open System Architecture
• Essence of the problem:
– Communications among devices is key to successful SCADA implementation in modern system.
– Traditionally most vendors established their own unique (“proprietary”) way to communicate.
– Getting two Vendor’s proprietary devices to communicate properly is a complex and expensive task
76

Possible Solutions to the Problem
Two basic approaches:
– Buy everything from one vendor
– Get vendor’s to agree on a standard communication interface
77
The latter approach is the fundamental objective
of the “Open Systems” movement

Open Systems
• An evolutionary means to allow a control system to be upgraded in the future with components available from multiple vendors at lowered or competitive costs that will allow Integration with Relative Ease and Low Risk
• Based on the use of Non-Proprietary and standard software and hardware interfaces
78

Open Systems Benefits
• Interoperability
• Avoid reliance on a single vendor
• Upgradable/expandable
• Longer expected system life
• Readily available third party components
79

Standard Protocols • Open Protocols (Legacy):
– Harris 5000
– L&G 8979
– L&N 2020
• “De Facto” (Widely Used) Protocols: – DNP 3.0
– Modbus & Modbus+
– IEC 60870 series
• Utility Communications Architecture (UCA 2.0)/ IEC 61850 (Only world wide STD)
– Evolving worldwide standard
– Manufacturing Message System (MMS)
– Ethernet (10 or 100Mbps)
– Growing number of commercially available products 80

Integration with Corporate IT Systems
• Utilities spending considerable effort in integrating corporate computer systems:
– SCADA
– Geographic Information System (GIS)
– Trouble Call/Outage Management/Mobile Dispatch
– Work Management System
– Customer Information System
• Examples of Shared Data:
– Feeder switch positions (SCADA Outage Management)
– Feeder map and facility data (GIS SCADA)
– Equipment duty (SCADA Work Mgmt)
81

Corporate Data Repository
• Enables Users to Access Substation
Data While Maintaining a Firewall
to Substation Control and
Operation Functions

Corporate Data Repository
• Operational and Non-Operational Data storage: – Applications include: Load Forecasting, Engineering
Studies, Outage Investigations
83

Conventional Remote Terminal Unit (RTU)
84
To Loc al Console
* LOC AL
UI
* DATA
PRO CESSIN G
Master S ta tion
L ink(s)
CO MMU NICATIO N
IN TERF AC E
CO NT RO L
PRO CESSIN G
DAT ABASE
MAIN TENAN CE
* Sub-Remote L ink (s)
* Inte lligent E lect ron ic Dev ic e(s)
* SELF DIAG NO ST IC S
ANALO G
IN PUT
MO DU LES
DIG ITAL
IN PUT
MO DU LES
* ANALOG
O UTPU T
MO DU LES
DIG ITAL
O UTPU T
MO DU LES
IN TERPO SING
RELAYS
Break ers
Switc hes
G enerators
Tap C hangers
Phase Shifters
Contro lle rs
Rec orders
Meters
Contac ts From
B reak ers
Switc hes
Re lays
Pulse
InputsTransducers
CT s & PTs
* O ptiona l features
O ther
Dev ices
FUNCTIO NAL DIA G RAM O F REM O TE TE RMINAL UN IT
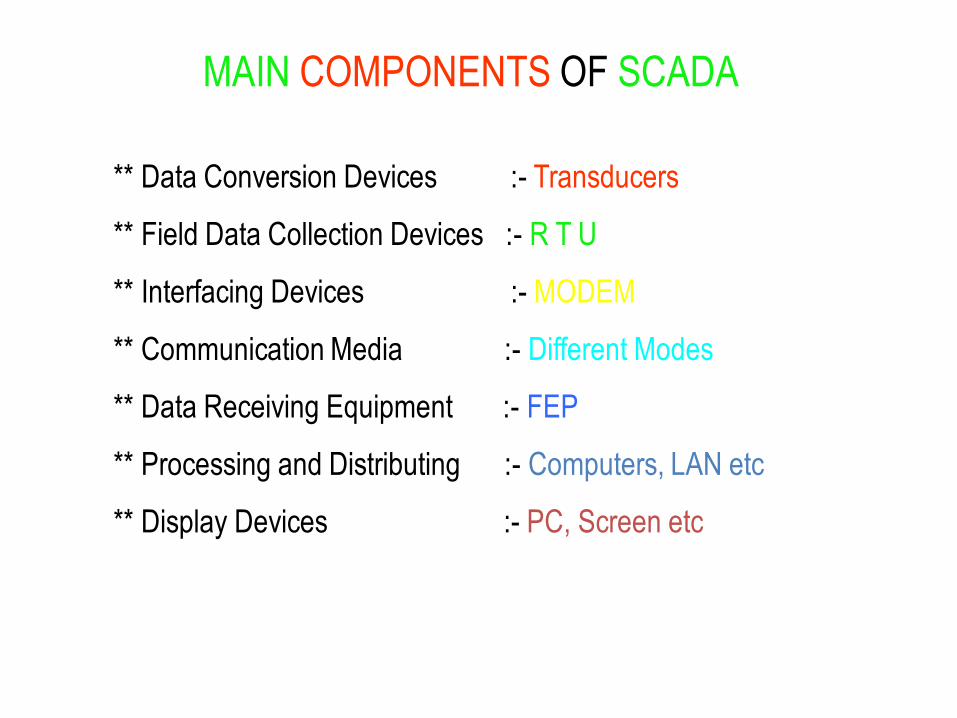
MAIN COMPONENTS OF SCADA
** Data Conversion Devices :- Transducers
** Field Data Collection Devices :- R T U
** Interfacing Devices :- MODEM
** Communication Media :- Different Modes
** Data Receiving Equipment :- FEP
** Processing and Distributing :- Computers, LAN etc
** Display Devices :- PC, Screen etc

NATIONAL LOAD DISPATCH CENTER
Regional
LD
Regional
LD
Regional
LD
State
LDC
State
LDC
State
LDC
State
LDC
State
LDC

Regional Level SCADA Overview

Southern Region DATA flow Hierarchical Overview

DATA FLOW DIAGRAM

SLDC DATA FLOW
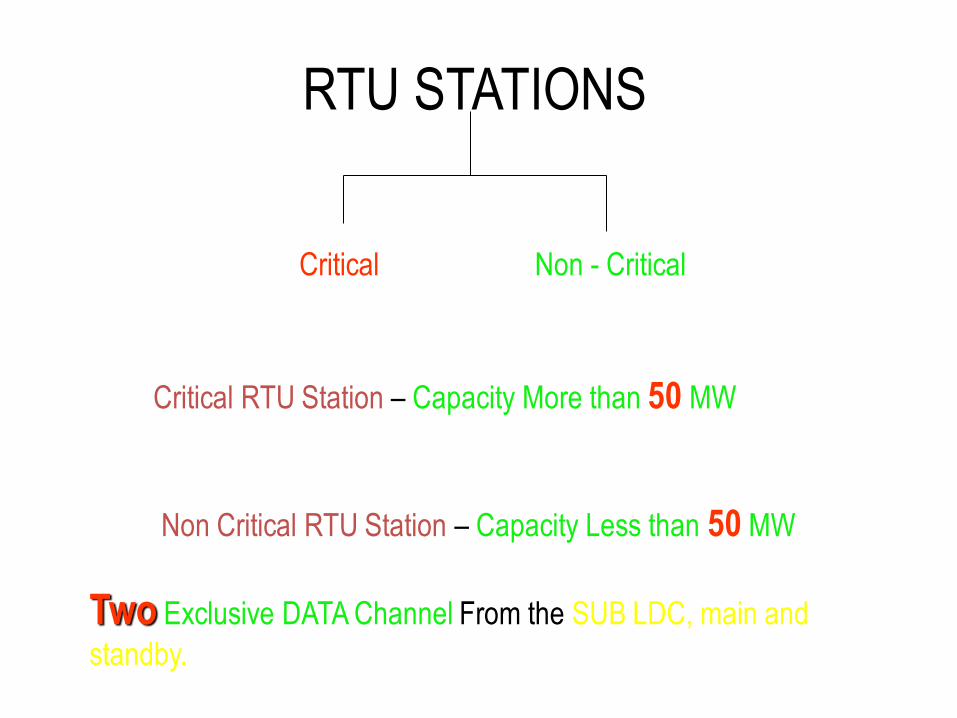
RTU STATIONS
Critical Non - Critical
Critical RTU Station – Capacity More than 50 MW
Non Critical RTU Station – Capacity Less than 50 MW
Two Exclusive DATA Channel From the SUB LDC, main and
standby.

Monitored Parameters and the Transmission Methods
Analogue Values Digital Values
MW, MVAR, V, F,
Tap Position, I etc
CB Position,
Isolator Position,
SOE Points, Relay
Indications
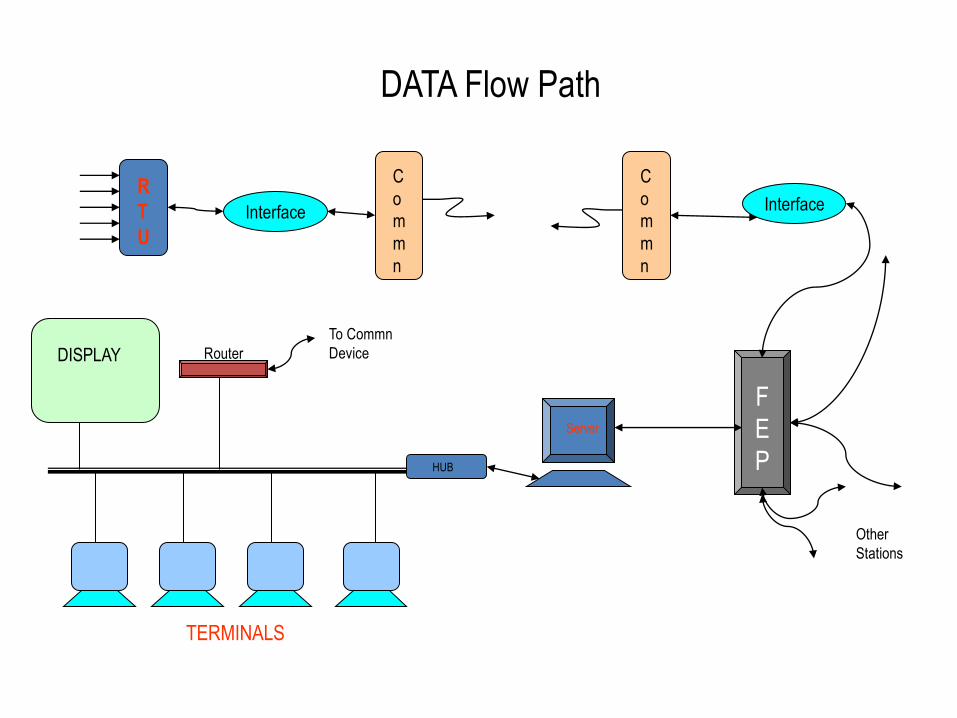
DATA Flow Path
R
T
U
Interface
C
o
m
m
n
C
o
m
m
n
Interface
Server
F
E
P
Other
Stations
HUB
Router
To Commn
Device
TERMINALS
DISPLAY

Transmission Circuits
CT
PT
MW Transducer
MVAR Transducer
Voltage Transducer
4 to 20 mA
4 to 20 mA
4 to 20 mA
4 to 20 mA
4 to 20 mA
4 to 20 mA

Now Our Requirement is Tx/Rx the Digital
Serial Data From the RTU to the FEP
through a Communication Media
Digital Communication Media Digital Communication Media

Communication Network
Parassala
T V M N orth
E dam on
V B TV M K N D K Y M PLM K SY
TC R NA R KDK N R
E dappon
K akkad
E dam on
K undara Sabarigiri
C ochin
Idukki
Pallivasal
Sengulam
N eriam angalam
C LD Y
C hldy
Idlyr
Shlyr
T crN
L P
PlkdB
Pallom
K sy
A rkd
K nypta
K zdA
M njm
K sgdBK nr
K ttdy
Porl

RTU FSK MODEM
P
L
C
C
P
L
C
C F FSK MODEM
F
E
P
Digital FSK
Signal
FSK
Signal
Digital FSK modem
— Digital communication via FSK (Frequency Shift Keying)
according to HART® protocol

Dr. Sasidharan Sreedharan
YBL Systems and Solutions
(Electrical Power System Research Consultants)
www.sasidharan.webs.com
Regards,
98

Specification of 110 KV Transformer CT
Core I Differential
Core II
Back up
Core III
Metering
Core IV
REF
Accuracy
Class
PS 5P10 (Over Current
Protection
1.0 (Accuracy)
PS
Burden - 60 VA 60 VA -
Min. KPV (Knee Point Voltage)
600V - - 600 V
Max.
Exciting
Current.
100 mA - - 100 mA
Resistance
at 75 0 C
4.5 0hm - - 4.5 ohm

SCADA INFRASTRCUTURE ELEMENTS SECURITY
Company LOGO
100
Application Function Security Technology
3G/WIFI connectivity to RTU
stations
Secured AP technology that
includes AV, IPS, and
application control
Distributed control systems
control systems integration to
EMS systems
IPS protection from protocol
anomalies and systems
attacks
SCADA Main to SCADA
remote RTU
Application control for TCP/IP
DNP protocol control, IPS for
buffer, header and network
attacks
RTU control Terminal AV/IPS to secure against
Threats to terminal (no AV
allowed on HMI Terminals)
Data storage for HMI and
RTU systems
Database security control
with schema, table auditing
and control
HMI
DNP V3
ICCP
Wireless
Database Systems