An Introduction to Logistic and Probit Regression...
20
An Introduction to Logistic and Probit Regression Models Chelsea Moore
Transcript of An Introduction to Logistic and Probit Regression...
An Introduction to Logistic and Probit Regression Models Chelsea Moore

Goals
• Brief overview of logistic and probit models
• Example in Stata
• Interpretation within & between models

Binary Outcome
• Examples:
• Yes/No
• Success/Failure
• Heart Attack/No Heart Attack
• In/Out of the Labor Force

Modeling a Binary Outcome
• Latent Variable Approach • We can think of y* as the underlying latent propensity that
y=1 • Example 1: For the binary variable, heart attack/no heart
attack, y* is the propensity for a heart attack. • Example 2: For the binary variable, in/out of the labor force, y*
is the propensity to be in the labor force.
𝑦𝑦∗ = 𝛼𝛼 + 𝛽𝛽𝛽𝛽 + 𝜀𝜀
Where τ is the threshold
yi =10
ifif
yi* > τ
yi* ≤ τ
Logit versus Probit
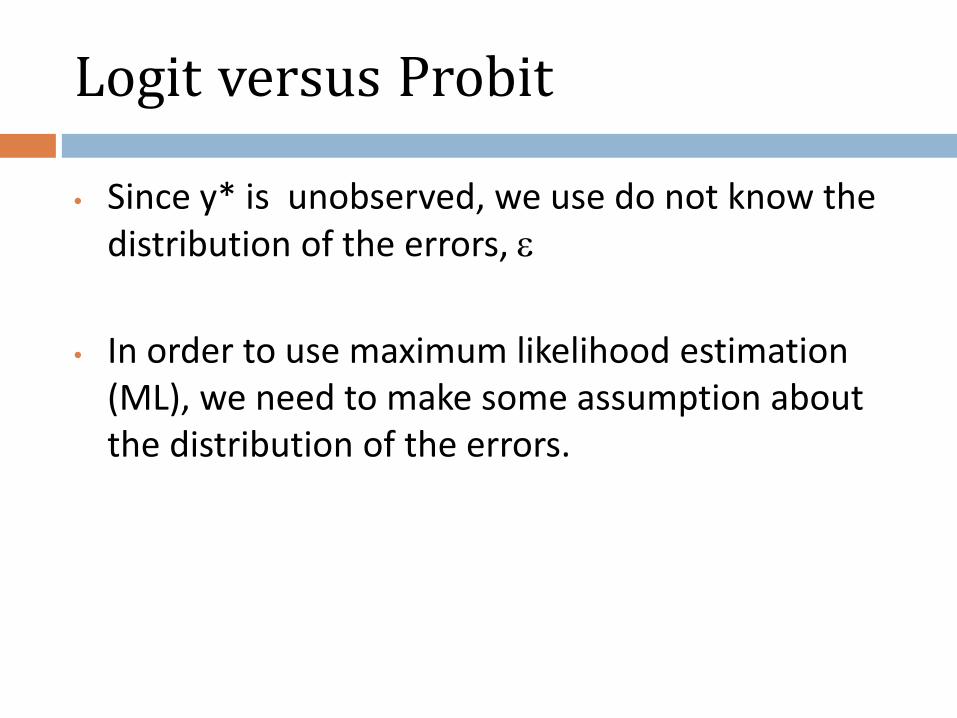
• Since y* is unobserved, we use do not know the distribution of the errors, ε
• In order to use maximum likelihood estimation (ML), we need to make some assumption about the distribution of the errors.
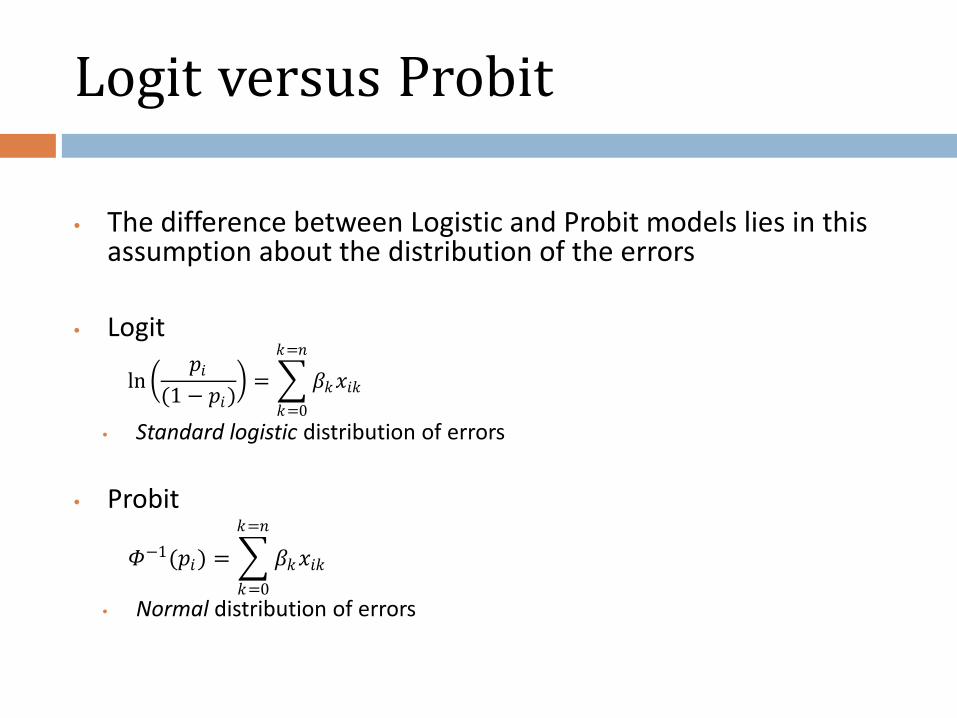
Logit versus Probit • The difference between Logistic and Probit models lies in this
assumption about the distribution of the errors • Logit
• Standard logistic distribution of errors
• Probit
• Normal distribution of errors
ln �𝑝𝑝𝑖𝑖
(1 − 𝑝𝑝𝑖𝑖)� = �𝛽𝛽𝑘𝑘𝛽𝛽𝑖𝑖𝑘𝑘
𝑘𝑘=𝑛𝑛
𝑘𝑘=0
𝛷𝛷−1(𝑝𝑝𝑖𝑖) = �𝛽𝛽𝑘𝑘𝛽𝛽𝑖𝑖𝑘𝑘
𝑘𝑘=𝑛𝑛
𝑘𝑘=0
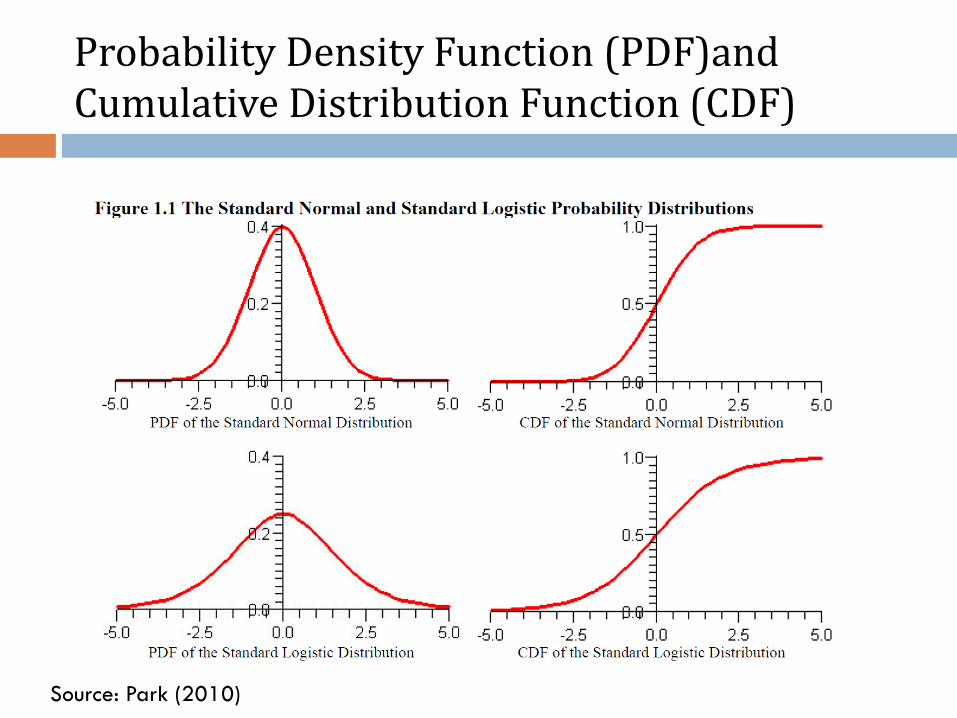
Source: Park (2010)
Probability Density Function (PDF)and Cumulative Distribution Function (CDF)
Which to choose?
• Results tend to be very similar
• Preference for one over the other tends to vary by discipline
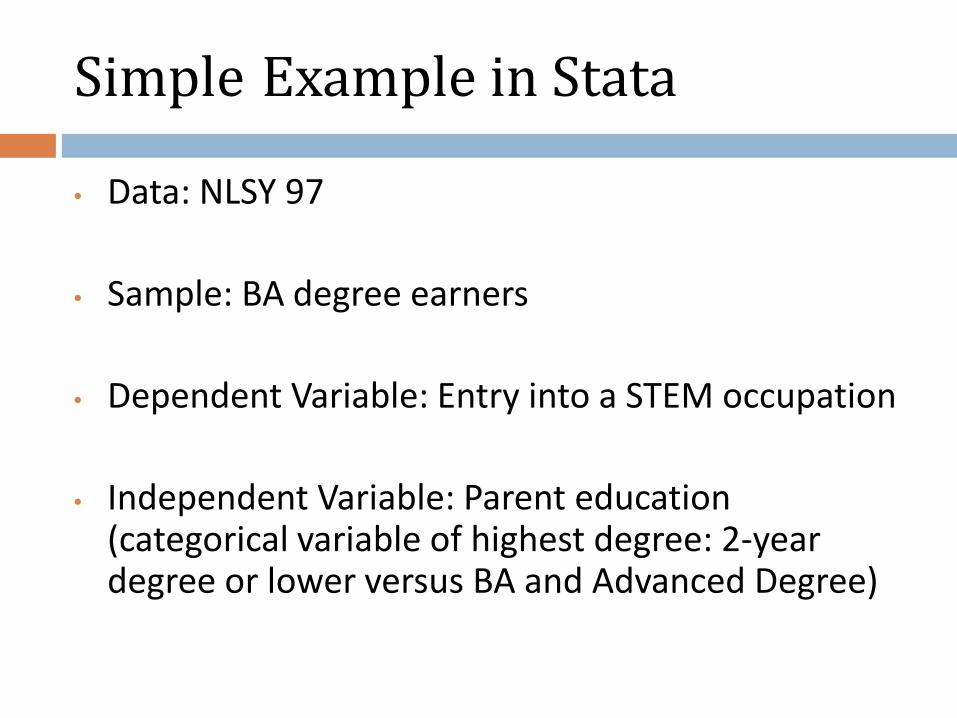
Simple Example in Stata
• Data: NLSY 97
• Sample: BA degree earners
• Dependent Variable: Entry into a STEM occupation
• Independent Variable: Parent education (categorical variable of highest degree: 2-year degree or lower versus BA and Advanced Degree)
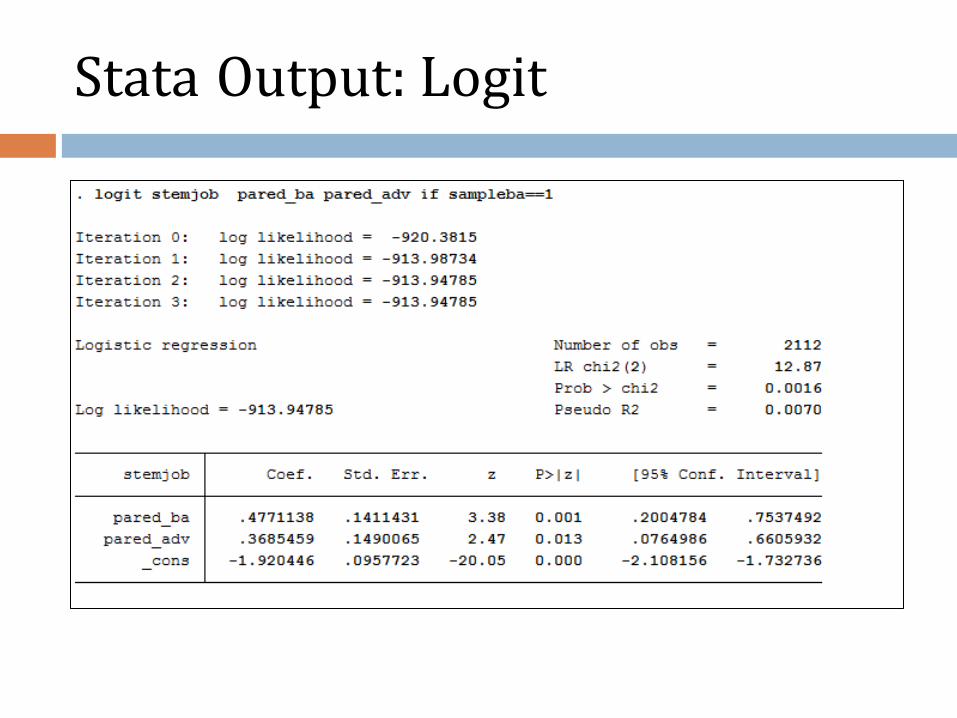
Stata Output: Logit
Interpretation
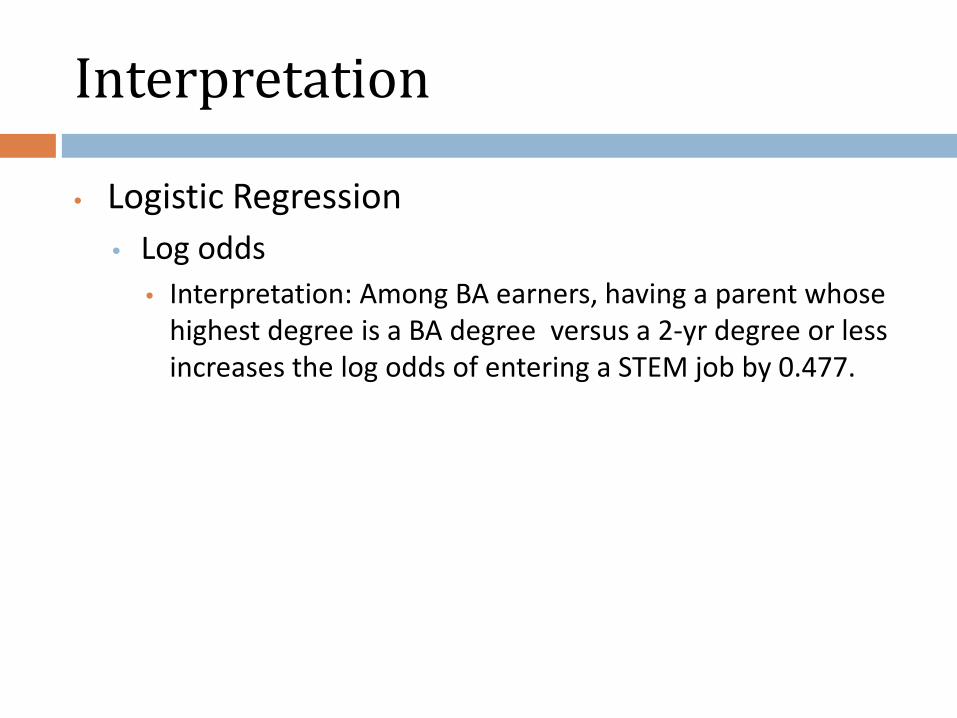
• Logistic Regression • Log odds
• Interpretation: Among BA earners, having a parent whose highest degree is a BA degree versus a 2-yr degree or less increases the log odds of entering a STEM job by 0.477.
Interpretation
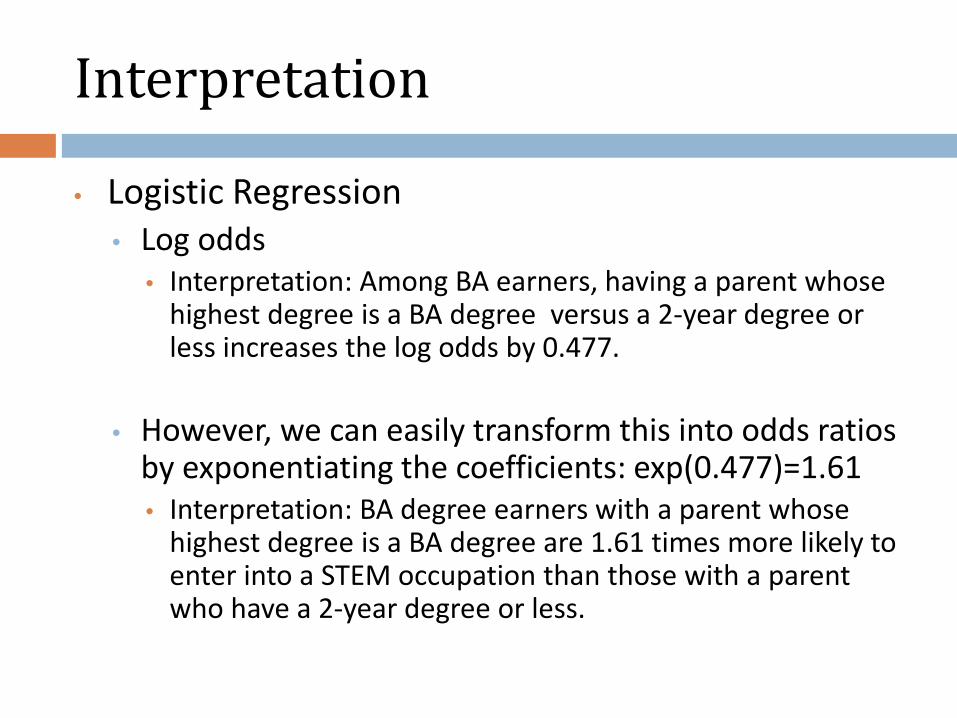
• Logistic Regression • Log odds
• Interpretation: Among BA earners, having a parent whose highest degree is a BA degree versus a 2-year degree or less increases the log odds by 0.477.
• However, we can easily transform this into odds ratios by exponentiating the coefficients: exp(0.477)=1.61 • Interpretation: BA degree earners with a parent whose
highest degree is a BA degree are 1.61 times more likely to enter into a STEM occupation than those with a parent who have a 2-year degree or less.
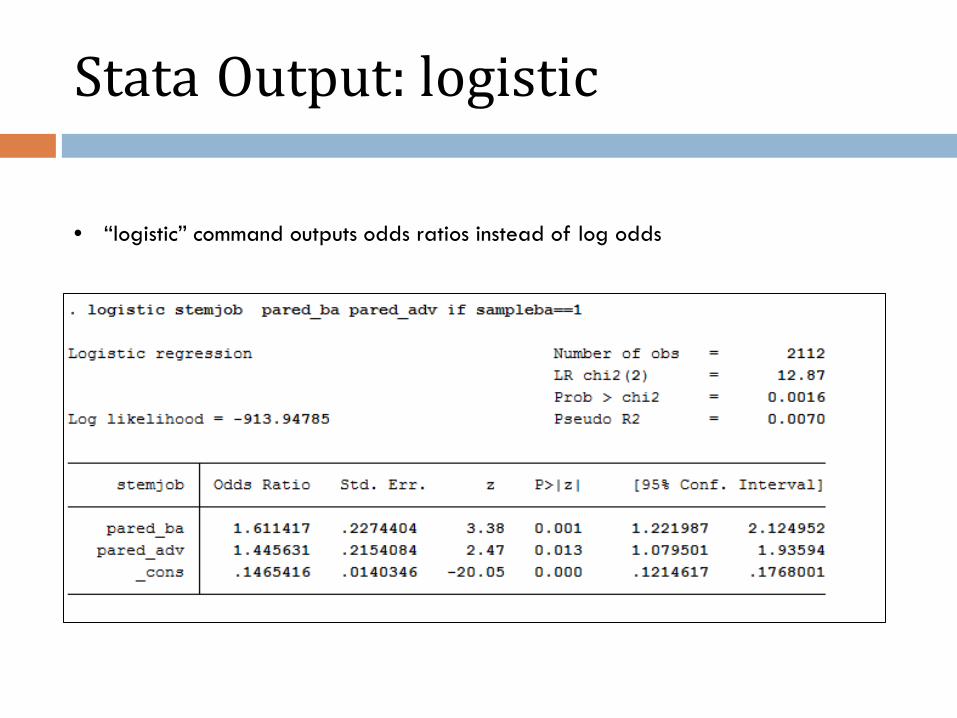
Stata Output: logistic
• “logistic” command outputs odds ratios instead of log odds
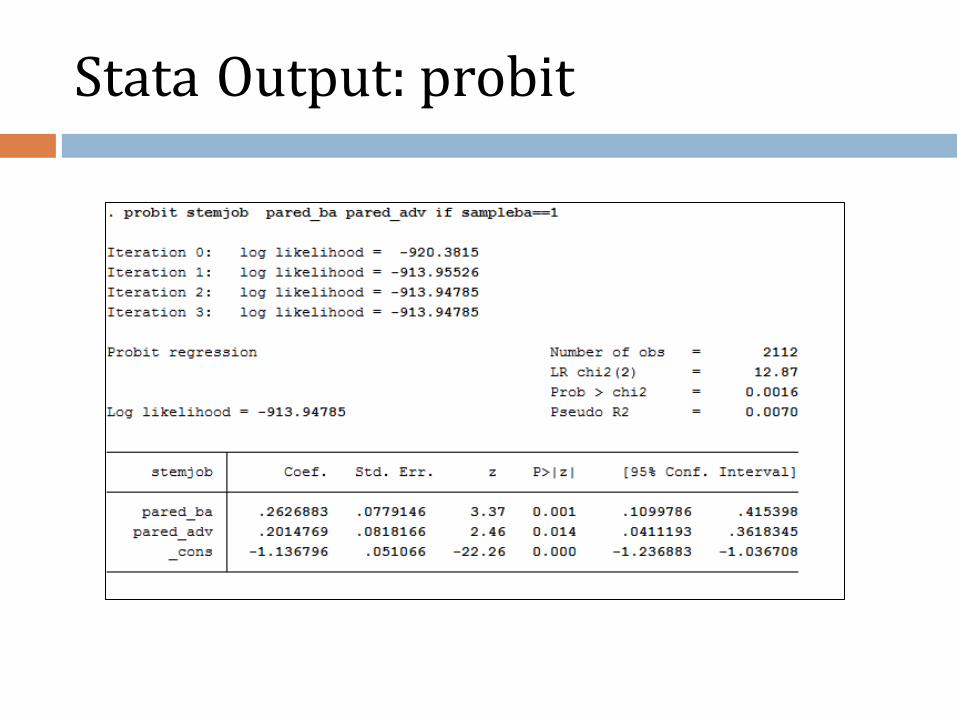
Stata Output: probit

Interpretation
• Probit Regression • Z-scores
• Interpretation: Among BA earners, having a parent whose highest degree is a BA degree versus a 2-year degree or less increases the z-score by 0.263.
• Researchers often report the marginal effect, which is the change in y* for each unit change in x.

Comparison of Coefficients
Variable Logistic Coefficient Probit Coefficient Ratio
Parent Ed: BA Deg .4771 .2627 1.8
Parent Ed: Advanced Deg
.3685 .2015 1.8
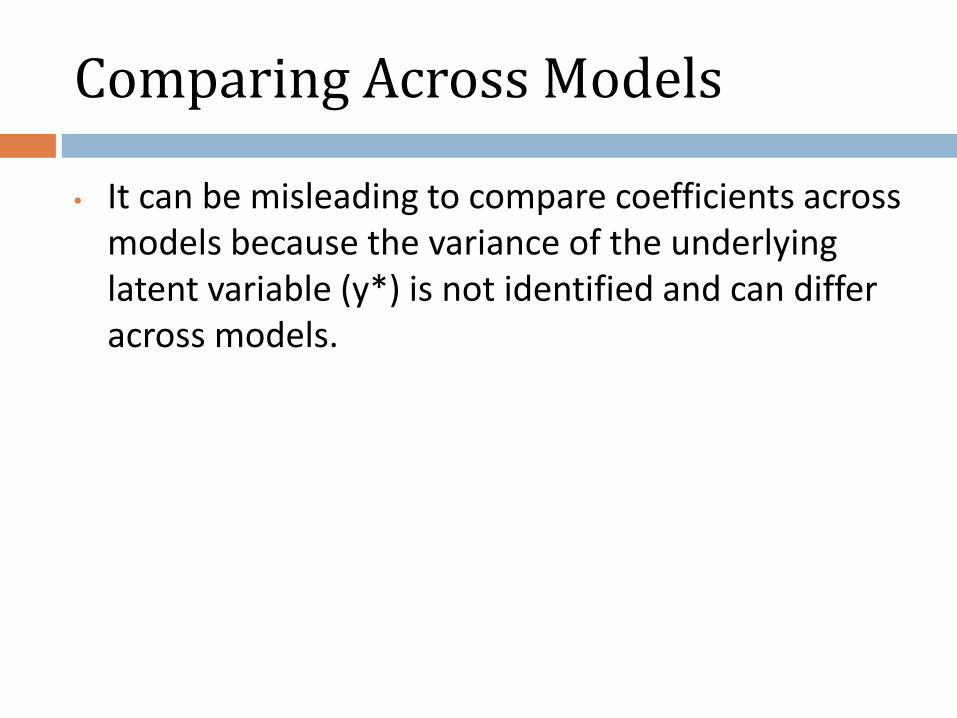
Comparing Across Models
• It can be misleading to compare coefficients across models because the variance of the underlying latent variable (y*) is not identified and can differ across models.

Some Possible Solutions to this Problem:
• Predicted Probabilities • Gives predicted values at substantively meaningful values of xk
• y*-standardized coefficients • Bk
sy* gives the standard deviation increase in y* given a one unit increase in xk,, holding all other variables constant.
• Fully standardized coefficients • Bk
s gives the standard deviation increase in in y*, given a one standard deviation increase in xk, holding all other variables constant.
• Marginal effects • The slope of the probability curve relating x to Pr(y=1|x), holding
all other variables constant
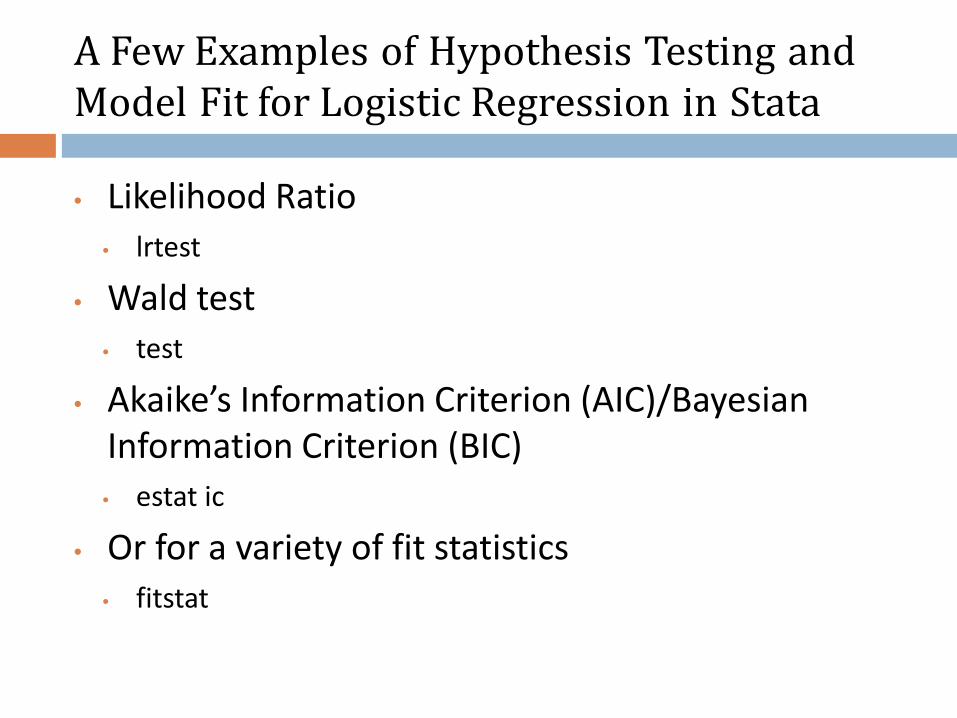
A Few Examples of Hypothesis Testing and Model Fit for Logistic Regression in Stata
• Likelihood Ratio • lrtest
• Wald test • test
• Akaike’s Information Criterion (AIC)/Bayesian Information Criterion (BIC) • estat ic
• Or for a variety of fit statistics • fitstat
References
• Agresti, Alan. An introduction to categorical data analysis. Vol. 423. Wiley-Interscience, 2007.
• Long, J. Scott. Regression models for categorical and limited dependent variables. Vol. 7. Sage, 1997.
• Powers, D., and Y. Xie. "Statistical method for categorical data analysis Academic Press." San Deigo, CA (2000).


![Day 4 [03 Sept€¦ · Web view2012/03/04 · GENMOD – generalized linear models LOGISTIC – [grouped] binary regression PROBIT – [grouped] binary regression (INVERSECL) CATMOD](https://static.fdocuments.us/doc/165x107/5f6460262813764a924bb395/day-4-03-web-view-20120304-genmod-a-generalized-linear-models-logistic-a.jpg)