An International Statistical Survey of ... - All Documents
94
_--__ ___ -~ -~_ W es I POLicY RESEARCH WORKING PAPER 1806 An International Statistical Detailed statistical ard econometric eviden,-e on Survey of (Government governmentemploynew Employment and Wages and pay,both global and Employmnent and wagesreinl regiornal. Salvatore Schiavo-Ca'ampo Gitdio de 7ommaso Amitabba Muckherjee Background paper for World Developmentt eport 1997 The World Bank Office of the Chief Economist anc Senior Vic., President, Development Econonmics and Europe and Central Asia, and Middle Last anJ North Africa Technical Departmenti Putblic SectorManagc rient antd Infor-nmation i echnology Team H August I 9q7 Public Disclosure Authorized Public Disclosure Authorized Public Disclosure Authorized Public Disclosure Authorized
Transcript of An International Statistical Survey of ... - All Documents
_--__ ___ -~ -~_ W es I
POLicY RESEARCH WORKING PAPER 1806
An International Statistical Detailed statistical ardeconometric eviden,-e on
Survey of (Government governmentemploynew
Employment and Wages and pay, both global andEmploymnent and wagesreinl regiornal.
Salvatore Schiavo-Ca'ampo
Gitdio de 7ommaso
Amitabba Muckherjee
Background paper for World Developmentt eport 1997
The World Bank
Office of the Chief Economist anc Senior Vic., President,Development Econonmics
and
Europe and Central Asia, and Middle Last anJ North Africa
Technical Departmenti
Putblic Sector Managc rient antd Infor-nmation i echnology Team HAugust I 9q7
Pub
lic D
iscl
osur
e A
utho
rized
Pub
lic D
iscl
osur
e A
utho
rized
Pub
lic D
iscl
osur
e A
utho
rized
Pub
lic D
iscl
osur
e A
utho
rized

POLIcY RESFARCH WORKING PAPER 1806
Summary findings
This paper complements a separate study in this Series Schiavo-Campo, de Tommaso, and Mukherjee briefly
("Government Employment and Pay: A Global and summarize the key findings of the earlier paper for the
Regional Perspective," Policy Research Working Paper reader's convenience and to permit this paper to stand
1771, May 1997) by providing the detailed statistical and alone. However, the purpose of the paper is to provide
econometric evidence on which that separate study is the country-by-country statistics. The reader is referred
based. to the companion paper for a description and analysis of
the main findings.
This paper - a joint product of the Office of the Chief Economist and Senior Vice President, Development Economics,
and Europe and Central Asia, and Middle East and North Africa Technical Department, Public Sector Management and
Information Technology Team- was produced as a background paper for AVorld Deuelopme7nt Report 1997 on the role
of the state in a changing world. Copies of this paper are available free from the World Bank, 1818 H Street NW,
Washington, DC 20433. PleasecontactMarinette Gueverra, room H12-001,telephone 202-473-2959, fax202-477-0669,
Internet address [email protected]. August 1997. (83 pages)
'rhe Policy Research Working Paper Series disseminates the findings of work in progress to encourage the exchange of ideas about
development issues. An objective of the series is to get the findings out quickly, even if the presentations are less than fully polished. The
papers carry the names of the authors and should be cited accordingly. 7'he findings, interpretations, and conclusions expressed in thispaper are entirely those of the authors. They do not necessarily represent the view of the WEorld Bank, its Executive Directors, or thecountries they represent.
Produced by the Policy Rusearch Dissemination Center

AN INTERNATIONAL STATISTICAL SURVEY
OF GOVERNMENT EMPLOYMENT AND WAGES
by
Salvatore Schiavo-CampoGiulio de Tommaso
Amitabha Mukherjee
Public Sector Management and Information Technology TeamTechnical Department for Europe, Central Asia, Middle East and North Africa
World Bank

i
AN INTERNATIONAL STATISTICAL SURVEYOF GOVERNMENT EMPLOYMENT AND WAGES
CONTENTS
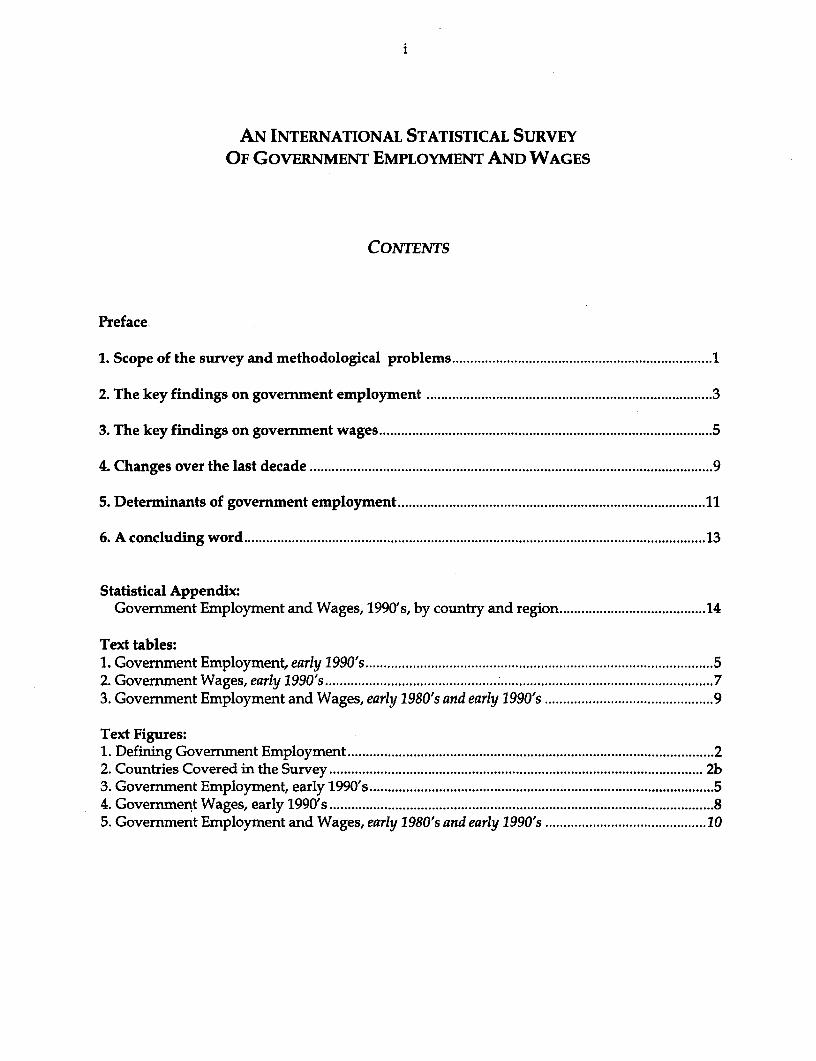
Preface.
1. Scope of the survey and methodological problems ............................................ l
2. The key findings on goverrnent employment ...................................................... 3
3. The key findings on governm ent wages ...................................................... 5
4. Changes over the last decade ..................................................... 9
5. Determinants of government employment ..................................................... .
6. A concluding word ..................................................... . 13
Statistical Appendix:Government Employment and Wages, 1990's, by country and region ........................................ 14
Text tables:1. Government Employment, early 1990's ..................................................... 52. Government Wages, early 1990's ........................ ;73. Government Employment and Wages, early 1980's and early 1990's .............................................. 9
Text Figures:1. Defining Government Employment ................................................... 22. Countries Covered in the Survey .................................................. 2b3. Government Employment, early 1990's ................................................... 54. Government Wages, early 1990's ................................................... 85. Government Employment and Wages, early 1980's and early 1990's . ........................................... 10
STATISTICAL APPENDIX TABLES
PageA-1: Population, Labor Force and Employment, in millions, all countries, recent years
I: Africa ................................. 16II: Asia ................................. 17III: Eastern Europe and Former USSR ................................. 18IV: Latin America and Caribbean ................................. 19V: Middle East and North Africa ................................. 20VI: OECD Countries ................................. 20
A-2: Public Sector Employment, all countries, recent years
I: Africa ................................. 21I.1 in thousandsI.2 as percentage of population1.3 as percentage of labor forceI.4 as percentage of total employment
II: Asia ................................. 25II.1 in thousandsII.2 as percentage of populationII.3 as percentage of labor forceII.4 as percentage of total employment
III: Eastem Europe and Former USSR ................................. 29
III.1 in thousandsIII.2 as percentage of populationIII.3 as percentage of labor force111.4 as percentage of total employment
IV: Latin America and Caribbean ................................. 33IV.1 in thousandsIV.2 as percentage of populationIV.3 as percentage of labor forceIV.4 as percentage of total employment
V: Middle East and North Africa ................................. 37V.1 in thousandsV.2 as percentage of populationV.3 as percentage of labor forceV.4 as percentage of total employment
VI: OECD Countries ............................ 39
VI.1 in thousandsVI.2 as percentage of populationVI.3 as percentage of labor forceVI.4 as percentage of total employment

A-3: Public Sector Wages, Manufacturing Wages and Per Capita GDP, all countries, recent years
I: Africa ........................... 41II: Asia ........................... 41
III: Eastern Europe and Former USSR ........................... 42IV: Latin America and Caribbean ........................... 42V: Middle East and North Africa ........................... 43
VI: OECD Countries ........................... 43
Methodological and Technical Notes ...................................... 45
Sources ..................................... 49

PREFACE
This paper complements a separate study in this Series ("Government Employment andPay: A Global and Regional Perspective") by providing the detailed statistical andeconometric evidence on which that separate study is based. A brief summary of keyfindings is included here for the reader's convenience and in order to permit this paperto stand alone. The reader interested in the broader discussion or in policy issues isreferred to the separate study--which also provides the full bibliographical referencesand proper acknowledgments of all those who helped or commented.

1
1. SCOPE OF THE SURVEY AND METHODOLOGICAL PROBLEMS
a. Methodological Problems
As Heller and Tait (1983, p. 35) noted: "It is surprising and depressing how littleinformation is readily available on public sector employment and pay". Although thisstudy attempts to remedy, in part, this state of affairs, the paucity of readily availabledata is explained by persisting methodological difficulties. There is no more hazardouscross-country comparison than in the area of "civil service" employment and wages.The following methodological problems have been pointed out years ago and are stillpresent. For a detailed listing and discussion, the reader is referred to Heller and Tait(1983). The Notes to the Statistical Appendix explain in detail the definitions andsources used in this survey.
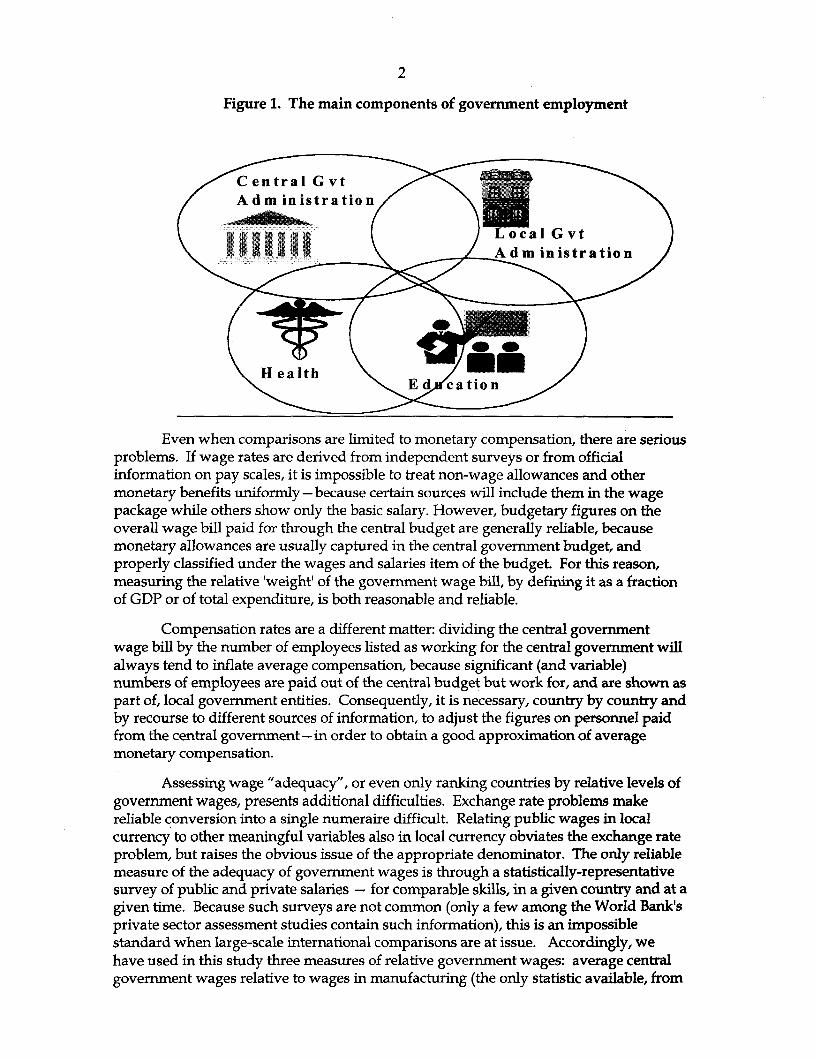
In the first place, statistics of any reliability simply don't exist in many countries.When reasonable data are available, employment comparisons are complicated by thefact that some countries include teachers and/or health workers in the civil service,others don't; some countries include contractual and seasonal (sometimes even daily)workers in government employment, others don't; local government employment mayor may not include employees paid out of the central government budget; accordingly,large numbers of persons may be paid out of the central budget but are not listed amongcentral personnel; paramilitary personnel (gendarmes, carabinieri, etc.) may be includedin civilian personnel because of their public order functions, or in the armed forcesbecause of their military status; employees of legislative bodies are sometimes includedin government personnel, etc. And, because the basic social services - education andhealth-raise different policy and practical issues than government administration, it isuseful to try and separate out employment of teaching and health personnel.
Figure 1 illustrates the overlapping nature of the main components ofgovernment employment, and the resulting gray definitional areas. The methodologicaldifficulties arise because the intersection of the various components differs in differentcountries, and the definition of certain personnel in one or another category itself has aninevitable arbitrary and/or country-specific element. In this survey, we have taken careof using clear and uniform definitional criteria, country by country, and avoid anyoverlap between the four components. Consequently, the figures in the tables areadditive and without duplication.
International comparisons are even more problematic for government wagesthan they are for employment. To begin with, the existence of different benefits-in-kindin different countries makes it impossible to be sure that differences in monetarycompensation adequately reflect differences in total compensation.
Unlike the following sections, which only present the gist of the findings (discussed at greater length in the companionpaper "Government Employment and P ay: A Global and Regional Perspective.), a fuller methodological discussion isincluded here in order to permit the user to place the data in proper perspective. The Statistical Appendix also includesdetailed methodological considerations.
2
Figure 1. The main components of government employment
/ Adm inistration/
% liiXlXilll ,/ _~A d mnin istration
Health atio;
Even when comparisons are limited to monetary compensation, there are seriousproblems. If wage rates are derived from independent surveys or from officialinformation on pay scales, it is impossible to treat non-wage allowances and othermonetary benefits uniformly -because certain sources will include them in the wagepackage while others show only the basic salary. However, budgetary figures on theoverall wage bill paid for through the central budget are generally reliable, becausemonetary allowances are usually captured in the central government budget, andproperly classified under the wages and salaries item of the budget. For this reason,measuring the relative 'weight' of the government wage bill, by defining it as a fractionof GDP or of total expenditure, is both reasonable and reliable.
Compensation rates are a different matter: dividing the central governmentwage bill by the number of employees listed as working for the central government willalways tend to inflate average compensation, because significant (and variable)numbers of employees are paid out of the central budget but work for, and are shown aspart of, local government entities. Consequently, it is necessary, country by country andby recourse to different sources of information, to adjust the figures on personnel paidfrom the central government-in order to obtain a good approximation of averagemonetary compensation.
Assessing wage "adequacy", or even only ranking countries by relative levels ofgovernment wages, presents additional difficulties. Exchange rate problems makereliable conversion into a single numeraire difficult. Relating public wages in localcurrency to other meaningful variables also in local currency obviates the exchange rateproblem, but raises the obvious issue of the appropriate denominator. The only reliablemeasure of the adequacy of government wages is through a statistically-representativesurvey of public and private salaries - for comparable skills, in a given country and at agiven time. Because such surveys are not common (only a few among the World Bank'sprivate sector assessment studies contain such information), this is an impossiblestandard when large-scale international comparisons are at issue. Accordingly, wehave used in this study three measures of relative government wages: average centralgovernment wages relative to wages in manufacturing (the only statistic available, from

COUNTRIES COVERED IN OUK bum. v jut
is 3 &
lII no data
I s hcomplete data
Werld2 Map 1 World2 Map 1

3
the Intemational Labor Organization, for a large number of countries on a uniformbasis); average wages as a multiple of per capita GDP; and what secondary sources doexist concerning the ratio of public to private wages for a few countries in each region.
These difficulties preclude the inclusion of all countries. We were able to collectand verify government employment and wage data for 80-100 countries in the early1990s, including all sizable countries in every region (with the single exception of Braziland Mexico) - the largest such survey to-date, accounting for about 90 percent of theworld's population. (see Figure 2). As the source statements in the Statistical Appendixexplain in detail, country by country, the information covered in this survey wasobtained from international surveys, intemational and national country reports, WorldBank, UN, OECD and IMF reports--and was verified with IMF and World Bank countryeconomists and in many cases with World Bank Resident Missions. Note that theAppendix tables show all countries, whether or not reliable and complete data could befound. The text tables and the regional averages are based only on countries for whichreliable data could be found or estimated concerning: central governmentadministration employment; local government administration employment; teachers;and health personnel. In the course of the research, we also came across information onemployment in state-owned enterprises and the military. This information is partial,not verified, and not used in the text: it is included in the Statistical Appendix becauseof the low cost of doing so and because it may be useful to the reader for other purposes.However, this paper deals exclusively with government employment and wages andnot at all with employment in public enterprises or the military - which raises quitedifferent policy and empirical questions.
Although the size of the sample for each region is sufficiently large to make itrepresentative of the region as a whole (see Figure 2), the above qualifications make itclear that one should take the regional averages shown below only as pointers forfurther analysis. For example, the extremely low civil servants' compensation in EasternEurope and the former USSR is, in part, a clue to the many in-kind subsidies andbenefits enjoyed by public employees in that region. In a real sense, it is the country-by-country data in the Appendix which matter, although even these can be quitemisleading in the absence of knowledge of the country and the circumstances.
2. THE KEY FINDINGS ON GOVERNMENT EMPLOYMENT
Table 1 and Figure 3 show civilian employment in central and local governmentadministration, and teaching and health employment in the various regions - aspercentage of population. The key findings are as follows:
worldwide, total government civilian employment currently averages (on anunweighted basis for all the countries of the sample) about 4.7% of population.It is relatively largest in the developed market economies of the OECD (7.7% ofpopulation), and second largest in Eastern Europe and the former Soviet Union(Europe and Central Asia - ECA), at 6.9% of population. Governmentemployment is relatively smallest in Africa and Asia (respectively, 2.0% and2.6% of population). Latin America and the Caribbean (LAC), and the MiddleEast and North Africa (MENA) are in between, with employment accounting forabout 3.0% and 3.9% of population respectively;

4
* relative to total employment (see Table A-2), the inter-regional differences aremuch less marked, because of the significantly lower labor participation rate andhigher unemployment in developing regions. The regional rankings changesomewhat, moreover, with MENA moving up to the highest regional average.Worldwide, civilian government employment accounts on average for about11% of total employment, with MENA countries highest at 17.5 %, OECD at17.2%, ECA and LAC at 16.0% and 8.9%, respectively. Africa and Asia are at thelow end with 6.7% and 6.3%, respectively;
* the picture changes if teachers and health personnel are excluded. Because ofthe large numbers of such personnel in ECA (from long-standing Soviet policy),the large overall employment in those countries is primarily in teaching andhealth. The central administration in that region is comparatively not large, andis very small in the former Soviet republics. Among developing regions, centraladministration is largest in the Middle East and North Africa. Overall,government administration in developing regions, at 1.7% of population, is lessthan half the relative size of OECD countries. Education and health personnel,too, average in developing regions (excluding ECA) less than half the level ofOECD countries;
* during the 1980s, local government administration has grown to almost equalemployment in central administration. Clearly, civil service reform efforts arebadly incomplete if they do not include consideration of local govenmment and ofteaching and health personnel;
* predictably, inter-country and inter-regional variance is smallest for overallgovermment employment (with a coefficient of variation of 0.48), than for eithercentral or local administration or for education and health personnel. The inter-country variability of government employment is the only category for whichthere is no difference between industrial and developing countries, suggestingthat the range of choices on the role of government does not diminish witheconomic growth. If there is a tendency toward "convergence" in publicadministration, it is not bome out by the facts of govemment employment.
* the relatively low variance in LAC for total govemment employment, combinedwith the high variance for central administration, local administration andhealth/education taken separately, points to the inverse correlation existing inthat region between the size of central government and that of localadministration. (The reasons are summarized in the next section);
* the high variance of teaching and health personnel in ECA (with a 9.0 coefficientof variation) results from a clear difference between Eastern Europe and theformer USSR -with public employment in social sectors relatively much lowerin Eastem Europe. To some extent, these sub-regional differences existed beforethe fall of the Berlin Wall in 1989. But in part, the difference is due to greaterefforts in Eastern Europe since 1989 to improve education and health serviceefficiency and, to that extent, reduce personnel requirements.

5
Table 1. Government Employment, early 1990s(as percent of population)
No. of General Government Administration Teaching &Countries0 Government Central Local Health
Africa :iW20 2.0 0.9 0.3 0.8Asia 11 2.6 0.9 0.7 1.0Eastern Europe & former USSR 17 6.9 1.0 0.8 5.1
Latin America & Caribbean 9 3.0 1.2 0.7 1.1
Middle East & North Africa i MI 3.9 1.4 0.9 1.6
OECD 21! 7.7 1.8 2.5 3.4
Overall 86 4.7 1.2 1.1 2.4Source: Table A-2. All averages are unweighted.
Figure 3. Govermnent employment, early 1990s(various recent years)
8.0
7,0g6.0
5.0 O~~~~~~~~~~~~~~~~~Teaching & Health14.0 ULocal
Z3.0 E aCentral
2.0
1.0
00 Africa Asia ECA LAC MENA OECD
3. THE KEY FINDINGS ON GOVERNMENT WAGES
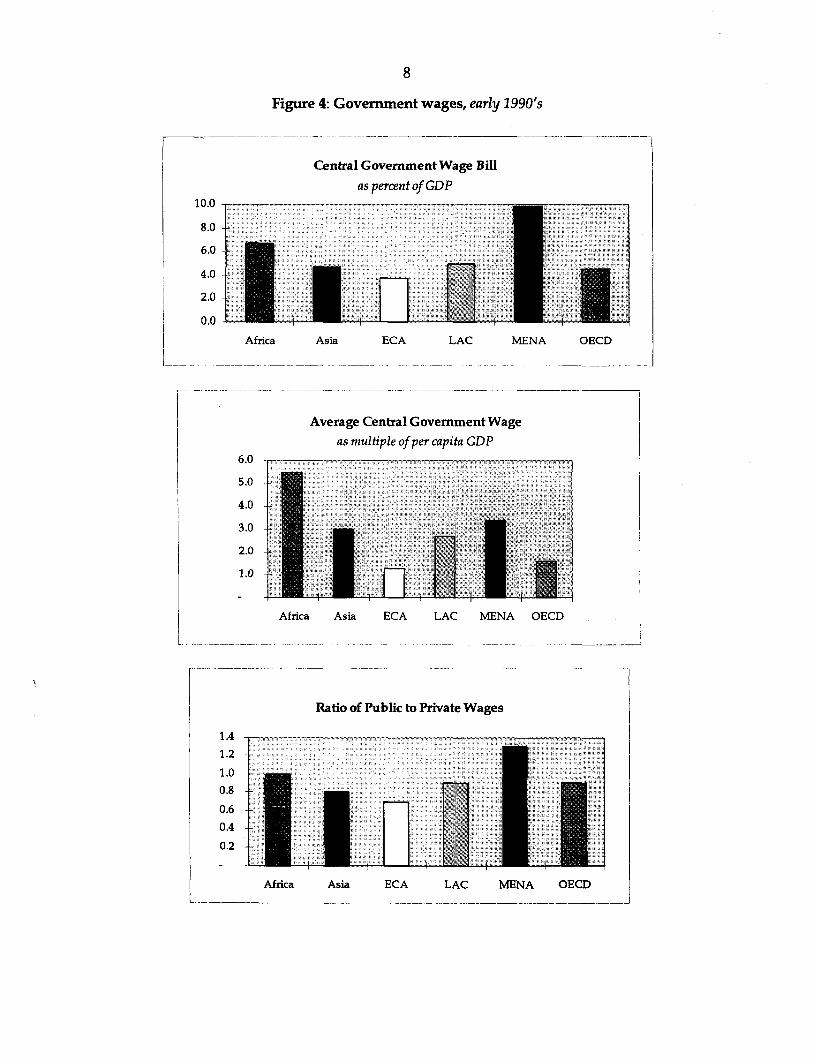
Table 2 and Figure 4 show the fiscal weight of the central government wage bll,and average wages as a multiple of per capita GDP and in relation to private wagelevels. The reader should keep in mind the qualifications made earlier concerninginternational comparisons of public wages and the relative nature of the notion of"adequacy". Note also that, while the data for the wage bill ratio and for average wagesas multiple of GDP are averages for over 90 countries - and therefore highlyreprese-ntative - the ratios of public to private sector wages come from a handful ofcountries for which evidence (primary or secondary) can be found. The reader is

6
therefore advised to treat all of these figures -and especially those in the last column,with a large dose of salt.
The main findings are:
* Globally, the central government wage bill absorbs about 5.4% of GDP. Withwage rates for local government roughly estimated from information for a fewcountries at about three-fourths of central government wages, and based on theemployment information shown in Table 1, total civilian government salariescan be estimated to absorb about 9% of GDP as a worldwide average;
* the heaviest fiscal weight of the central government wage bill is in the MiddleEast and North Africa (9.8% of GDP), followed by Africa at 6.7% of GDP. Asia,the OECD countries and Latin America are all between 4.5% and 5% of GDP,and the lowest percentage of GDP is accounted for by the central governmentwage bill in Eastern Europe and former USSR (although from the greaterincidence of benefits in kind);
* when measured as a multiple of per capita GDP, central government wagesappear higher in Africa than in any other region, apparently contrary towidespread evidence concerning deterioration of public wages in Africa. Thisfinding, however, is largely due to the lower participation rate in Africancountries (see Table A-1) and the higher (although unquantifiable) degree ofunderestimation of informal production and thus of GDP per capita.Furthermore, the African average is influenced by comparatively high salaries infranc-zone countries, which are 7-11 times per capita GDP. It is, thus, entirelypossible that government wages may still be higher than needed to attract andretain qualified government personnel in franc-zone countries. In most of therest of Africa, instead, the widespread consensus about wage inadequacy is mostprobably right;
* conversely, the relatively low multiplier for OECD countries is related to thehigher participation rate as well as the much higher GDP and smaller skilldifferentials between public employees and the rest of the working population.As noted earlier, the low figure for ECA is in part explained by the existence of avariety of benefits-in-kind which are not captured in the available data. But thereality of government wage inadequacy in the region (especially the formerSoviet Union) is undeniable;
* the above findings are supported by data for 16 countries, from a variety ofsources, concerning the relationship of public to private wages for comparableskill-mixes. Although the data are fragmentary and for a small sample, thepicture conforms roughly with the findings from the other indicators. Generally,government employment carries a "discount" of 10-20% -which is notunreasonable considering the greater job security. The lowest relative publicwages are found in ECA; in this case, the figure is less misleading than the
Another indicator of relative public wages exists as well: the ratio of public wages to average wages in manufacturing.
This indicator permits much broader country coverage, because manufacturing wage data are collected and published bythe ILO for a large number of countries on a regular basis. However, it gives a mnisleading comparison, as public wagesare generally for white-collar skills, while wages in manufacturing are generally for lower-paid blue-collar jobs. Thecomparison (which we have carried out and is included in Table A-3 but is not shown in the text of fthis paper) is alsomisleading from a policy viewpoint-for it produces the false impression of a relatively well-off civil service.

7
* simple multiple of per capita GDP, because "private" employees in the regionalso receive a variety of in-kind benefits. The highest government wages arefound in the Middle East and North Africa, about one-third higher thancomparable private compensation;
* at the risk of sounding pedantic, we must conclude this section with the samecaveat as for employment: wage policy recommendations cannot be based onsuch aggregate evidence as presented here. However, the regional evidencedoes give some context to individual country data, and provides a basis forassessing broad trends over time -to which we now turn.
Table 2. Central Government Wages, 1990s
Average CentralCentral Government Government Wage as Ratio of Public to
No. of Wages and Salaries as Multiple of per capita Private sectorcountries % of GDP GDP wages
Africa 21 6.7 5.7 1.0Asia 14 4.7 3.0 0.8ECA 21 3.7 1.3 0.7LAC 12 4.9 2.5 0.9MENA 8 9.8 3.4 1.3OECD 16 4.5 1.6 0.9
Overall 92 5.4 3.0 0.8Soume Table A-3 for the fit twocolumns; various refs and World Bank pro documents, for about 16 counies, for the ratio ofpublic and privste wages.
8
Figure 4: Government wages, early 1990's
Central Government Wage Billas percent of GDP
10.0 - __
8.0
6.0
4.0
2.0
0.0
Afnica Asia ECA LAC MENA OECD
IF
Average Central Government Wageas multiple of per capita GDP
6.0 -
5.0
4.0
3.0
2.0
1.0
Africa Asia ECA LAC MENA OECD
Ratio of Public to Private Wages
1.4
1.2
1.0 -
0.8
0.6 -0.4
0.2
Africa Asia ECA LAC MENA OECD

9
4. CHANGES OVER THE LAST DECADE
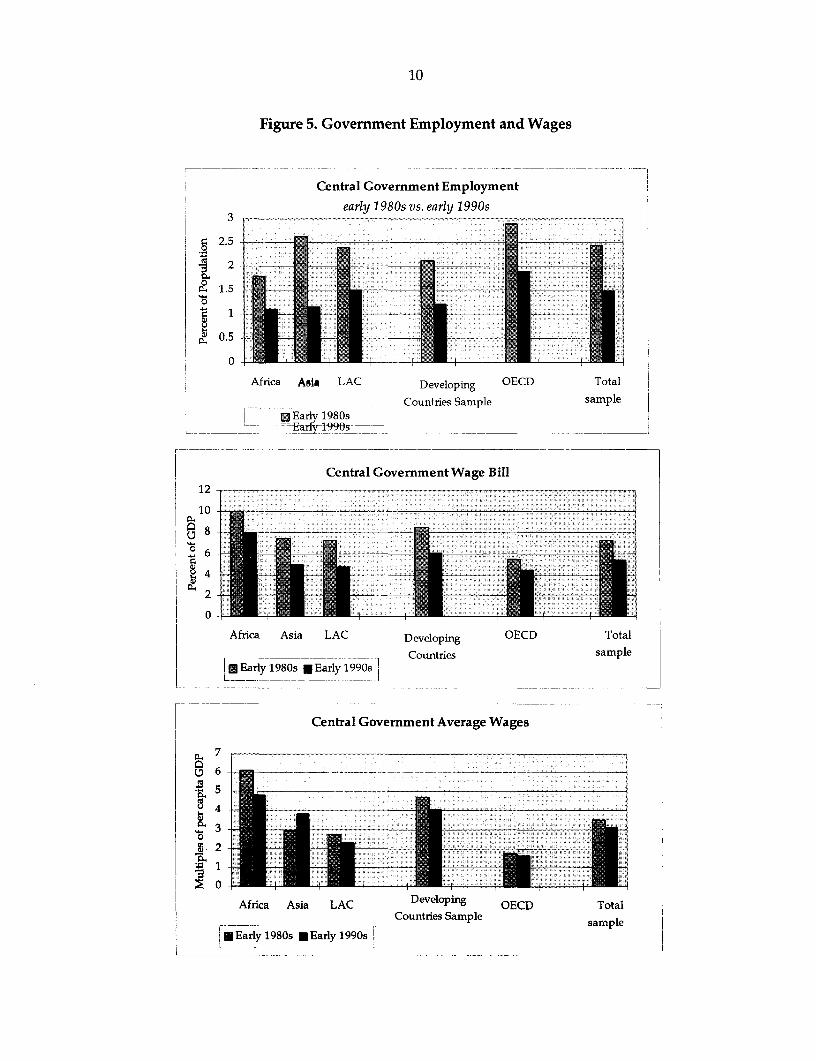
In 1983, Peter Heller and Alan Tait produced an international comparison ofgovernment employment and wages covering a sample of about 45-50 countries. Table3 and Figure 5 compare some of their findings with our data for the same countries(hence different data from our larger sample). Furthermore, for comparability, it isnecessary to limit the sample to central government and wages only. Nevertheless, thetrends are clear. The following points emerge:
* A large contraction in both central government employment (relative to population)and the relative wage bill is evident in all regions, with the relative size of centralgovermnent shrinking by about one-third when measured by employment and one-fourth when measured by the wage bill;
* Over the last 10-15 years, central government employment decreased in relativeterms across the board, from about 2.5% of population to 1.5%;
Table 3. Government Employment and Wages,
early 1980s and early 1990s
Central GovernmentCentral Governmenf as Central Government wage average wages as multiplepercent of population bill as percent of GDP of per capita GDP
N Early 1980s Early 1990s 4' Early 1980s Early 1990s Early 1980s Early 1990s
Africa 1.8 1.1 g 10.0 7.9 X 6.1 4.8Asia 2.6 1.1 7.5 4.9 2.9 3.8Latin America , 2.4 1.5 7 7.3 4.7 , 2.7 2.3
DevelopmngjI,counity sampleg V 2.2 1.2 2 8.5 6.1 4.7 4.1
OECD countries 25 2.9 1.9 i, 5.5 4 4 1 .71.6
Total sample . 2.5 1.5 7.3 54 3.7 3.2Source: Forearly 1980s Hellerand Tait, 1983;forearly 1990's Annex A-3, Annex A4.
*Note that the datafor the early 1990's are limited to the Heller and Tait sample.They are therefore differentfrom those for
the largersample in this stufdy. N represents the number of countries in the sample.
* Among developing regions, the reduction in relative government employmenttook place in Africa and Asia. In Asia, this reduction was partly offset bygrowth in local government. In LAC, an equally impressive reduction in centralpersonnel is almost entirely explained by a vast shift from central to localgovernment. In Africa, total government employment fell in the 1980s bothrelative to population and slightly in absolute terms;
10
Figure 5. Government Employment and Wages
Central Government Employment
early 1980s vs. early 1990s3I
2.52 1=|.l1.
0)
0.5
0
Africa Asia LAC Developing OECD Total
Countries Sample sampleK Q___ OEarly 1980s 1, _ '=-X --~E_ly 1990s -= - ---- __
Central Government Wage Bill12 -_
_ __ _
P. 1 2 N10 -____ _______ _ ____
I 8- ___--L-*__ _ i -___ - -____
0 6
20
Africa Asia LAC Developing OECD Total
L!Ž._y~80s ~ Countries sample
Central Government Average Wages
7
6 ___--- -------- -- -- -- __
i5E-
.0 I U - --
Africa Asia LAC Developing OECD Total19s E l I99 Countries Sample sample
| EEarly 1980s * Early 1990s

11
* Central government wages fell in the 1980s by about 14% when measured as a multipleof per capita GDP. However, the decline was slight in OECD countries and substantialin Africa, with government salaries holding their own in LAC, and apparentlyincreasing in Asia. Thus, it is developments in Africa which are largely responsible forthe decline in relative government wages worldwide. Furthermore, this declineoccurred during a decade of economic deterioration and negative growth in Africa. Inthe 1980s, consequently, while the economic welfare of the average civil servantimproved slightly worldwide, and significantly in Asia, it declined sharply in Africa;
* For the developing country sample as a whole, the decline in the relative weight of thecentral government wage bill in the 1980s was a remarkable 28 percent.
5. THE DETERMINANTS OF GOVERNMENT EMPLOYMENT
According to Wagner's Law, the government tends to expand in relative size as theeconomy grows--both because of a consensus in favor of enlarging access to social services andbecause of a tendency for all large organizations to expand. Earlier studies gave some supportto this proposition, and also brought out the positive association of government employmentwith education levels, availability of financing, and of course, population.
This study, based on a larger data set, confirms that population is by far the largestsingle influence on government employment levels, swamping the influence of any othervariable. However, beyond this rather obvious finding, we have estimated the influence onemployment relative to population of the following variables: (i) per capita income;(ii) government wages relative to per capita income; (iii) the fiscal deficit relative to GDP; and(iv) population itself. The equation has been estimated globally for each region, and separatelyfor central government administration, local government administration, and publicemployment in the social sectors.
The Annex shows, globally and for each region, and for central governmentadministration, local government administration, and public employment in the social sectors,the results of estimating the following equation:
E = f (C, GDP, WAG, DEF, POP), where
E = government employment as percent of population;GNP = per capita GDP in US dollars;
WAG = average central government wage as percent of percapita GDP (both in local currency);
DEF = central government fiscal deficit as percent of GDP(both in local currency);
POP = population in thousands.

12
The suffixes in the Annex denote the following: CG, LG, SS are respectively,employment as percentage of population in central government, local government, andeducation and health, and GG is general government, i.e., the total of the above: ES denotes theentire sample; DEV denotes non-OECD countries, OECD, AFR, AS, ECA, LAC and MENA thevarious regions. (Thus, for example, GGLAC means total civilian government employment aspercent of population in the Latin American sample of countries).
Taken as a whole, the results are consistently significant. With respect to the individualvariables, the association with all three categories of relative government employment is closeand positive for per capita income (confirming Wagner's Law); and close and negative forrelative wages (confirming the standard expectation). For population, a significant, andnegative, association is found only with relative central government employment in OECD andLAC countries (suggesting economies of scale in highly-developed central administrations).And the expected positive association of central government employment with the fiscal deficitis visible only in some developing regions--and then very weakly--with no significantrelationship emerging anywhere else or for other categories of government employment.Clearly, it is the availability of financing which matters--as found in earlier studies-and not thesize of the deficit per se.
The global findings, however, are almost entirely due to strong results in Africa andLAC. In ECA, the lack of significant results is only to be expected, given the special datadifficulties and the magnitude and fluidity of the transition. In Asia, it would appear thatcountry-specific characteristics (other than income, wages, the deficit or population) aredominant; more detailed research, however, is needed before ruling out the influence of percapita income or of relative wages on government employment in that region. On balance,there is conclusive evidence that in developing countries relative government employment,other things being equal, is higher where per capita income is higher and relative wages arelower.
In OECD countries, the only significant association is the one previously noted betweenpopulation and central government employment. The lack of association between governmentemployment and per capita income is particularly interesting, suggesting either that theWagner tendency was counteracted by deliberate policy in the 1980s, or that "Wagner's Law"becomes inoperative beyond a certain level of development (or both).
6. A CONCLUDING WORD
Concerning the comparison of government employment and pay, it is essential to pointout that differences in government size, or in relative wages, by themselves, show broad trendsand "flag" possible concerns, but cannot be allowed to form the basis for policyrecommendations. In-depth country-specific analysis is needed to justify any recommendationconcerning the size of government employment or the adequacy of the level and structure ofwages.
Concerning the determinants of government employment, there is no longer areasonable doubt that in developing countries comparatively high central government

13
employment is associated with comparatively high per capita income and lower relative wages.But, of course, statistical associations say nothing about causality or its direction. Furthermore,the Wagner tendency is just that-a tendency--which, as the data for the OECD suggest, can becounteracted by deliberate policy. Concerning wages and employment, it would be especiallyrisky to infer from cross-sectional data anything concerning the likelihood that wages wouldrise (or fall) if emplovment were reduced (or increased) in any particular country. All one cansay is the obvious, albeit powerful, statement that retrenchment offers the possibility ofimproving employee compensation, while employment expansion carries a strong risk oferoding wages.
14
STATISTICA-L APPENDIX


-16-TABLE A-1
POPULATION, LABOR AND EMPLOYMENTQn thousands and percnt)
Population Labor Participation Unemployed Employed Unemployment Non-AgriculturaAFRICA Force Rate (%) Rate (%) Employment
(1) (2) (3) (4) (5) (6) (7)
Angola 10,442 4,907 47 736 4,171 15Benin 5,325 2,377 45Botswana 1,401 492 35 123 369 25 219Burkina-Faso 10,118 5,276 52 27 5,249 1Burundi 5,500 3,322 60 7 3,315 38Cameroon 12,986 5,226 40 1,307 3,920 25Cape Verde 372 122 33 31 91 25Central A R 3,234 1,565 48 470 1,096 30 13Chad 6,288 3,009 48Comoros 446 127 28 25 101 20Congo 2,577 1,041 40 20C3te d'lvoire 13,841 5,020 36 351 4,669 332Djibouti 603 191 32 57 134 7Equatorial Guine 386 166 43 30Eritrea 3,579 .Ethiopia 54,890 23,495 43 63 23,432 583Gabon 1,301 606 47 93Gambia 1,079 531 49 24Ghana 16,639 7,900 47 790 7,110 172Guinea 6,425 3,139 49 10Guinea-Bissau 1,044 503 48 201 302Kenya 26,017 12,923 50 4,523 8,400 40 1170Lesotho 1,942 808 42 323 485 35 1162Liberia 2,719 1,168 43 40Madagascar 13,100 6,785 52 16 6,769 210Malawi 9,532 5,075 53 273Mali 9,524 5,180 54Mauritania 2,215 1,015 46 203 812 20Mauritius 1,115 460 41 7 453 2 251Mozambique 15,463 8,390 54 _Namibia 1,508 625 41 136 489 22 184Nigeria 108,014 43,059 40 12,057 31,002 28Niger 8,730 4,238 49 1,907 2,331 45Rwanda 7,755 4,099 53 22SaoTome& Prin 125 69 15 54 27Senegal 8,263 3,630 44 374 3,256 10Seychelles 72 21Sierra Leone 4,399 1,638 37 .Somalia 8,775 4,153 47 63South Africa 40,440 15,817 39 5,156 10,661 33 4951Sudan 27,364 10,073 37 5 10,068 30Swaziland 906 292 32 44 248 15 75Tanzania 28,019 13,771 49 2,754 11,017 20Togo 3,885 1,503 39 258 1,247 17 56Uganda 18,026 8,875 49Zaire 41,231 14,113 34Zambia 8,936 2,934 33 5871 2,347 20 322Zimbabwe 10,739 4,286 40 1,929 2,357 45 947
__ERAGE _ _ 43 _ _ 15
Column averages enconpass only those countries for which the Infonnaton is complete

-17-TABLE A-1
POPULATION, LABOR AND EMPLOYMENT(in thousan4s and prcent)
Population Labor Participation Unemployed Employed Unemployment Non-AgriculturalASIA Force Rate (%) Rate (%) Employment
______________ (1) (2). (3) (4) (5) (6) (7)
Afghanistan 22,789 7,877 35 996 6,881 13Bangladesh 117,941 58,873 50 15,307 43,566 26 15,804Bhutan 675 24,542
Cambodia 9,951 4,949 50China 1,190,918 715,419 60 19,316 696,103 3 262,540Fiji 767 283 37 15 268 5 93India 913,600 394,330 43 36,758 357,572 9 24 542Indonesia 190,389 88,651 47 2,660 85,991 3 35 251Kiribati 76 9,691
Korea 44,453 21,221 48 424 20,797 2 12 116Lao PDR 4,748 2,316 49 486 1,830 21Malaysia 19,047 7,653 40 222 7,431 3
Maldives 246 100 41 42
Marshall Islands 1,432
Micronesia 108 4,140
Mongolia 2,363 1,152 49 72 6
Myanmar 45,581 23,170 51 541 23,168 2 5,266
Nepal I
Pakistan 126,284 48,595 38 4,860 43,736 10 17 362
Papua New Guinea
Philippines 67,038 27,104 40 2,439 24,665 9 3,166
Singapore 2,930 1,384 47 37 1,347 3 1,644
Sri Lanka 17,865 7,480 42 831 5,201 14 386
Solomon Islands_
Thailand 58,064 31,063 53 994 30,069 3 9,886
Tonga 19
Vanuatu 161 80 50 13 67 16 17
Vietnam 72,510 31,819 44 2,323 29,49 7 9
AVERAGE 46 8
Column averages encompas only those countries for wIhch the informatIon is complete

-18-TABLE A-1
POPULATION, LABOR AND EMPLOYMENT(n tsouwad and pmelnt)
EASTERN Population Labor Participation Unemployed Employed Unemployment Non-AgriculturalEUROPE AND Force Rats (%) Rate (%) Employment
FORMER USSR (1) (2) (3) (4) (5) (6) (7)
.Ibania 3,202 1, 704 53 307 1,397 18 646losnia 3,776 1,054 28lulgaria 8,870 4,500 51 720 3,780 16 1,893.roatia 4,511 1 900 42 247 1,653 13 1,052'zech Republic 10,296 5 010 49 165 4,845 3 4,699iungary 10,210 5,353 52 557 4,796 10 3,747wlacedonia 2,075 947 46 185 508 20 362'oland 38,303 20,126 53 3,180 16,946 16 11,602.Romania 22,761 12,082 53 965 11,117 8 6,017Slovakia 5,313 2,350 44 348 2,002 15 1,957Slovenia 1,937 743 38 107 636 14 796Serbia 10,394 6,747 65 1,496 5,251 22Turkey 59,597 25,153 42 3,169 21,984 13 3,906
Former Soviet UnionArmenia 3,731 1,633 44 84 1,549 5 983Azerbaqan 7,384 2,877 39 400 2,477 14 1,668Belarus 10,188 4,826 47 68 4,758 1 3,492Estonia 1,492 716 48 51 665 7 422Georgia 5,446 2,521 46 126 2,395 5 1,230Kazakhstan 16,952 7,390 44 81 7,309 1 6Kyrgyz R 4,590 1,839 40 218 1,621 12 896Latvia 2,530 1,397 55 208 1,189 15 1,002Lithuania 3,712 1,841 50 112 1,729 6 1,284Moidova 4,408 2,052 47 21 2,031 1 912Russia 148,673 72,610 49 5,664 66,946 8 60,992Tajikistan 5,767 1,912 33 38 1,874 2 962Turkmenistan 3,921 1,573 40 22 1,551 1 925Ukraine 51,551 24,028 47 72 23,956 0 17,708Uzbekistan 21,860 8,285 38 188 8,097 2 4,485AVERAGE 46 9

-19-TABLE A-1
POPULATION, LABOR AND EMPLOYMENT(in thousands and pwrnt)
LATIN AMERICA Population Labor Participation Unemployed Employed Unemployment Non-AgriculturalAND :Force Rate (%) Rate(%) Employment
THE CARiBBEAN (1) : (2) (3) (4) (5) (6) (7)
kntigua & Barbuda 64 29 44 | _ Tkrgentina 34,194 13,225 39 1,587 11,638 12 10,5243ahamas 272 139 51 18 121 13 1143arbados 260 134 52 28 106 21 953elize 211 68 32 8 60 11 483ermuda 63.Bolivia 7,237 2.90C 40 180 2,720 6 i,178Brazil 159,128 71,021 45 3,480 67,541 5 47,920Chile 13,994 5,468 39 328 5,140 6 4,179Colombia 36,330 14,513 40 1,147 13,366 8 4,773Costa Rica 3,304 1,288 39 52 1236 4 669Dominican Republic 7,622 3,184 42Ecuador 10,980 3,582 33 254 3,328 7 2,509El Salvador 5,635 2,147 38 81 2,066 4 244Guatemala 10,322 3,654 35 1 3,653 609Guyana 826 342 41 8 334 2 _
Honduras 5,750 1,948 34 195 1,753 10 1,035Jamaica 2,497 1,243 50 172 1,072 14 662Mexico 88,543 35,430 40 3,472 31,958 10 23,990Nicaragua 4,156 1,503 36 243 1,260 16 186Paraguay 4,788 1,810 38 203 1,607 11 1,009Peru 23,238 8,414 36 1,262 7,152 15 2,671Suriname 407 148 36 17 131 84Trinidad and Tobago 1,295 519 40 100 419 19 275Uruguay 3,163 1,414 45 127 1,287 9 588Venezuela 21,177 8,222 39 740 7,482 9 5,588AVERAGE 39 9
Column averages encompass oniy those countries for which the infonation is complete

-20-TABLE A-1
POPULATION, LABOR AND EMPLOYMENTMIDDLE EAST Population Labor Participation Unemployed Employed Unemployment Non- Agricultural
AND Force Rate (%) Rate (%) EmploymentNORTH AFRICA (1) (2) (3) (4) (5) (6) (7)
Algeria 26,722 6,503 24 1,951 4,552 30 3,413Bahrain 516 271 52 41 230 1 5Egypt 57,556 16,013 _ 28 1,745 14,268 . 1 _ 11 6,714Jordan 4,102 1,124 27 169 955 15 311Lebanon 3,855 992 26 347 645 35Morocco 25,945 8,567 33 1,371 7,196 ___ 16 3,369Syria 13,65i6 _ _3,491 25 262 3,229 8 2,333Tunisia 8,656 2,818 33 451 2,367 16 1,469WB-Gaza 2,500 369 1 5 144 225 39Yemen 13,196 2,885 22 793 2,092 28AVERAGE 29' 211
Population Labor ParUcipation Unemployed Employed Unemployment Non-AgriculturalOECD Force Rate (%) Rate (%) Employment
(1) (2) (3) (4) (5) (6) (7)
Australia 17,598 8,268 47 736 7,532 9 5,740Austria 7,987 3,470 43 149 3,321 4 3,329Belgium 10,048 4,158 41 586 3,700 14 3,647Canada 28,782 13,691 48 1,314 12,377 10 9,897Denmark 5,165 2,874 55 354 2,600 12 2,428Finland 5,058 2,572 51 66 2,006 22 1,693France 57,472 25,764 45 3,246 22,518 13 19,249Germany 80,693 42,089 52 4,167 37,922 10 25 810Greece 10,365 3,880 37 392 3,488 10 2,926Ireland 3,533 1,553 44 248 1,305 16 1,036Italy 57,121 23,459 41 2,862 20,597 12 18,430Japan 124,469 63,317 51 1,836 61,481 3 51,580Netherlands 15,381 7,090 46 510 6,580 7 6,428New Zealand 3,487 1,6241 47 122 1,502Norway 4,337 2,193 51 118 2,075 5 2,075Portugal 9,481 4,859 51 219 4,640 7 3,942Spain 39,481 14,848 38 3,638 11,210 25 10 579Sweden 8,691 4,360 50 384 3,976 9 3,791Switzerland 7,052 3,200 45 150 3,050 5 3,555United Kingdom 57,918 27,821 48 2,587 25,234 9 21 279US 258,000 124,800 48 6,864 117,936 6 114 034: AVERAGE , 47, 10
Column averages encompass only those counties for whfch the tnfomaUon Is complete

-21-TABLE A-2
PUBUC SECTOR EMPLOYMENT(in V-as)
PUBLIC SECTOR EMIPLOYMENTGeneMalICIvilianGoverrmentEEmployment
AFRICA tGovemment Administraifon SocialSector TotalCentral Non Central Educaton. Health General Civilan State-owned Anmed
___________ Government Govenmment Government Enterprisess Forces
Angola 117 20 38 28 202 140Benin 5Botswana 48 15 15 3 82 13 = 8 8Burkina-Faso 37 6Burundi 8 16 4 7 13
Cameroon 74 30 68 7 178 150 15Cape Verde 5 1 5 1 12 6 1Central A R 29 7 6 1 42 3Chad 16 9 3 25Comoros 2 3 1 6Congo 33 26 11 70 10Cte dlvoire 46 12 50 7 115 8Djibouti 9 2 1 18 8Equatorial Guinea 1
Eritrea 55
Ethiopia 9 241 245 120
Gabon 34 33 7 73 21 5Gambia 3 1 4 2 10 1Ghana 36 15 165 39 254 199 7Guinea _ 10Guinea-Bissau 5 2 6 2 15 9Kenya 225 50 223 34 532 156 24Lesotho 19 9 2Ubena _ | __.1_1_
Madagascar 95 _ 35 21
Malawi 52 _ 47 14 8
Mal 32 14 7Mauritania 8 9 3Mauritius 371 5 10 9 62Mozambique _ ___
Namibia 64 2 1 28 8Nigeria 393 24 5 ____________ 77Niger 24 14 9 5Rwanda 40Sao Tome & Principe 4 -
Senegal 32 5 24 5 66 13SeychellesSierra Leone 6SomaliaSouth Africa 564 451 250 93 1359 148Sudan 9_ 1Swaziland _
Tanzania 138 22 116 25 301 35Togo 16 5 13 4 37 28 7Uganda 38 28 97 8 170 50Zaire 200 423 99 28
Zambia 71 18 47 14 150 1 22Dmbabwe 65 25 92 23 205 1 45
-22-TABLE A-2
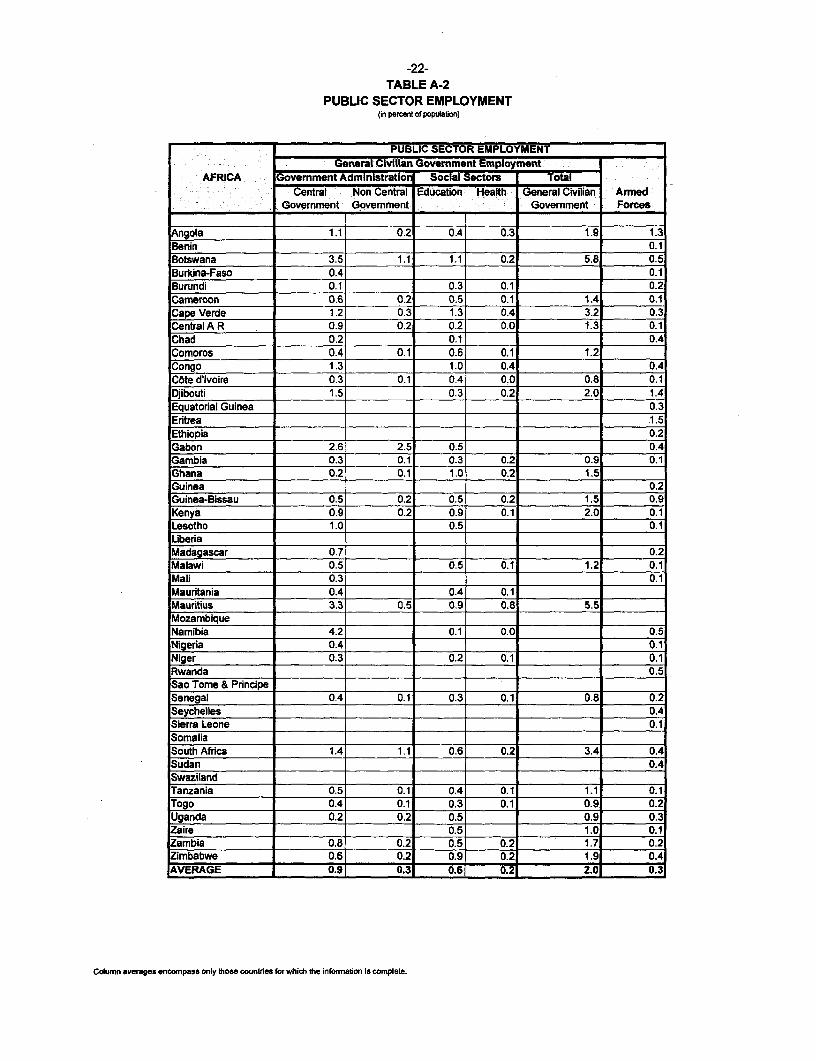
PUBLIC SECTOR EMPLOYMENT(in percent of poptiaton)
PUBLIC SECTOR EMPLOYMENTGeneral Civilian Government Employment
AFRICA Govemment Administration Social Sectors TotalCentral Non Central Education Health General Civilian Armed
Government Govemment Govemment Forces
Angola 1.1 0.2 0.4 0.3 1.9 1.3Benin 0.1Botswana 3.5 1.1 1.1 0.2 5.8 0.5Burkina-Faso 0.4 0.1Burundi 0.1 0.3 0.1 0.2Cameroon 0.6 0.2 0.5 0.1 1.4 0.1Cape Verde 1.2 0.3 1.3 0.4 3.2 0.3Central A R 0.9 0.2 0.2 0.0 1.3 0.1Chad 0.2 0.1 0.4Comoros 0.4 0.1 0.6 0.1 1.2iCongo 1.3 1.0 0.4 0.4C6te d'lvoire 0.3 0.1 0.4 0.0 0.8 0.1Djibouti 1.5 0.3 0.2 2.0 1.4Equatorial Guinea 0.3Eritrea I .1.5Ethiopia _ _ 0.2Gabon 2.6 2.5 0.5 0.4Gambia 0.3 0.1 0.3 0.2 0.9 0.1Ghana 0.2 0.1 1.0 0.2 1.5Guinea ! _ _ _ __ 0.2Guinea-Bissau 0.5 0.2 0.5 0.2 1.5 0.9Kenya 0.9 0.2 0.9 0.1 2.0 0.1Lesotho 1.0 0.5 0.1Liberia _ = __=__ =Madagascar 0.7 0.2Malawi 0.5 0.5 0.1 1.2 0.1Mali 0.3 0.1Mauritania 0.4 0.4 0.1Mauritius 3.3 0.5 0.9 0.8 5.5MozambiqueNamibia 4.2 0.1 0.0 0.5Nigeria 0.4 0.1Niger 0.3 0.2 0.1 0.1Rwanda_ ___ _ _ _ _ 0.5Sao Tome & PrincipeSenegal 0 4 0.1 0.3 0.1 0.8 0.2Seychelles 0.4Sierra Leone 0.1SomaliaSouth Africa 1.4 1._ 0.6 0.2 3.4 0.4Sudan 0.4SwazilandTanzania 0.5 0.1 0.4 0.1 1.1 0.1Togo 0.4 091 0.3 0.1 0.9 0.2Uganda 0.2 0.2 0.5 0.9 0.3Zaire 0.5 1.0 0.1Zambia 0.8 0.2 0.5 0.2 1.7 0.2Zimbabwe 0.6 0.2 0.9 0.2 1.9 0.4AVER_AGE 0.9 0.3 0.6 0.2 2.0 0.3
Column averages encompass only those countries for which the inforiabon Is complete.

-23-TABLE A-2
PUBLIC SECTOR EMPLOYMENT(in percent of labor ror )
PUBLIC SECTOR EMPLOYMENTGeneral Civilian Govemrnment Employment
AFRICA Govemrnment Administration Social Sectors TotalCentral Non Central Education Health General Civilian Armed
Govemment Govemrnment Govemment Forces
Angola 2.4 0.4 0.8 0.6 4.1 5.9BeninBotswana 9.8 3.1 3.1 0.6 16.6 23.4Burkina-Faso 0.7Burundi 0.2 0.5 0.1 0.6Cameroon 1.4 0.6 1.3 0.1 3.4 5.4Cape Verde 3.8 1.0 3.9 1.1 9.8 15.7Central A R 1.9 0.4 0.4 0.0 2.7 3.5Chad 0.5 0.3 0.1 0.4Comoros 1.5 0.2 2.1 0.5 4.4Congo 3.2 2.5 1.0 3.5CWte d'lvoire 0.9 0.2 1.0 0.1 2.3 3.6Djibouti 4.7 0.8 0.6 1.5Equatorial GuineaErtreaEthiopiaGabon 5.6 5.4 1.1 12.0 18.5Gambia 0.6 0.2 0.7 0.4 1.9 3.2Ghana 0.5 0.2 2.1 0.5 3.2 6.0Guinea 0.0 0.0Guinea-Bissau 1.1 0.4 1.1 0.5 3.0 5.0Kenya 1.7 0.4 1.7 0.3 4.1 6.5Lesotho 2.3 1.2 1.2LiberiaMadagascar 1.4Malawi 1.0 0.9 0.3 1.2Mali 0.6Mauritania 0.8 0.9 0.3 2.0 3.2Mauritius 8.0 1.2 2.2 2.1 13.4 18.8MozambiqueNamibia 10.3 0.2 0.1Nigeria 0.9 0.1Niger 0.6 0.3 0.1 0.4Rwanda _Sao Tome & PrincipeSenegal 0.9 0.1 0.7 0.1 1.8 2.7SeychellesSierra LeoneSomaliaSouth Africa 3.6 2.9 1.6 0.6 8.6 13.6SudanSwazilandTanzania 1.0 0.2 0.8 0.2 2.2 3.4Togo 1.0 0.3 0.8 0.2 2.4 3.Uganda 0.4 0.3 1.1 0.1 1.9 3.4Zaire 1.4 3.0Zambia 2.4 0.6 1.6 0.5 5.1 7.8Zimbabwe 1.5 0.6 2.1 0.5 4.8 8.0AVERAGE 2.3 0.7 1.5 0.5 5.0 5.5
Column verages encompass only those countries for which the informalion is complete.

-24-TABLE A-2
PUBLIC SECTOR EMPLOYMENT(in percent of toal employment)
PUBLIC SECTOR EMPLOYMENTGeneral Civilian Govemment Employment
AFRICA Government Administration Social Sectors TotalCentral Non Central Education Health General Civilian Arned
Govemment Govemment Govemment Forces
ngola 2.8 0.5 0.9 0.7 4.8 3.4Benmn__ _ _ _ _ _ __ _ _ _ _ __ _ _ _ _ _ _ _
Botswana 13.1 4.2 4.1 0.7 22.2 2.0Burkina-Faso 0.7 0.1Burundi 0.2 0.5 0.1 0.4Cameroon 1.9 0.8 1.7 0.2 4.6 0.4Cape Verde 5.1 1.3 5.2 1.5 13.1Central A R 2.7 0.6 0.5 3.8 0.2ChadComoros 1.9 0.3 2.7 0.6 5.5CongoCWe dlvoire 1.0 0.3 1.1 0.1 2.5 0.2Djibouti 6.8 1.2 0.9Equatorial Guinea r_____TEritreaEthiopiaGabonGambiaGhana 0.5 0.2 2.3 0.5 3.6 0.1GuineaGuinea-Bissau 1.8 0.7 1.8 0.8 5.1 3.0Kenya 2.7 0.6 2.7 0.4 6.3 0.3Lesotho 3.8 1.9 0.4LiberiaMadagascar 1.4 0.3Malawi _MaliMauritania 1.0 1.2 0.4Mauritius 8.1 1.2 2.2 2.1 13.6MozambiqueNamibia 13.1 0.3 0.1 1.7Nigeria 1.3 0.1 0.2Niger 1.0 0.6 0.1 1.8 0.2RwandaSao Tome & PrincipeSenegal 1.0 0.1 0.7 0.2 2.0 0.4SeychellesSierra LeoneSomaliaSouth Africa 5.3 4.2 2.3 0.9 12.8 1.4Sudan 1.2Swaziland _
Tanzania 1.2 0.2 1.1 0.2 2.7 7Togo 1.2 0.4 1.0 0.3 2.9UgandaZaireZambia 3.0 0.8 2,0 0.6 6.4Zimbabwe 2.8 1.1 3.9 1.0 8.7 1.9AVERAGE 3.0 1.0 2.0 0.6 6.6 09
Coknm sveges encompass only Utose counbies for which the Infonnation Is complete.

-25-TABLE A-2
PUBLIC SECTOR EMPLOYMENT(in thousands)
PUBLIC SECTOR EMPLOYMENT _
General Civilian Govemment EmploymentASIA Govemment Administration Social Sectors Total
:Central Non Central Education Health General Civilian State-owned ArmedGovernment Govemment Government Enterprises Forces
Afghanistan _ _
Bangladesh 446 211 96 261 116BhutanCambodia 160 89China 1,331 18,579 11,100 2,929 33,939 106,250 3,000Fiji 41 21 7India 3,931 3,842 2,803 720 11,295 6,222 1,145Indonesia 1,283 496 1,905 266 3,950 275Kiribati 2Korea 279 331 280 93 983Lao PDR 4 20 38 7 69 3 37Malaysia 432 201 191 40 869 _ _115
Maldives 7 _ 3 2 121Marshall IslandsMicronesia 1 6 7Mongolia 21Myanmar 568 1 569 286Nepal _ 35Pakistan 536 788 415 96 1,835 587Papua New Guinea 4Philippines 675 245 441 74 1,435 128 135Singapore 27 25 6 58 54Sri Lanka 500 107 168 26 801 125Solomon IslandsThailand 711 499 343 81 1,635 259TongaVanuatuVietnam 264 930 825 318 2,337 1,781 572

-26-TABLE A-2
PUBLIC SECTOR EMPLOYMENT(in prcont of population)
PUBLIC SECTOR EMPLOYMENTeneml Civilian Govemment Employment
ASIA Government Adminhstrtion Socibl Sectors TotalCentral Non Central Education Health General Clvilian Armed
Govemment 'Govemment Government Forces
AfghanlstanBangladesh 0.4 0.2 0.1 0.6 0.1Bhutan 0.1Cambodia 1 6 1.6 0.9China 0.1 1.8 0.9 0.2 2.8 0.3FiJi 54 2.8
India 04 0.4 0.3 0.1 1.2 0.1Indonesia 0.7 0.3 1.0 0.1 2.1 0,1Kldbati __
Korea o 06 0.7 0.6 0.2 2.2 Lao PDR 0.1 0.4 0.8 0.2 1.4 0.8Malalysa 2.3 1i1 1,0 0.2 4.5 0.6Maldives 3.0 1.2 0.7 4.9 Mamhall IslandsMicronesla 0.6 5.7 6.3Mongolia 0.9Myanmar 1.2 0.0 1.2 0.6Nepnl __ _ __ _ __ _ _ _ _ _ _
Pakistan 0.4 0o8 0.3 0.1 1.5 0.5Papus New Guinea I_T_I_I _Philippines 1,0 0,4 0.7 0.1 2.1 0.2Singapore 0.9 0.8 0.2 2.0 1,8Sri Lanka 2.8 0.6 0.9 0.1 4.5 0,7Solomon Islands I L_r__Thailand 1.2 0.9 0.6 0.1 2.8 0,4Tongs _ i_ _
Vanuatu _____
Vietnam 3 1.1 0.4AVr _ A2 _o.
Column weges ncomrpos only those counrles for which the Informaton Is complet.
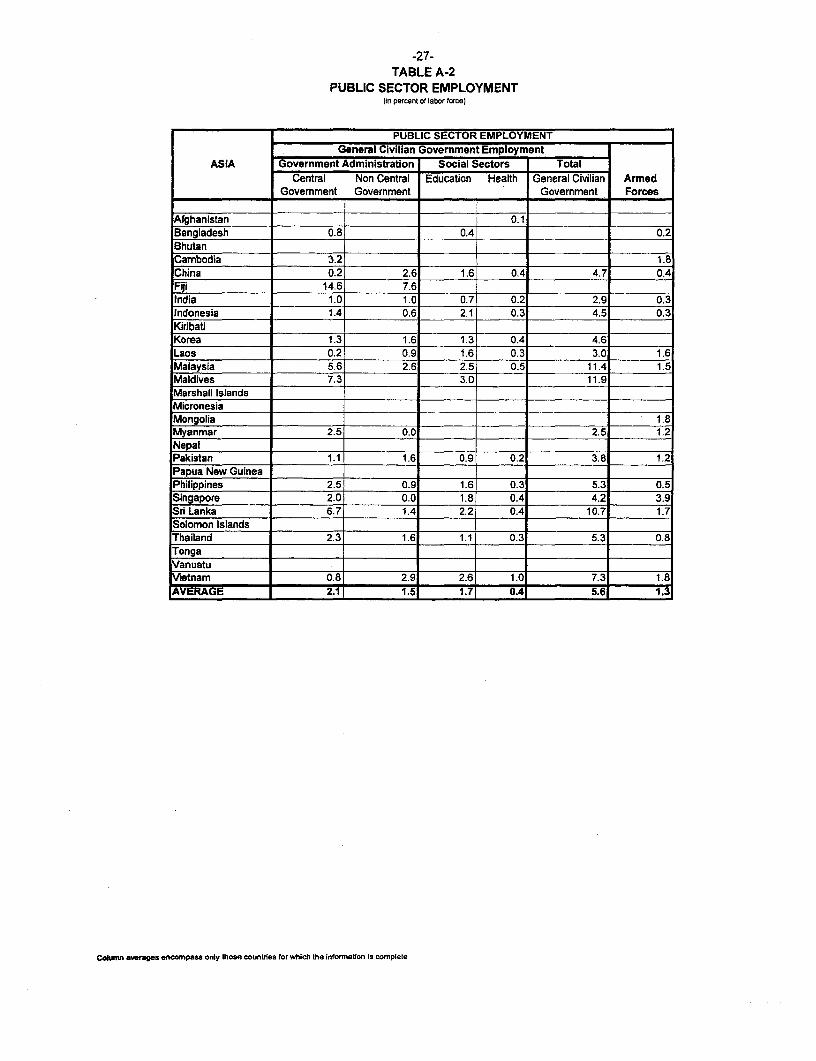
-27-TABLE A-2
PUBLIC SECTOR EMPLOYMENT(in percent of labor force)
PUBLIC SECTOR EMPLOYMENTGeneral Civilian Govemment Employment
ASIA Government Administration Social Sectors Total lCentral Non Central Education Health General Civilian Armed
Government Government Government Forces
Afghanistan 0_1Bangladesh 0.8 0.4 _ 0.2BhutanCambodia 3.2 1.8China 0.2 2.6 1.6 0.4 4.7 0.4Fiji __ ___ ___14.6 7.6
India 1.0 1.0 0.7 0.2 2.9 0.3Indonesia 1.4 0.6 2.1 0.3 4.5 0.3KiribatiKorea 11.3 1.6 1.3 0.4 4.6Laos 0.2 0.9 1.6 0.3 3.0 1.6Malaysia 5.6 2.6 2.5 0.5 11.4 1.5Maldives 7.3 3.0 11.9Marshall IslandsMicronesiaMongolia 1.8Myanmar 2.5 0.0 2.5 1.2NepalPakistan 1.1 1.6 0.9 0.2 3.8 1.2Papua New GuineaPhilippines 2.5 0.9 1.6 0.3 5.3 0.5Singapore 2.0 0.0 1.8 0.4 4.2 3.9Sri Lanka 6.7 1.4 2.2 0.4 10.7 1.7Solomon IslandsThailand 2.3 1.6 1.1 0.3 5.3 0.8TongaVanuatuVietnam 0.8 2.9 2.6 1.0 7.3 1.8,AVERAGE 2.1 1.5 1.7 0.4 5.6 1.3
Cokumn averages encompass only those countries for which the information Is complete
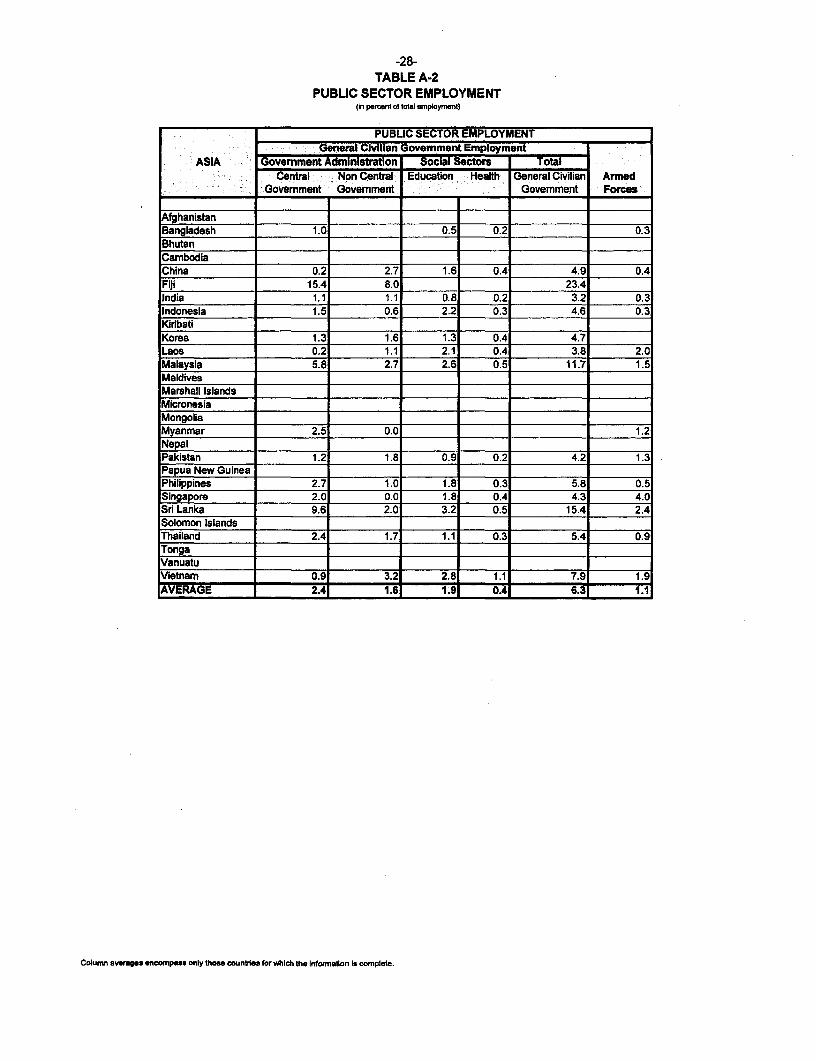
-28-TABLE A-2
PUBLIC SECTOR EMPLOYMENT(in percent of total employment)
PUBLIC SECTOR EMPLOYMENTGeneral Civilian Govemment Employment
ASIA Govemment Administration Social Sectors TotalCentral Non Central Education Health General Civilian Armed
Govemment Govemment Govemment Forces
AfghanistanBangladesh 1.0 0.5 0.2 0.3
BhutanCambodiaChina 0.2 2.7 1.6 0.4 4.9 0.4Fiji 15.4 8.0 23.4India 1.1 1.1 0.8 0.2 3.2 0.3Indonesia 1.5 0.6 2.2 0.3 4.6 0.3Kiribati
Korea 1.3 1.6 1.3 0.4 4.7Laos 0.2 1.1 2.1 0.4 3.8 2.0Malaysia 5.8 2.7 2.6 0.5 11.7 1.5M aldives __________ _ ________
Marshall IslandsMicronesiaMongoliaMyanmar 2.5 0.0 1.2Nepal __r _ T_r
Pakistan 1.2 1.8 0.9 0.2 4.2 1.3Papua New GuineaPhilippines 2.7 1.0 1.8 0.3 5.8 0.5Singapore 2.0 0.0 1.8 0.4 4.3 4.0Sri Lanka 9.6 2.0 3.2 0.5 15.4 2.4Solomon IslandsThailand 2.4 1.7 1.1 0.3 5.4 0.9TongaVanuatuVietnam 0.9 3.2 2.8 1.1 7.9 1.9AVERAGE 2.4 1.6E 1.9 0.4 6.3 1.1
Column aveMs encompas only those countries for which the Infofnation Is oomplete.

-29-TABLE A-2
PUBLIC SECTOR EMPLOYMENT(in tousands)
PUBLIC SECTOR EMPLOYMENTEASTERN A General Civilian Government Employment
EUROPE AND Govemment Administration Social Sectors Total FORMER USSR Central Non Central Education Health General Civilian State-owned Arned
Govemment Government Govemment Enterprises ForcesCentral and Easterm EuropeAlbania 61 8 52 27 148 73Bosnia 92Bulgaria 79 25 259 201 564 1,496 99Croatia 73 26 66 70 235 333 105Czech Republic 64 173 121 86Hungary 147 133 300 246 825 71Macedonia 19 2 18 26 66 396 10Poland 89 135 601 770 1,595 3,987 279Romania 46 324 166 . 217Slovakia 67 44 172 127 410 47Slovenia 28 49 53 8Serbia _ 127Turkey 616 249 550 131 1,546 508
Fornmer Soviet UnionArmenia 30 139 150 73 392 91Azerbaijan 62 385 170 . 87Belarus 60 17 423 285 785 97Estonia 29 15 43 29 4Georgia 141 34 245 114 533 427 9Kazakhstan 196 68 299 506 1,069 63Kyrgyz R 267 162 105 7Latvia 47 __=___ 92 74 3Lithuania 37 22 141 104 304 9 5Moldova 8 9 185 108 310 12 12Russia 536 271 7,500 4,135 12,442 1,300Tajikistan 30 219 110 3Turkmenistan 74 _ 172 82 592 11Ukraine r 1871 1691 2,277 1,508 4,141 453Uzbekistan 841 1,038 483 25

-30-TABLE A-2
PUBLIC SECTOR EMPLOYMENT(in percent of populabon)
PUBLIC SECTOR EMPLOYMENTEASTERN General Civilian Govemment Employment
EUROPE AND Government Administration Social Sectors TotalFORMER USSR Central Non Central Education Health General Civilian Armed
Govemment Govemment Govemment Forces
Central and Eastemn Europe
Albania 1.9 0.2 1.6 0.8 4.6 2.3Bosnia 2.4Bulgaria 0.9 0.3 2.9 2.3 6.4 1.1Croatia 1.6 0.6 1.5 1.5 5.2 2.3Czech Republic 0.6 1.7 1.2 0.8
Hungary 1.4 1.3 2.9 2.4 8.1 0.7Macedonia 0.9 0.1 0.9 1.3 3.2 0.5Poland 0.2 0.4 1.6 2.0 4.2 0.7Romania 0.2 1.4 0.7 1.0Slovakia 1.3 0.8 3.2 2.4 7.7 0.9Slovenia 1.4 2.5 2.7 0.4Serbia 1.2
Turkey 1.0 0.4 0.9 0.2 2.6 0.9
Fonner Soviet UnionArmenia 0.8 3.7 4.0 2.0 10.5 2.4Azerbaijan 0.8 5.2 2.3 1.2
Belarus 0.6 0.4 4.2 2.8 7.9 1.0Estonia 1.9 1.0 2.9 2.0 7.8 0.2Georgia 2.6 1.3 4.5 2.1 10.5 0.2Kazakhstan 1.2 0.9 1.8 3.0 6.8 2.5Kyrgyz R 5.8 3.5 2.3 0.2
Latvia 1.9 3.6 2.9 8.4Lithuania 1.0 0.6 3.8 2.8 8.2 0.1Moldova 0.2 0.4 4.2 2.4 7.3 0.3Russia 0.4 0.4 5.0 2.8 8.6 0.9Tajikistan 0.5 3.8 1.9 0.0Turkmenistan 1.9 4.4 2.1 8.4 0.3Ukraine 0.4 0.7 4.4 2.9 8.4 0.9Uzbekistan 0.4 2. 0.1AVERAGE 1.1 0.8 3.0 2.1 6.9 1.1
Column averages encompass only those countries for which the information is complete.

-31-TABLE A-2
PUBLIC SECTOR EMPLOYMENT(in ptcert of labor force)
PUBLIC SECTOR EMPLOYMENT: EASTERN General Civilian Government Employment
EUROPE AND Goverment Administraton Social Sectors TotalFORMER USSR Central Non Central Education Health General Civilian Armed
Govemrnent Govermrentir Governmnt ForcesCoenml and ERsterMgn Efop Albania 3.6 0.5 3.1 1.6 8.7 4.3BosniaBulgaria 1.7 0.6 5.8 4.5 12.5 2.2Croatia 3.9 1.4 3.5 3.7 12.4 5.5Czech Republic 1.3 3.4 2.4 1.7Hungary 2.7 2.5 5.6 4.6 15.4 1.3Macedonia 2.0 0.2 1.9 2.8 6.9 1.1Poland 0.4 0.7 3.0 3.8 7.9 1.4Romania 0.4 2.7 1.4 1.8Slovakia 2.9 1.9 7.3 5.4 17.4 2.0Slovenia 3.7 6.6 7.1 1.1-Serbh __ _ 1.9Turkey 2.4 1.0 2.2 0.5 6.1 2.0
Former Soviet UnlonArmenia 1.8 8.5 9.2 4.5 24.0 5.6Azerbaijan 2.2 13.4 5.9 3.0Belarus 1.2 0.4 8.8 5.9 16.3 2.0Estonia 4.0 2.1 6.0 4.1 16.2 0.5Georgia 5.6 1.3 9.7 4.5 21.1 0.4Kazakhstan 2.7 0.9 4.0 6.8 0.9Kyrgyz R 14.5 8.8 5.7 0.4Latvia 3.4 6.6 5.3 0.2Lithuania 2.0 1.2 7.7 5.6 16.5 0.3Moldova 0.4 0.4 9.0 5.3 15.1 0.6IRussia 0.7 0.4 10.3 5.7 17.1 1.8Tajikistgn 1.5 . 11.5 5.8 0.1'Turkrnonistan 4.7 10.9 5.2 _ _ 0.7Ukra_ne 0.8 0.7 9.5 6.3 17.2 1.9Uzbekistan _ 1.0 . _ 5.8 0.3__ERAGE2.3 1._ 6.1 4.4 14.3 2.2
Coum aveae encompas only hos ountfle for which Me Infomitios complete

-32-TABLE A-2
PUBLIC SECTOR EMPLOYMENT(in percent of totWl erployment)
PUBLIC SECTOR EMPLOYMENT _
EASTERN General Civilian Government EmploymentEUROPEAND Govemment Administration Social Sectors Total
FORMER USSR Central Non Central Education Health General Civilian ArmedGovernment Government Government Forces
Central and Eastem Eu=_ _
Albania 4.4 0.6 3.7 1.9 10.6 5.2BosniaBulgaria 2.1 0.7 6.9 5.3 14.9 2.6Croatia 4.4 1.6 4.0 4.2 14.2 6.4Czech Republic 1.3 3.6 2.5 1.8Hungary 3.1 2.8 6.3 5.1 17.2 1.5Macedonia 3.8 0.4 3.6 5.2 13.0 2.0Poland 0.5 0.8 3.5 4.5 9.4 1.6Romania 0.4 2.9 1.5 2.0Slovakia 3.3 2.2 8.6 6.3 20.5 2.3Slovenia 4.3 7.7 8.3 1.3Serbia 2.4Turkey 2.8 1.1 2.5 0.6 7.0 2.3
forrherSovlet Unl__Armenia 1.9 9.0 9.7 4.7 25.3 5.9Azerbaijan 2.5 15.5 6.9 _ 3.5Belarus 1.3 0.4 8.9 6.0 16.5 2.0Estonia 4.3 2.3 6.5 4.4 17.5 0.5Georgia 5.9 1.4 10.2 4.7 22.2Kazakhstan 2.7 0.9 4.1 6.9 14.6 0.9Kyrgyz R 16.5 10.0 6.5 0.4Latvia 4.0 7.7 6.2 0.2Lithuania 2.1 1.3 8.2 6.0 17.6 0.3Moldova 0.4 0.4 9.1 5.3 15.2 0.6Russia 0.8 0.4 11.2 6.2 18.6 1.9Tajikistan 1.6 11.7 5.9 0.1Turkmenistan 4.8 11.1 5.3 0.7Ukraine 0.8 0.7 9.5 6.3 17.3 1.9Uzbekistan 1.0 _ 6.0 0.3AVERAGE 2.6 1.6 6.8 4.9 16.0 2.5
Cumn averages encompass only those countries for which the tnfomaton Is complete.

-33-TABLE A-2
PUBLIC SECTOR EMPLOYMENTOIn thouSnds)
PUBLIC SECTOR EMPLOYMENT _
LATIN AMERICA General CiIlIan Govemment EmploymentAND Government Administration Social Sectors Total
THE CARIBBEAN Central Non Central Education Health General Civilian State-owned AmedGovemment Govemrnment: Government Enterprises Forces
Antigua & Barbuda 8 0.1 9 2Argentina 301 969 278 114 1,662 138 67Bahamas 9 5 4Barbados 10 3 4Belize _9 I_=_ = _c =1Bermuda _
Bolivia 86 11 80 22 199 27 34Brazil _ 295Chile 46 24 9 52 130 99Colombia 44 194 305 70 612 146Costa RicaDominican Republic 210 148 25Ecuador 184 44 111 30 370 57El Salvador 40 33 21 31Guatemala 4_ .4Guyana 1 3 3 1 2 19 33 2Honduras 56 7 35 5 122 19Jamaica 3Mexico _Nicaragua 20 28 21 __________ 12Paraguay 146 20Peru 352 __= ,_ r _ 115Suriname ___r_I_2
Trinidad and Tobago _ | _ 133 2Uruguay 75 = 38, 68 25 206 44 26Venezuela 2461 1091 182, 29 565 79

-34-TABLE A-2
PUBLIC SECTOR EMPLOYMENT(in peecet of poputation)
PUBLIC SECTOR EMPLOYMENTLATIN AMERICA General Civilian Govemrnment Employment
AND Government Admnistration Social Sectors TotalTHE CARIBBEAN Central Non Central Education Health General Civilian Armed
Govemment Government Govemment Forces
Antigua & Barbuda 13.1 0.2Argentina 0.9 2.8 0.8 0.3 4.9 0.2Bahamas 3.2 1.7 1.5 6.5Barbados 4.0 1.1 1.6 6.8Belize 4.2 0.5Bermuda _ _Bolivia 1.2 0.2 1.1 0.3 2.7 0.5Brazil __0.2
Chile 0.3 0.2 0.1 0.4 0.9 0.7Colombia 0.1 0.5 0.8 0.2 1.7 0.4Costa Rica __.Dominican Republic _ - 0.3Ecuador 1.7 0.4 1.0 0.3 3.4 0.5El Salvador 0.7 0.6 0.4 1.7 0.5Guatemala 0.4Guyana 1.6 0.4 0.1 0.2 2.3 0.2Honduras 1.0 0.1 0.6 0.1 1.8 0.3Jamaica 0.1MexicoNicaragua 0.5 _ _ _ 0.7 0.5 _ 0.3Paraguay 3.0 0.4Peru 1.5 0.5Suriname 0.4Trinidad and Tobago 0.2Uruguay 2.4 1.2 2.1 0.8 6.5 0.8Venezuela 1.2 0.5 0.9 0.1 2.7 0.4AVERAGE 1.2 0.7 0.8 0.3 3.0 0.4
C_kwo avragompaee onl IhoM couflts for which Oh lntmaton Is cmpe.

-35-TABLE A-2
PUBLIC SECTOR EMPLOYMENT[in perewd of aborlome)
PUBLIC SECTOR EMPLOYMENTLATIN AMERICA General Civillan Govemment Employment
AND Govemment Administratio Social Sectors TotalTHE CARIBBEAN Central Non Central Education Health General Civilian Armed
Govemment Govemment Govemment Forces
Antigua & Barbuda 29.4 0.3.Argentina 2.3 7.3 2.1 0.9 12.6 0.5Bahamas 6.3 0 3.4 3.0 12.6 ____
Barbados 7.8 0 2.2 3.1 13.1Belize 1.5Bermuda 1.2Bolivia 3.0 0.4 2.8 0.7 6.8 0.4Brazil I_1.8Chile 0.8 0.4 0.2 0.9 2.4 1.0Colombia 0.3 1.3 2.1 0.5 4.2Costa Rica 0.8Dominican Republic 0.0 0.0 1.6Ecuador 5.1 1 .2 3.1 0.8 1 0.3 1 .4El Salvador 1.8 1.5 1.0 4.4 1.2Guatemala 0.5'Guyana 3.8 1.0 0.1 0.6 5.4 1.0Honduras 2.9 0.4 1.8 0.3 5.3 0.3
-__ ___ __ _ __ _ _ _ _ _ ___ __ _ _ 0.8jJamaicaMexico 0.8Nicaragua 1.3 1.4 1.1Paraguay 8.0 1.4Peru _ _ __4.2 1.2Suriname _ __ _ _ _ 0.4Trinidad and Tobago 1.8
Uruguay 5.3 2.7 4.8 1.8 14.6 1.0Venezuela 3.0 1.3 2.2 0.3 6.9AVERAGE 2.9 1.8 2.1 0.8 7.6 1.0
Cotunm averages encompass only those counties for which the information Is complete
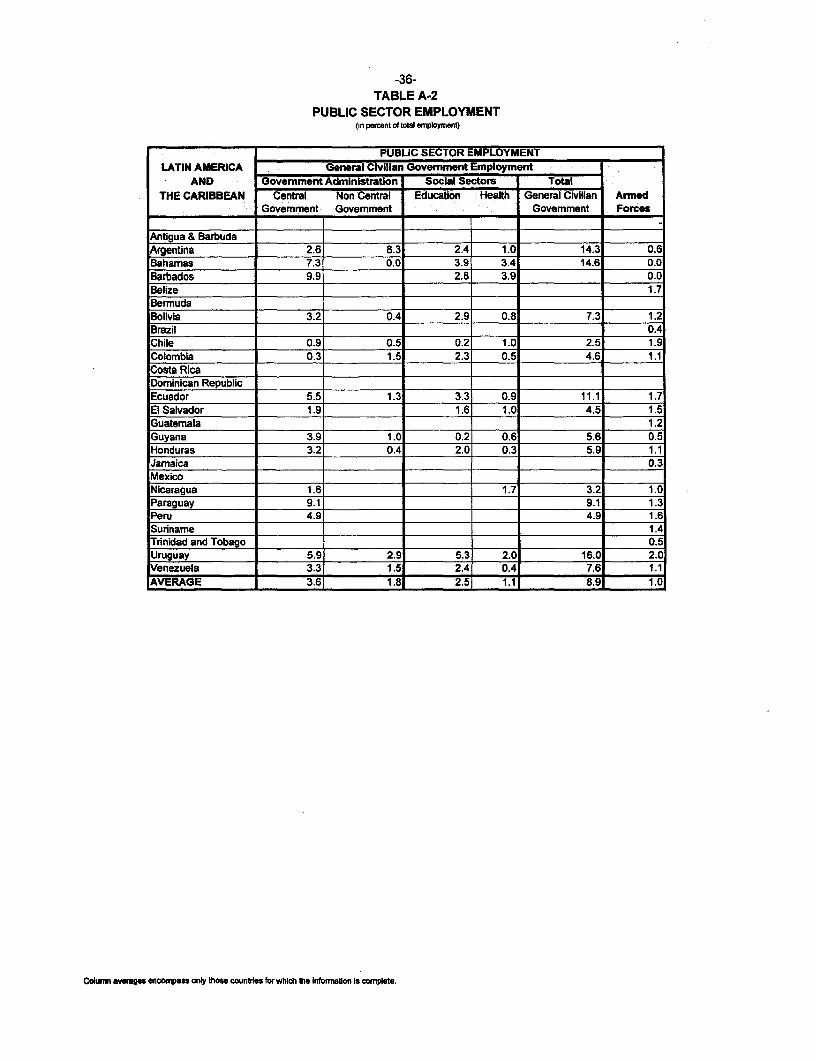
-36-TABLE A-2
PUBLIC SECTOR EMPLOYMENT(in percent of total employment)
PUBUC SECTOR EMPLOYMENTLATIN AMERICA General Civilian Govemrnment Emnployment
AND Govemment Administration Social Sectom TotalTHE CARIBBEAN Central Non Central Education Health General Civilian Armed
Govemment Govemment Govemment Forces
Antigua & BarbudaArgentina 2.6 8.3 2.4 1.0 14.3 0.6
Bahamas 7.3 0.0 3.9 3.4 14.6 0.0Barbados 9.9 2.8 3.9 0.0Belize 1.7BermudaBolivia 3.2 0.4 2.9 0.8 7.3 1.2Brazil 0.4Chile 0.9 0.5 0.2 1.0 2.5 1.9Colombia 0.3 1.5 2.3 0.5 4.6 1.1Costa RicaDominican RepublicEcuador 5.5 1.3 3.3 0.9 11.1 1.7El Salvador 1.9 1.6 1.0 4.5 1.5Guatemala 1.2Guyana 3.9 1.0 0.2 0.8 5.6 0.5Honduras 3.2 0.4 2.0 0.3 5.9 1.1Jamaica 0.3
MexicoNicaragua 1.6 1.7 3.2 1 .0Paraguay _ 9.1 9.1 1.3Peru 49 4.9 1.6Suriname 1.4Trinidad and Tobago 0.5Uruguay 5.9 2.9 5.3 2.0 16.0 2.0Venezuela 3.3 1.5 2.4 0.4 7.6 1.1
_AVERAGE 3.6 1.8- 2.5 1.1i 8.9 1.0
Coumn aveagas encompass only those countries for which the informatIon is complete.

-37-TABLE A-2
PUBLIC SECTOR EMPLOYMENT(in thousands)
PUBLIC SECTOR EMPLOYMENTMIDDLE EAST General Civilian Govemment Employment
AND Government Administration Social Sectors TotalNORTH AFRICA Central Non Central Education Health General Civilian State-owned Arned
Govemment Government Govemment Enterprises Forces
Algeria 394 222 342 171 1,129 130 122Bahrain 14 0 9 6 29Egypt 1,026 1,582 543 422 3,573 1,300 436Jordan 32 32 62 1 9 145 99Lebanon 7 10 32 3 52 8 44Morocco 205 120 233 39 597 196Syria 137 40 230 34 441Tunisia 124 22 129 44 319 181 36WB-Gaza 37 17 5 59 0Yemen 304 91 40 28 463 40
(in percent of populatlon)
PUBLIC SECTOR EMPLOYMENTMIDDLE EAST General Civilian Govemment Employment
AND Govemment Administration Social Sectors TotalNORTH AFRICA Central Non Central Education Health General Civilian Armed
Govemment Government Govemment Forces
Aleria 1.5 0.8 1.3 0.6 4.2 0.5Bahrain 2.6 1.8 1.1 5.5Egypt 1.8 2.7 0.9 0.7 6.2 0.8Jordan 0.8 0.8 1.5 0.5 3.5 2.4Lebanon 0.2 0.3 0.8 0.1 1.4 1.1Morocco 0.8 0.5 0.9 0.1 2.3 0.8Syria 1.0 0.3 1.7 0.3 3.2Tunisia 1.4 0.3 1.5 0.5 3.7 0.4WB-Gaza 1.5 0.7 0.2 2.4 0.0Yemen 2.3 0.7 0.31 0.21 3.5 0.3AVERAGE 1.4 0.9 1.2 0.4 3.9 0.7

-38-TABLE A-2
PUBLIC SECTOR EMPLOYMENT(in percent of labor force)
PUBLIC SECTOR EMPLOYMENTMIDDLE EAST General Civilian Govemment Employment
AND Government Administration Social Sectors TotalNORTH AFRICA Central Non Central Education Health General Civilian Armed
Govemment Govemment Govemment Forces
Algeria 6.1 3.4 5.3 2.6 17.4 1.9Bahrain 5.0 0.0 3.4 2.2 10.6Egypt 6.4 9.9 3.4 2.6 22.3 2.7Jordan 2.8 2.8 5.5 1.7 12.9 8.8Lebanon 0.7 1.0 3.2 0.3 5.3 4.5Morocco 2.4 1.4 2.7 0.5 7.0 2.3Syria 3.9 1.1 6.6 1.0 12.6Tunisia 4.4 0.8 4.6 1.6 11.3 1.3WB-Gaza 10.1 4.6 1.2 16.0 0.0Yemen 10.5 3.2 1.4 1.0 16.0 1.4AVERAGE 5.21 3.2 4.2 1.6 14.2 3.0
(in percent of total employment)
PUBLIC SECTOR EMPLOYMENTMIDDLE EAST General. Civilian Govemment Employment
AND Government Administration Social Sectors TotalNORTH AFRICA Central Non Central Education Health General Civilian Armed
Govemment Government Govemment Forces
Algeria 8.7 4.9 7.5 3.8 24.5 2.7Bahrain 5.9 0.0 4.0 2.6 12.5Egypt 7.2 11.1 3.8 3.0 25.0 3.1Jordan 3.3 3.3 6.5 2.0 15.2 10.3Lebanon 1.1 1.6 5.0 0.5 8.1 6.9Morocco 2.9 1.7 3.2 0.5 8.3 2.7Syria 4.2 1.2 7.1 1.1 13.7Tunisia 5.2 0.9 5.4 1.9 13.5 1.5WB-Gaza 16.6 7.6 2.0 0.0Yemen 14.5 4.4 1.9 1.3 22.1 1.9AVERAGE 6.6 3.9 5.1 1.9 17.5 3.2
Column averages encompass only those countries for which the information is complete

-39-TABLE A-2
PUBLIC SECTOR EMPLOYMENT(in usands)
PUBUC SECTOR EMPLOYMENTGeneral Civilian Govemment Employment -
OECD Govemrnment Administration Social Sectors TotalCentral Non Central Education Health General Civilian State-owned Anrned
Govemrnment Govemrnent Govemment Enterprises ForcesAustralia 234 404 399 299 1,336 864 56Austria 268 198 41 100 607 0Belgium 174 231 280 79 764 120 47Canada 287 504 360 1,151 303 71Denmark 143 268 142 103 656 56 33Finland 110 389 36 90 625 65 31France 1,561 1,237 1,075 135 4,009 757 409Germany 314 2,098 1,098 110 3,620 1,056 340Greece 111 40 121 6 278 138 171Ireland 41 27 52 59 178 70 15Italy 770 736 970 620 3,096 558 329Japan 894 1,548 1,298 278 4,017 119 240Netherlands 603 198 800 _New Zealand 43 41 217 301Norway 114 70 135 244 564Portugal 171 80 190 44 485 54Spain 509 774 229 _______412 206Sweden 355 461 286 410 1,512 144 64Switzerland 149 177 121 92 539 _ 3United Kingdom 747 1,3001 990 1,010 4,0471 759 303US 3,105 8,193 5,805 1,268 18,370 1 237
on pe-nent of poputon)
__________________IPUBLUC SECTOR EMPLOYMENTGeneral Ciilian:GovermentEmployment
OECD Govemment Administration Social Sectors Total 4 :*00 i;:0 : t 0:::TCentral Non Centralt EducationI: Health General Civilian Armed
Government Govemment iGovermient Forces Australia 1.3 2.3 2.3 1.7 7.6 0.3Austria 3.4 2.5 0.5 1.3 7.6Belgium 1.7 2.3 2.8 0.8, 7.6 0.5Canada 1.0 1.8 1.3 4.0 0.2Denmark 2.8 5.2 2.8 2.0 12.7 0.6Finland 2.2 7.7 0.7 1.8 12.4 0.6France 2.7 2.2 1.9 0.2 7.0 0.7Germany 0.4 2.6 1.4 0.1 4.5 0.4Greece 1.1 0.4 1.2 0.1 2.7 1.7Ireland 1.2 0.8 1.5 1.7 5.0 0.4Italy 1.3 1.3 1.7 1.1 5.4 0.6Japan 0.7 1.2 1.0 0.2 3.2 0.2Netherlands 3.9 1.3 _ _ _ 5.2New Zealand 1.2 1.2 6.2 ____ 8.6 _____
Nonway 2.6 1.6 3.1 5.6 13.0 _____
Portugal 1.8 0.8 2.0 0.5 5.1 0.6Spain 1.3 2.0 0.6 0.5Sweden 4.1 5.3 3.3 4.7 17.4 0.7Switzenand 2.1 2.5 1.7 1.3 7.6 _
United Kingdom 1.3 2.2 1.7 1.7 7.0 0.5US 1.2 3.2 2.2 0.5 7.1 0.1JAVERAGE 1.8 2.5 2.1 1.4 7.7 o .a

-40-TABLE A-2
PUBLIC SECTOR EMPLOYMENT(in percent of labor force)
PUBLIC SECTOR EMPLOYMENT _
General Civilian Government EmploymentOECD Government Administration Social Sectors Total
Central Non Central Education Health General Civilian ArmedGovernment Govemment Government Forces
Australia 2.8 4.9 4.8 3.6 16.2 0.7Austria 7.7 5.7 1.2 2.9 17.5Belgium 4.2 5.6 6.7 1.9 18.4 1.1Canada 2.1 3.7 2.6 8.4 0.5Denmark 5.0 9.3 4.9 3.6 22.8 1.2Finland 4.3 15.1 1.4 3.5 24.3 1.2France 6.1 4.8 4.2 0.5 15.6 1.6Germany 0.7 5.0 2.6 0.3 8.6 0.8Greece 2.9 1.0 3.1 0.2 7.2 4.4Ireland 2.6 1.7 3.3 3.8 11.5 0.9Italy 3.3 3.1 4.1 2.6 13.2 1.4Japan 1.4 2.4 2.0 0.4 6.3 0.4Netherlands 8.5 2.8 11.3New Zealand 2.6 2.5 13.4 18.5Norway 5.2 3.2 6.1 11.1 25.7Portugal 3.5 1.7 3.9 0.9 10.0 1.1Spain 3.4 5.2 1.5 10.2 1.4Sweden 8.1 10.6 6.6 9.4 34.7 1.5Switzerland 4.6 5.5 3.8 2.9 16.9 0.1United Kingdom 2.7 4.7, 3.6 3.6 14.5 1.1US 2.5 6.61 4.71 1.0 14.7 0.2
.AVERAGE 3.9 5.31 3.7 2.8 15.6 1.1
(in percent of total employment)
I_________________ gPUBLIC SECTOR EMPLOYMENT |General Civilan Government Employment ..
OECD Goverment Administration Social Sectors TotalCentral Non Central Education Health General Civilian Armed
Government Government Govemment ForcesAustralia 3.1 5.4 5.3 4.0 17.7 0.7Austria 8.1 6.0 1.2 3.0 18.3Belgium 4.7 6.2 7.6 2.1 20.6 1.3Canada 2.3 4.1 2.9 9.3 0.6Denmark 5.5 10.3 5.5 3.9 25.2 1.3Finland 5.5 19.4 1.8 4.5 31.2 1.6France 6.91 5.5 4.8 0.6 17.8 1.8Germany 0.8 5.5 2.9 0.3 9.5 0.9Greece 3.2 1.1 3.5 0.2 8.0 4.9Ireland 3.1 2.0 4.0 4.5 13.6 1.1Italy 3.7 3.6 4.7 3.0 15.0 1.6Japan 1.5 2.5 2.1 0.5 6.5 0.4Netherlands 9.2 3.0 12.2New Zealand 2.9 2.7 14.5 20.0Norway 5.5 2.7 6.5 11.8 26.5Portugal 3.7 3.4 4.1 0.9 12.1 1.2Spain 4.5 1.7 2.0 8.3 1.8Sweden 8.9 6.9 7.2 10.3 33.3 1.6Switzerland 4.9 11.6 4.0 3.0 23.5 0.1United Kingdom 3.0 5.8 3.9 4.0 16.7 1.2US 2.6 5.2 4.9 1.1 13.8 0.2AVERAGE 4.3 5.7 4.1 3.0 17.2 1.2
Column averages encompass only those countries for which the information is complete
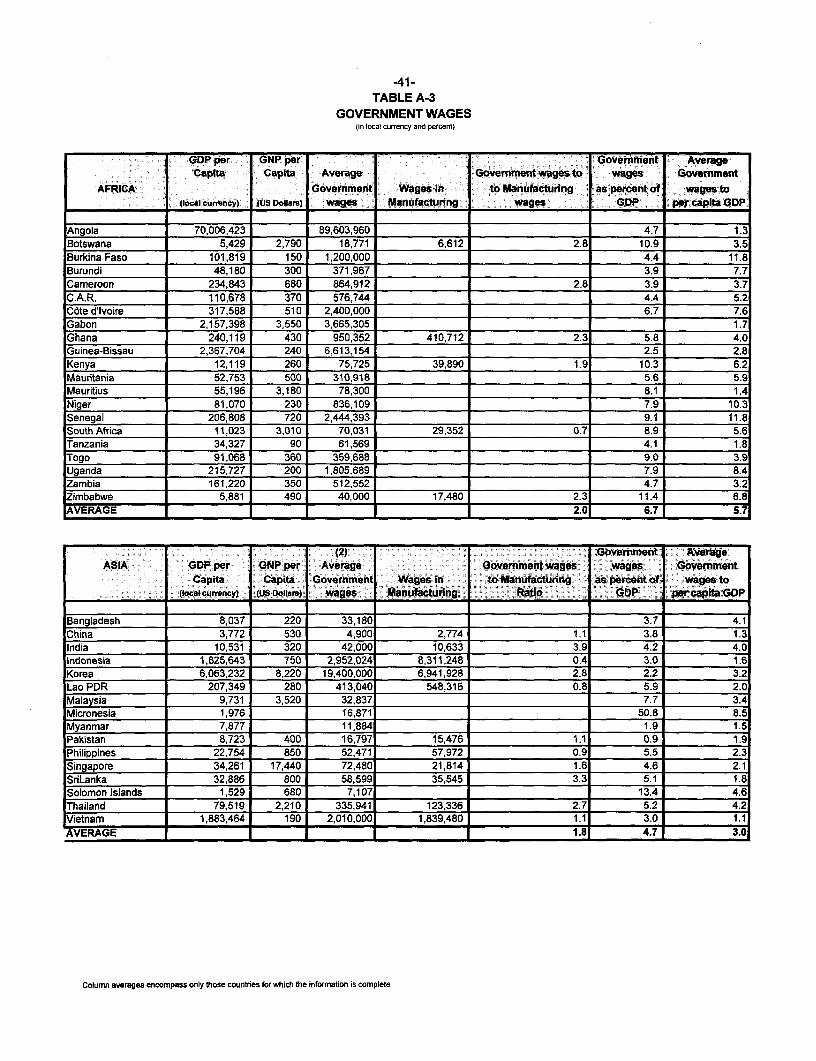
-41-TABLE A-3
GOVERNMENT WAGES(in local cunency and percent)
GDP per GNP per Government AVOergapaota Capita Average Governmentwagestoi wages; Government
AFRfICAXf : y : : : :: g iGovernment Wages in to Manufacturing asspercent'of Ewages to___________:_ ( localcurrency) (US Dollars) wages Manufacturing wages GOP vper capita GP
Angola 70,006,423 89,603,960 4.7 1.3Botswana 5,429 2,790 18,771 6,612 2.8 10.9 3.5Burkina Faso 101,819 150 1,200,000 4.4 11.8Burundi 48,180 300 371,967 3.9 7.7Cameroon 234,843 680 864,912 2.8 3.9 3.7C.A.R. 110,678 370 576,744 4.4 5.2Cote d'lvoire 317,588 510 2,400,000 6.7 7.6Gabon 2,157,398 3,550 3,665,305 1.7Ghana 240,119 430 950,352 410,712 2.3 5.8 4.0Guinea-Bissau 2,367,704 240 6,613,154 2.5 2.8Kenya 12,119 260 75,725 39,890 1.9 10.3 6.2Mauritania 52,753 500 310,918 5.6 5.9Mauritius 55,196 3,180 78,300 8.1 1.4Niger 81,070 230 836,109 7.9 10.3Senegal 206,808 720 2,444,393 = __= __ 9.1 11.8South Africa 11,023 3,010 70,031 29,352 0.7 8.9 5.6Tanzania 34,327 90 61,569 4.1 1.8Togo 91,068 360 359,688 9.0 3.9Uganda 215,727 200 1,805,689 7.9 8.4Zambia 161,220 350 512,552 4.7 3.2Zimbabwe 5,881 490 40,000 17,480 2.3 11.4 6.8AVERAGE 2.0 6.7 5.7
(2)~ Giemt AvrgASIA GDP per GNP per Avelrage Govemrnent wages wages Government
Capita n apita Government Wages in 6toManufcturing,h aspertof wagesto_________:__ (local crncs) (U ollars) wges. !ll.nuiinding. Rati GD pe ita P
Bangladesh 8,037 220 33,180 3.7 4.1China 3,772 530 4,900 2,774 1.1 3.8 1.3India 10,531 320 42,000 10,633 3.9 4.2 4.0Indonesia 1,825,643 750 2,952,024 8,311,248 0.4 3.0 1.6Korea 6,063,232 8,220 19,400,000 6,941,928 2.8 2.2 3.2Lao PDR 207,349 280 413,040 548,316 0.8 5.9 2.0Malaysia 9,731 3,520 32,837 7.7 3.4Micronesia 1,976 16,871 50.8 8.5Myanmar 7,877 11,884 1.9 1.5Pakistan 8,723 400 16,797 15,476 1.1 0.9 1.9Philippines 22,754 850 52,471 57,972 0.9 5.5 2.3Singapore 34,261 17,440 72,480 21,814 1.6 4.6 2.1SriLanka 32,886 800 58,599 35,545 3.3 5.1 1.8Solomon Islands 1,529 680 7,107 13.4 4.6Thailand 79,519 2,210 335,941 123,336 2.7 5.2 4.2Vietnam 1,883,464 190 2,010,000 1,839,480 1.1 3.0 1.1AVERAGE 1.8 4.7 3.0
Column averages encompass only those countries for which the information is complete

-42-TABLE A-3
GOVERNMENT WAGES(in local currency and percent)
EASTERN GDP per GNP per Govemrnment AverageEUROPE AND Capita Capita Average Govemment wages wages Public
FORMER USSR Government Wages in to Manufacturing as percent of wages to(local currency) (US dollars) wages Manufacturing Ratio GDP per capita GDP
Central & Eastern EuroDeAlbania 63,872 360 80,710 118,032 0.7 7.2 1.3Bulgaria 32,258 1,170 45,024 43,194 1.0 2.7 1.4Croatia 20,963 2,530 28,320 24,996 1.1 3.0 1.4Hungary 343,056 3,520 216,000 261,012 0.8 3.3 0.6Macedonia 37,505 790 70,962 6.0 1.9Poland 5,493,225 2,470 32,148,000 6.1Romania 262,831 1,150 238,559 650,940 0.4 5.8 0.9Slovakia 64,145 2,070 61,884 74,316 0.8 0.7 1.0Turkey 32,100,609 2,970 65,595,018 35,702,304 1.8 2.1 2.0
Former Soviet UnionArmenia 1,045 670 855 1.8 0.8Azerbaijan 21,273 500 34,729 247,020 0.1 1.8 1.6Belarus 89,710 2,160 40,766 70,224 0.6 3.9 0.5Estonia 14,694 2,820 17,940 12,432 5.6 1.2Georgia 274,600,000 580 27,059,712 0.8 0.1Kazakhstan 177,833 1,110 22,488 | 2.8 0.1Kyrgyz R 1,541 610 1,291 | 4.9 0.8Latvia 87 2,290 614 561 1.1 6.3 7.1Lithuania 3,700 1,350 4,360 70,608 2.5 3.6 1.2Moldova 4,095 870 1,848 1,718 5.5 0.5Russia 127,834 1,910 42,360 1.7 0.3Turkmenistan 72,482 1,390 _Ukraine 2,876,239 1,670 2,013,367 2,590 1 0.7Uzbekistan l l l lAVERAGE 0.61 3.8 1.3
LATIN GDP per GNP Govemment AverageAMERICA Capita per capita Average Goverrnment wages wages Government
AND Government Wages in to Manufacturing as percent of wages toCARIBBEAN (in local currency) (US Dollars) wages Manufacturing wages GDP per capita GDP
Antigua & Barbuda 21,175 6,540 18,503 11.5 0.9Argentina 7,466 7,270 17,812 2.1 2.4
Barbados 12,617 6,230 20,907 1.7Belize 5,374 2,613 8,620 1.6Bolivia 3,172 770 10,750 9,295 1.2 4.0 3.4Chile 1,566,236 3,170 6,571,077 1.8 3.9 4.2Colombia 1,200,245 1,620 2,864,046 3,539,923 2.7 2.4Ecuador 3,312,204 1,310 6,429,807 6.5 1.9El Salvador 12,919 1,480 24,060 5.3 3.6Guyana 50,061 430 180,288 1.6 4.4 1.9Honduras 3,763 600 15,075 8.5 4.0Nicaragua 2,994 340 9,492 14,242 1.5 7.0 3.2Uruguay 16,793 3,960 35,132 23,414 5.0 2.1Venezuela 392,459 2,760 706,836 4.8 1.8
AVERAGE 1.5 4.9 2.5
Column averages encompass only those countries fbr which the infornation is complete.
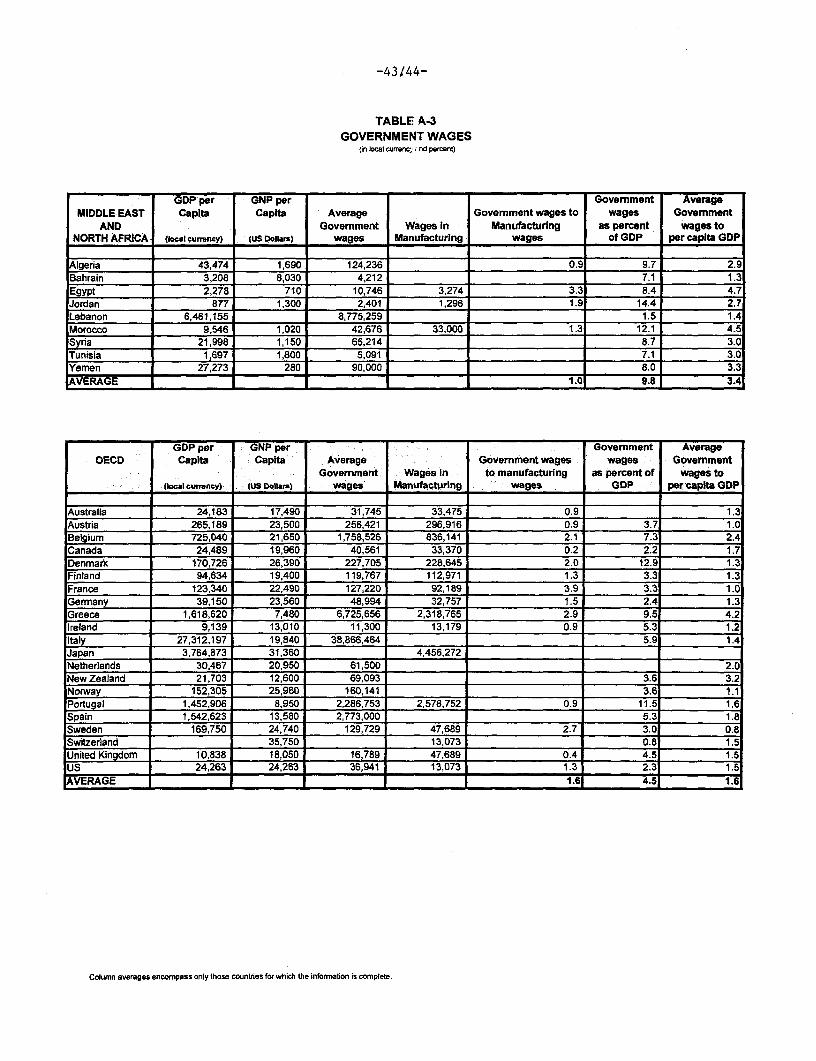
-43/44-
TABLE A-3GOVERNMENT WAGES
(in local currencr, nd percent)
GOP per GNP per Govemment AverageMIDDLE EAST Capita Capita Average Government wages to wages Govemment
AND Govemment Wages in Manufacturing as percent wages toNORTH AFRICA (local currOncy) (US Dollars) wages Manufacturing wages of GDP per capita GDP
Algeria 43,474 1,690 124,236 0.9 9.7 2.9Bahrain 3,208 8,030 4,212 7.1 1.3Egypt 2,278 710 10,746 3,274 3.3 8.4 4.7Jordan 877 1,300 2,401 1,296 1.9 14.4 2.7Lebanon 6,461,155 8,775,259 1.5 1.4Morocco 9,546 1,020 42,676 33,000 1.3 12.1 4.5Syria 21,998 1,150 65,214 8.7 3.0Tunisia 1 1,697 1,800 5,091 _ 7.1 3.0Yemen 27,273 280 90,000 1 8.0 3.3AVERAGE 1.0 9.8 3.
GDP per GNP per Government AverageOECD Capita Capita Average Govemment wages wages Govemment
Govemment Wages In to manufacturing as percent of wages to(local curcncy) (US Donars) wages Manufacturing wages GDP per capita GDP
Australia 24,183 17,490 31,745 33,475 0.9 1.3Austria 265,189 23,500 256,421 296,916 0.9 3.7 1.0Belgium 725,040 21,650 1,758,526 836,141 2.1 7.3 2.4Canada 24,489 19,960 40,561 33,370 0.2 2.2 1.7Denmark 170,726 26,390 227,705 228,645 2.0 12.9 1.3Finland 94,634 19,400 119,767 112,971 1.3 3.3 1.3France 123,340 22,490 127,220 92,189 3.9 3.3 1.0Germany 39,150 23,560 48,994 32,757 1.5 2.4 1.3Greece 1,618,620 7,480 6,725,656 2,318,765 2.9 9.5 4.2Ireland 9,139 13,010 11,300 13,179 0.9 5.3 1.2Italy 27,312,197 19,840 38,866,464 5.9 1.4Japan 3,764,873 31,360 4,456,272Netherlands 30,467 20,950 61,500 2.0New Zealand 21,703 12,600 69,093 3.6 3.2Norway 152,305 25,960 160,141 3.6 1.1Portugal 1,452,906 8,950 2,286,753 2,578,752 0.9 11.5 1.6Spain 1,542,623 13,580 2,773,000 5.3 1.8Sweden 169,750 24,740 129,729 47,689 2.7 3.0 0.8Switzerland 35,750 13,073 0.8 1.5United Kingdom 10,838 18,050 16,789 47,689 0.4 4.5 1.5US 24,263 24,263 36,941 13,073 1.3 2.3 1.5AVERAGE __ 24_263 __ 4 1.6 4.S 1.6
Column averages encompass only those countiles for which the informabon is complete.
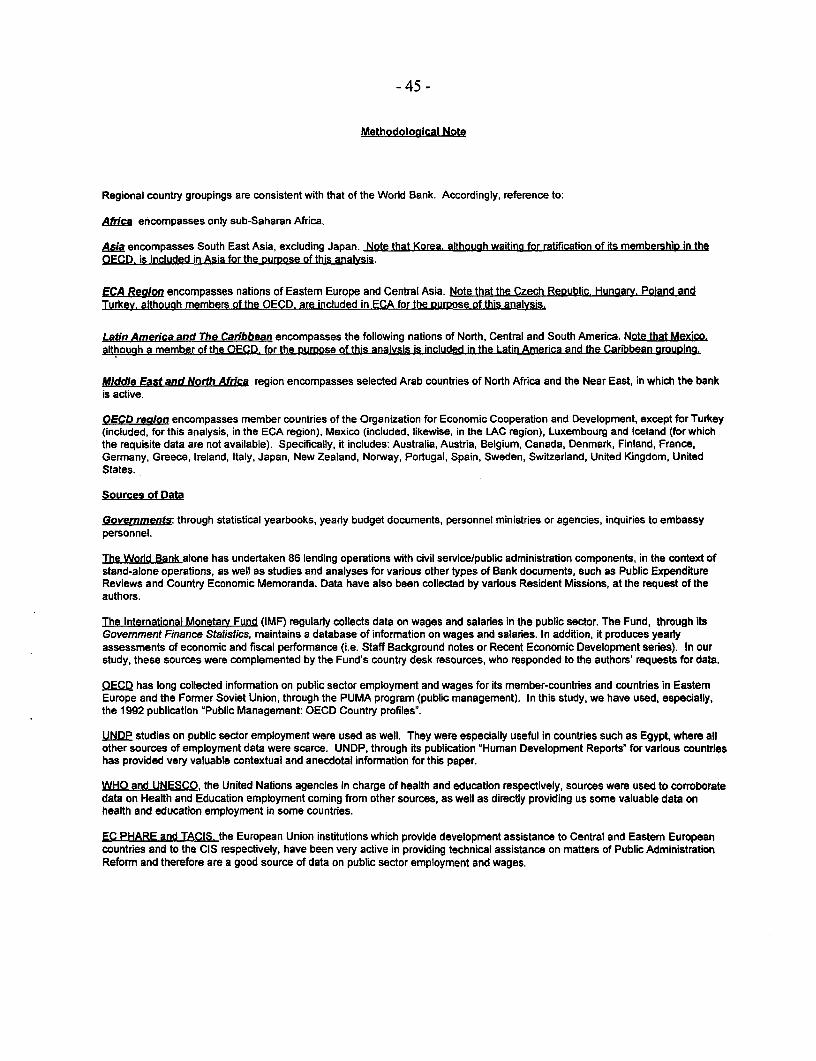
- 45 -
Methodological Note
Regional country groupings are consistent with that of the World Bank. Accordingly, reference to:
Af*ica encompasses only sub-Saharan Africa.
Asia encompasses South East Asia, excluding Japan. Note that Korea. although waiting for ratification of ts membership in theOECD, is included in Asia for the purpose of this analysis.
ECA Region encompasses nations of Eastern Europe and Central Asia. Note that the Czech Republic. Hungary. Poland andTurkey. aithough members of the OECD. are included in ECA for the ouroose of this analysis.
Laffn America and The Canibbean encompasses the following nations of North, Central and South America. Note that Mexico.although a member of the OECD. for the purpose of this analysis is included in the Latin America and the Caribbean grouping.
Middle East and North Africa region encompasses selected Arab countries of North Africa and the Near East, in which the bankis active.
OECD 0egion encompasses member countries of the Organization for Economic Cooperation and Development, except for Turkey(included, for this analysis, in the ECA region), Mexico (included, likewise, in the LAC region), Luxembourg and Iceland (for whichthe requisite data are not available). Specifically, it includes: Australia, Austria, Belgium, Canada, Denmark, Finland, France,Germany, Greece, Ireland, Italy, Japan, New Zealand, Norway, Portugal, Spain, Sweden, Switzerland, United Kingdom, UnitedStates.
Sources of Data
Governments: through statistical yearbooks, yearly budget documents, personnel ministries or agencies, inquiries to embassypersonnel.
The World Bank alone has undertaken 86 lending operations with civil service/public administration components, in the context ofstand-alone operations, as well as studies and analyses for various other types of Bank documents, such as Public ExpenditureReviews and Country Economic Memoranda. Data have also been collected by various Resident Missions, at the request of theauthors.
The Intemational Monetary Fund (IMF) regularly collects data on wages and salaries in the public sector. The Fund, through itsGovemment Finance Statistics, maintains a database of information on wages and salaries. In addition, it produces yearlyassessments of economic and fiscal performance (i.e. Staff Background notes or Recent Economic Development series). In ourstudy, these sources were complemented by the Fund's country desk resources, who responded to the authors' requests for data.
OECD has long collected information on public sector employment and wages for its member-countries and countries in EastemEurope and the Former Soviet Union, through the PUMA program (public management). In this study, we have used, especially,the 1992 publication 'Public Management: OECD Country profiles".
UNDP studies on public sector employment were used as well. They were especially useful in countries such as Egypt, where allother sources of employment data were scarce. UNDP, through its publication 'Human Development Reports" for various countrieshas provided very valuable contextual and anecdotal information for this paper.
WHO and UNESCO, the United Nations agencies in charge of health and education respectively, sources were used to corroboratedata on Heafth and Education employment coming from other sources, as well as directly providing us some valuable data onhealth and education employment in some countries.
EC PHARE and TACIS. the European Union institutions which provide development assistance to Central and Eastem Europeancountries and to the CIS respectively, have been very active in providing technical assistance on matters of Public AdministrationReform and therefore are a good source of data on public sector employment and wages.

- 46 -
Technical Notes
Population labor and Emoloyment
Population and Labor Force: Population data are based, in most cases, on a de facto definition. Refugees not permanentlysettled in the country of asylum are generally considered to be part of the population of the country of their origin.
The total labor force consists of the 'economically active' population - a restrictive concept that includes the armed forces andthe unemployed but excludes homemakers and other unpaid caregivers.
Participation rate: This concept refers to the percentage of the population that is economically active.
Unemployment: This concept is in accordance with the Resolution concerning statistics of the economically activepopulation, employment, unemployment and underemployment adopted by the Thirteenth Intemational Conference of laborstatisticians (1982). It comprises all persons between the ages of 15 and 64 who, during the reference period, were withoutwork, currently available for work and seeking work.
There are, however, ample differences in the way each individual country treats this definition when compiling its ownstatistics. In a number of cases, national definitions of unemployment differ from the recommended standard definition.Differences relate to the age limits, treatment of persons temporarily laid off, and of persons seeking work for the first time.
Furthermore, intercountry comparisons are also affected by the variety of types of sources used to obtain information onunemployment and the differences in scope and coverage of such sources. In this study, the data will relate to the entirecountry in question. Rural areas, however, have tended to be less well covered than other areas in unemployment statistics.
In general, there are four main sources of unemployment statistics which may be distinguished.
* Labor force sample surveys or general household sample surveys generally provide very complete statistics onunemployment since, in particular, they include groups of persons who are not covered in unemployment statistics byother methods.
* Social Insurance Statistics which come from compulsory unemployment insurance schemes, which as a rule havebroad industrial coverage and relate to wage earners and salaried employees, or sometimes to wage eamers only.Unemployment figures are then computed by comparing the number of people drawing insurance benefits with thetotal number of insured persons covered by schemes. The problem with this type of approach is that it is difficult toascertain whether the people covered by the insurance scheme are representative of the country or whether theycover enough people. Therefore the data will give a distorted picture of unemployment in the former case or simplyunderestimate unemployment in the second.
* Employment office statistics generally refer to the number of applicants for work on the registers at the end of eachmonth. They may include people without a job, but also people on strike, or temporarily unable to work and personsengaged on unemployment relief projects. While the statistics, in principle, do not include persons already inemployment, some series also include persons in employment who are seeking a change of job or extra work and aretherefore registered at employment offices. The value of these statistics varies widely. Where, for example,employment offices function in close connection with unemployment insurance, and registration is a qualifyingcondition for the receipt of unemployment benefits, they are comparable in reliability to compulsory unemploymentinsurance statistics. On the other hand, where registration is entirely voluntary and especially where the employmentoffices function only in the more populous regions of a country, or are not widely patronized by employees seekingwork or by employers seeking workers, the data are generally very incomplete and do not give a reliable indication ofthe extent of unemployment. The scope of employment office statistics is therefore very difficult to ascertain and, ingeneral, these statistics are not comparable from country to country.
* Official estimates, which are provided by national authorities and are usually based on combined information drawnfrom one or more of the above sources.
Non-Agricultural employment This concept covers all major divisions of economic activity other than the major division'Agriculture, hunting, forestry and fishing".
Public Sector Employment
The conceptual definitions used in this study are consistent with the Intemational Standards put forth in the System of NationalAccounts, to which the majority of our sources, especially International Organizations, adhere.
Employment data cover both full-time and part-time employees. Whenever possible, the differences in employee status werehighlighted in the country notes accompanying the tables.

- 47 -
General Government and Public Enterprises together make up the largest aggregate called Public Service. The relationshipbetween the 'boxes' we have created is shown in Table A-1.
General government includes employment in 'all government departments offices, organizations and other bodies which areagencies or instruments of the central or local authorities whether accounted for or financed in, ordinary or extraordinary budgets orextra-budgetary funds. They are not solely engaged in administration but also in defense and public order, in the promotion ofeconomic growth and in the provision of education, health, cultural and social services."'
Within General Government we have distinguished five different units which are mutually exclusive categories.
Government administration includes executive and legislative administration by departments directly dependent on theHead of State or the Parliament, together with all other ministries and administrative departments. Consequently,government administration in our definition is general government less teaching and health personnel.
Government administration is in turn divided into two categories:
Central Govemment, which includes all employees paid by the central government budget;
Non-central oovemment, which encompasses all govemment administration employees who are not specifically fundedby the central government. It includes municipalities, as also regional, provincial or state (in a federal system)employment.
The distinction here is not solely a geographical one, but more importantly a budgetary one. Non-central Government employeesare those people who appear in the books of a non-central govemment organization, and not all those employees who are postedlocally. Therefore, the definition makes a clear distinction between decentralization and deconcentration. Deconcentration, i.e., thegeographical dispersal of central government entities without changing their lines of ultimate authority and sources of finance isunderstood here as a different method of exercising central govemment functions and not as a basic change in the powerrelationships between central and local governments. While deconcentration is an important development our underlyingassumption is the traditional one: "he who pays the piper calls the tune'.
Health employmen. covers employees of government hospitals and other govemment health institutions at all levels ofgovernment. It includes medical and paramedical staff (doctors, and nurses), laboratory technicians and workers intechnical facilities. Wherever possible, administrative employees working in the health sector have been placed inGovemment administration and not in health employment.
Education employment covers primary, secondary and university education employment. Where we were able toidentify them, administrative employees either working in the Ministry of Education or in the school system were placed inGovemment administration.
Defense: includes all enlisted personnel (including conscripts) and professional military. Where we were able to identifythem, administrative employees of the Ministry of Defense were considered to be part of Govemment administration.Since defense is not within the scope of this study, we will focus essentially on Civilian Govemment
Reference is occasionally made to Consolidated Central Govemment - this definition, consistent with data originating from theIMF, corresponds to Govemment administration, education and health employment.
In the public sector, but outside of General Government, are Public Enterprises, majority-owned, directly or indirectly, by thestate. Employment in public enterprises is also not discussed in this study as it raises very different issues from governmentemployment.
Government Wages
Certain concepts require further explanation:
Average Government wages: Represents the ratio between Central government's wage bill and the number of central govemmentemployees. It is important to note, in this instance, that the difference in functions that each individual country imparts onto itsgovernment complicates the calculation of this data. Issues of how to classify government employees, are relevant to thisdiscussion. Where a specific source is listed for this item, the authors have used already available figures, thereby considerablyreducing any doubt as to their accuracy. Where the source is not listed, the figure is the result of authors' estimates, and thereforerequires an extra amount of caution.
1 International Standard of Industrial Classification of All Economic Activities (ISIC), Series M No.4, Rev 3- 1990.

-48 -
Average Government wages to per capita GDP: is meant to provide information on the condition of an average CentralGovernment employee of a particular country in relation to the living standard of that country, as measured by the per capita GDP.It is therefore calculated by dividing the average wage by the per capita GDP estimate. This, however, sometimes fails toencapsule the real conditions of central government employees to the extent that certain non-wage benefits are not included in theestimate of the average central Govemment wage.
GNP per capita (in US Dollars) is from WB database and relates to the same year as GDP per capita in local currency.
- 49 -
Sources
Population and labor force data are taken from the World Bank's Social Indicators of Development 1996 and refer to 1994, unlessotherwise indicated. Unemployment rate taken from CIA Factbook 1995, unless otherwise indicated.
Military employment data are taken from International Institute for Strategic Studies: The Military Balance Survey of 1995-96,unless otherwise specified.
Wages and salaries are taken from IMF Government Finance Statistics, 1995 and GDP from World Tables 1995, unless otherwisespecified.
Afcka
AngolaData on Central Government and military employment relate to 1995 and are broken down as follows: 120,000 civilservice (central and provincial governments) and 82,000 police. Data on Health employment relate to 1990.(Source: Health Project of October 23, 1992 -- Staff Appraisal Report). The report states that the number of MOHWorkers was 27,771, of which 662 were physicians, 9,145 paramedical (mainly nurses), 1,691 traditional birthattendants, 4,165 health promoters (and others with little or no health training). Data on Education are taken fromPeter Ngoba, Education Specialist for Angola, and are broken down as follows: 31,900 teachers for the first fourgrades, 3,200 teachers for fifth and sixth grade, 1,100 for seventh and eighth, 170 for pre-university, 300 for normal(teacher training), 280 for technical education and 650 for higher education. Data are for 1992. Data on LocalGovernment employment are an estimate of provincial government from AFlMI and relate to 1995. Angola'ssituation is greatly affected by the Civil War that has engulfed that country for the past two decades. Data must behandled with great care. Data on Wages and salaries as percentage of GDP are taken from IMF Background paperNo. SM/951258 of October 4, 1995 and relate to 1994. GDP, Average Government wages and Average Publicwages to per capita GDP are based on calculations emanating from this data. Non-agricultural employment dataare taken from International Labor Office's Yearbook of Labor Statistics 1995 and are for 1992. They reflect datagathered through Establishment surveys, that is, data on the number of workers on establishment payrolls. This inturn may result in an underestimation of employment.
BotswanaBotswana Central Government employment and local Government employment are taken from IMF Report No.SM/94/278 of November 15, 1994 and relate to 1993. Education data is taken from UNESCO Statistical Yearbook.1995 and relates to 1992. It includes 10409 primary education teachers and 4467 secondary level teachers.Military employment data includes 7,000 personnel in the army and 500 in the air force. Wages and Salaries ofConsolidated Central Government relate to 1993. All other data are obtained through calculations emanating fromthis data. Data on wages in manufacturing are taken from the ILO's Yearbook of Labor Statistics 1995 and refer to1994.
Burkina FasoUnemployment data are taken from the ILO's Yearbook of Labor Statistics 1995 and refer to 1994 and source IlIl,Code 2: employment office statistics and include persons in employment who are seeking a change of job or extrawork and are therefore also registered at employment offices. This method of data gathering may result in anunderestimation of the actual unemployment rate, since registration at the employment office requires time andmoney and the incentives may not be sufficient to justify it. Central Govemment Employment is taken from IMFStaff Country Report No. 96/5 of February 1996. It relates to 1994. Armed Forces estimates include theGendarmerie, a military corps entrusted with some policing activities. Average Civilian wage in the Public sector istaken from the IMF Staff Country Report No. 96/5 Burkina Faso-Background Papers and Statistical Update andrefers to 1994. GDP per capita is an estimate based on GDP at market prices figures stated in the IMF StaffCountry Report No. 96/5, and refers to 1994. Wages and Salaries as percent of GDP is based upon IMF StaffCountry Report No. 96/5 estimate of Civilian Wage bill and GDP at market prices and refers to 1994. Averagewage over per capita GDP is the result of the division of these two results.
BurundiPopulation estimate is taken from IMF Report No. 96/43 of May 1996 and relates to 1996.Labor force data are taken from the World Bank's Social Indicators of Development 1996 and refer to 1994.Paid employment in non-agricultural activities is drawn from the ILO's Yearbook of Labor Statistics 1995 and refersto 1992. The data are from official estimates of the Burundian government.Unemployment data are taken from the ILO's Yearbook of Labor Statistics 1995, refer to 1992 and source 1II, Code2: employment office statistics and include persons in employment who are seeking a change of job or extra workand are therefore also registered at employment offices. This method of data gathering may result in anunderestimation of the actual unemployment rate, since registration at the employment office requires time andmoney and the incentives may not be sufficient to justify it. Central Government, Education, Health and State-owned enterprise employment data are from IMF Staff Country Report No. 96/43 of May 1996 and relate to October1995. Armed Forces estimates include the Gendarmerie.
- 50 -
Civilian wage bill in the Central Govemment is taken from IMF Staff Country Report No. 96/43-Burundi StatisticalAnnex and refers to 1995. GDP at market price is an estimate from the same report for 1995. Accordingly, GDPper capita, Average Central Govemment wage, Wages and salaries as percent of GDP as well as AverageGovemment Salary are based on this data.
CameroonData on Central Govemment and employment come from Marc Stephens (AF5CO) and is for 1993. Education dataare provided by Herbert Bergmann (AF3PH) and are for 1994/95. Total Teaching staff is estimated at 67,530, ofwhich 40,970 are in primary schooling, and 14,917 in general secondary. Administrative staff is estimated at 650 forthe central level, and 200-300 people at the provincial level (20-30 staff for each of the 10 provinces). At lowerlevels, sub-delegations have been created but the number of employees is unknown. There are 67 Inspectorates atdepartmental levels with 3-5 staff each (201-335 people) and 200 sub-inspectorates (number of employeesunknown). Total administration staff is therefore estimated at 1,235, which will be included among central and non-central govemment employment respectively and not in education employment. Health employment is from WHOand is for 1993. GDP is taken from World Tables 1995 and refers to 1993. Data on Central Govemment wage bill(civilians) are projections from Mark Stephens for 1995, based on IMF Background document of December 11, 1994and mission calculations. Average monthly civilian rate is also from the same document.
Cape VerdePopulation data are taken from the World Bank's Social Indicators of Development 1996 and refer to 1994.Labor Force and unemployment data are taken from IMF Report SW96/212 Recent Economic Developments ofAugust 12, 1996 and relate to 1995. Data on Central Government, Non-central Govemment, Education and Healthand State-owned enterprises employment are taken from IMF Report No. SM/96/212 of August 12, 1996 and relateto 1995 (estimates).
Central African RepublicPaid employment in non-agricultural activities is drawn from the ILO's Yearbook of Labor Statistics 1995 and refersto 1990. Non-agricultural employment is taken from ILO's Yearbook of Labor Statistics 1995 and is for 1992. Itreflects data gathered through Establishment surveys, that is, data on the number of workers on establishmentpayrolls. This in tum may result in an underestimation of employment. Armed forces include 2,300 personnel in theGendarmerie, a military paramilitary corps entrusted with many domestic policing activities. Education data aregiven by Herbert Bergmann (AF3PH). Teachers make up 4,314 people and teachers in administrative posts number486.Wages and Salaries as percent of GDP is from Antoine Schwartz, Senior Economist, PSP, and is for 1994.
ChadPaid employment in non-agricultural activities is drawn from the ILO's Yearbook of Labor Statistics 1995 and refersto 1991.Data on Central Govemment, Education and Health come from IMF Staff Country Report No. 96/61, StatisticalAnnex IV of July 1996, and relate to 1995.
ComorosPopulation, labor force, and unemployment estimates are taken from IMF Study SM/96/221 of August 16, 1996 andrelate to 1991. All other estimates emanate from this data.Estimates on Central Government, Non-central Government, Education and Health employment are taken fromRecent Economic Developments, IMF study no. SM 96/221 of August 16, 1996 and relate to 1995.
CongoCentral Govemment, Education and Health employment are taken from Recent Economic Developments, IMFReport No. SMW941123, and relate to 1993. Public enterprise employment is also from the IMF Report for 1993. Itprobably understates the actual number of employees as it covers only the largest key state-owned enterprises.
C6te d'lvoirePaid employment in non-agricultural activities is drawn from the ILO's Yearbook of Labor Statistics 1995 and refersto 1990. Data are from official sources of the Ivorian govemment.Unemployment is taken from the Private Sector Assessment of December 29, 1994 (pg. 4, para. 1. 13).Paid employment in non-agricultural activities is drawn from the ILO's Yearbook of Labor Statistics 1995 and refersto 1993. It reflects data gathered through Establishment surveys, that is, data on the number of workers onestablishment payrolls. This in tum may result in an underestimation of employment.Central Govemment employment is taken from 'Atelier Regional de la Fonction Publique" of the Ministry of PublicAdministration (July 1995) and relates to 1993. Local govemment employment is taken from the Appendix of theMunicipal Supogrt Probect of March 1995 and relates to 1993. This document, the govemments policy letter, statesthat permanent positions number 11,832 for local administration and as many as 10,000 occasional workers.Occasional workers are not included in non-central Govemment employment estimate. Military employment datainclude the Presidential guards (1,100) and the Gendarmerie (4,400), but do not include reserves.

- 51 -
GDP at Market Prices and wage bill estimates are from Ian Lienert (IMF) and relate to 1995. Accordingly, GDP percapita, Wages and salaries as percent of GDP are based on this data Average central government wage is takenfrom IMF Report No. SM/96/276 of November 1, 1996 and relates to 1995.
DjiboutiCentral Govemment Employment, Education and Health employment data are taken from IMF Staff Country ReportNo. 96/44 of June 1996 and relate to 1995. State-owned enterprise employment data are also taken from IMF StaffCountry Report 96/44 of June 1996 but relate to 1992.
EthiopiaUnemployment data are taken from the ILO's Yearbook of Labor Statistics 1995, refer to 1993 and source IlIl, Code1: Employment office statistics and include people who are registered on the books of the employment office. Thisestimate may be underestimating the number of unemployed persons in Ethiopia.General Government employment is taken from WB Report No. 12992 ET, Public Expenditure Review of October21, 1994 and relates to 1994. Employment is State Owned enterprise estimates are taken from IMF Report No.SM/94/234 of August 31, 1994 and relates to 1994. Following the declaration of independence by Eritrea in April1993, the estimated strength of the Ethiopian armed forces is some 120,000. Most are former members of theTigray Liberation Front, with perhaps 10-15,000 from the Oromo Liberation front. Estimated numbers in servicemust be taken with caution.
GabonNon-agricultural employment is from IMF Report SMI/95/242 , Background Paper of September 19, 1995 and relatesto 1993.Central Government, Non-Central Government and State-owned enterprise employment is taken from IMFBackground Paper No. SM 95/242 of September 19,1995 and relates to 1993. Education data are supplied byHerbert Bergmann AF3PH and are for 1995. Education employment is made up of 6,530 teachers, of which 4,412are for elementary schools, and 2,118 for secondary schools.GDP and Wages and Salaries estimates are taken from IMF Background Paper No. SM/95/242 of September19,1995 and relate to 1995.
GambiaPaid employment in non-agricultural activities is drawn from the ILO's Yearbook of Labor Statistics 1995 and refersto 1987. It reflects data gathered through Establishment surveys, that is, data on the number of workers onestablishment payrolls. This in tum may result in an underestimation of employment.Central, Non-Central, Education and Health employment are taken from IMF Report No SM/95/238 of September18, 1995, Statistical Annex and relate to 1994/95.
GhanaPaid employment in non-agricultural activities is drawn from the ILO's Yearbook of Labor Statistics 1995 and refersto 1991. It reflects data gathered through Establishment surveys, that is, data on the number of workers onestablishment payrolls. This in tum may result in an underestimation of employment.Central Government employment corresponds to 'Civil Service organizations". Local Govemment corresponds toMetropolitan, municipal and district assemblies. The number for Education Service excludes 18,000 trainees.Education is believed to continue to be paid by the central government since recurrent expenditures authority hasnot yet been devolved to local authorities. Health employment data include people working for the Ministry of Healthand people working in Health for subvented agencies. No information is available regarding administration staff inboth these areas; accordingly, data on health probably overstates the number of medical personnel and understatesthat of central government personnel. Military employment does not include paramilitary personnel in the people'smilitia (5,000 part-time force with police duties), or the Presidential Guard (one infantry battalion). State-ownedEnterprise employment is taken from IMF Staff country Report No. 96/69 of August 1996. It states that from the240,000 jobs which state-owned enterprises provided in the 1980's, 41,000 had been retrenched by 1993 andadditional jobs were being targeted by the Bank-funded PSAC in 1996-97. Therefore the figure of 1993 correspondsto the 240,000 less the 41,000.Wages and salaries for Consolidated Central Government are from IMF Government Finance Statistics, 1995 andrelate to 1993. Data on wages in manufacturing (monthly basis) is taken from the International Labor Office'sYearbook of Labor Statistics 1995 and refers to 1991.
GuineaMilitary employment includes 7,500 conscripts, but does not include paramilitary forces such as the people's militia(7,000), the gendarmerie (1,000) or the Republican Guard (1,600).
Guinea BissauUnemployment estimate is from WB Country economist and relate to 1995.Data on Central Government come from Marcelo Andrade (AF5CO) based on his February 1996 mission, and refersto the end of 1995. Data on Education and Health are from IMF estimations. Source: Esteban Garcia de Motiloa(AF5CO). Local Government employment is a staff estimate (AF5CO).
- 52 -
GDP estimate is taken from World Tables 1995 and relates to 1993. Wages and salaries are from Esteban Garciade Motiloa (AF5CO) and relate to 1994.
KenyaPaid employment in non-agricultural activities is drawn from the ILO's Yearbook of Labor Statistics 1995 and refersto 1991. It reflects data gathered through Establishment surveys, that is, data on the number of workers onestablishment payrolls. This in turn may result in an underestimation of employment.Central government, Non-Central government, and Education data are taken from 1995 Economic Survey publishedby the Central Bureau of Statistics. Data are for 1994. Health employment is taken from the Republic of Kenya'sCentral Bureau of Statistics' Statistical Abstract. 1991 and relates to 1991. Public Health employment statistics mustbe read with caution. Since there is a fee for registration and no annual license, respective registers may includethose who do not practice or who have left the country. Employment in state-owned enterprises is taken from 195Economic Survey published by the Central Bureau of Statistics and relates to 1994. Employment in State-ownedenterprises is made up as follows: 106,900 persons working in parastatals fully owned by the Republic of Kenya(Includes Kenya Railways, Kenya Ports Authority, Kenya Posts and Telecommunications Corporations, KenyaAirways Ltd), and 48,800 persons in those institutions with a majority control by the public sector.GDP and wages and salaries of Consolidated Central Government are from IMF Government Finance Statistics,1995 and relate to 1994. Data on wages in manufacturing are taken from the International Labor Office's Yearbooof Labor Statistics 1995 and refer to 1991.
LesothoUnemployment rate and non agricultural employment estimates are for 1993, and are taken from Report No 13171-LSO, Poverty Assessment and reads: "The unemployment rate in 1993 - counting unemployment andunderemployment - was estimated to be an alarming 35 to 45%". We have taken the median value. Thisunemployment rate, however, clearly overstates the actual unemployment in Lesotho, particularly compared to othernations in our survey.Data on Central Government employment, and Education employment are taken from IMF Study SM/96/234 ofSeptember 9, 1996 and relate to 1995.
MadagascarUnemployment data are taken from the ILO's Yearbook of Labor Statistics 1995. refer to 1989 and source IlIl, Code2: employment office statistics and only include persons who are actually registered at the employment office at theend of each month. Accordingly, they are likely to understate the number of unemployed persons in Madagascar.Data on Central Government employment are taken from the IMF Staff Country Report No. 96/59, Madagascar -Selected Issues and Statistical Annex, dated June 1996 and relate to 1994. Data on State-owned enterprises aretaken from the IMF Staff Country Report No. 96/59 Madagascar - Selected Issues and Statistical Annex, dated June1996 and relate to 1994. The number stated probably underestimates the actual number of employees of State-owned enterprises.
MalawiPaid employment in non-agricultural activities is drawn from the ILO's Yearbook of Labor Statistics 1995 and refersto 1991. It reflects data gathered through Establishment surveys, that is, data on the number of workers onestablishment payrolls. This in turn may result in an underestimation of this particular form of employment.Central Government, Education and Health employment is taken from the Malawi Government Civil Service Censusof 1995, published on March 30,1996 and relates to 1995.
MaliCentral Government employment, education and health employment data are taken from Fabien Nsengyiumva(AFTM5) and relate to June 1996. Local Government employment in Mali, according to Mr. Nsengyiumva, is non-existent at the moment. Central Government employees are currently posted in the regions but are paid by theCentral Govemment budget. Mali is beginning the process of decentralization of government. Employment inState-owned enterprises is also taken from Mr. Nsengyiumva (AFTM5) and relates to June 1996.
MauritaniaCentral Government Employment, Education and Health employment are taken from IMF Staff Country Report No.96/45 of June 1996 and relate to 1994.Data on GDP at market prices, and Central Government wage bill are taken from IMF Staff Country Report No.96/45 of June 1996, and refer to 1993. Accordingly, GDP per capita, average Central Government wage rate andAverage Salary as a multiple of per capita GDP are calculated on the basis of this data.
MauritiusPaid employment in non-agricultural activities is drawn from the ILO's Yearbook of Labor Statistics 1995 and refersto 1994. It reflects data gathered through Establishment surveys, that is, data on the number of workers onestablishment payrolls. This in turn may result in an underestimation of employment.
- 53 -
Unemployment data are taken from the ILO's Yearbook of Labor Statistics 1995, refer to 1994 and source IlIl, Code1: Employment office statistics and only include persons who are actually registered at the employment office at theend of each month.Central, Non-central Govemment employment as well as Education and Health data are taken from the Republic ofMauritius' Central Statistical Office Digest of Labor Statistics, 1995 and relate to 1994.GDP at market prices is from IMF Background report No. 96/1 of January 1996 and refers to 1994. CentralGovernment Average salary is also taken from IMF background report and is for 1994. Data on that report was formonthly wages and therefore had to be multiplied by 12 to obtain yearly wages. Data on paid employment in non-agricutural activities is taken from the International Labor Office's Yearbook of Labor Statistics 1995 and refers to1988.
MozambiquePaid employment in non-agricultural activities is drawn from the ILO's Yearbook of Labor Statistics 1995 and refersto 1988. It reflects data gathered through Establishment surveys, that is, data on the number of workers onestablishment payrolls. This in tum may result in an underestimation of employment.
NamiblaUnemployment and employment in non agricultural activities data are taken from ILO sources.Central Govemment employment data is taken from Public Expenditure Review of July 12, 1995. Educationemployment data are also taken from Public Expenditure Review of July 12, 1995 (Table 10.4) and relate to 1994.They includes Primary School Teachers, Secondary School teachers and Literacy promoters. Health employmentestimate also are taken from the Public Expenditure Review of July 12, 1995 (Table 10.2) and relate to 1994. Theyinclude Doctors, Nurses, Community Health workers and Traditional Birth Attendants.
NigerPaid employment in non-agricultural activities is taken from the ILO's Yearbook of Labor Statistics 1995 and refersto 1991. The data reflect the working population.Unemployment data are taken from the ILO's Yearbook of Labor Statistics 1995, refer to 1991 and source l1l, Code1: Employment office statistics and do not include persons who are already in employment.Central Govemment, Education and Health employment is taken from Ide Gnandou in the Resident Mission in Niger(AF4NI) and relate to 1995. Data on military employment do not include personnel enlisted in the paramilitary, i.e.Gendarmerie (1,400), Republican Guard (2,500) or the national police (1,500).GDP at current prices is taken from World Tables 1995 and relates to 1993. Wage bill of Central Govemment istaken from Ida Gnandou (AF4NI) in the resident mission and relates to 1995. Calculations of Average CentralGovemment wages were reconfirmed with Mr. Gnandou. Data on paid employment in non-agricultural activities istaken from the Intemational Labor Office's Yearbook of Labor Statistics 1995 and refers to 1991.
NigeriaUnemployment data are taken from the ILO's Yearbook of Labor Statistics 1995, refer to 1993 and source 1ll, Code1: Employment office statistics and do not include persons who are already in employment.Data on Civil Service employment is taken from Nigeria Federal Expenditure Review of May 25, 1995 and relates to1993. Education employment is also taken from Niceria Federal Expenditure Review of May 25, 1995. Data refersonly to employees of the Federal Government. Responsibility over education are divided among all tiers ofgovemment, with the central govemment having the main responsibility over tertiary education, the stategovemments for secondary education and local governments for primary education. Health employment figures arealso from Nigeria Federal Expenditure Review of May 25, 1995 and only refer to the emplovees of the FederalGovemmenLi Data on military do not include personnel enlisted in paramilitary corps such as the Port SecurityPolice (2,000) or the Security and Civil Defense Corps (unknown).
Sao Tome & PrincipeGeneral Govemment employment estimate is from IMF Report 96170 of August 1996 and relates to 1993.
SenegalThe unemployment rate is taken from Priority Survey (Direction de la Prevision et de la Statistique) for the year1992. It does not include people who are currently underemployed as reported by Abdoulaye Seck (AF5SN) and isfor.1992.Central, non-central, education and employment data are provided by Abdoulaye Seck in the Senegal ResidentMission. Data on Education and Health are taken from a survey done by a local consulting firm in March 1995.Salaries for Health are entirely paid by the central administration. Contributions of local administrations are mostlyfor payment of salaries of temporaries (proctors, cleaning crews, etc.). This staff is not included in the total healthemployment. The Armed Forces, the largest component of military employment, is mostly made up of conscripts.The data on military employment do not include people enlisted in paramilitary corps such as the Gendarmerie(4,000).GDP estimates are from World Tables 1995 and relate to 1993. Wages and salaries estimate is taken fromAbdoulaye Seck (AF5SN) and is for 1994. Data on wages and salaries as multiple of per capita GDP was confirmedwith Mr. Seck and is consistent with results of other francophone countries.

- 54 -
SeychellesPaid employment in non-agricultural activities is drawn from the ILO's Yearbook of Labor Statistics 1995 and refersto 1990.
Sierra LeonePaid employment in non-agricultural activities is drawn from the ILO's Yearbook of Labor Statistics 1995 and refersto 1989.
South AfricaPopulation data are taken from IMF Government Finance Statistics and are for 1994. Unemployment rate is a CIAFadtbook 1995 estimate from 1994. Underemployment is estimated at 11%. Paid employment in non-agriculturalactivities is drawn from the ILO's Yearbook of Labor Statistics 1995 and refers to 1993.Data are taken from the South African Statistical Yearbook of 1992, and refer to 1991. Local GovernmentEmployment relates to both Provincial Govemment employment and Local authorities and self governing territories.Education and Health data are taken from UNESCO and WHO sources respectively and are for 1991. Regardingmilitary employment, an estimated 35,000 people from other forces, including MK and the Homelands, are beingabsorbed into the new South African National Defense Force. Of these 11,000 are already members.GDP estimate is taken from IMF Govemment Finance Statistics 1995 and is for 1994. Wages and salaries ofConsolidated Central Government are from IMF Govemment Finance Statistics 1995 and are for 1994 (provisional).Data on wages in manufacturing are from the International Labor Office's Yearbook of Labor Statistics 1995 andrefer to 1993.
SudanUnemployment data are taken from the ILO's Yearbook of Labor Statistics 1995, refer to 1992 and source l1l, Code2: employment office statistics and include persons in employment who are seeking a change of job or extra workand are therefore also registered at employment offices. This clearly underestimates the number of unemployedpeople in Sudan.
SwazilandPaid employment in non-agricultural activities is drawn from the ILO's Yearbook of Labor Statistics 1995 and refersto 1992.
TanzaniaCentral Govemment and Local Govemment employment are taken from document provided by VedastoRwechungura (Tanzania Resident Mission) and relate to 1996. Education employment is also taken frominformation received from Vedasto Rwechungura (Tanzania Resident Mission). It indicates that Primary Schoolteachers are estimated at 97,001 as of July 1, 1996 and secondary education teachers were estimated at 19,020.Universities in Tanzania are autonomous, therefore employees are not on the Govemment payroll. The totaleducation employment is therefore estimated at 116,021. Health employment has also been provided by VedastoRwechungura (Tanzania Resident Mission). As of July 1, 1996, paramedical staff (Nurses, medical attendants,technicians, etc..) on the payroll are 23,483. Rare professionals such as doctors are approximately 2,000.Accordingly, health employment totals 25,483 persons. Military personnel is expected to be reduced to 25,000 in1996/97. Data do not include enrollment in paramilitary units such as the Police Field Force (1,400), the Police AirWing and Marine Unit, and the Citizens' Militia, the reserve corps.GDP at market Prices is taken from World Tables 1995 and relates to 1993. Central Government wage bill is takenfrom Tanzania: Role of Government: Public Expenditure Review of June 17,1994 and refers to 1993.
TogoData on Central Government, Education and Health employment are taken from Harold Schwartz files and Ministryof Works and Public Functions (Ministere du travail et de la fonction publique) and relate to the situation as ofSeptember 1995. Local Government employment is an estimate from Antonella Bassani in AF4CO based on herPublic Expenditure Review mission. Health and education are solely the responsibility of Central Government.Data on State-owned Enterprises are from the IMF Staff Country Report No. 96/12 - Statistical Annex, of February1996 and relate to 1995. Data on military personnel do not include enrollment in paramilitary units. TheGendarmerie (750), under the control of the Ministry of Interior, is not included in our data.Paid employment in non-agricultural activities is drawn from the ILO's Yearbook of Labor Statistics 1995 and refersto 1992.GDP at Market Prices is from World Tables 1995 and is for 1993. Wages and Salaries are from Antoine Schwartz,Senior Economist, PSP, and are for 1994. Data on Average Public Sector Salary is from Antoine Schwartz, SeniorEconomist, PSP, and relate to 1994.
UgandaData on Central Govemment, Non Central Govemment and Education employment is taken from UgandaGovernment Payroll system, September 1996 and refer to 1996. Data provided by Dennis Hooper, Senior Adviser/Civil Service Reform in the Ministry of Public Service of Kampala. Central Govemment employment includes16,700 police personnel and 3201 people working in the Prison Services. It also includes employees of agenciesoutside the core civil service, for which total employment is estimated between 2,000 and 4,000 employees. We

- 55 -
have accordingly increased the number of central government employees by adding 3,000 employees. LocalGovemment employment is corrected for the number of local government staff who are not on computerized payrolland are paid directly by local government. Mr. Hooper estimates these to be between 2,000 and 4,000 people. Wehave added 3,000 people to the number stated in the Government payroll data. Education employment is also fromthe Uganda Payroll system, September 1996. It includes 68,326 primary school teachers, 15921 Secondary Schoolteachers and 12,419 Tertiary and University faculty. Teaching numbers include under secondary and tertiaryapproximately 6,000 non teaching staff (e.g.: cooks, cleaners, and office workers working at schools.) Healthemployment is based on an estimate from Mr. Hooper. Health sector staff was included in both central and noncentral government data. In order not to double count employment, we have subtracted 4,000 employees to boththe estimate of Central Government and Non Central Government employees. Data on military personnelincludes 400 Marines and 800 Air Wing personnel.GDP estimate is from World Tables 1995 and is for 1993. Wages and salaries as percentage of GDP is an estimatetaken from SAR of Institutional Capacity Building Project of May 9, 1995 and relates to 1994.
ZaireData on General Govemment, Education and Employment in State-owned Enterprises is taken from IMF StaffCountry Report No. SM/96/45 of February 23,1996 and relates to 1994. Data on military employment do notinclude enrollment in paramilitary units.
ZambiaUnemployment is taken from CIA Factbook and refers to 1993. Paid employment in non-agricultural activities isdrawn from the ILO's Yearbook of Labor Statistics 1995 and refers to 1989.Central Government employment, Education and health employment are from Zambia Public Expenditure Review ofApril 20, 1995 and relates to 1994. Local Government employment is from the same report but relates to 1993.Education and Health correspond to civil servants in the Education scales and Medical scales.GDP and Wages and Salaries of Consolidated Central Government estimate are from IMF Government FinanceStatistics Yearbook 1995 and relate to 1993.
ZimbabwePaid employment in non-agricultural activities is drawn from the ILO's Yearbook of Labor Statistics 1995 and refersto 1994.Data on Central, Non-central Education and Health employment is also from Ame Disch, AF1MI and relates to 1996'Local Government employees are estimated as follows: The 22 urban councils have budgets which together areclose to 10% of central Government's. The average cost would be lower than for Central government's, but you cansafely assume at least the same labor recurrent cost ratio as in central government. Accordingly, an estimate of25,000, including provincial and rural districts is probably close. Health employees are 23,000, of which 6400 civilservants and 16400 other health employees, largely funded from ministry budgets, though local authorities,particularly urban councils in the larger cities contribute a lot". Data on military employment do not includeemployment in paramilitary units, such as the Zimbabwe Republic Police Force (19,500), Police Support Unit(2,300) and the People's Militia (1,000).Wages and Salaries as percent of GDP and Average wage is from IMF Report No. SM/96/32 of February 7, 1996and relates to 1995. Central Government wage bill is a Staff estimate from Ame Disch (AFIMI), currently workingon a Public Sector Review in Zimbabwe. The data relates to the 1995/96 fiscal year. GDP is from IMF StaffCountry Report and relates to 1994. Calculations of Average Public Sector wages and Average wage aspercentage of GDP result from this data. Data on wages in manufacturing (monthly basis) are from the InternationalLabor Office's Yearbook of Labor Statistics 1995 and refer to 1994.
AS&a
AfghanistanUnemployment data are taken from the United Nation's Statistical Yearbook for Asia and the Pacific 1995 and referto 1990.Health sector employment is taken from WHO, 1993 and refers to the years 1989-1991. Employment is brokendown as follows: 2,233 doctors, 267 dentists, 1,451 nurses, and 338 midwives.
BangladeshUnemployment is taken from CIA Factbook and relates to 1993. Data on paid employment in non-agriculturalactivities are taken from the ILO's Yearbook of Labor Statistics 1995 and are for 1990.Data on Central Govemment employment, education, health and armed forces are taken from Syed Nizamuddin(SAlBG) paper entitled: A Review of the wage and non-wage composition of the recurrent Budget: Problems andissues in Government manpower and compensation policy (...) of February 27, 1996 and relate to 1992. Educationcorresponds to staff and officers of Education department, the bulk of which are primary education teachers.Health employment corresponds to staff and officers of Health and Family Welfare (91,573) and Public Health(4732) Employment in State-owned enterprises is taken from the Public Expenditure Review of July 31, 1996 andrefer to 1996. Military employment data do not include personnel in paramilitary units, e.g., the Bangladesh Rifles(the border guard - 30,000 personnel), the armed police (5,000) and the Ansars (security guards -- 20.000).

- 56 -
GDP estimate is from World Tables 1995 and relates to 1992. Wage bill estimate is from Syed Nizamuddin,(SAI CO) paper of February 27,1996 A Review of the Waoe and non Wage composition of the Recurrent Budgetand relates to 1992. Average Government wage is taken from the same report and relates to 1992.
CambodiaMilitary employment include provincial forces (estimated at 50,000 personnel).
ChinaUnemployment data are taken from the ILO's Yearbook of Labor Statistics 1995 and refer to 1994 and source IV:Official estimates. It probably underestimates the level of unemployment. Data on paid employment in non-agricultural activities are taken from the ILO's Yearbook of Labor Statistics 1995 and are for 1993.Data on Central, Non Central, Education and health employment are taken from Maurice Gervais (ASTTP) draftReport on the Public Administration (March 1996) and relates to 1994. Non Central Government employmentincludes employees of Provinces, Prefectures, Townships and Counties as well as districts and village/urbanneighborhood committees. Education and Health services are delivered through a network on Non ProfitOrganizations, which remain part of the public administration and is in part financed by the budget. Data on StateOwned enterprise includes employment in Collective Owned enterprises. Military employment data includeconscripts (estimated at 1,275,000 personnel) but do not include paramilitary forces (i.e. the People's Armed Police,under the control of the Ministry of Defense, estimated at 600,000).GDP, Govemment wage bill and Average wage rate estimate are from Maurice Gervais' draft Report on PublicAdministration of 30 March, 1996 and are for 1994. Data on wages in manufacturing (monthly basis) are takenfrom the United Nations' Statistical Yearbook for Asia and the Pacific 1995 and refer to 1992.
FijiUnemployment data are taken from the United Nation's Statistical Yearbook for Asia and the Pacific 1995 and referto 1994.Central and Non Central Government and State Owned enterprise employment comes from IMF Report NoSM/94/280 and refers to 1994 and includes both wage and salary earners.
IndiaData on paid employment in non-agricultural activities are taken from the ILO's Yearbook of Labor Statistics 1995and are for 1989. Unemployment data are taken from the ILO's Yearbook of Labor Statistics 1995, refer to 1992and source 1II, Code 2: employment office statistics and include persons in employment who are seeking a changeof job or extra work and are therefore also registered at employment offices.Data on Central Govemment employment is from IMF Report No. SM/96/260 of October 1996 and relates to Budget1996/97. Data on non-central govemment employment is a staff estimate based on data provided by CristinaAlmero-Siochi (SA2CI) after consultation of RBI Rerort on Currency and Finance. 1994. (and relating to 1990)Health employment comes from WHO, 1993 and refers to 1990. The composition is 330,630 doctors, 9,796 dentists,245,405 nurses and 132, 923 midwives. Education employment is taken from the UNESCO Statistical Yearbooki and relates to 1990. Military employment do not include people currently assigned to paramilitary units (over1,000,000 men), i.e. National Security Guards (counter-terrorism/insurgency unit - 7,500 men), Central ReservePolice Force (120,000), State Armed Police (400,000), Border Security Force (185,000), Assam Rifles (under theMinistry of Home Affairs - 52,000), Indo-Tibetan Border Police (35,000), Special Frontier Force (10,000), NationalRifles (under Ministry of Defense - 30,000), Central Industrial Security Force (under Ministry of Home Affairs -90,000), Defense Security Corps (provides security at Ministry of Defense sites - 31,000), Railway Protection Force(70,000) and Home Guards (472,000).GDP estimate is from World Table 1995 and refers to 1992. Consolidated Central Govemment wages and salariesare for 1994 and are taken from IMF Government Finance Statistics Yearbook, 1995. Data on wages inmanufacturing (monthly basis) are taken from the United Nations' Statistical Yearbook for Asia and the Pacific 1995and refer to 1989.
IndonesiaUnemployment is taken from CIA Factbook and refers to 1994. Data on paid employment in non-agriculturalactivities are taken from the ILO's Yearbook of Labor Statistics 1995 and are for 1992.Data on Central and local Government are taken from Indonesia - Civil Service Issues (Confidential draft of October21, 1993), received from David Steedman (ASTTP) and relate to 1992: Whether the military is included in thenumber of CS or not is not clear. It should be noted however that a substantial number of CS slots are filled by themilitary and it is seriously hampering satisfactory career development for civilians. For our purposes, we will deductarmed forces, but risk undercounting Civilian CS." Of the 3.4 million central govemment employees, all but about0.5 millions were seconded to the regions." Education and Health employment are from the same report and relateto 1992. Military employment do not include the paramilitary forces, i.e. the Police (174,000 people), the Kamra(people's security - part-time police auxiliary).Wages bill of Consolidated Central Govemment and GDP estimates are from IMF Government Finance StatisticsYearbook, 1995 and are for 1993. Data on wages in manufacturing (monthly basis) are taken from the StatisticalYearbook of Indonesia 1993 and refer to 1991.
Kiribati
- 57 -
Population figures are drawn from the World Bank's Social Indicators of Development 1996 and refer to 1994.Data on paid employment in non-agricultural activities are taken from the ILO's Yearbook of Labor Statistics 1995and are for 1990.General Government employment is from IMF Report No. SMI951277 and relates to 1995.
KoreaUnemployment figures come from the CIA Factbook 1995 and relate to November 1994. Data on paid employmentin non-agricultural activities are taken from the ILO's Yearbook of Labor Statistics 1995 and are for 1994.Health sector employment comes from WHO, 1993 and refers to 1989. It is broken down as follows: 35,462 doctors,29,368 dentists, and 28,103 nurses and forms part of Central Government. Central Government, Local Governmentand Education figures have been provided by the Korean Information Center of the Embassy of Korea. Data reflectsituation as of 12-31-95. Central Government employment includes 278,837 central government employees, 3,040legislative branch, 10,475 judicial branch and 2,113 others. Education employment in our data corresponds to thecategory: Public School Teacher (279,652). They are paid by the central government. Military employment datainclude conscripts, but not paramilitary forces, e.g., Civilian Defense Corps (3,500,000), or the Coast Guard (4,500).Consolidated Central Government wages and salaries and GDP estimate are for 1994, and are taken from IMFGovernment Finance Statistics Yearbook, 1995. Data on wages in manufacturing (monthly basis) are taken fromthe Economic Statistical Yearbook 1989 and refer to 1989.
Lao PDRGDP estimate is for 1993 and is from World Tables 1995. Wage bill and average wage estimate is taken from IMFReport No. SMI/9516 of January 12,1995 and relates to 1993. Manufacturing wage estimate is from IMF Report No.SMI96194 and relates to 1993.
MalaysiaPopulation and labor force figures are drawn from the World Bank's Social Indicators of Development 1996 and referto 1994. Unemployment rate is taken from IMF Report No. SM/95/236 of September 15, 1995 and relates to 1995.Data on paid employment in non-agricultural activities are taken from the ILO's Yearbook of Labor Statistics 1995and are for 1993. Unemployment figures are from CIA Factbook 1995 and are for 1993.Central and Local Government employment estimates are from the Malaysia Embassy's information section andrelate to 1994. Education employment is taken from UNESCO. Health employment is taken from the MalaysiaHealth Development DroLect of November 15, 1993 and relates to 1990. It consists of 3,016 doctors (43% of theregistered doctors-- according to the report, 56% are in the private sector), 24,364 nurses, and 12,578 assistantnurses. Health is the responsibility of the Federal Government.GDP and Consolidated Central Government wages and salaries are from IMF Government Finance StatisticsYearbook, 1995 and are for 1994.
MaldivesData on paid employment in non-agricultural activities are taken from the United Nation's Statistical Yearbook forAsia and the Pacific 1995 and refer to 1990. Unemployment data are taken from the United Nation's StatisticalYearbook for Asia and the Pacific 1995 and refer to 1990.Central Govemment, Education and Health employment is taken from IMF Report No. SM 96/154 of June 26, 1994and relates to 1995. Note that expatriate workers (2,023 people in 1995) were subtracted from central governmentemployees.
Marshall IslandsLabor force and population are taken from IMF Report 95/122 of May 26, 1995 and refers to 1994.
MicronesiaData on paid employment in non-agricultural activities are taken from the United Nation's Statistical Yearbook forAsia and the Pacific 1995 and refer to 1990. Unemployment data are taken from the United Nation's StatisticalYearbook for Asia and the Pacific 1995 and refer to 1990.GDP, wages and salaries, and per capita GDP estimate (in US $ ) relate to 1994 and are taken from IMF Report No.SM/96/206 of August 6, 1996.
MongoliaData on paid employment in non-agricultural activities are taken from the United Nation's Statistical Yearbook forAsia and the Pacific 1995 and refer to 1993. Unemployment data are taken from the United Nation's StatisticalYearbook for Asia and the Pacific 1995 and refer to 1993.Military employment data include conscripts (estimated at 12,350).
MyanmarData on paid employment in non agricultural activities is taken from the ILO's Yearbook of Labor Statistics 1995 andis for 1994. Unemployment data are taken from the ILO's Yearbook of Labor Statistics 1995, refer to 1994 andsource IlIl, Code 1: Employment office statistics and do not include persons who are already in employment.Central Government employment is taken from IMF Report No. SW951270 of October 16, 1995 and relates to199/95. Data includes representative bodies and excludes casual labor. Local Government employment, exclude

- 58 -
larger municipalities such as Yangon and Mandelay which were granted budgetary autonomy. Estimate ofemployment in these cities is approximately 17,000 people. Military employment data do not include peopleassigned in paramilitary units, e.g., the People's Police Force (50,000 people), the People's Militia (35,000), and thePeople's Pearl and Fishery Ministry.Wages and Salaries of Union Government (Central Government) are from IMF Report No. SMI95/270 of October16, 1995 and refer to 1993.
NepalMilitary employment data do not include paramilitary personnel, e.g., the police force (28,000 people).
PakistanUnemployment rate is from CIA Factbook 1995 and relates to 1990/91. Data on paid employment in non-agricultural activities are taken from the ILO's Yearbook of Labor Statistics 1995 and are for 1994.Central, Non-Central, Education and Health employment estimates are taken from Public Expenditure Review ofOctober 30, 1992 and relate to 1990. Military employment data do not include paramilitary units, e.g., the NationalGuard (185,000 people), the Frontier Corps and the Pakistan Rangers, under the control of the Ministry of theInterior (35,000 people for each of these two corps), the Maritime Security Agency and the Coast Guard.Data on wages and salaries for Central Government (in this case, the federal Government) are taken from the PublicExpenditure Review of October 30,1992 and relate to 1990. GDP at market price estimate is from the Governmentof Pakistan's Economic Survey, 1995-1996 and relates to 1990.
PhilippinesPopulation and Labor Force drawn from Public Expenditure Management for Sustained and Equitable Growth (pg.56) and refer to 1995. Unemployment figure, for 1994, is from CIA Factbook 1995. Data on paid employment innon-agricultural activities are taken from the ILO's Yearbook of Labor Statistics 1995 and is for 1990.Local Govemment figures are from Civil Service Reform in the Philippines (David Stiedman), p. 44, and data are forDecember 31, 1994. It includes permanent and non-permanent staff. Health figure includes both those personnelstill working for the National Govemment in Health and also those devolved to local governments. Militaryemployment data do not include personnel enrolled in paramilitary units, e.g., Philippine National Police (40,500),whose responsibility is divided between Local Government and the Ministry of Interior, the Coast Guard (2,000) andthe Citizen Armed Force Geographical units (CAFGU), a part-time militia which can be called up for extendedperiods (60,000).GDP and Consolidated Central Government wages and salaries are for 1993 and are taken from IMF GovernmentFinance Statistics Yearbook, 1995. Data on wages in manufacturing is taken from the united Nations' StatisticalYearbook for Asia and the Pacific 1995 and refer to 1990.
SingaporeData on paid employment in non-agricultural activities are taken from the ILO's Yearbook of Labor Statistics 1995and are for 1994.Numbers relating to Central, Local, Education and Health employment are drawn from Singapore Statistical Officeweb page, off the Intemet, and relate to 1994. Military employment data include conscripts (33,800).GDP and Consolidated Central Government wages and salaries are for 1992 and are taken from IMF GovernmentFinance Statistics Yearbook, 1995.
Solomon IslandsGDP is from the UN Statistical Yearbook for Asia and the Pacific. 1995 and is for 1991._Wages and Salaries ofConsolidated Central Government are from IMF Government Finance Statistics Yearbook 1995 and are for 1991.
Sri LankaData on unemployment rate and number of unemployed people are drawn from Unemplovment in Sri Lanka:sources and solutions. IDP 154 of 07/01/95 and relate to 1993. Population refers to all 9 provinces, while laborforce, employment and unemployment do not include the Northem and Eastern provinces. Data on paidemployment in non-agricultural activities are taken from the ILO's Yearbook of Labor Statistics 1995 and are for1994.Central govemment, Non central govemment, Education and Health employment are taken from the PublicExpenditure Review of December 22, 1993 and relate to 1992. Several Central govemment agencies under theMinistry of Education and Cultural Affairs are responsible for formulating general education policy and some aspectof administration. Since 1987, however, most of the administration of the education system has been delegated tothe Provincial Directorates of Education which set and implement provincial policies within national guidelines. Alarge proportion of provincial expenditures is for the salaries of teaching and non- teaching staff. Accordinglyeducation employment is subtracted to non-central govemment category. Provincial administrations are financedthrough a Block Grant that the Central Govemment gives to Provincial Govemments.Higher education is financed through a Central Govemment annual Block grant to cover about 95% of recurrent andcapital allocations. Since 1990, health services have also been decentralized. They are also being financed throughblock grants of the central government; they are, however, under the institutional authority of the provincialgovernments. Military employment data are include recalled reservists, but do not include paramilitary units, such

- 59-
as the Police Force, under the control of the Ministry of Defense (80,000), the National Guard (15,000), and theHome Guard (15,200).GDP and Consolidated Central Government wages and salaries are for 1994 and are taken from IMF GovernmentFinance Statistics Yearbook, 1995. Data on wages in manufacturing (monthly basis) is taken from the UnitedNations' Statistical Yearbook for Asia and the Pacific 1995 and refer to 1993.
ThailandUnemployment information is for 1995 and is taken from IMF Report No. SM 96/155 of June 28, 1996 and relates to1995 (projected). Data on paid employment in non-agricultural activities are taken from the ILO's Yearbook of LaborStatistics 1995 and are for 1994.Central and local government data are staff estimates based on information provided by Embassy of Thailand,several Public Expenditure Reviews and the Country Economist of Thailand, Sudhir Shetty. They are for the year1992. Data on education and health are taken from UNESCO Yearbook 1995 and WHO Yearbook, 1993 and relateto the year 1993. Military employment data do not include paramilitary forces, e.g., Thahan Phran (18,500), theNational Security Volunteer Corps (50,000) the Marine Police and Police Aviation (2,500 and 500 respectively), theBorder patrol police (40,000) and the Provincial police (50,000).GDP estimate is from IMF Report No. 96/83 of August 1996 and relates to fiscal year 1995/96. Wages and salariesare taken from IMF Report No. 96/83 of August 1996 and relate to 1995/96 (projections). Average wages inManufacturing are taken from IMF Report No. 96/83 of August 1996 and relate to 1995.
VanuatuData on paid employment in non-agricultural activities are taken from the United Nation's Statistical Yearbook forAsia and the Pacific 1995 and refer to 1989. Unemployment data are taken from the United Nation's StatisticalYearbook for Asia and the Pacific 1995 and refer to 1989.Population estimate is taken from Social Indicators of Development and relates to 1994. Labor force estimate istaken from IMF Staff Country Report No. 06/75 of August 1996.
VietnamData on paid employment in non-agricultural activities are taken from the United Nation's Statistical Yearbook forAsia and the Pacific 1995 and refer to 1993.Data on Employed Labor Force, Education and Public Health employment are taken from Vietnam: EconomicReport on Industrialization and Industrial Policy of October 17, 1995.Consolidated Central Government wages and salaries are for 1994 and are taken from IMF Research Assistant forVietnam.
Eastern Europe and Former USSR
AlbaniaData on paid employment in non-agricultural activities are taken from the ILO's Yearbook of Labor Statistics 1995and are for 1991.Central Government, Non Central Government, Education and Health employment is taken from Country EconomicMemorandum (draft) of September 3, 1996 and relates to June 1996. (See Annex 5). Military employment datainclude 22,800 conscripts, but do not include personnel in paramilitary units, e.g., the Militia (estimated at more than20,000), under the authority of the Ministry of Interior.Data on GDP at market prices, as well as Consolidated Central Government wages and salaries, are for 1995 andare taken from IMF memo: Albania: notes on fiscal situation, dated April 3, 1996.
BulgariaData on paid employment in non-agricultural activities are taken from the ILO's Yearbook of Labor Statistics 1995and are for 1994.Central Government employment is estimated, on the basis of the information on IMF Report No. SM/95/306 ofDecember 11, 1994 and relate to 1993 and the information on the other sectors of government, as the residualgovernment employment. Education and Health employment are from IMF Report No. SM 93/200 and relate to1992. Local employment comes from Local Governments in the CEE and CIS: an antholooy of descriptive papers.1994, published by the Institute of Local Government and Public Services in Budapest, Hungary. Local dataincludes 15,967 civil servants employed by municipality mayors' offices and 9,446 civil servants employed bysettlements' mayors' offices and relates to 1993. State-owned enterprise employment is taken from IMF Report No.95/306 of December 11,1995 and relates to 1994. Military employment data include 51,300 conscripts, about22,300 centrally controlled. The data do not include personnel of paramilitary units, i.e., the Border guards (12,000),the Security Police (4,000) and the Railway and Construction troops (18,000).GDP is taken from World Tables 1995 and is an estimate for 1993. Data on Consolidated Central Governmentemployment and salaries is taken from Government Finance Statistics, 1995 and is for 1993. Average Governmentwage estimate is taken from IMF Report 95/306 of December 11,1995 and relates to 1993.Data on wages in manufacturing (monthly basis) are taken from the International Labor Office's Yearbook of LaborStatistics 1995 and refer to 1994.

- 60 -
CroatiaUnemployment data are taken from the ILO's Yearbook of Labor Statistics 1995, refer to 1994 and source l1l, Code1: Employment offce statistics. Data on paid employment in non-agricultural activities are taken from the ILO'sYearbook of Labor Statistics 1995 and refer to 1993.Central government employment includes providers of Social Services and culture, arts and information. It is takenfrom IMF Report SM/95/199 of August 15, 1995 and relates to 1995. Local Government employment is taken fromIMF Report No. SM/95/199 of August 15,1995 and relates to 1995. Health and Education employment are takenfrom IMF Report SM/951199 of August 15, 1995 and relate to 1995. State-owned enterprise employment is takenfrom IMF Report SM/941251 Background Notes and Statistical Appendix of September 29, 1994. Militaryemployment data include 65,000 conscripts, but do not include personnel in paramilitary organizations, e.g., thePolice (40,000).GDP data are for 1995 and come from Marcelo Bisogno, Research Assistant for the Croatia country office.Average Government wage estimate and average manufacturing wages are taken from IMF Report No. SM/95/199of August 15, 1995 and relate to 1994.
Czech RepublicUnemployment rate was taken from the Economist Intelligence Unit 1995-96 (p. 11), and reflects unemployment asof February 1995. Employment data are from the draft paper for the year 1993. Data on paid employment in non-agricultural activities are taken from the ILO's Yearbook of Labor Statistics 1995 and are for 1994.Data on military employment include conscripts (40,400), but exclude personnel of paramilitary units, i.e., the BorderGuards (4,000) and the Internal Security Forces.
Federal Republic of Yugoslavia (Serbia and Montenegro)Data on military employment include conscripts (60,000).
HungaryUnemployment rate was taken from Economist Intelligence Unit 1995-96 and reflects unemployment as ofNovember 1994. Data on paid employment in non-agricultural activities are taken from the ILO's Yearbook of LaborStatistics 1995 and are for 1994.Central and local government, Education and Health are taken from Barbara Nunberg's Administrative Reform inHungary: The Advanced Transition expenence September 1995 (draft), for the year 1993. Data on militaryemployment include conscripts (47,500), but exclude personnel in paramilitary organizations, i.e., the Border Guards(730), and Internal security forces (police- 1,800).Data on wages in manufacturing (monthly basis) are taken from the International Labor Office's Yearbook of LaborStatistics 1995 and refer to 1993. Wages and Salaries as percent of GDP and Average Government wages aretaken from Barbara Nunberg's report of September 1995 (draft) Administrative Reform in Hungary: The AdvancedTransition experience, prepared in conjunction with EMTPM's Seminar on State Transformation in the Transition(Salzburg, November 1995).Data on paid employment in non-agricultural activities are taken from the International Labor Office's Yearbook ofLabor Statistics 1995 and refer to 1992.
MacedoniaLabor force figures are drawn from Economist Intelligence Unit 1995-96 (p. 11). Unemployment rate is taken fromCountry Economic Memorandum dated 21 June 95. Note that employed labor force includes self-employed. Dataon paid employment in non-agricultural activities are taken from the ILO's Yearbook of Labor Statistics 1995 and arefor 1994.Central Govemment, Education and Health employment are taken from Country Economic Memorandum of July 20,1995 and relates to 1994. The Republican Budget covers the expenditures of central government as well aseducation and research institutions. The Health care fund covers the financing for the services rendered byautonomously administered health management organizations. Local employment data are from OECD's LocalGovernment in the CEE, and are for 1991. Data on military employment include conscripts (8,000), but excludepersonnel in paramilitary organizations, i.e. the Police (7,500).GDP and wages and salaries data are from Huyen Le, Research Assistant for Southeastern Division II in the IMFand relate to 1994.
PolandUnemployment rate is drawn from Economist Intelligence Unit 1995-96 (p. 16) and refers to the unemployment levelas of March 1995. Data on paid employment in non-agricultural activities are taken from the ILO's Yearbook ofLabor Statistics 1995 and are for 1992.Central Government and Health employment figures are drawn from the Public Administration Reform in Transitionaleconomies: Issues in Public Administration Reform in Poland and refer to 1993. Education employment is alsotaken from the same source, but refers to 1992. Local Government is from Poland Country Office, afterconsultation with the Polish statistical office and refers to 1994. It includes persons employed by self-govemmentsand those employed by 'middle tier governments". Data on military employment include conscripts (158,100), but

- 61 -
exclude personnel in paramilitary units, i.e. Border Guards (16,000), under the authority of the Ministry of theInterior, the Maritime Border Guard and the Prevention Units of the Police.Wages and salaries of Consolidated Central Government are from IMF Government Finance Statistics Yearbook1995 and are for 1994. Wages and Salaries as percent of GDP and Average government wages are taken fromBarbara Nunberg's report of September 1995 (draft) Administrative Reform in Hungary: The Advanced Transitionexperience, prepared in conjunction with EMTPM's Seminar on State Transformation in the Transition (Salzburg,November 1995).
RomaniaNumber of unemployed is drawn from Economist Intelligence Unit 1995-96 (p. 19) and reflects the situation in April1993. Data on paid employment in non-agricultural activities are taken from the ILO's Yearbook of Labor Statistics1995 and are for 1993.Central Government employment figures are drawn from State Transformation in the Transition - Barbara Nunberg(p. 22). Education data are from EC1/2HR draft paper on health and education in the ECA and are for the year1994. Data on military employment includes conscripts (104,700), but excludes personnel in paramilitary units, i.e.,Border Guards ( 22,300), the Gendarmerie (10,000) and the Security Guards (46,800), all under the authority of theMinistry of Interior.GDP and wages and salaries are taken from IMF Government Finance Statistics Yearbook 1995 and are for 1993.Data on wages in manufacturing are taken from the International Labor Office's Yearbook of Labor Statistics 1995and refer to 1993.
SlovakiaNumber of unemployed is drawn from Economist Intelligence Unit 1995-96 (p. 41) and reflects the situation inDecember 1994. Data on paid employment in non-agricultural activities are taken from the ILO's Yearbook of LaborStatistics 1995 and are for 1994.Central Government, education and health employment are taken from IMF Report No. SM 95/206 of August 18,1995 and relate to 1994. Number of local Government employees is taken from Local Government in the CEE andrelates to 1 January, 1994. Of the 43,931 local civil servants, 18,640 are working in the mayors' offices. Data onmilitary employment exclude personnel in paramilitary units, i.e., Border Guards (600), and Internal Security Forces(250).GDP estimate is taken from World Tables 1995 and is for 1992. Data on Average wages, and on wages inmanufacturing are taken from IMF Report No. SM/951206 and are for 1992. Data on paid employment in non-agricultural activities is taken from the International Labor Office's Yearbook of Labor Statistics 1995 and refers to1994.
SloveniaLabor force and unemployment rate are drawn from Economist Intelligence Unit 1995-96 (p. 42) and reflect thesituation in December 1994. Note that employed labor force includes self-employed. Data on paid employment innon-agricultural activities are taken from the ILO's Yearbook of Labor Statistics 1995 and are for 1994. Number ofunemployed are drawn from Economist Intelligence Unit 1995-96 (pp. 28-32) and 1992.Data on Central Government, Education and Health employment is taken from IMF Report No. SM/94/189 andrelates to 1994. Central Government employment corresponds in reality to 'Government Sector' and probablyincludes local government employment. Data on military employment include conscripts (5,500), but do not includepersonnel in paramilitary units, i.e. the Police (4,500).
TurkeyData on Central, Local, Education and Health employment are taken from OECD PUMA: Public Management,OECD Country Profiles, 1992 and relate to 1991. Data on military employment include conscripts (415,200), butexclude personnel in paramilitary units, i.e., Gendarmerie/National Guard (180,000), under the authority of theMinistry of Interior in peace time and the Ministry of Defense in war, and the Coast Guard (2,200).GDP is taken from World Tables 1995 and relates to 1993. Data on wages in manufacturing (monthly basis) arefrom the International Labor Office's Yearbook of Labor Statistics 1995 and refer to 1993. Data on paid employmentin non-agricultural activities is from the International Labor Office's Yearbook of Labor Statistics 1995 and refers to1993.
Former Soviet Union
ArmeniaData on paid employment in non-agricultural activities are taken from the Statistical Handbook 1995: States of theFormer USSR and are for 1994.Central Government, Non central government, education and health employment are taken from Armenia: PublicAdministration draft discussion paper of 24 September 1995 and relates to 1995. Central Government employmentincludes 90,800 employees of the in law enforcement. Local Government employment data includes 49,281 for theYerevan City council, and 90,111 Local Councils at employees. Armenian authorities have several discrepant

- 62 -
sources of employment data. Data should therefore be taken with a certain amount of caution. Military employmentis taken form the International Institute for Strategic Studies, The Military Balance. 1995/96 and relates to 1996.GDP estimate and Wages and salaries as percent of GDP figures are taken from the IMF Report SM/951243 ofSeptember 20, 1994 and relate to 1993. They are confirmed by Stephen Lister's (EC4C2) draft discussion paper onPublic Administration dated 24 September 95. Average wage estimate is also from IMF Report (monthly for 1993).Lister's draft paper indicates that monthly wage must be multiplied by 15 to obtain yearly wage.
AzerbaijanData on paid employment in non-agricultural activities are taken from Statistical Handbook 1995: States of theFormer USSR and are for 1994.Government employment, education and Health employment is taken from Statistical Handbook. 1995 States of theFormer USSR and relate to 1994. Health employment is also from the same source and corresponds to category" Health care, social security, physical culture and sports" and relates to 1994. Education employment is also fromthe same source and relates to 1994.GDP and wages and salaries estimates are from WB's Statistical Handbook 1995: States of the Former USSR, andrelate to 1993. Average wage is taken from IMF Report No. SM/94/128 of May 26, 1994 and relates to 1993.
BelarusUnemployment data are drawn from The Belarussan Labor Market drafted on June 11, 1993 (p. 14). Data on paidemployment in non-agricultural activities are taken from the ILO's Yearbook of Labor Statistics 1995 and are for1994.Central and Local Govemment employment are staff estimates based on information present in the OECD's LocalGovernments in the CEE and CIS: an anthology of descriptive Dapers as well as that present in the IMF Report No.SMW95/194 of August 11, 1995, and relates to 1992. Data on employment in state-owned enterprises are takenfrom the Statistical Handbook 1995: States of the Former USSR and refer to 1994. Data on military exclude 1,200Ministry of Defense staff as well as personnel of paramilitary units, i.e., Border Guards (8,000).GDP and wages and salaries estimates are from WB's Statistical Handbook 1995: States of the Former USSR, andrelate to 1992. Average Government wage is also for the same year, from the same source. Data on wages inmanufacturing (monthly basis) are from the International Labor Office's Yearbook of Labor Statistics 1995 and referto 1992.
EstoniaPopulation, labor force and total employment estimates are from Vera Wilhelm (EC4BS) after consultation with thestatistical office and relate to 1995. Unemployment rate is estimated on the basis of the above data and relates to1995. Data on paid employment in non-agricultural activities are taken from the ILO's Yearbook of Labor Statistics1995 and are for 1994.Central Government, Non Central Government, Education and Health employment is data is from Vera Wilhelm(EC4BS) and relates to 1995. Non Central Government includes municipalities, lower municipalities. Data onemployment in state-owned enterprises are taken from the Statistical Handbook 1995: States of the former USSRand refer to 1991.
Data on military employment includes conscripts (2,650), but excludes personnel in paramilitary units, e.g., BorderGuards, who are under the authority of the Ministry of Interior.GDP and wages and salaries estimates are from WB's Statistical Handbook 1995: States of the Former USSR, andrelate to 1993. Average Government wages are taken from IMF Report SM/94/81 of March 29, 1994 and relate to1993. Data on wages in manufacturing (monthly basis) are taken from the International Labor Office's Yearbook ofLabor Statistics 1995 and refer to 1993.
GeorgiaUnemployment rate reflects only official unemployment for 1994. Data on paid employment in non-agriculturalactivities are taken from Statistical Handbook 1995: States of the Former USSR and are for 1993.Central Government, Non central, Education and Health employment are taken from Georoia: Issues in GovernmentPay and Employment Reform, based on the findings of a World Bank mission in June 1995 and relates to thesituation as of April 01, 1995.GDP per capita estimate and Average Government wage is taken from IMF study No. EBS/95/151 of September 25,1995 and refers to 1994. Estimate of wages and salaries as percent of GDP is from the same IMF study and relatesto 1994.
KazakstanUnemployment rate reflects only official unemployment for 1994. Data on paid employment in non-agriculturalactivities are taken from the ILO's Yearbook of Labor Statistics 1995 and are for 1992.Central Government, Non Central Government, Education, Health and Armed Forces employment figures are takenfrom Draft Report 1 5353-KZ Transition of the State. Data refer to 1994. On the matter of Military employment, totalarmed forces IIIS estimates at 40,000, not including paramilitary units, i.e., the Republican Guard (2,500 people),the Internal Security Troops (20,000), under the control of the Ministry of Interior, and the Border Guards (12,000),under the control of the National Security Committee. The World Bank has a different estimate based on the resultsof the mission. The authors have preferred to include data from the World Bank mission. However, for the sake of
- 63 -
consistency, we are also mentioning the IISS estimate. The data on the military, should therefore be taken withsome caution.Wages and salaries estimates are from WB's Statistical Handbook 1995: States of the Former USSR, and relate to1992. GDP data are from Barbara Ossowicka (EC3C1) and relate to 1994. Average Government wage is basedon Kazakstan Economic Trends, 2nd quarter 1996, published by the Government of Kazakstan's Center forEconomic Reforms and relates to 1994. Estimate is an unweighted average of salary for March June andSeptember data provided by the IMF. Government wage bill for 1994 is estimated at 2.8% of GDP. Source: WBReport Kazakstan: Transition of the State-(draft) February 16, 1995.
KyrgyztanUnemployment rate reflects only official unemployment for 1994. Data on paid employment in non-agriculturalactivities are taken from Statistical Handbook 1995: States of the Former USSR and are for 1994.Data on Kyrgyz Republic are staff estimates based on information for Education and Health employment are takenfrom IMF Report SM195/55 and relate to 1995. Central Government employment is a staff estimate based on datafound in the same source.GDP at market prices, wages and salaries are taken from Statistical Handbook 1995: States of the former USSRand relate to 1993. Average Govemment wages are from IMF Report No. SM/95/55 of March 17, 1995 and relateto 1993.
LatviaPopulation and labor force figures are from Vera Wilhelm (EC4BS) after consultation with the Latvia Statisticalcommittee and relate to 1995. Total employment figure is also from Vera Wilhelm and refers to 1995.Unemployment figure is estimated on the basis of the above data. Data on paid employment in non-agriculturalactivities are taken from the ILO's Yearbook of Labor Statistics 1995 and are for 1993.Data on Central Government employment, Education and Health employment is from Vera Wilhelm afterconsultation with Statistical Office and relates to 1995. Central Govemment employment probably also includeslocal govemment employment. Data on military employment are taken from the International Institute for StrategicStudies: The Military Balance Survey of 1995-96, and include conscripts, but exclude personnel in paramilitary units,i.e., the Border Guard (4,300) and the Coast Guard.GDP at market prices and wages and salaries are from Statistical Handbook 1995: States of the former USSR andrelate to 1993. Average Government wages is a staff estimate based on figures from IMF Report No. SMI94/158.The IMF Report indicates average quarterly wage. The authors have taken the average of the four estimates for1993 and multiplied it by 12 (months) to obtain average yearly wage. Data on wages in manufacturing are from theInternational Labor Office's Yearbook of Labor Statistics 1995 and refer to 1993.
LithuaniaUnemployment rate is taken from reflects only official unemployment for 1994. Data on paid employment in non-agricultural activities are taken from the ILO's Yearbook of Labor Statistics 1995 and are for 1994.Central Government, Education and Health employment data are taken from the Department of Statistics of theGovernment of Lithuania (Vera Wilhelm EC4BS and Gediminas Dubauskas provided us with the data) and relates to1995. Non Central Government employment is taken from the same source and relates to 1995 as well. Estimateincludes personnel in municipalities, lower municipalities and police structure. Data on military employment includeconscripts, but exclude personnel in paramilitary units, e.g., the Border Guard (4,000).GDP at market prices is taken from Statistical Handbook 1995: States of the former USSR and relates to 1992.Wages and salaries are taken from IMF Government Finance Statistics and relate to 1992. Average Governmentwages are from Statistical Handbook 1995: States of the former USSR and relate to 1992. Data on wages inmanufacturing (monthly basis) are from the International Labor Office's Yearbook of Labor Statistics 1995 and referto 1992.
MoldovaUnemployment rate is taken reflects only official unemployment for 1994. Data on paid employment in non-agricultural activities are taken from the ILO's Yearbook of Labor Statistics 1995 and is for 1994.Central Government and Local Government employment are taken from the Salvatore Schiavo-Campo's BTOR ofMay 7, 1996 from the Public Sector Management Mission and refers to 1996. Education and health data is a staffestimate for 1996 based on data available in the Statistical Handbook 1996: States of the Former USSR andinformation available on Mr. Schiavo-Campo's May 6, 1996 BTOR. Data on military employment include conscripts(11,000), but exclude personnel in paramilitary units, i.e. the Internal Troops (2,500) and the Riot Police (900), bothunder the authority of the Ministry of Interior.GDP per capita estimate is from Moldova Country economist Arud Bannerjee. GDP estimate is calculated on thebasis of the data mentioned above. Average Central Government wage is taken from BTO Report of May 7, 1996for Public Sector Management Mission and relate to 1996.
Russian FederationData on paid employment in non-agricultural activities are taken from the ILO's Yearbook of Labor Statistics 1995and are for 1992.Central Government, Non Central Government, Education and Health employment data are drawn from Towards aNew Civil Service in Russia: Current Issues and Future Prospects (draft) of September 1995, and relate to 1992.

- 64 -
Data on military employment include conscripts (400,000), but excludes personnel in paramilitary units, i.e., theFrontier Forces (100,000), directly subordinate to the President, the Forces for the Protection of the RussianFederation (20,000), and the MVD (180,000).GDP estimate is taken from Statistical Handbook 1995: States of the Former USSR and relates to 1992. Wagesand salaries as percent of per capita GDP is from Barbara Nunberg's Towards a new Civil Service in Russia,Current Issues and Future Prospects, September 1995 and relates to 1992. The wage bill corresponds to thecivilian budgetary sphere wage bill (5.2%) less wages in Health and education (3.5%).
TajikistanUnemployment come from the Country Economic Memorandum of August 12, 1994. Data on paid employment innon-agricultural activities are taken from Statistical Handbook 1995: States of the Former USSR and are for 1993.Data on Central, Education and Health employment is taken from Country Economic Memorandum of August 12,1994 and relates to 1992. Central Government corresponds to General Administration and defense, to which wehave subtracted the number of military. Tajikistan has not yet formed any military units. A number of potentialofficers are being trained.
TurkmenistanUnemployment rate reflects only official unemployment for 1994. Data on paid employment in non-agriculturalactivities are taken from Statistical Handbook 1995: States of the Former USSR and are for 1993.Central Government employment, which is drawn from Statistical Handbook 1995: States of the Former SovietUnion. Central Govemment corresponds to 'Public Administration and defense". However, it is unclear whether thisincludes all Central Government employees or just Centrally located Central Government employees. Educationand Health employment data are drawn from the Country Economic Memorandum of 7 February, 1994, Educationcorresponds to "Education Culture and arts" for 1992, while Health is "Health care, social security, physical cultureand sports." Military employment data relate to armed forces under joint Turkmen/Russian command.
UkraineUnemployment rate is drawn from Economist Intelligoence Unit 1995-96. Unemployment reflects only officialunemployment for 1995, and probably underestimates the level of unemployment. .Central Govemment, Local Government, Education and Health employment data are from Ukraine: PublicExpenditure Review- Public Administration and the Civil Service of May 1996 and relate to 1994. Localemployment corresponds to 'Regional and local administration funded from local budgets' and is for the year 1994.Education and Health employment is also from the same source and relates to 1994. In Ukraine delivery of theseservices is done by both State Owned enterprises as well as the govemment administration. Military employmentdata do not, include paramilitary troops, e.g., the Internal Security Troops (15,300) and the National Guard (700).Wages and salaries as percentage of GDP (and therefore GDP estimate), Average wage and average wage asmultiple of per capita GDP is taken from EMTPM's David Wood's report of 6/24/96 on Ukraine: Policy notes - PublicAdministration and the Civil Service and relates to 1994.
UzbekistanUnemployment is from IMF Report SM/96/134 of June 12, 1996 and relates to 1995. It lists 187,700 unemployedpeople, of which 156,700 not officially registered in the unemployment registers of the employment offices. Inaddition, an estimated 50-60 000 are on forced (unpaid leave) and another million people is considered "disguisedunemployment in the agricultural sector. Data on paid employment in non-agricultural activities are taken fromStatistical Handbook 1995: States of the Former USSR and are for 1994.Central Government, Education and Health employment are taken from IMF Report No. 96/134 of June 12, 1996and relates to 1995. State-owned enterprise employment is an estimated based on data from the UzbekistanEconomic Memorandum of June 20, 1994 and relates to 1992. Military employment data include Ministry ofDefense staff and centrally controlled units, but exclude papamilitary units, such as the Internal Security troops(16,000 men under the control of the Ministry of Interior) and the National Guard (700 men under the control of theMinistry of Defense).GDP estimate is from Statistical Handbook 1995: States of the Former USSR and is for 1994.
Latin America and Caribbean
Antigua & BarbudaPopulation and labor force are taken from IMF Report No. SM 96/163 of July 5, 1996 and relates to 1995.Central Government, Non Central Government employment is taken from IMF Report No. 96/163 of July 5, 1996and relates to 1994.Data on GDP at market price as well as Central Government wage bill are from IMF Report SM 96/163 of July 5,1996 and relate to 1995. Average Government wages and wages and salaries as multiple of per capita GDP aretherefore the result of calculations emanating from this data.
- 65 -
ArgentinaUnemployment rate is drawn from CIA Factbook 1995 and refers to 1994. Paid employment is non agriculturalactivities is taken from Anuario Estadistico de la Republica Argentina, 1995 and relates to 1995. Javier Burgueno ofConsultorio Burgueflo Pepe & Asociados was also a source of information relating to Argentina.Central Government Employment data are drawn from Public Sector Reform (Loan 3394-AR) Completion Report ofJune 29, 1995 and refer to 1993. They include decentralized agencies of the Central Government (76,000 in 1994).Primary, secondary and technical education are handled at the local level. Public Universities are at the centralgovernment level. University Teachers number 100,000 and include both full-time and part-time. In June,universities were given autonomous status within the public sector, and accordingly they became responsible forsalaries of professors. It is not clear whether the number of teachers can include them or not.Local Government employment is taken from IMF Report No. SM/95/248 of September 20, 1995 and relates to1994. It includes employees of the Provinces and the City of Buenos Aires (1,013), and employees of theMunicipalities (348). Health sector employees are taken from WHO, 1993. State-owned enterprise employment isalso taken from IMF Report SM/95/248 (see above) and relates to Central Government enterprise employees for1994. Military employment data include conscripts (18500), but do not include personnel in paramilitary units, e.g.,the Gendarmerie (18,000) under the authority of the Ministry of Defense and la Prefectura Naval (13,240).Data on GDP at market price is a 1993 estimate and is taken from World Tables 1995. Data on wages and salariesof Central Govemment as percent of GDP is taken from IMF Report SM/94/177 of July 8, 1994 and relates to 1993.GDP per capita, average Government wages, and wages and salaries as multiple of per capita GDP is based uponcalculations emanating from this data. Data on wages in manufacturing are from the International Labor Office'sYearbook of Labor Statistics 1995 and refer to 1993.
BahamasData on paid employment in non-agricultural activities are taken from the ILO's Yearbook of Labor Statistics 1995and are for 1994. Unemployment data are taken from the ILO's Yearbook of Labor Statistics 1995 and refer to 1994and source l: Labor force sample surveys and General household sample surveys.Central Government, Non Central Government, Education and Health employment are taken from IMF Report No.96/244 and relates to 1995. Police Force is estimated at 1200.GDP at market prices and wages bill estimates are taken fro m IMF Report No. SM/96/244 of September 27, 1996and relates to 1994. GDP per capita, Government average wages and wages and salaries as multiple of per capitaGDP are based on calculations emanating from this data.
BarbadosData on paid employment in non-agricultural activities are taken from the ILO's Yearbook of Labor Statistics 1995and are for 1994. Unemployment data are taken from the ILO's Yearbook of Labor Statistics 1995 and refer to1994 and source l: Labor force sample surveys and General household sample surveys.Data on Central Govemment Employment, Education and Health employment are taken from Republic of BarbadosMinistry of Finance and Public Service Commission data and relate to 1995. Local Government in Barbados is non-existent. Employment in State-owned enterprises is taken from WB Report No. 15185 CRG Public SectorModernization in the Caribbean.GDP per capita, Government average wages and wages and salaries as multiple of per capita GDP are based oncalculations emanating from this data.
BelizeData on paid employment in non-agricultural activities are taken from the ILO's Yearbook of Labor Statistics 1995and are for 1994. Unemployment data are taken from the ILO's Yearbook of Labor Statistics 1995 and refer to1994 and source I: Labor force sample surveys and General household sample surveys.General Government employment is taken from information provided by Public Sector Modernization in theCaribbean.
BermudaData on paid employment in non-agricultural activities are taken from the ILO's Yearbook of Labor Statistics 1995and are for 1994. Unemployment data are taken from the ILO's Yearbook of Labor Statistics 1995, refer to 1991and source l1l, Code 1: Employment office statistics and do not include persons who are already in employment.
BoliviaData on paid employment in non-agricultural activities are taken from the ILO's Yearbook of Labor Statistics 1995and are for 1994.Data relating to Central Government employment are drawn from AR on Civil Service Reform project and relate to1993. Central Government employment figure is broken down into 117,596 permanent employees, 16,642temporaries and 1,180 consultants (line positions financed under International Cooperation projects). CentralGovernment entails Central Ministerial departments and local administration extensions. Central Governmentemployment does not include teachers (numbering about 80,000) but includes health workers and decentralizedinstitutions which fall under the jurisdiction of sectoral ministries. We have not been able to estimate the number ofthese employees. Health employment is taken from Luis Pisani, Head of the Social sector unit in the WB's La PazResident mission and relates to 1994/95. The data includes medical employees in both the Secreteria Nacional deSalud and the Caja nacional de salud (which is the social security scheme which covers public sector employees).

- 66 -
The former accounts for 10,223 employees, of which 369 at the central level and the rest at the local level. Thelatter accounts for 11,371 medical employees, all of which are local and of which 1,077 are contractual employees.Military employment data include conscripts (20,000), but do not, however, include personnel in paramilitary units,e.g., National Police (30,000 est.) and the Narcotics police (600).Data on GDP at market prices is a 1993 estimate and is taken from World Tables 1995. Consolidated CentralGovernment wages and salaries are for 1993 and are taken from IMF Government Finance Statistics Yearbook,1995. Data on wages in manufacturing are from IMF Report No. SM/96/61 and relates to March 12,1996.
BrazilData on paid employment in non-agricultural activities are taken from the ILO's Yearbook of Labor Statistics 1995and are for 1994.Military employment data include conscripts (132,000), but do not include personnel in paramilitary units, e.g., PublicSecurity Forces (385,600), which are the state Military Police organizations (State Militias), under Army control andconsidered Army Reserve.
ChileData on paid employment in non-agricultural activities are taken from the ILO's Yearbook of Labor Statistics 1995and are for 1994.Data for central and non-central government and health are from Gary Reid (LA3PS). Civil Service Reform in LatinAmerica: Lessons from Experience" and refers to 1990. Education employment has been essentially decentralized.Government finances education through system of vouchers which are given to public education teachers as well asteachers from some private institutions. Education figure, accordingly, is very small. Health employment is also adecentralized activity and offloaded to Local Govemments. State owned enterprise employment is also from theabove mentioned study and relate to 1991. Military employment data include conscripts (31,000), but do notinclude personnel in paramilitary organizations, i.e. Carabineros (31,000).Data on GDP at market prices is a 1993 estimate and is taken from World Tables 1995. Consolidated CentralGovernment wages and salaries are for 1993 and are taken from IMF Government Finance Statistics Yearbook,1995. Data on wages in manufacturing are from the International Labor Office's Yearbook of Labor Statistics 1995and refer to 1993.
ColombiaUnemployment rate is drawn from CIA Factbook 1995 and refers to 1994 Data on paid employment in non-agricultural activities are taken from the ILO's Yearbook of Labor Statistics 1995 and are for 1992.Data on Central, Non central govemment and education employment are from Departamento Administrativo delServicio Publico, Contralria General de la Republica, Departimento nacional de Estadistica and relate to 1996.Education employment corresponds to 'teaching personnel" category only and does not include personnel employedin " Fondos Educativos Regionales" (10,496) and in the "Planta decentralizada' (10,627). Health Sectoremployment is taken from Municipal Health Services Project Staff Appraisal Report dated May 14,1993. The dataonly relates to Public Sector data (p. 4 para 1.9, indicates that the ratios in Public Health service are 1.3 for nurses,12 for nurse assistants, 3.8 for promoters and 2.5 for doctors). This equates to 4,508 nurses, 42,818 nurses'assistants, 13,554 promoters and 8,921 doctors. The Ministry of Health, along with the National PlanningDepartment, is responsible for guiding health sector policy, for providing administration support for loweradministrative levels of the system and for evaluating and monitoring performance. Colombia is decentralizingmanagement and fiscal responsibility for public sector programs to the country's 33 departments and 1,029municipalities. Military employment data include conscripts (67,300), but do not include personnel in paramilitaryorganizations, e.g., National Police Force (87,000) and the Coast Guard.Data on GDP at market prices is a 1993 estimate and is taken from World Tables 1995. Consolidated CentralGovernment wages and salaries are for 1993 and are taken from IMF Government Finance Statistics Yearbook,1995.
Costa RicaData on paid employment in non-agricultural activities are taken from the ILO's Yearbook of Labor Statistics 1995and are for 1994.General Government employment is taken from the IMF Report No.SM/96/124 of may 31, 1996 and relates to 1995.Costa Rica is forbidden by its Constitution to have Armed Forces. Paramilitary units, i.e., the Rural Guard (3,200),under the authority of the Ministry of Government and Police, and the Civil Guard (4,300) do, however, exist toensure internal security.
Dominican RepublicGeneral Government employment and State-owned enterprise employment are taken from Public SectoModernization in the Caribbean. Military employment data do not include Paramilitary units, e.g., the National Police(15,000).
EcuadorUnemployment data are drawn from CIA Factbook 1995 and relate to 1994. Data on paid employment in non-agricultural activities are taken from the ILO's Yearbook of Labor Statistics 1995 and are for 1994.
- 67 -
Central Government employment figures are drawn from Modernization of the State Technical Assistance Project of21 November, 1994. In Ecuador, Education is considered one of the primary responsibilities of the CentralGovernment. The sector is highly centralized. However, post-secondary education is managed by an autonomousagency (CONUEP) and Vocational education under (SECAP). The Health data comes from the Second SocialDevelopment Project Staff Appraisal Report of June 29, 1992, which indicates that the total staff of the Ministry ofHealth is 30,000, of whom 8,000 are doctors.Consolidated Central Government wages and salaries are for 1994 and are taken from IMF Government FinanceStatistics, 1995. Data on wages in manufacturing are from the International Labor Office's Yearbook of LaborStatistics 1995 and refer to 1994.
El SalvadorData on paid employment in non-agricultural activities are taken from the ILO's Yearbook of Labor Statistics 1995and are for 1992. Unemployment data are taken from the ILO's Yearbook of Labor Statistics 1995 and refer to 1992and source l: Labor force sample surveys and General household sample surveys.Central Government and Local Government employment is taken from document provided by Country Team for ElSalvador (Jorge Shepherd- (LADCN) and relate to 1995. Central Government employment includes personnel ofministries (except for education and health--see notes below) plus personne of Procuraduria General, Banco Centralde Reserva, Cortes de Cuentas, Fiscalia General, Fondo de Inversion Social (in total 2,865 employees).Education employment is taken from the same document, which indicates that Ministry of Education staff is 38677,of which 32570 are teachers. According to our definition we only included teachers in the education category. Theremaining other personnel was included in the central government category. Health employment data is taken fromthe same document. However, it indicates that 21,455 people work in the Ministry of Health, of which only 6,244are doctors and paramedics. Since this proportion of supposed administrative to medical staff seems somewhatexcessive, it is possible that some additional medical staff could be in this category. We have decided to include all21,455 employees in the health employment category, conscious that this might be overestimating somewhatmedical staff. . This figure should therefore, be treated with some caution. Employment is State Ownedenterprises, accounts for 11,071 people. Military employment data do not include personnel in paramilitary units,e.g., the National Civilian Police (8,000).Data on GDP at market prices is from IMF Government Finance Statistics and is for 1994. Average Public Sectorwage corresponds to Average wage of Consolidated Central Government, is taken from IMF Country Report No.96/39 of May 1996 and relates to 1994. Manufacturing wage is also taken from IMF Staff Background CountryReport of May 1996 and relates to 1994.
GuatemalaData on paid employment in non-agricultural activities are taken from the ILO's Yearbook of Labor Statistics 1995and are for 1993. Unemployment data are taken from the ILO's Yearbook of Labor Statistics 1995, refer to 1991and source l1l, Code 1: Employment office statistics and do not include persons who are already in employment.Military employment data include conscripts, but do not include personnel in paramilitary units, i.e., the NationalPolice (9,800), the Treasury Police (2,500), and the Territorial Militia (300,000).
GuyanaUnemployment data are taken from the ILO's Yearbook of Labor Statistics 1995, refer to 1993 and source Illi, Code2: Employment office statistics and include persons in employment who are seeking a change of job or extra workand are therefore also registered at employment offices.Central Government employment data are taken from IMF Report No. SM/95/132 and relates to 1995. Non CentralGovernment, Education and Health employment are taken from Guyana Public Sector Review of May 17, 1993 andrelate to 1992. Both Education and Health employment are responsibility of Regional Administrations. State-ownedenterprise employment is taken from IMF Report No. SM/95/132 and relates to 1995. Military employment data donot include personnel in paramilitary units, i.e., the Guyana People's Militia (1,500).Consolidated Central Government wages and salaries is from IMF Report No. SM/96/241 of September 24, 1996and relates to 1993.
HondurasUnemployment data are drawn from CIA Factbook 1995 and relate to 1992. Data on paid employment in non-agricultural activities are taken from the ILO's Yearbook of Labor Statistics 1995 and are for 1992.Data relating to Central Government Employment is drawn from Country Economic Memorandum/PA of November17, 1994 (A-3). Central Government employment does not include military or military police. Data relating toeducation (teachers), military and local government are from Public Sector Modernization Technical Assistancecredit (PSMTAC) of January 19,1996. Data on military employment include conscripts (13,200), but do not includepersonnel in paramilitary units, i.e., the Public Security Forces (5,500), under the authority of the Ministry of PublicSecurity and Defense.Wages and salaries as percent of GDP is taken from WB Report No. T-6740-HO of January 19, 1996 -TechnicalAnnex for Public Sector Modernization Technical Assistance Credit.
JamaicaData on paid employment in non-agricultural activities are taken from the ILO's Yearbook of Labor Statistics 1995and are for 1991.

- 68 -
Unemployment data are taken from the ILO's Yearbook of Labor Statistics 1995 and refer to 1992 and source l:Labor force sample surveys and General household sample surveys.
MexicoData on paid employment in non-agricultural activities are taken from the ILO's Yearbook of Labor Statistics 1995and are for 1993. Unemployment data are taken from the International Labor Office's Yearbook of Labor Statistics1995 and refer to 1993 and source l: Labor force sample surveys and General household sample surveys.
NicaraguaUnemployment Data are drawn from Country Economic Memorandum for 1992. The figure relates to officialunemployment; it may, however, underestimate the actual unemployment since it does not take into accountunderemployment and informal sector employment. Data on paid employment in non-agricultural activities aretaken from the ILO's Yearbook of Labor Statistics 1995 and are for 1992.Central Government, Education and Health employment figures are drawn from the Nicaragua Civil ServiceDiagnostic Review of September 19,1994 and relates to 1994.Data on GDP at market prices is a 1993 estimate and is taken from World Tables 1995.
Consolidated Central Government wages and salaries are from 1994 and is taken from IMF Government FinanceStatistics Yearbook, 1995. Data on wages in manufacturing (monthly basis) is taken from the International LaborOffice's Yearbook of Labor Statistics 1995 and refer to 1992.
ParaguayData on paid employment in non-agricultural activities are taken from the ILO's Yearbook of Labor Statistics 1995and are for 1994.Data on military employment include conscripts (12,900), but do not include personnel in paramilitary units, i.e., theSpecial Police Service (8,000).
PeruAll available data are drawn from Public Expenditure Review. Data on military include conscripts (65,500), but donot include personnel in paramilitary units, i.e., the National Police (60,000), the Coast Guards (600), and theRondas Campesinas (2,000, est), which is a peasant self-defense force deployed mainly in emergency zone.
SurinameData on paid employment in non-agricultural activities are taken from the ILO's Yearbook of Labor Statistics 1995and are for 1993. Unemployment data are taken from the ILO's Yearbook of Labor Statistics 1995 and refer to 1993and source I: Labor force sample surveys and General household sample surveys.
Trinidad and TobagoData on paid employment in non-agricultural activities are taken from the ILO's Yearbook of Labor Statistics 1995and are for 1993. Unemployment data are taken from the ILO's Yearbook of Labor Statistics 1995 and refer to 1993and source l: Labor force sample surveys and General household sample surveys.Data on military employment do not include personnel in paramilitary units, i.e. the Police force (4,800).Employment in State-owned enterprises is taken from IMF Staff Country Report No. 96/50 - Statistical Appendix ofJune 1996 and relates to 1993.
UruguayUnemployment data are drawn from CIA Factbook 1995 and relate to 1994. Data on paid employment in non-agricultural activities are taken from the ILO's Yearbook of Labor Statistics 1995 and are for 1994.Central Government, Non Central Govemment, Education and Health employment data are from information madeavailable by Uruguay Country Economist and relate to 1993. Employment in State -owned enterprise is from thesame source and relates to 1993 as well.Data on wages in manufacturing (monthly basis) is taken from the International Labor Office's Yearbook of LaborStatistics 1995 and refers to 1993.
VenezuelaUnemployment data are taken from the ILO's Yearbook of Labor Statistics 1995 and refer to 1993 and source I:Labor force sample surveys and General household sample surveys. Data on paid employment in non-agriculturalactivities are taken from the ILO's Yearbook of Labor Statistics 1995 and are for 1990.Data on GDP at market price, and wages and salaries of Consolidated Central Government are taken from IMFGovernment Finance Statistics and relate to 1994.
Middle East and North Africa

- 69 -
AlgeriaPaid employment in non-agricultural activities is drawn from the ILO's Yearbook of Labor Statistics 1995 and refersto 1987.Central Government employment figures do not include Defense data or social security. They are drawn from B.Pecheur's report (draft 09/05/95). Central Government is defined as Central Government excluding localgovernment, PTr personnel, career armed forces and judiciary. Military includes 90,000 conscripts. Data on Healthworkers are taken from a May 17, 1995 IMF Algeria Background paper by E. Bell and Feler (p. 19), which specifiesthat health workers are 0.64% of population (.64 per 100 inhabitants) for the year 1994. It does not include a numberof health workers who are under contract or work for semi-autonomous hospitals (32). In Algeria, education is thesole responsibility of the central government and private education is illegal. Employment in State-ownedenterprises is taken from IMF Report SM/96/135 Selected Economic Issues, dated June 13, 1996. Militaryemployment data include 90,000 conscripts, but do not include paramilitary units, such as the Gendarmerie,(24,000), the National Security Forces (16,000), both under the command of the Ministry of Interior and theRepublican Guard (1,200).Wages and Salaries are taken from IMF Report No. 95/108 of May 17,1995 and relate to 1994.In Algeria, Education and Health are the sole responsibility of the Central Government. Accordingly, the data onConsolidated Central Government employment is inclusive of Education and Health employment.Data on wages in manufacturing (monthly basis) are taken from a report from the Algerian National Statistical Officein Algeria: 'Les Salaires Bruts Moyens en Algerie" and refer to 1993.
BahrainCentral Government employment, education and health employment are taken from IMF Report SM 94/85 of April 1,1994 and relate to 1993. There is no local Government structure in Bahrain. Source: Mr. Buhiji of the Embassy ofBahrain.GDP at market prices, Average Government wage and wage bill are taken from IMF Report SM/96/39 of February12, 1996 and relates to 1995. All other data stems from this data.
EgyptPaid employment in non-agricultural activities is drawn from the ILO's Yearbook of Labor Statistics 1995 and refersto 1992.Central Govemment, Non-Central Government, and employment in State-owned enterprises are taken from IMFReport No. SM 95/226 of September 6, 1995 and relate to FY 1993/94. Education employment data are takenfrom EMTHR (John Evans mission of September 1995) and are for 1994-95. The data reflect the number of "Fulltime equivalent" teachers in the primary, secondary and university sectors. It does not include University teachers.In addition it does not reflect the official Egyptian definition of teachers. Teachers are under Governorate jurisdictionin Egypt; however, the system remains highly centralized. Accordingly, they have been included in centralgovernment employment. Health employment is a WB Staff estimate. Military employment data include conscripts(222,000), but do not include paramilitary units, i.e., the Coast Guards (2,000), the Central Security Forces (60,000)under the authority of the Ministry of Interior, and the Border Guard forces (12,000).GDP at market price is taken from World Tables 1995 and refers to 1994 (estimate). Data on wages and salaries ofConsolidated Central Government is taken from the IMF's Report No. SM/95/226 of September 6, 1995.
JordanPaid employment in non-agricultural activities is drawn from the ILO's Yearbook of Labor Statistics 1995 and refersto 1993.Data on Central Government Education and Health employment estimates are taken from Barbara Nunberg's AideMemoire on Jordan dated December 1994. Non central Government employment represents a staff estimate for1996 based on data taken from WB report on Local government finance sector study of April 20, 1990..Military employment data do not include personnel of paramilitary units, i.e., the Public Security Directorate (10,000)under the authority of the Ministry of Interior, and the Civil Militia People's Army (200,000).GDP at market price, and data on wages and salaries of Consolidated Central Government are taken fromGovernment Finance Statistics and relate to 1993. In Jordan, Consolidated Central Government includes Educationand Health services. Accordingly, employment figure includes Education and Health employment. Data on wages inmanufacturing (monthly basis) are taken from the Intemational Labor Office's Yearbook of Labor Statistics 1995 andrefer to 1993.
LebanonCivil Service numbers only refer to currently filled Civil Administration employees for 1994. In total, there were110,000 people on the government payroll. Non central Government employment comes from the same source asabove and relates to 1992. Teachers' data were taken from the Administrative Rehabilitation Project, TechnicalAnnex of June 5, 1995. The note mentions 32,000 teachers. Health Sector employment data are taken from Annex3 of the note based on a report prepared for the World Bank by Cristian de Clerq of the UNARDOL. It states that asof 1992, the Ministry of Health and Social Affairs employed 2,984 employees. NGOs employ four times as manypeople, or about 6,880 people, in the sector. Military employment data do not include paramilitary units, i.e., theInternal Security Force (13,000), under the authority of the Ministry of Interior.

- 70 -
ALTHOUGH RELIABLE DATA ARE AVAILABLE FOR BOTH EMPLOYMENT AND WAGES, LEBANON IS NOTINCLUDED IN THE REGIONAL AVERAGES SHOWN IN THE TEXT TABLES BECAUSE ITS UNIQUESITUATION, COMBINED WITH A RELATIVELY SMALL NUMBER OF COUNTRIES IN THE MENA REGION,WOULD MAKE SUCH INCLUSION HIGHLY MISLEADING.Data on wages and salaries is taken from EMTPM Background paper in EMTPM files and relates to 1991. InLebanon, consolidated Central Government includes education and Health services. Accordingly employment figureincludes education and Health employment.
MoroccoPaid employment in non-agricultural activities is drawn from the ILO's Yearbook of Labor Statistics 1995 and refersto 1994.Central Government, Education and Health employment are taken from Note on Public Administration as ofDecember 1995 and refer to 1995. Non central government is taken from Morocco Public Expenditure Review ofAugust 30, 1994 and relates to 1993. Military employment data include conscripts (100,000), but do not includepersonnel of paramilitary units, i.e., Gendarmerie Royale (12,000), the Force auxiliaire (30,000), and theCustoms/Coast Guard.Average wage estimate comes from Anne Marie Leroy's report "La Fonction Publique Marocaine au ler Decembre1995: Constats et elements de reforme". Data on wages in manufacturing (monthly basis) is taken from a WorldBank Report 'Kingdom of Morocco: Country Economic Memorandum: Towards a Higher Growth and Employment"and refers to 1995.
SyriaPaid employment in non-agricultural activities is drawn from the ILO's Yearbook of Labor Statistics 1995 and refersto 1991.Education, Health, Central Government estimates are taken from Algerian Background report and are for 1992 (seereference for Algeria). Non Central government in Syria is based on a staff estimate. Military employment data donot include paramilitary personnel, i.e., Gendarmerie (8,000), and the Ba'th Party Workers Militia.GDP, and data on Consolidated Central Government wages and salaries are taken from IMF Senior economist fromSyria Leigh Alexander and refer to 1994.
TunisiaPaid employment in non-agricultural activities is drawn from the ILO's Yearbook of Labor Statistics 1995 and refersto 1989.Data relating to Central Government employment is taken from Republique Tunisienne: Enieux de la reforme de lafonction publigue written by Maria Pigato (MN1CO) in June 1995 and relates to the year 1994. Education andHealth data are taken from the IMF Algerian Background paper. Health does not include persons working inHospitals and other PSE. Local Government data are also taken from Miria Pigato and are only restricted tocommunes. Military employment data are taken from International Institute for Strategic Studies: The MilitarBalance Survey of 1995-96. Data include conscripts (26,400), but do not include paramilitary, i.e., Police (13,000),and National Guard (10,000).Data on average wages in the Central Government is taken from Republique Tunisienne: Enjeux de ia reforme de lafonction publique of June 1995 (non official working document) which states that " average central governmentsalaries are three times per capita GDP".
West Bank/GazaData on population and labor force are from the Civil Service Review mission of January, 1996 (EMTPM, DP).The unemployment figure is found by taking the weighted average of unemployment rates in West Bank and Gaza.
All statistical data exclude the population of East Jerusalem.All numbers relating to Central Government employment are drawn from the Civil Service Study of June 1996. Ofthis number, 934 are daily workers and relate to 1995 levels. Data on civil service employees include 25,000 policeforce. Data on Health employment include 673 daily workers and are from 1996 Civil Service Review Mission, AideMemoire. Data on Education include 323 daily workers. All statistical data exclude the population of EastJerusalem.Estimates of GDP at market prices are taken from Country Office and are for 1995. Average monthly net pay(excluding non-wage payments) for permanent employees is estimated at NIS 1360 as of October 1995.
YemenUnemployment rates estimated at 25-30% for the years 1991-93 (Country Assistance Strategy, September 1995).Central Government employment figures are taken from S. Schiavo-Campo's Note on Civil Service andAdministrative Reform in Yemen and are for 1996. Education Employment data are taken from Education SectorInvestment Proiect of February 01, 1994. Health employment data is from Gail Richardson (MN2HR) afterconsultation of Project Implementation Unit data in Yemen. Military employment data include conscripts (25,000est.), but do not include personnel in paramilitary units, i.e., Ministry of National Security forces (10,000), and triballevies (20,000 + est.)GDP at market price is taken from World Tables 1995 and refers to 1993 (estimate).Data on wages and salaries is taken from EMTPM files (SSC BTOR of 3 February 1995) and relates to 1994.
- 71 -
OECD
AustraliaPaid employment in non-agricultural activities is drawn from the ILO's Yearbook of Labor Statistics 1995 and refersto 1994.Data on Central Government, Non central, Education and Health employment are taken from Public Management:OECD Country profiles, OECD 1992 and relate to December 1991. In our data, federal employees correspond tocentral govemment, whereas non-central government employees include employees of both the state governmentand of municipalities. Although education and health care in Australia are states' responsibilities, the federalgovernment contributes heavily in providing funding. Accordingly, we have subtracted education and healthemployees from non-central government employment.Data on wages in manufacturing (monthly basis) is taken from the International Labor Office's Yearbook of LaborStatistics 1995 and refers to 1994.
AustriaPaid employment in non-agricultural activities is drawn from the ILO's Yearbook of Labor Statistics 1995 and refersto 1993.Data on Central Government, Non Central Government, Education and Health employment are taken from PublicManagement: OECD Country profiles, OECD 1992 and relate to 1990. In our data, federal employees correspondto central government, whereas non-central government employees include employees of both the stategovernment and of municipalities. Responsibility for education is shared between the Lander and the federalgovernment. Teachers (for primary and secondary education) are Lander employees but are paid by the federalgovernment. Teachers of general and secondary education are the responsibility of the federal government.According to our definition, therefore, they are considered central government.Consolidated Central Government wages and salaries are for 1993 and are taken from IMF Government FinanceStatistics Yearbook, 1995. Data on wages in manufacturing (monthly basis) are taken from the International LaborOffice's Yearbook of Labor Statistics 1995 and refer to 1994.
BelgiumPaid employment in non-agricultural activities is drawn from the ILO's Yearbook of Labor Statistics 1995 and refersto 1992.Data on Central Government, Non-central Government, Education, Health and State-owned enterprise employmentare taken from IMF Report No. SM/94/289 of December 7, 1994 and relate to 1/1/ 94. In Belgium, education isexclusively the right of non-central government. Health services responsibilities are shared between the centralgovernment and the communities.Consolidated Central Government wages and salaries are for 1993 and are taken from IMF Government FinanceStatistics Yearbook, 1995. Data on wages in manufacturing (monthly basis) are taken from the Intemational LaborOffice's Yearbook of Labor Statistics 1995 and refer to 1993.
CanadaPaid employment in non-agricultural activities is drawn from the ILO's Yearbook of Labor Statistics 1995 and refersto 1994.Data on Central and Non Central Government employment are taken from IMF Report No. SM/95/62 of April 7, 1995and relate to 1994. In our data, federal employees correspond to central government, whereas non-centralgovernment employees include employees of both the county governments and of municipalities. Data onEducation and Health employment are from Public Management: OECD Country profiles, OECD 1992 and relate to1990. Responsibility for education is essentially with the county government. The federal government contributesfinancially, but salaries are paid by the provincial government. Health services are also mainly the responsibility ofnon-central government. Data on State-owned enterprises are also from Public Manaaement: OECD Countryprofiles, OECD 1992 and relate to 1990. Military employment data exclude personnel of paramilitary units, i.e., theCoast Guard (5,200).Consolidated Central Government wages and salaries are for 1991 and are taken from IMF Government FinanceStatistics Yearbook, 1995. Data on wages in manufacturing (monthly basis) is taken from the International LaborOffice's Yearbook of Labor Statistics 1995 and refers to 1993.
DenmarkPaid employment in non-agricultural activities is drawn from the ILO's Yearbook of Labor Statistics 1995 and refersto 1994.Data on Central Government, Non central Govemment, Education and Health employment are taken from PubliManagement: OECD Country orofiles, OECD 1992 and relate to 1990. Responsibility for education is sharedbetween three levels of government. Primary schooling is assigned to municipalities, secondary schools are fundedby the counties, whereas the central government is responsible for the higher education. Vocational training is alsofunded by the central government. Health care is exclusively the responsibility of non-central government.Data on military employment are taken from the International Institute for Strategic Studies: The Military BalanceSurvey of 1995-96. Data include conscripts (8,300), but exclude personnel of paramilitary units.

- 72 -
consolidated Central Government wages and salaries are for 1993 and are taken from IMF Government FinanceStatistics Yearbook, 1995. Data on wages in manufacturing (monthly basis) is taken from the International LaborOffice's Yearbook of Labor Statistics 1995 and refers to 1992.
FinlandPaid employment in non-agricultural activities is drawn from the ILO's Yearbook of Labor Statistics 1995 and refersto 1994.Data on Central Government, Non central government, Education and Health employment are taken from PublicManagement: OECD Country profiles, OECD 1992 and relate to 1991. Responsibility for education is sharedbetween the central government and the municipalities, with the states contributing to the finance of approximately70% of running costs. Higher education is financed by the central government. Vocational training is also funded bythe central government. Health care is largely the responsibility of local government. Data on military employmentare taken from the International Institute for Strategic Studies: The Military Balance Survey of 1995-96. Data includeconscripts (23,900), but do not include personnel of paramilitary units, i.e., the Frontier Guard (3,500), under theauthority of the Ministry of the Interior.Data on wages in manufacturing (monthly basis) is taken from the International Labor Office's Yearbook of LaborStatistics 1995 and refers to 1993.
FrancePaid employment in non-agricultural activities is drawn from the ILO's Yearbook of Labor Statistics 1995 and refersto 1994.Data on Central Government, Non Central govemment, Education and Health employment are taken from PublicManagement: OECD Country profiles, OECD 1992 and relate to 1989. Responsibility for education is sharedbetween the central government, the departments and the municipalities. However, the central government pays forthe salaries of all teachers employed in public schools. Health care is largely the responsibility of the centralgovernment. Data on military employment are taken from the Intemational Institute for Strategic Studies: TheMilitary Balance Survey of 1995-96. Data include conscripts (189,200), but exclude personnel in paramilitary units,i.e., Federal Border Guard (24,500), under the authority of the Ministry of Interior, and the Coast Guard.
GermanyPaid employment in non-agricultural activities is drawn from the ILO's Yearbook of Labor Statistics 1995 and refersto 1994.
GreecePaid employment in non-agricultural activities is drawn from the ILO's Yearbook of Labor Statistics 1995 and refersto 1993.Data on Central Government, Non central government, Education and Health employment are taken from PublicManagement: OECD Country profiles, OECD 1992 and relate to 1990. Public education and health are solely theresponsibility of the central government. Military employment data include conscripts (114,000), but excludepersonnel in paramilitary units, i.e., Gendarmerie (26,500) and the Coast Guard and Customs (4,000).Data on wages in manufacturing is taken from the Intemational Labor Office's Yearbook of Labor Statistics 1995and refers to 1994.
IrelandPaid employment in non-agricultural activities is drawn from the ILO's Yearbook of Labor Statistics 1995 and refersto 1994.Data on Central Government, Non central government, Education and Health employment are taken from PublicManagement: OECD Country profiles, OECD 1992 and relate to 1991. Public education is the responsibility of thecentral government. University education is subsidized by the central government, but funds are channeled throughthe departrnent of education to an autonomous Higher Education authority. Vocational education is managed at thecounty level. Health services are under the responsibility of health boards which administer them on a regionalbasis and are responsible for the implementation of a large element of govemment health policy. Most of theirexpenditures are financed however by the central government.
ItalyPaid employment in non-agricultural activities is drawn from the ILO's Yearbook of Labor Statistics 1995 and refersto 1994.Data on Central Government, Non central government, Education and Health employment t are taken from PublicManagement: OECD Country profiles, OECD 1992 and relate to 1989. Public education at the primary andsecondary level is the responsibility of the central government, which recruits, pays and assigns all teachers.Universities have autonomous status and are self-governing. The central administration still recruits and providesalmost all funding for staff salaries. University education is subsidized by the central government, but funds arechanneled through the Department of Education to an autonomous Higher Education authority. Vocational educationis managed at the county level. Health services are financed by the National Health Fund which is made up ofcompulsory contributions by employers, employees and self-employed, plus an allocation from the national budget.Central government establishes health spending targets, but employees are paid directly by the National HealthService. Information on military employment include conscripts (174,700), but exclude personnel in paramilitary

- 73 -
units, i.e., Carabinieri (93,400) and the Public Security Guard (80,400), both under the authority of the Ministry ofDefense, as well as the Finance Guard (64,100), under the authority of the Treasury Department and the HarborControl.
JapanData on Central Government, Non central government, Education and Health employment are taken from PublicManagement: OECD Country profiles, OECD 1992 and relate to 1991. Public education and health are theresponsibility of non-central government. Military employment data include Central Staffs.
NetherlandsUnemployment rate is taken from OECD Economies at a Glance - Structural Indicators, 1996 and relates to 1994.Paid employment in non-agricultural activities is drawn from the ILO's Yearbook of Labor Statistics 1995 and refersto 1994.Data on Central Government and Non central employment are taken from Public Management: OECD Countryprofiles, OECD 1992 and relate to 1990. Public education provides for 28% of school-aged children, while privateeducation provides for the rest. The central govemment finances almost totally private institutions, but is not directlyresponsible for the salaries of the teachers. Accordingly they are not included among the education employmentdata. Health services are provided jointly by the voluntary social networks, professional services, insuranceorganizations and the government at national and subnational levels. It has therefore never developed into ahierarchical organization in which professional services are managed and paid for by the government. For thisreason, it has not been possible to obtain and include any reliable figure on health employment.
New ZealandPaid employment in non-agricultural activities is drawn from the ILO's Yearbook of Labor Statistics 1995 and refersto 1993.Data on Central, Non Central Government and Education employment are taken from Public Manaaement: OECDCountry profiles, OECD 1992 and relate to 1992. Note that Education employment figure includes health workers.Primary and secondary education is managed by community-elected boards of trustees and financed by blockgrants provided by the central government. Public Health services are funded by general taxation through theDepartment of Health, which distributes them to a wide range of practitioners, administrative organizations andothers providing publicly funded services. Reform of the system, however, is being contemplated.
NorwayPaid employment in non-agricultural activities is drawn from the ILO's Yearbook of Labor Statistics 1995 and refersto 1994.Data on Data on Central Government, Non central government, Education and Health employment are taken fromPublic Manaaement: OECD Country profiles, OECD 1992 and relate to 1990. Public education responsibilities areshared among different levels of govemment. Primary schools and lower secondary are the responsibility of themunicipalities. The central government, however, is in charge of upper secondary and higher education.Health care is run by municipalities and counties, but funded through block grants by central government, as well asthrough the municipalities' own revenue.
PortugalPaid employment in non-agricultural activities is drawn from the ILO's Yearbook of Labor Statistics 1995 and refersto 1993.Data on Data on Central Government, Non central government, Education and Health employment are taken fromPublic Management: OECD Country profiles, OECD 1992 and relate to 1989. Public education and health are theresponsibility of non-central government. Military employment data include conscripts (17,600), but excludepersonnel in paramilitary units, i.e., the National Republican Guard (20,900), the Public Security Police (20,000), andthe Border Security Guard (8,900).Data on wages in manufacturing (monthly basis) are taken from the Intemational Labor Office's Yearbook of LaborStatistics 1995 and refer to 1993.
SpainPaid employment in non-agricultural activities is drawn from the ILO's Yearbook of Labor Statistics 1995 and refersto 1994.Data on Data on Central Government, Non central government, Education and Health employment are taken fromPublic Management: OECD Country profiles, OECD 1992 and relate to 1990. Public education and health are theresponsibility of non-central government. Military employment data include conscripts (126,000), but excludepersonnel in paramilitary units, i.e., Guardia Civil (75,000), and la Guardia Civil del Mar (550).Average Govemment wages is taken from Trends in Public Sector Pay in OECD Countries, 1995 edition and relatesto 1993.Data on wages in manufacturing (monthly basis) are taken from the International Labor Office's Yearbook of LaborStatistics 1995 and refer to 1994.
- 74 -
SwedenData on Data on Central Government, Non central government, Education and Health employment are taken fromPublic Management: OECD Country profiles, OECD 1992 and relate to 1990. Public education and health are theresponsibility of non-central govemment. Military employment data include conscripts (31,600), but excludepersonnel in paramilitary units, e.g., Coast Guards, Civil Defense and Voluntary Auxiliary organizations.GDP at market prices are from IMF Government Finance Statistics Yearbook, 1995 and relate to 1994.Consolidated Central Government wages and salaries are for 1994 and are taken from IMF Government FinanceStatistics Yearbook, 1995.Data on wages in manufacturing are taken from the International Labor Office's Yearbook of Labor Statistics 1995and referto 1993.Paid employment in non-agricultural activities is drawn from the ILO's Yearbook of Labor Statistics 1995 and refersto 1992.
SwitzerlandPaid employment in non-agricultural activities is drawn from the ILO's Yearbook of Labor Statistics 1995 and refersto 1994.Data on Data on Central Government, Non central government, Education and Health employment are taken fromPublic Management: OECD Country profiles, OECD 1992 and relate to 1985. Public education and health are theresponsibility of non-central government. Data on military employment include paramilitary units, e.g., the BorderGuard (4,300), and exclude personnel of certain units, e.g., the Civil Defense (480,000).Data on Wages In Manufacturing (monthly basis) are taken from the International Labor Office's Yearbook Of LaborStatistics 1995 and refer to 1993.
United KingdomPaid employment in non-agricultural activities is drawn from the ILO's Yearbook of Labor Statistics 1995 and refersto 1993.Data on Data on Central Government, Non central government, Education and Health employment are taken fromPublic Management: OECD Country rofiles, OECD 1992 and relate to 1992. Public education is provided by Stateschools operated by local authorities, a mixed sector which includes church schools with substantial public fundingfrom local authorities, and a small but expanding fee-paying sector. Local education authorities employ teachers aswell as administer the schools. Health care is provided by a National Health Service. It employs health employees.Over 80% of health service costs are paid out of general taxation.Average Government wages is taken from Trends in Public Sector Pay in OECD Countries, 1995 edition and relatesto 1993. Consolidated Central Government wages and salaries are for 1993 and are taken from IMF GovernmentFinance Statistics Yearbook, 1995. Data on wages in manufacturing (monthly basis) are taken from theInternational Labor Office's Yearbook of Labor Statistics 1995 and refer to 1993.
United StatesPaid employment in non-agricultural activities is drawn from the ILO's Yearbook of Labor Statistics 1995 and refersto 1994.Data on Data on Central Government, Non central government, Education and Health employment are from PublicManagement: OECD Country profiles, OECD 1992 and relate to 1985. Data on military employment include certainparamilitary units, e.g., the Border Guard, and exclude certain paramilitary units, e.g., the Civil Air Patrol (51,000),and the Coast Guard.Average Government wages is taken from Trends in Public Sector Pay in OECD Countries, 1995 edition and relatesto 1993. Data on wages in manufacturing (monthly basis) are taken from the International Labor Office's Yearbookof Labor Statistics 1995 and refer to 1994.

-75-
ANNEXStatistical Analysis of the Determinants of Government Employment

-76-
LSHI Dependent Variable is GGES LSI/ Dependent Variable is CGES
Date: 02/20197 Time: 16:59 Date: 02/20197 Time: 16:59
Sample (adjusted): 2 106 Sampte (adjusted) 2 106
Included Observatons:63 Induded Observations: 63
Excluded Observations:48 ater adjusting endpoints Excluded Observafions: 42 alter adjusting endpoints
Variable Coefficient Std. Error t-statistic Prob. Vanable Coefficient Std. Error t-stabstic Prob.
C 4.430017 0.807882 5.483497 o.oo00 C 1.642213 0.248333 6.612935 0.0000
GNPES 0.000218 4.21E-05 5.188164 0.0000 GNPES 3.88E-05 1.37E-05 26833393 0.0063
WAGES -0.493510 0.173612 -2.642597 0.0064 WAGES -0.129003 0.049464 -2.608009 0.0116
DEFES -0.017872 0.038125 -0.468772 0.6412 DEFES 0.021473 0.012636 1.699317 0.0946
POPES -2.19E-06 2.63E-06 -0.883523 0.4074 POPES -1.09E-06 8.66E-07 -1.262658 0.4074
R-squared 0.561210 Mean dependent var 4.388246 R-squared 0.398173 Mean dependent var 1.312977
Adjusted R-squared 0.527457 S.D. dependent var 3.529285 Adjusted R-squared 0.356668 S.D. dependent var 1.011030
S.E. of regression 2.426092 Akaike info criterion 1.856195 S.E. of regression 0.810927 Akaike info criterion -0.343117
Sum squared mesid. 306.0680 Schwartz criterion 2.035410 Sum squared resid. 38.14091 Schwartz criterion -0.173027
Log likelihood -128.7810 F-statistic 16.62694 Log likelihood -73.5849 F-statistic 9.593321
Durbin-Watson stat 2.277264 Prob (F- statistc) 0.00000 Durbin-Watson stat 1.762644 Prob (F- statistic) 0.000005
LS/I Dependent Variable is LGES LSII Dependent Vanable is SSES
Date: 02/20/97 Time: 17:00 Date: 02120197 Time: 17:01
Sample (adjusted): 2 106 Sample(adjusted): 2 106
Included Observations: 57 Included Observations: 62
Excluded Observations:48 after adjustng endpoints Exduded Observations: 43 after adjusting endpoints
Variable Coefficient Std. Error t-statistic Prob. Variable Coefficient Std. Error t-stabstic Prob.
C 0.720664 0.373189 1.931094 0.0589 C 1.897881 0.437424 4.338764 0.0001
GNPES 0.000106 1.96E-05 5.40309 0.0000 GNPES 9.02E-05 2.25E-05 3.658327 0.0006
WAGES -0.097075 0.080460 -1.206499 0.2331 WAGES -0.235981 0.087043 -2.711096 0.0088
DEFES -0.013427 0.017759 -0.75605 OA530 DEFES -0.029268 0.022256 -1.315053 0.1938
POPES 2.62E-08 1.23E-06 0.021349 0.9830 POPES -1.25E-06 1.52E-06 -0.820198 0.4155
R-squared 0.267527 Mean dependent var 0.671667 R-squared 0.404088 Mean dependent var 1.765323
Adjusted R-squared 0.188341 S.D. dependent var 0.822142 Adjusted R-squared 0.362270 S.D. dependent var 1.785203
S.E. of regmession 0.740685 Akaike info criteron -0.489016 S.E. of regression 1.425627 Akaike info crteron 0.786431
Sum squared resid. 20.29872 Schwartz criteron -0.282151 Sum squamed resid. 115.8475 Schwartz criterion 0.957874
Log likelihood -44.32607 F-statistic 3.378449 Log likelihood -107.3535 F-statistic 9.662947
Durbin-Watson stat 2.486894 Prob (F- statistic) 0.018755 Durbin-Watson stat 1.670930 Prob (F- statistc) 0.000005
SAMPLE.XLSentire sample

-77-
LS// Dependent Variable is GGDEV LSI/ Dependent Variable is CGDEV
Date: 02/20/97 Time: 17:39 Date: 02/20/97 Time: 17:03
Sample(adjusted):2 84 Sample(adjusted): 2 84
Included Observations: 42 Included Observations: 48
Excluded Observations: 41 after adjusting endpoints Excluded Observations:35 after adjusting endpoints
Variable Coefficient Std. Error t-statisUic Prob. Variable Coefficient Std. Error t-statistic Prob.
C 3.944510 0.749748 5.261116 0.0000 C 1.428370 0.277359 5.149903 0.0000
GNPDEV 0.000330 0.000164 2.012278 0.0515 GNPDEV 0.000121 6.20E-05 1.947966 0.0580
WAGDEV -0.460340 0.136725 -3.366903 0.0018 WAGDEV -0.118099 0.046544 -2.537379 0.0149
DEFDEV -0.05681 0.031674 -1.793616 0.0811 DEFDEV 0.015606 0.012363 1.262255 0.2137
POPDEV -9.63E-07 2.09E-06 -0.461322 0.6473 POPDEV -5.OSE-07 8.13E-07 -0.621271 0.5377
R-squared 0.401784 Mean dependent var 3.161429 R-squared 0.327761 Mean dependent var 1.078164
Adjusted R-squared 0.337112 S.D.dependentvar 2.272541 Adjusted R-squared 0.265227 S.D. dependent var 0.854470
S.E. of regression 1.850256 Akaike info criterion 1.341992 S.E. of regression 0.732442 Akaike info criteron -0.524410
Sum squared resid. 126.6676 Schwartz critenon 1.548857 Sum squared resid. 23.06826 Schwartz cnterion -0.329493
Log likelihood -82.77724 F-statistic 6.212635 Log likelihood -50.52321 F-stabstc 5.241334
Durbin-Watson stat 2.170331 Prob (F- statistic) 0.000628 Durbin-Watson stat 1.449308 Prob (F- statistic) 0.001575
LSII Dependent Varable is LGDEV LSII Dependent Variable is SSDEV
Date: 02t20197 Time: 17:04 Date: 02120/97 Time: 16:59
Sample(adjusted): 2 84
Included Observations:42 Included Observations: 2 106
Exduded ObservationsA41 after adjusting endpoints Excluded Observations: 42 alter adjusting endpoints
Variable Coefficient Std. Error t-statistic Prob. Variable Coefficient Std. Error t-statstic Prob,
C 0.442226 0.302101 1.463837 0.1517 C 1.887425 0.411906 4.582171 0.0000
GNPDEV 0.000148 6.43E-05 2.296565 0.0274 GNP 9.15E-05 9.20E-05 0.993986 0.3258
WAGDEV -0.069783 0.054683 -1.275772 0.2100 WAG -0.242491 0.069122 -3.508153 0.0011
DEFDEV -0.032734 0.012657 -2.586322 0.0138 DEF 0.041049 -0.018361 -2.235737 0.0306
POPDEV 2.50E-07 8.37E-07 0.298573 0.7669 POP -6.73E 07 1.21E-06 -0.557200 0.5803
R-squared 0.267527 Mean dependent var 0.671667 R-squared 0.352632 Mean dependent var 1.343542
Adjusted R-squared 0.188341 S.D. dependent var 0.822142 Adjusted R-squared 0.292411 S.D. dependent var 1.293122
S.E. of regression 0.740685 Akaike info criteron -0.489016 S.E. of regression 1.087752 Akaike info criterion 0.266559
Sum squared resid. 20.2987 Schwartz crteron -0.282151 Sum squared resid. 50.87778 Schwartz criterion 0.461475
Log likelihood -44.32607 F-statistic 3.378449 Log likelihood -69.50645 F-statistic 5.855692
Durbin-Watson stat 3.140431 Prob (F- statistic) 0.01878 Durbin-Watson stat 1.853231 Prob (F- stabstic) 0.000747
DEVWORLD.XLSdeveloping countries
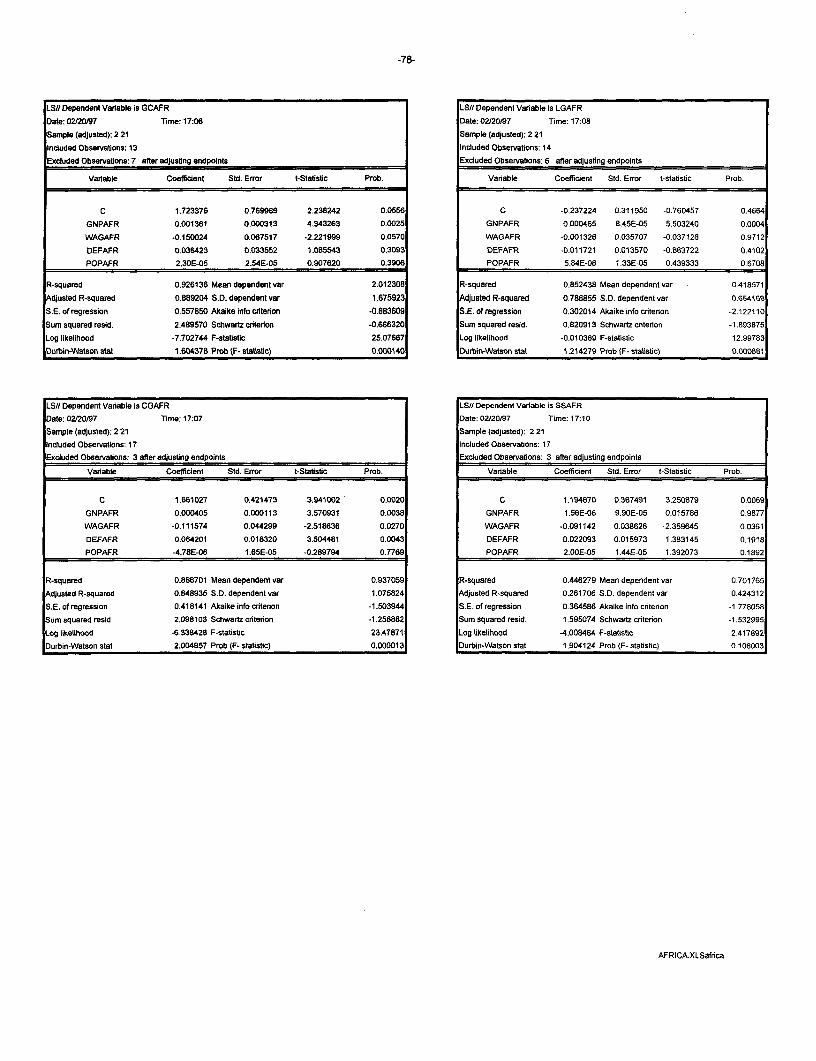
-78-
LSl/ Dependent Variable is GCAFR LS/I Dependent Variable is LGAFR
Date: 02/20/97 Time: 17:06 Date: 02/20/97 Time: 17:08
Sample (adjusted): 2 21 Sample (adjusted): 2 21
Included Observabons: 13 Inctuded Observations: 14
Excluded Observations: 7 after adjusting endpoints Excluded Observatons: 6 after adjusting endpoints
Variable Coefficient Std. Error t-Statistic Prob. Vanable Coefficient Std. Error t-statistrc Prob.
C 1.723376 0.769969 2.238242 0.0556 C -0.237224 0.311950 -0.760457 0.4664
GNPAFR 0.001361 0.000313 4.343263 0.0025 GNPAFR 0.000465 8.45E-05 5.503240 0.0004
WAGAFR -0.150024 0.067517 -2.221999 0.0570 WAGAFR -0.001326 0.035707 -0.037128 0.9712
DEFAFR 0.036423 0.033552 1.085543 0.3093 DEFAFR -0.011721 0.013570 -0.863722 0.4102
POPAFR 2.30E-05 2.54E-05 0.907620 0.3906 POPAFR 5.84E-06 1.33E-05 0.439333 0.6708
R-squared 0.926136 Mean dependent var 2.012308 R-squared 0.852438 Mean dependent var 0.418571
Adjusted R-squared 0.889204 S.D. dependent var 1.675923 Adjusted R-squared 0.786855 S.D. dependent var 0.654168
S.E. of regression 0.557850 Akaike infocriteron -0.883609 S.E. of regression 0.302014 Akaike info critenon -2.122110
Sum squared resid. 2.489570 Schwartz criterion -0.666320 Sum squared resid. 0.820913 Schwartz criterion -1.893875
Log likelihood -7.702744 F-statstic 25.07667 Log likelihood -0.010369 F-stabstic 12.99783
Durbin-Watson stat 1.604378 Prob (F- statstic) 0.000140 Durbin-Waison stat 1.214279 Prob (F- statistc) 0.000881
LSI/ Dependent Variable is CGAFR LSII Dependent Variable is SSAFR
Date: 02120/97 Time: 17:07 Date: 02120197 Time: 17:10
Sample (adjusted): 2 21 Sample (adjusted): 2 21
Included Observations: 17 Included Observabons: 17
Excluded Observabons: 3 after adjusting endpoints Excluded Observabons: 3 after adjusting endpoints
Variable Coeflicient Std. Error t-Statstic Prob. Varable Coefficient Std. Error t-Statistic Prob.
C 1.661027 0.421473 3.941002 0.0020 C 1.194670 0.367491 3.250879 0.0069
GNPAFR 0.000405 0.000113 3.570931 0.0038 GNPAFR 1.56E-06 9.90E-05 0.015786 0.9877
WAGAFR -0.111574 0.044299 -2.518636 0.0270 WAGAFR -0.091142 0.038626 -2.359645 0.0361
DEFAFR 0.064201 0.018320 3.504481 0.0043 DEFAFR 0.022093 0.015973 1.383145 0.1918
POPAFR -4.78E-06 1.65E-05 -0.289794 0.7769 POPAFR 2.OOE-05 1.44E-05 1.392073 0.1892
R-squared 0.886701 Mean dependent var 0.937059 R-squared 0.446279 Mean dependent var 0.701765
Adjusted R-squared 0.848936 S.D. dependent var 1.075824 Adjusted R-squared 0.261706 S.D. dependent var 0.424312
S.E. of regression 0.418141 Akaike info criterion -1.503944 S.E. of regression 0.364586 Akaike info crteron -1.778058
Sum squared resid. 2.098103 Schwartz criterion -1.258882 Sum squared resid. 1.595074 Schwartz criteron -1.532995
,Log likelihood -6.338428 F-statistc 23.47871 Log likelihood -4.008464 F-statistc 2.417892
Durbin-Watson stat 2.004957 Prob (F- staUstc) 0.000013 Durbin-Watson stat 1.904124 Prob (F- stabstic) 0.106003
AFRICA.XLSafrica
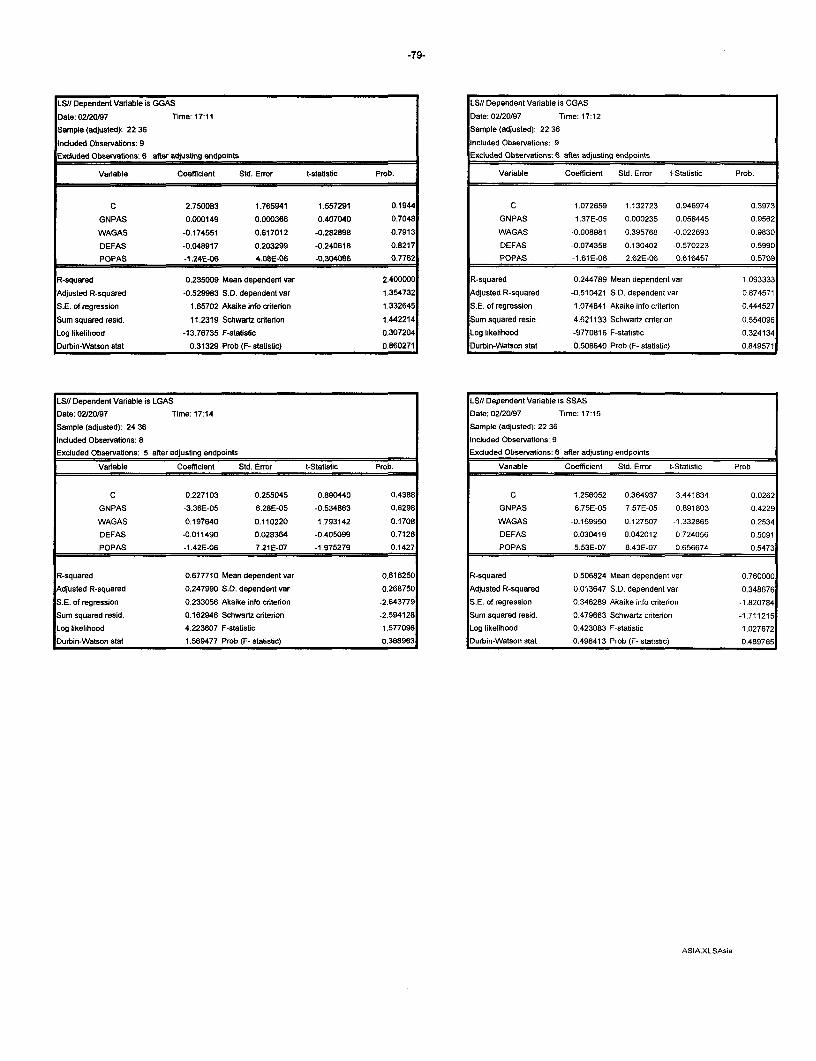
-79-
LS// Dependent Variable is GGAS LS/I Dependent Varable is CGAS
Date: 02/20197 Time: 17:11 Date: 02120197 Time: 17:12
Sample (adjusted): 22 36 Sample (adjusted): 22 36
Included Observations: 9 Included Observations: 9
Exduded Observations: 6 after adjusting endpoints Excluded Observations: 6 after adjusting endpoints
Variable Coefficient Std. Error t-statistic Prob. Variable Coefficient Std. Error t-Statistic Prob.
C 2.750083 1.765941 1.557291 0.1944 C 1.072659 1.132723 0.946974 0.3973
GNPAS 0.000149 0.000366 0.407040 0.7048 GNPAS 1.37E-05 0.000235 0.058445 0.9562
WAGAS -0.174551 0.617012 -0.282898 0.7913 WAGAS -0.008981 0.395768 -0.022693 0.9830
DEFAS -0.048917 0.203299 -0.240618 0.8217 DEFAS -0.074358 0.130402 -0.570223 0.5990
POPAS -1.24E-06 4.08E-06 -0.304086 0.7762 POPAS -1.61E-06 2.62E-06 0.616457 0.5709
R-squared 0.235009 Mean dependent var 2.400000 R-squared 0.244789 Mean dependent var 1.093333
Adjusted R-squared -0.529983 S.D. dependent var 1.354732 Adjusted R-squared -0.510421 S.D. dependent var 0.874571
S.E. of regression 1.65702 Akaike info criterion 1,332645 S.E. of regression 1.074841 Akaike info cnterion 0.444527
Sum squared resid. 11.2319 Schwartz criterion 1,442214 Sum squared resid. 4.621133 Schwartz criterion 0.554096
Log likelihood -13.76735 F-statstic 0,307204 Log likelihood -9770816 F-statistic 0.324134
Durbin-Watson stat 0.31329 Prob (F- statistic) 0,860271 Durbin-Watson stat 0.506640 Prob (F- statistic) 0.849571
LSI/ Dependent Variable is LGAS LSII Dependent Varable is SSAS
Date: 02/20/97 Time: 17:14 Date: 02/20/97 Time: 17:15
Sample (adjusted): 24 36 Sample (adjusted): 22 36
Included Observations: 8 Included Observations: 9
Excluded Observations: S alter adjusting endpoints Excluded Observations: 6 aflter adjusting endpoints
Vanable Coefficient Std. Error t-Statistic ProD. Varable Coefficient Std. Error t-Statistic Prob.
C 0.227103 0.255045 0.890440 0.4388 C 1.256052 0.364937 3.441834 0.0262
GNPAS -3.36E-05 6.28E-05 -0.534863 0.6298 GNPAS 6.75E-05 7.57E-05 0.891803 0.4229
WAGAS 0.197640 0.110220 1.793142 0.1708 WAGAS -0.169950 0.127507 -1.332865 0.2534
DEFAS -0.011490 0.028364 -0.405099 0.7126 DEFAS 0.030419 0.042012 0.724056 0.5091
POPAS -1.42E-06 7.21 E-07 -1.975279 0.1427 POPAS 5.53E-07 8.43E-07 0.656674 0.5473
R-squared 0.677710 Mean dependent var 0,616250 R-squared 0.506824 Mean dependent var 0.760000
Adjusted R-squared 0.247990 S.D. dependent var 0,268750 Adjusted R-squared 0.013647 S.D. dependent var 0.348676
S.E. of regression 0.233056 Akaike info criterion -2,643779 S.E. of regression 0.346289 Akaike info criteron -1.820784
Sum squared resid. 0.162946 Schwartz crteron -2.594128 Sum squared resid. 0.479663 Schwartz cnterion -1.711215
Log likelihood 4.223607 F-statistic 1.577096 Log likelihood 0.423083 F-statistic 1.027672
Durbtin-Watson stat 1.569477 Prob (F-statistic) 0.368963 Durbin-Watson stat 0.498413 Prob (F- statistic) 0.489765
ASIA.XLSAsia
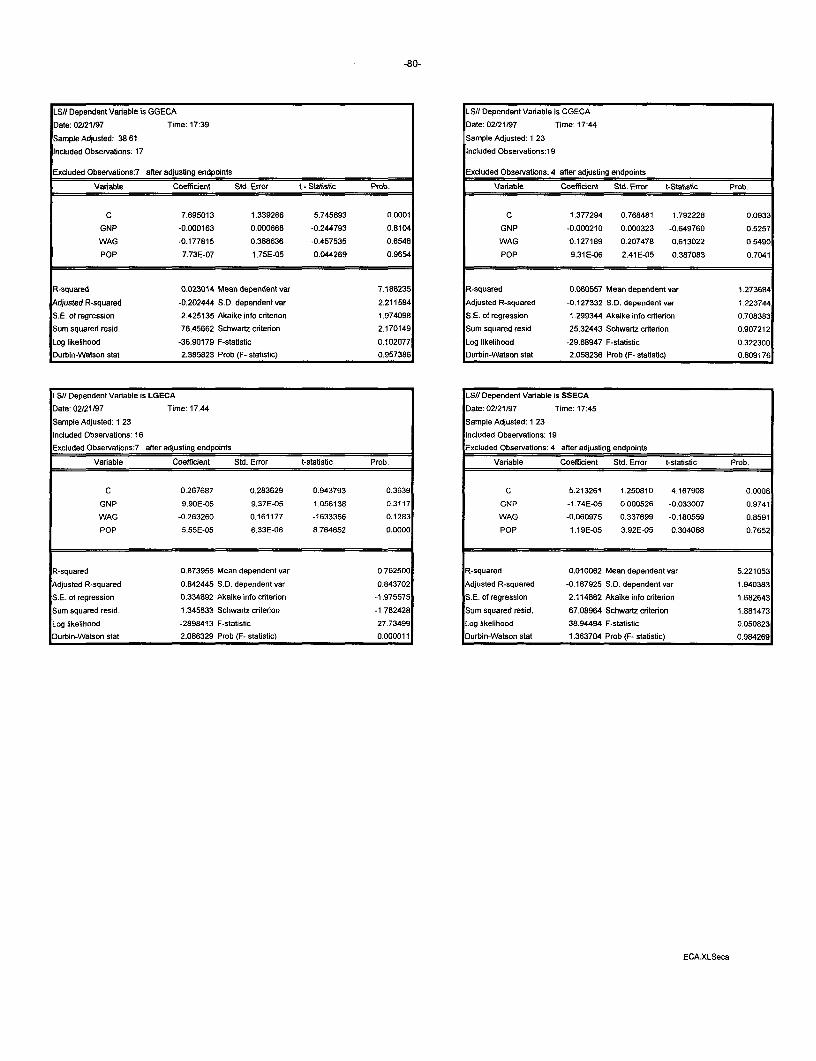
-80-
LSi/ Dependent Vanable is GGECA LSII Dependent Varable is CGECA
Date: 02/21/97 Time: 17:39 Date: 02/21/97 Time: 17:44
Sample Adjusted: 38 61 Sample Adjusted: 1 23
Included Observabons: 17 Included Observations:19
Excluded Observations:7 after adjusting endpoints Exduded Observabions: 4 after adjusbing endpoints
Variable Coefficient Std. Error t- Statistic Prob. Variable Coefficient Std. Error t-Statistic Prob.
C 7.695013 1.339266 5.745693 0.0001 C 1.377294 0.768481 1.792228 0.0933
GNP -0.000163 0.000666 -0.244793 0.8104 GNP -0.000210 0.000323 -0.649760 0.5257
WAG -0.177815 0.388636 -0.457535 0.6548 WAG 0.127189 0.207478 0.613022 0.5490
POP 7.73E-07 1 .75E-05 0.044269 0.9654 POP 9.31 E-06 2.41 E-05 0.367083 0.7041
R-squared 0.023014 Mean dependent var 7.188235 R-squared 0.060557 Mean dependent var 1.273684
Adjusted R-squared -0.202444 S.D. dependent var 2.211584 Adjusted R-squared -0.127332 S.D. dependent var 1.223744
S.E. of regression 2.425135 Akaike info critenon 1.974098 S.E. of regression 1.299344 Akaike info crterion 0.708383
Sum squared resid. 76.45662 Schwartz crterion 2.170149 Sum squared resid. 25.32443 Schwartz criteron 0.907212
Log likelihood -36.90179 F-statistic 0.102077 Log likelihood -29.68947 F-statistic 0.32230
Durbin-Watson stat 2.385823 Prob (F- statistic) 0.957386 Durbin-Watson stat 2.058236 Prob (F- statistic) 0.809176
LSII Dependent Variable is LGECA LSII Dependent Variable is SSECA
Date: 02/21197 Time: 17.44 Date: 02/21/97 Time: 17:45
Sample Adjusted: 1 23 Sample Adjusted: 1 23
Included Observabons: 16 Included Observations: 19
Excluded Observations:7 after adjusbing endpoints Excluded Observations: 4 after adjusing endpoints
Variable Coefficient Std. Error t-stabisbc Prob. Variable Coefficient Std. Error t-statistic Prob.
C 0.267687 0.283629 0.943793 0.3639 C 5.213261 1.250810 4.167908 0.0008
GNP 9.90E-05 9.37E-05 1.056138 0.3117 GNP -1.74E-05 0.000526 -0.033007 0.9741
WAG -0.263260 0.161177 -1633366 0.1283 WAG -0.060975 0.337699 -0.180559 0.8591
POP 5.55E-05 6.33E-06 8.764652 0.0000 POP 1.19E-05 3.92E-05 0.304088 0.7652
R-squared 0.873956 Mean dependent var 0.762500 R-squared 0.010062 Mean dependent var 5.221053
Adjusted R-squared 0.842445 S.D.dependentvar 0.843702 Adjusted R-squared -0.187925 S.D. dependent var 1.940383
S.E. of regression 0.334892 Akaike info criterion -1.975575 S.E. of regression 2.114862 Akaike info criteron 1.682643
Sum squared resid. 1.345833 Schwartz criterion -1.782428 Sum squared resid. 67.08964 Schwartz criterion 1.881473
Log likelihood -2898413 F-statistic 27.73499 Log likelihood -38.94494 F-stabstc 0.050823
Durbin-Watson stat 2.086329 Prob (F- stabstic) 0.000011 Durbin-Watson stat 1.363704 Prob (F- statistic) 0.984269
ECA.XLSeca

-81 -
LS// Dependent Variable is GGLAC LS/O Dependent Variable is CGLAC
Date: 02120/97 Time: 17:24 Date: 02120197 Time: 17:25
Sample Adjusted: 64 76 Sampte Adjusted 64 76
Included Observations: 9 Included Observations: 10Excluded Observafions:4 after adjusting endpoints Excluded Observatons: 3 after adjusting endpoints
Vanable Coeffident Std. Error t-statisbc Prob Variable Coefficient Std. Error t-statistic Prob
C 5.288209 1.419437 3.725568 00204 C 2494495 0.612429 4.073118 0.0096GNP 0.000663 0.000213 3.110846 00358 GNP 0.000166 9.14E-05 1 813993 0.1294
WAG -1.072847 0403904 -2.656195 00566 WAG -0.428175 0.174776 -2449851 0 0579DEF -0.042361 0 077584 -0.546005 0 6141 DEF -0.015926 0.033577 -0 474316 0 6553
POP -7.58E-05 3.71E-05 -2.044337 0.1104 POP 4.81E-05 1 60E-05 -3.002994 0.0300
R-squared 0.816854 Mean dependent var 2.977778 R-squared 0.753048 Mean dependent var 1.074000
Adjusted R-squared 0633708 S.D dependent var 1.737187 Adjusted R-squared 0.555487 S.D dependentvar 0.683686
S.E of regression 1.051382 Akaike info criterion 0.400392 S E. of regression 0 455826 Akaike info cmtenon -1.264436
Sum squared resid. 4421615 Schwartz cnteron 0.509961 Sum squared resid 1038887 Schwartz cntedon -1.113143Log likelihood -9572209 F-statistic 4.460121 Log likelihood -2867207 F-stabstic 3811717
Durbin-Watson stat 2.527886 Prob (F- stabsaic) 0.088341 Durbin-Watson stat 2 443365 Prob (F- statistic) 0 087361
LSII Dependent Varable is LGLAC LS// Dependent Variable is SSLACDate 02/20/97 Time: 1726 Date: 02/20/97 Time 17.28
Sample Adjusted: 64 76 Sample Adjusted 64 76Included ObseNabons 9 Included Observations 10
Exscuded Observabons: 4 after adjusting endpoints Excluded Observations: 3 after adjusting endpoints
Vanable Coeffident Std. Error t-Statistic Prob. Variable Coefficient Std. Error t-Statistic Prob
C -0.205761 0.477368 .0.431032 06887 C 2.936912 0.775864 3.785344 0.0128GNP 0000393 7.17E-05 5.467218 00054 GNP 0.000118 0000116 1.023043 0.3532
WAG -0.146358 0.135836 -1.077464 0.3419 WAG -0.509557 0.221417 -2.301344 0.0697
DEF -0.055528 0.026092 -2.128171 0.1004 DEF 0.031162 0.042538 0.732570 0.4967
POP 1.29E-05 1.25E-05 1.03257 0.3601 POP -3.93E-05 2 03E-05 -1 935558 0.1 107
R-squared 0.915781 Mean dependent var 0.701111 R-squared 0.651610 Mean dependent var 1.139000
Adjusted R-squared 0 831563 S D. dependent var 0.861546 Adjusted R-squared 0.372899 S.D. dependent var 0 729223
S.E. of regression 0.353588 Akaike info criterion -1.779066 SE. of regression 0.577469 Akaike info cntenon -0 791347
Sum squared mesid 0.500097 Schwartz criterion -1.669496 Sum squared resid. 1.667354 Schwartz enteron -0 640055
Log likelihood 0.235349 F-statstc 10.87386 Log likelihood -5.232649 F-statistic 2.337938
Durbin-Watson stat 1.678907 Prob (F- stadstic) 0.020084 Durbin-Watson stat 2.919531 Prob (F- statissc) 0 188347
LAC.XLSlac

-82-
LS# Dependent Vaniable is GGMENA LS// Dependent Varable is CGMENA
Date: 02/20197 Time: 17:29 Date: 02/20/97 Time: 17:30
Sample (adjusted):78 84 Sample (adjusted):7884
Induded Observations: 6 Included Observations: 6
Exduded Observabons: 1 after adjusting endpoints Excluded Observabons: 1 after adjustng endpoints
Vanable Coefficient Std. Error t-statistic Prob. Variable Coefticlent Std. Error t-stabstic Prob.
C 8.640688 2.965257 2.913977 0.2105 C 1.578321 1.578454 0.999915 0.5000
GNPMENA -0.000162 0.000323 -0.502875 0.7034 GNPMENA 0.000219 0.000172 1.275080 0.4234
WAGMENA -2.370654 1.050439 -2.256823 0.2655 WAGMENA -0.333139 0.559166 -0.595778 0.6579
DEFMENA -0.175972 0.232246 -0.757695 0.5872 DEFMENA 0.037013 0.123628 0.299393 0.8148
POPMENA 0.000158 5.54E-05 2.841528 0.2154 POPMENA 2.64E-05 2.95E-05 0.894307 0.5355
R-squared 0.943719 Mean dependent var 4.066667 R-squared 0.932606 Mean dependent var 1.400000
Adjusted R-squared 0.718597 S.D. dependentvar 1.478738 Adjusted R-squared 0.663031 S.D. dependent var 0.719333
S.E. of regression 0.784432 Akaike info criteron -0.610683 S.E. of regression 0.417566 Akaike info cnterion -1.871718
Sum squared resid. 0.612334 Schwartz criterion -0.784217 Sum squared resid. 0.173461 Schwartz crteron -2.045252
Log likelihood -1.681581 F-statistic 4.192033 Log likelihood 2.101524 F-statistic 3.459538
Durbin-Watson stat 2.243519 Prob (F- statstic) 0.349177 Durbin-Watson stat 2.243519 Prob (F- statistic) 0.380657
LS/I Dependent Variable is LGMENA LS// Dependent Variable is SSMENA
Date: 2120/97 Time: 17:31 Date: 2/20/97 Time:17:32
Included Observations:6 Included Observabons: 6
Exduded Observations: 1 after adjustng endpoints Excluded Observabons: 1 after adjusting endpoints
Varable Coefficient Std. En-or t-statstic Prob. Variable Coefficient Std. Error t-statistic Prob.
C 2.966328 0.612731 4.841157 0.1297 C 4.197969 0.848123 6.477116 0.0975
GNPMENA -0.000358 6.68E-05 -5.360037 0,1174 GNPMENA -3.09E-05 7.06E-05 -0.437393 0.7375
WAGMENA -1.232271 0.217059 -5.677117 0.1110 WAGMENA -0.845197 0.229597 -3.681222 0.1689
DEFMENA -0.209944 0.047991 -4.374691 0.1431 DEFMENA -0.010610 0.050763 -0.209005 0.8688
POPMENA 0.000107 1.15E-05 9.365905 0.0677 POPMENA 2.59E-05 1.21E-05 2.137013 0.2786
R-squared 0.994857 Mean dependent var 0.755000 R-squared 0.983896 Mean dependent var 1.928333
Adjusted R-squared 0.974286 S.D. dependent var 1.010836 Adjusted R-squand 0.919482 S.D.dependentvar 0.604232
S.E. of regression 0.162093 Akaike info criterion -3.764268 S.E. of regression 0.171455 Akaike info criterion -3.651959
Sum squared resid. 0.026274 Schwartz criterion -3.937802 Sum squared resid. 0.029397 Schwartz criterion -3.825493
Log likelihood 7.779173 F-stabstic 48.36221 Log likelihood 7.442246 F-statstc 15.27446
Durbin-Watson stat 2.243519 Prob (F- statistc) 0.107385 Durbin-Watson stat 2.243519 Prob (F- stabstic) 0.189328
MENA.XLSmena

-83-
LSUI Dependent Vanable is GGOECD LSII Dependent Variable is CGOECD
Date: 2/2011997 Time: 17:33 Date: 02120/97 Time 16:59
Sample (adjusted):87 106 Sample (adjusted): 87 106
Induded Observabons:1 5 Incduded Observabons: 15
Excluded Observabons: 5 after adjusting endpoints Excluded Observattons:48 alter adjusting endpoints
Variable Coeffticent Std. Enror t-Statstc Prob. Variable Coefficient Std. Efror t-stabstic Prob.
C -1.829757 8.057647 -0.227083 0.8249 C 0.131228 2.651409 0.049494 0 9615
GNPOECD 0.000423 0.000270 1.564151 0.1488 GNPOECD 0.000107 8.9OE-05 1.202872 0.2567
WAGOECD 1.917626 2.280271 0.840964 0.4200 WAGOECD 0.090649 0.750334 0.120811 0 9062
DEFOECD 0.514072 0.290110 1.771986 0.1068 DEFOECD 0.026864 0.095462 0.281415 0.7841
POPOECD -2.09E-05 1.30E-05 -1.605328 0.1395 POPOECD -8.61E-06 4.28E-06 -2.010909 0.0721
R-squared 0.613072 Mean dependent var 7.823333 R-squared 0.426494 Mean dependent var 2.065333
Adjusted R-squared 0.458301 S.D. dependent var 4.188204 Adjusted R-squared 0.197091 S.D. dependent var 1 131989
S.&. of regression 3.082525 Akaike info criterion 2.512700 S.E. of regression 1.014320 Akaike info criterion 0 289639
Sum squared resid. 95.01963 Schwartz criterion 2.748717 Sum squared resid. 10.28646 Schwartz critenon 0.525656
Log likelihood -35.12933 F-statistic 3.961158 Log likelihood -18.45637 F-stabsuc 1 859151
Durtim-Watson stat 2.296320 Prob (F- stabstc) 0.035257 Durbin-Watson stat 2.190604 Prob (F- stabstc) 0 194347
LS// Dependent Variable is LGOECD LSJ/ Dependent Variable is SSOECD
Date: 02120/97 Time: 16:59 Date: 2120197 Time: 17:37
Sample (adjusted): 87 106 Sample (adjusted): 87 106
Included Observatons: 2106 Included Observatons: 14
Excluded Observations: 42 after adjustng endpoints Excuded Observabons: 6 after adjusting endpoints
Vanable Coeffiaent Std. Error t-statisUc Prob. Variable Coefficlent Std. Error t-Statstic Prob.
C 2.122548 4.38056 0.484538 0.6384 C -5.820723 5.733659 -1 015185 0.3365
GNPOECD 1.94E-05 0.000147 0.132112 0.8975 GNPOECD 0.000363 0.000193 1 878906 00930
WAGOECD 0.725754 1.239675 0.585439 0.5712 WAGOECD 1.512013 1.614476 0.936535 03734
DEFOECD 0.311453 0.157719 1.974728 0.0765 DEFOECO 0.164684 0.203088 0.810900 0.4383
POPOECO -2.71E-06 7 07E-06 .0.383127 0.7096 POPOECD -1.17E-05 9.20E-06 -1.275839 0.2340
R-squared 0.46893 Mean dependent var 2.762 R-squared 0.463236 Mean dependent var 3.211429
Adjusted R-squared 022565 S.D. dependent var 1.904405 Adjusted R-squared 0 224675 S.D. dependent var 2.449426
S.E. of regression 1.675823 Akaike info criterion 1 29381 S.E. of regression 2.156783 Akaike ifo criterion 1 809688
Sum squared resid. 28.08381 Schwartz criterion 1.529827 Sum squared resid. 41.86540 Schwarz cntenon 2.037923
Log likelhood -25.98765 F-stabstic 2 01992 Log likelihood -27.53296 F-statistc 1 941790
Durbin-Watson stat 1.938239 Prob (F- stabstc) 0.167436 Durbin-Watson stat 0 866899 Prob (F- statstic) 0187593
OECD.XLSoecd


Policy Research Working Paper Series
ContactTitle Author Date for paper
WPS1787 Trading Arrangements and Diego Puga June 1997 J. NgaineIndustriai Development Anthony J. Venables 37947
WPS1788 An Economic Analysis of Woodfuel Kenneth M. Chomitz June 1997 A. MaranonManagement in the Sahel: The Case Charles Griffiths 39074of Chad
WPS1t789 Competition Law in Bulgaria After Bernard Hoekman June 1997 J. NgaineCentral Planning Simeon Djankov 37947
WPS1790 Interpreting the Coefficient of Barry R. Chiswick June 1997 P. SinghSchooling in the Human Capital 85631Earnings Function
WPS1791 Toward Better Regulation of Private Hemant Shah June 1997 N. JohlPension Funds 38613
WPS1792 Tradeoffs from Hedging: Oil Price Sudhakar Satyanarayan June 1997 E. SomensattoRisk in Ecuador 30128
WPS1793 Wage and Pension Pressure on the Alain de Crombrugghe June 1997 M. JanduPolish Budget 33103
WPS1794 Ownership Structure, Corporate Xiaonian Xu June 1997 J. ChinsenGovernance, and Corporate Yan Wang 34022Performance: The Case of ChineseStock Companies
WPS1795 What Educational Production Lant Pritchett July 1997 S. FallonFunctions Really Show: A Positive Deon Filmer 38009Theory of Education Spending
WPS1796 Cents and Sociability: Household Deepa Narayan July 1997 S. FallonIncome and Social Capital in Rural Lant Pritchett 38009Tanzania
WPS1797 Formal and Informal Regulation Sheoli Pargal July 1997 E. de Castroof Industrial Pollution: Hemamala Hettioe 89121Comparative Evidence from Manjula SinghIndonesia and the United States David Wheeler
WPS1798 Poor Areas, Or Only Poor People? Martin Ravallion July 1997 P. SaderQuentin Wodon 33902
WPS1799 More for the Poor is Less for the Jonath B. Gelbach July 1997 S. FallonPoor: The Politics of Targeting Lant H. Pritchett 38009
WPS1800 Singie-Equation Estimation of the John Baffes August 1997 P. KokilaEquilibrium Real Exchange Rate .brahim A. Elbadawi 33716
Stephen A. O'Connell

Policy Research Working Paper Series
ContactTitle Author Date for paper
WPS1801 Regiorial Integration as Diplomacy Maur.ce Schiff August 1997 J. NgaineL. Alan Winters 37947
WPS 1802 Are There Synergies Between Harrv Huizinga August 1997 P. Sintim-AboagyeWorld Bank Partial Credit 38526Guarantees and Private Lending?
WPS1B03 Fiscal Adjustments in Transition Barbara Fakin August 1997 M. JanduEconomies: Social Transfers and the Alain de Crombrugghe 33103Efficiency of Public Spending: AComparison with OECD Countries
WPS1804 Financial Sector Adjustment Lending: Robert J. Culi August 1997 P. Sintim-AboagyeA Mid-Course Analysis 37644
WPS1805 Regional Economic Integration and Junichi Goto August 1997 G. IlogonAgriculturai Trade 33732