An Integrated Software Platform for GPS/GNSS … · Global Positioning System The Global...
9
Atul Ashok Manke et al. 2016, Volume 4 Issue 5 ISSN (Online): 2348-4098 ISSN (Print): 2395-4752 International Journal of Science, Engineering and Technology An Open Access Journal © 2016 Atul Ashok Manke et al. This is an Open Access article distributed under the terms of the Creative Commons Attribution License (http://creativecommons.org/licenses/by/4.0), which permits unrestricted use, distribution, and reproduction in any medium, provided the original work is properly credited. An Integrated Software Platform for GPS/GNSS Ionospheric Data Analysis 1 Atul Ashok Manke, 2 D. Chakarabarty GPS and GNSS Receivers for Ionospheric applications Global Positioning System The Global Positioning System (GPS) is a space- based satellite navigation system that provides location and time information in all weather conditions, anywhere on or near the Earth where there is an unobstructed line of sight to four or more GPS satellites. The details of the GPS technique is available in [5] and [10]. The basic principle behind the working of GPS can be described geometrically. For a given GPS satellite, the time the signal takes to reach the receiver gives the satellite receiver distance (pseudo range). The point of intersection of spheres, centered at three different satellites with their radii equal to the pseudo range for the respective satellites, gives the three position coordinates of the receiver. As the receivers do not employ atomic clocks, there always remain an uncertainty in time synchronization of the satellite and the receiver which accounts for an unknown error Δt. Thus at least four satellites are required to determine the positions precisely and 24 satellites are required to cover the globe. The whole system consists of three segments as listed below. Space Segment The GPS space segment consists of a constellation of satellites transmitting radio signals to users. GPS satellites fly in medium Earth orbit (MEO) at an altitude of approximately 20,200 km (12,550 miles). Each satellite circles the Earth twice a day. Control Segment It consists of a Master Control Station (MCS) located near Colorado Springs, Colorado which is the central processing facility and is manned at all times. There are five monitor stations (unmanned and remotely controlled from MCS) located in Colorado Springs, Hawaii, Kwajalein, Diego Garcia and Ascension Island, the positions of which are very precisely known. The GPS data is uploaded from these stations to the GPS satellites through the S band link. User Segment It consists of the receivers worldwide specifically designed to receive, decode and process the GPS satellite signals. Physical Research Laboratory, Ahmedabad having two kind of receivers that have already been installed and configured to receive the data round the clock. GPS Receiver @PRL (GSV4004B) GPS Ionospheric Scintillation and TEC Monitor (GISTM) receiver (Model#: GSV4004B) is a product of Abstract The "Software Package for GPS Data Analysis" is a web-based novel GUI application software used for analysis and display of various parameters derived from the data received from GPS(GSV4004B) and GNSS (PolaRxS) receivers as a function of time. The software allows the user to seamlessly combine and compare the Total electron content (TEC) and ionospheric scintillation index (S4) and also other parameters in almost real time and make this available to the registered users. This article elaborates the functioning of the Software and various features available with this software. The software package is designed and developed using various web-utilities like Apache (Web Server), PHP scripts, J-Query, and My-SQL. The software uses MATLAB for plotting the parameters and produces browser compatible output. Keywords: GPS Data Analysis, TEC, Ionospheric Scintillation, MATLAB as CGI script, MySQL, and PHP. 796
Transcript of An Integrated Software Platform for GPS/GNSS … · Global Positioning System The Global...

Atul Ashok Manke et al. 2016, Volume 4 Issue 5 ISSN (Online): 2348-4098 ISSN (Print): 2395-4752
International Journal of Science,Engineering and Technology
An Open Access Journal
© 2016 Atul Ashok Manke et al. This is an Open Access article distributed under the terms of the Creative Commons Attribution License (http://creativecommons.org/licenses/by/4.0), which permits unrestricted use, distribution, and reproduction in any medium, provided the original work is properly credited.
An Integrated Software Platform for GPS/GNSS Ionospheric Data Analysis 1Atul Ashok Manke, 2D. Chakarabarty
GPS and GNSS Receivers for Ionospheric applications
Global Positioning System
The Global Positioning System (GPS) is a space-based satellite navigation system that provides location and time information in all weather conditions, anywhere on or near the Earth where there is an unobstructed line of sight to four or more GPS satellites. The details of the GPS technique is available in [5] and [10].
The basic principle behind the working of GPS can be described geometrically. For a given GPS satellite, the time the signal takes to reach the receiver gives the satellite receiver distance (pseudo range). The point of intersection of spheres, centered at three different satellites with their radii equal to the pseudo range for the respective satellites, gives the three position coordinates of the receiver. As the receivers do not employ atomic clocks, there always remain an uncertainty in time synchronization of the satellite and the receiver which accounts for an unknown error Δt. Thus at least four satellites are required to determine the positions precisely and 24 satellites are required to cover the globe. The whole system consists of three segments as listed below.
Space Segment
The GPS space segment consists of a constellation of satellites transmitting radio signals to users. GPS satellites fly in medium Earth orbit (MEO) at an altitude of approximately 20,200 km (12,550 miles). Each satellite circles the Earth twice a day.
Control Segment
It consists of a Master Control Station (MCS) located near Colorado Springs, Colorado which is the central processing facility and is manned at all times. There are five monitor stations (unmanned and remotely controlled from MCS) located in Colorado Springs, Hawaii, Kwajalein, Diego Garcia and Ascension Island, the positions of which are very precisely known. The GPS data is uploaded from these stations to the GPS satellites through the S band link.
User Segment
It consists of the receivers worldwide specifically designed to receive, decode and process the GPS satellite signals. Physical Research Laboratory, Ahmedabad having two kind of receivers that have already been installed and configured to receive the data round the clock.
GPS Receiver @PRL (GSV4004B)
GPS Ionospheric Scintillation and TEC Monitor (GISTM) receiver (Model#: GSV4004B) is a product of
Abstract
The "Software Package for GPS Data Analysis" is a web-based novel GUI application software used for analysis and display of various parameters derived from the data received from GPS(GSV4004B) and GNSS (PolaRxS) receivers as a function of time. The software allows the user to seamlessly combine and compare the Total electron content (TEC) and ionospheric scintillation index (S4) and also other parameters in almost real time and make this available to the registered users. This article elaborates the functioning of the Software and various features available with this software. The software package is designed and developed using various web-utilities like Apache (Web Server), PHP scripts, J-Query, and My-SQL. The software uses MATLAB for plotting the parameters and produces browser compatible output.
Keywords: GPS Data Analysis, TEC, Ionospheric Scintillation, MATLAB as CGI script, MySQL, and PHP.
796
Atul Ashok Manke et al. International Journal of Science, Engineering and Technology, 2016, Volume 4 Issue 5 ISSN (Online): 2348-4098 , ISSN (Print): 2395-4752
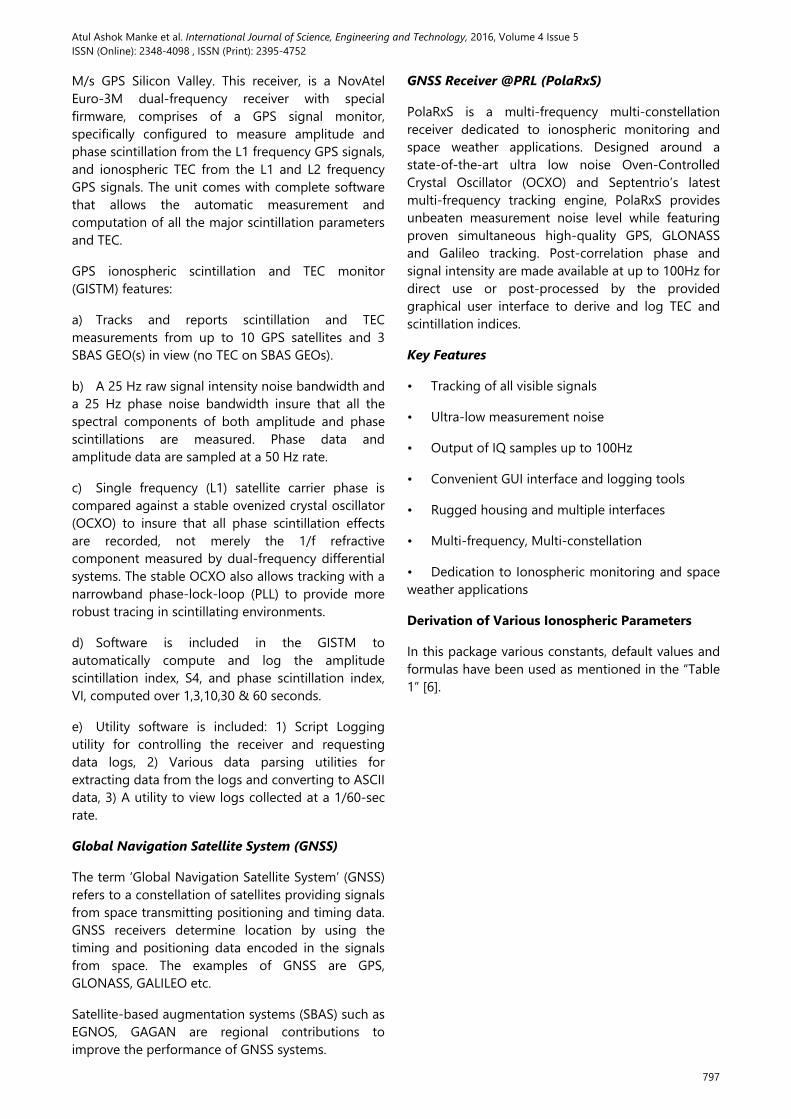
M/s GPS Silicon Valley. This receiver, is a NovAtel Euro-3M dual-frequency receiver with special firmware, comprises of a GPS signal monitor, specifically configured to measure amplitude and phase scintillation from the L1 frequency GPS signals, and ionospheric TEC from the L1 and L2 frequency GPS signals. The unit comes with complete software that allows the automatic measurement and computation of all the major scintillation parameters and TEC.
GPS ionospheric scintillation and TEC monitor (GISTM) features:
a) Tracks and reports scintillation and TEC measurements from up to 10 GPS satellites and 3 SBAS GEO(s) in view (no TEC on SBAS GEOs).
b) A 25 Hz raw signal intensity noise bandwidth and a 25 Hz phase noise bandwidth insure that all the spectral components of both amplitude and phase scintillations are measured. Phase data and amplitude data are sampled at a 50 Hz rate.
c) Single frequency (L1) satellite carrier phase is compared against a stable ovenized crystal oscillator (OCXO) to insure that all phase scintillation effects are recorded, not merely the 1/f refractive component measured by dual-frequency differential systems. The stable OCXO also allows tracking with a narrowband phase-lock-loop (PLL) to provide more robust tracing in scintillating environments.
d) Software is included in the GISTM to automatically compute and log the amplitude scintillation index, S4, and phase scintillation index, VI, computed over 1,3,10,30 & 60 seconds.
e) Utility software is included: 1) Script Logging utility for controlling the receiver and requesting data logs, 2) Various data parsing utilities for extracting data from the logs and converting to ASCII data, 3) A utility to view logs collected at a 1/60-sec rate.
Global Navigation Satellite System (GNSS)
The term ‘Global Navigation Satellite System’ (GNSS) refers to a constellation of satellites providing signals from space transmitting positioning and timing data. GNSS receivers determine location by using the timing and positioning data encoded in the signals from space. The examples of GNSS are GPS, GLONASS, GALILEO etc.
Satellite-based augmentation systems (SBAS) such as EGNOS, GAGAN are regional contributions to improve the performance of GNSS systems.
GNSS Receiver @PRL (PolaRxS)
PolaRxS is a multi-frequency multi-constellation receiver dedicated to ionospheric monitoring and space weather applications. Designed around a state-of-the-art ultra low noise Oven-Controlled Crystal Oscillator (OCXO) and Septentrio’s latest multi-frequency tracking engine, PolaRxS provides unbeaten measurement noise level while featuring proven simultaneous high-quality GPS, GLONASS and Galileo tracking. Post-correlation phase and signal intensity are made available at up to 100Hz for direct use or post-processed by the provided graphical user interface to derive and log TEC and scintillation indices.
Key Features
• Tracking of all visible signals
• Ultra-low measurement noise
• Output of IQ samples up to 100Hz
• Convenient GUI interface and logging tools
• Rugged housing and multiple interfaces
• Multi-frequency, Multi-constellation
• Dedication to Ionospheric monitoring and space weather applications
Derivation of Various Ionospheric Parameters
In this package various constants, default values and formulas have been used as mentioned in the “Table 1” [6].
797

Atul Ashok Manke et al. International Journal of Science, Engineering and Technology, 2016, Volume 4 Issue 5 ISSN (Online): 2348-4098 , ISSN (Print): 2395-4752
Table 1: Equations for deriving Ionospheric parameters
Ionosphere Pierce Point
Considering the uniformly dense and thin shell model of Ionosphere, the point where the line of sight between the GPS satellite and the receiver intersects this shell is known as the Ionospheric Pierce Point (IPP) (Fig.1). Let (φr, ψr) be the latitude and longitude of a reference station, ɑ and Az respectively be the elevation and azimuth angles of a satellite observed from that station. The IPP latitude and longitude are given as:
Φp = arcsin(sinφrcosƐp + cosφrsinƐpcosAz) deg
Ψp = (ψr + arcsin(sinƐpsinAz/ cosΦp)) deg
Where Ɛp is the earth angle subtended by the lines joining the center of the earth with IPP and user location. This is given as:
Ɛp = ɑ + z’. Where z’ is zenith angle at IPP.
Figure 1: Ionospheric Pierce Point(IPP)[4]
Total Electron content
The Total Electron Content (TEC) is the total number of electrons present along a path between a radio transmitter and receiver.
TEC is measured in electrons per square meter. By convention, 1 TEC Unit TECU = 10^16 electrons/m2. Vertical TEC values in Earths ionosphere can range from a few to several hundred TECU.
For a dual frequency GPS receiver, the slant total electron content is calculated as follows.
Where P1 and P2 are pseudo ranges at L1 and L2 respectively and TECCAL represents the bias error correction and is different for different satellite receiver pairs.
Vertical TEC
The STEC depends on the length of the signal's path through the ionosphere and is consequently dependent on the satellite elevation. To correct for this effect, an estimation of the Vertical TEC (VTEC) above a given point on the Earth surface is necessary.
To determine this, the Single Thin Layer Model is usually employed (Fig.2). This model assumes that all the free electrons are concentrated in a layer of infinitesimal thickness located at the altitude H.
The VTEC is estimated at each Ionospheric Pierce Point (IPP) from the ionospheric mapping function MFI as in the figure (Fig. 2).
Figure 1 STEC vs VTEC[3]
MF1(z) = STEC/VTEC = 1/cos(z’)
With sin(z’) =(RE / (RE + H)) sin (z),
RE and H being the radius of earth and the height of ionospheric layer above the surface of the earth.
798
Atul Ashok Manke et al. International Journal of Science, Engineering and Technology, 2016, Volume 4 Issue 5 ISSN (Online): 2348-4098 , ISSN (Print): 2395-4752
The Vertical TEC (VTEC) is obtained by taking the projection from the slant to vertical using the thin shell model assuming a height of 350 km, following
the technique given by [Klobuchar, 1986].
Re = 6378km, hmax = 350km and θ = satellite elevation angle at the ground station. The derivation of VTEC from STEC is described in details in [2], [6], [7], and [8].
Scintillation Index
Ionospheric scintillation is the rapid modification of radio waves caused by small scale structures in the ionosphere. Severe scintillation conditions can prevent a GPS receiver from locking on to the signal and can make it impossible to calculate a position. Less severe scintillation conditions can reduce the accuracy and the confidence of positioning results.
Scintillation is usually quantified by two indexes: S4 for amplitude scintillation and σφ for phase scintillation. S4 represents the amplitude scintillation index calculated as
Where, I is the intensity of the received signal.
Necessity for a suitable software application:
There are two different receivers in our lab with associate Personal Computers (PC). Data logger programs (supplied with the instruments) get executed continuously in respective PCs. These programs generate data files which can be used further for required calculation and plotting. Both instruments have different mechanisms for file creation and data storing. In existing situation, if we want to perform some calculation and analysis with certain data, we need to adopt following approach each time.
a. Based on the date requirement, we have to identify the folder name and file name as per convention provided in the manuals.
b. In (GSA400b) the file needs to be converted into ASCII format for further use. The converted file contains the column header row as first record. This row needs to be removed before used for calculation. Sometime extra rows may also be deleted unknowingly.
c. In (PolaRxS) one file contains only one-hour data. So, for a complete day, all one hour files need to be merged into single file for further use.
In order to analyze the GPS data for a specific date and time range, prerequisite knowledge of corresponding GPS week number (GPS_WN) and Time of Week (TOW) is mandatory It is very difficult to make analysis if we are interested in data belonging to different date & time range. We may need to read multiple files and find the required range of GPS_WN and TOW within the files so that a new merged file may be created for further use.
Once the required data file has been created, we use MATLAB program to read the file, perform calculation and plot the results using various available options.
The newly designed software package has been developed to overcome the above mentioned issues with a user friendly, secure, and web-based interface.
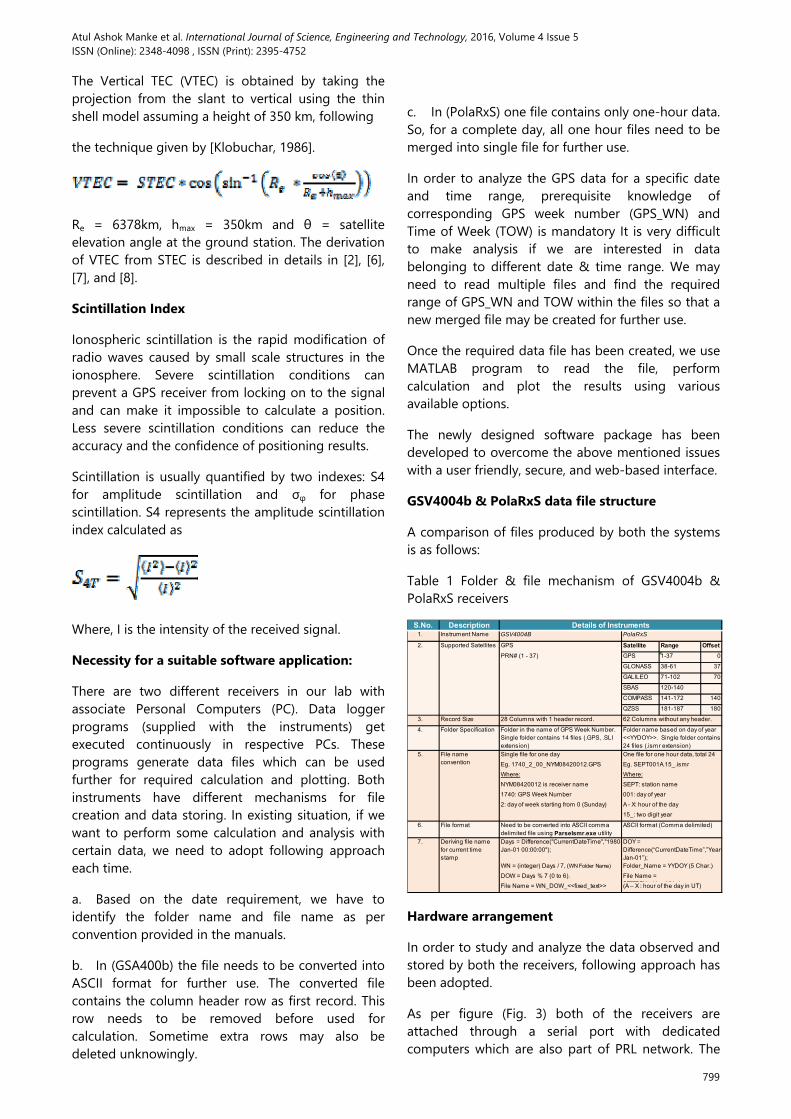
GSV4004b & PolaRxS data file structure
A comparison of files produced by both the systems is as follows:
Table 1 Folder & file mechanism of GSV4004b & PolaRxS receivers
S.No. Description1. Instrument Name GSV4004B
GPS Satellite Range Offset
PRN# (1 - 37) GPS 1-37 0
GLONASS 38-61 37
GALILEO 71-102 70
SBAS 120-140
COMPASS 141-172 140
QZSS 181-187 180
3. Record Size 28 Columns with 1 header record.
4. Folder Specification Folder in the name of GPS Week Number. Single folder contains 14 files (.GPS, .SLI extension)
Single file for one day
Eg. 1740_2_00_NYM08420012.GPS
Where:
NYM08420012 is receiver name
1740: GPS Week Number
2: day of week starting from 0 (Sunday)
6. File format Need to be converted into ASCII comma delimited file using ParseIsmr.exe utility
Days = Difference("CurrentDateTime","1980-Jan-01 00:00:00");
WN = (integer) Days / 7, (WN Folder Name)
DOW = Days % 7 (0 to 6).
File Name = WN_DOW_<<fixed_text>>
ASCII format (Comma delimited)
7. Deriving file name for current time stamp
DOY = Difference(“CurrentDateTime”,”Year-Jan-01”);Folder_Name = YYDOY (5 Char.)
File Name = SEPTDOY H YY i(A – X : hour of the day in UT)
5. File name convention
One file for one hour data, total 24 fil f dEg. SEPT001A.15_.ismr
Where:
SEPT: station name
001: day of year
A - X: hour of the day
15_: two digit year
Details of InstrumentsPolaRxS
2. Supported Satellites
62 Columns without any header.
Folder name based on day of year <<YYDOY>>. Single folder contains 24 files (.ismr extension)
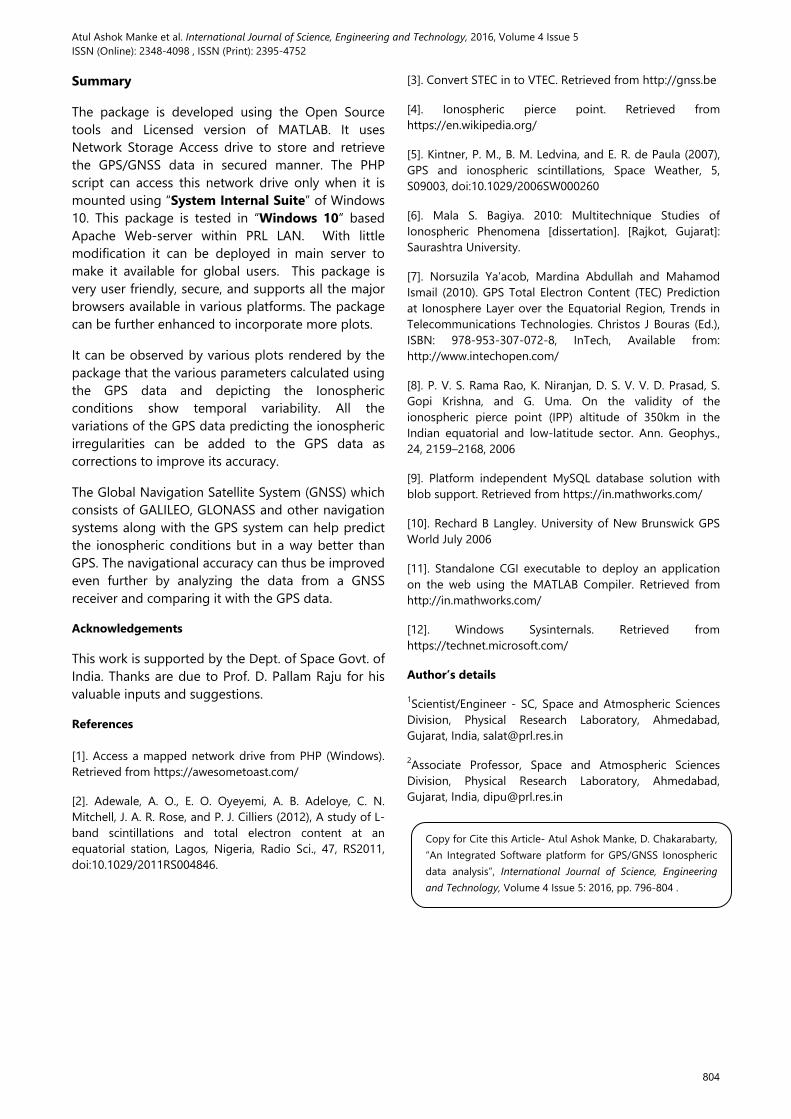
Hardware arrangement
In order to study and analyze the data observed and stored by both the receivers, following approach has been adopted.
As per figure (Fig. 3) both of the receivers are attached through a serial port with dedicated computers which are also part of PRL network. The
799

Atul Ashok Manke et al. International Journal of Science, Engineering and Technology, 2016, Volume 4 Issue 5 ISSN (Online): 2348-4098 , ISSN (Print): 2395-4752
scripts supplied along with instruments get executed and generate data files in respective computers. We made a provision to store the data in common network drive so that the access to the data is possible securely within the local network. Apart from this, a web-server is configured in such a manner that it can host the software package and also access the network drive and store the required information within database tables. All registered users within the PRL network can access and use the Software.
Figure 2: Hardware arrangement for GPS Data analysis
Various features of the software
The new package is designed and developed using open source tools "XAMPP for windows" for Web interface and MATLAB (as CGI script) for plotting various parameter values.
Main features of newly designed system are as under:
The web portal is only accessible within PRL LAN and from Internet using OpenVPN configured for PRL. The URL is http://nprl656/GPS_Analysis/. The system is secure and has Login based entry using figure (Fig. 4). One has to register him/herself in order to use the system. Every user is identified by a unique "userid".
Figure 3 Login Form
When new user tries to register into the system, he/she has to provide a valid e-mail id. An email from the web-administrator will be sent to the new user with an activation link in the mail content. The user's password is stored in encrypted form in the database which cannot be recovered at any cost. New password can be generated automatically and communicated through e-mail, on user's request through forgot password link. User can change the password any time which again will be stored in encrypted form in the database table. By default, the "User Type" of new user is "General".
We have converted a high capacity USB hard disk into a Network Storage drive by attaching it into M/s Addonics, USA make NAS 4.0 adapter and created a shared folder in the disk. This shared folder is accessible within PRL LAN for authenticated users only. Further, we have created two sub-folders in the name of both the receiver's short name.
We have mapped this sub-folder as "Z" drive in the respective computers associated with both the receivers. The main folder is mapped in Web Server's computer as "Z" drive. In order to provide read/write access to the "Z" drive within the PHP script the drive was mapped using “Sysinternal utility of Windows” [1] and [12].
There exist two separate data logger utility programs with configuration files for both the receiver which stores the GPS/GNSS data in "Z" drive as per configuration. Now we are in the position to read data files within PRL LAN with proper access permission.
In the web server, there are two separate PHP scripts that are executed every hour as scheduled task, for retrieving hourly data available in "Z" drive for both the receiver. The algorithms of both the scripts are different because both the receivers stored the observed data in the disk in different ways. "PolaRxS" creates 24 files in a day while
800

Atul Ashok Manke et al. International Journal of Science, Engineering and Technology, 2016, Volume 4 Issue 5 ISSN (Online): 2348-4098 , ISSN (Print): 2395-4752
"GSV4004B" creates single file in a day. In “PolaRxS”, the script reads new file every hour and update the database table, but in “GSV4004B” same file is read by the script every hour, therefore a provision has been made in the script so that only new entries from the same file may be updated into the database table.
The PHP script uses the “LOAD DATA INFILE” command of MySQL to read the corresponding ASCII file from the “Z” drive and store the data into TB_SEPT_NEW table in very high speed. The trigger associated with this table filtered each new row for L1LockTime and L2LockTime (more than 240 seconds) and calculate the value for all the parameters and store the results in “TB_GPS_RESULTS” table. The calculations are also performed as per section 2. A log of all major activities is also stored in the respective table.
After successful login in the system an interactive web interface is appeared (Fig. 5) in which user has to make selection as per his/her interest. This interface is divided into three frames i.e. Top, Left and Right frame. Top frame is fixed frame and it contains four option i.e. "Data Availability", "Change Password", "Contact us", and "Logout". Left frame contains a form with few editable controls. The contents of Right frame get changed dynamically based on the action performed either in left or in top frame.
Figure 4 Selection form with Details of PolaRxS
Based on the selection made by user, there exists two kind of actions available for the users either to view the resultant Plots or to request for raw data according to selection criteria. The content of right frame is updated according to the user activity performed in the left frame.
If the user’s choice is to plot the results, then the user will have to set the criteria for required data within the web-form and send the request to the web server. While selecting the dates, we impose a limitation of selecting maximum two consecutive
dates only. The user's request will be passed on to the web server as AJAX call (without refreshing the page). The web server then executes the MATLAB program as CGI script [11]. The MATLAB program reads the value of the environment variable "QUERY_STRING", parses it and creates a structure having field name corresponding to the name of form field and the value of field equal to the value of form field as string. The value of this structure fields then passes to a stored procedure within the MATLAB program itself. The stored procedure returns the result set against the selection criteria. This result set contains all the predefined parameters as columns and their values as rows. This whole result set is then passed on to another MATLAB program which creates the selected plots and converts them into image files and returns an array containing the full file path of image files. In order to send any information in HTML format from MATLAB program, "fprintf(arg1, arg2)" function is used with first argument equal to 1 and second argument as HTML formatted string. In this way the right frame gets updated with resultant plots as per figure (Fig 6).
Figure 5 Resultant plots as a function of time.
We have used “queryMySQL” database solution [9] for interacting with MySQL database within MATLAB program.
Some of parameters represented as plots via this package are as under:
(a) Vertical Total Electron Content, Average TEC, and TEC rate.
(b) S4 Correction for all available signals.
(c) Elevation, Latitude & Longitude
801

Atul Ashok Manke et al. International Journal of Science, Engineering and Technology, 2016, Volume 4 Issue 5 ISSN (Online): 2348-4098 , ISSN (Print): 2395-4752
If the user is a general user, and chooses for requesting some GPS/GNSS data, then a new text area control will get appended in the left frame's form field as per figure (Fig 7) in which user can write his/her comments. After clicking on "Request Data" button a new record will be inserted in the TB_GPS_ACTIVITY_LOG table with a new unique order id in a specific format as “REQ_Order_yyyymmddhhmmss" and “Order Status" as "Pending" along with the selected values of all the form fields. Further, an email will be delivered to user (Fig. 8) as well as administrative user (Fig. 9) regarding this request. If administrative user logs in and looks for pending request, then a combo field populated with all the pending requests appears on the left frame as per figure (Fig. 10). Once the administrative user selects any request the remaining fields get updated with selection made by user who generated the request. Now if administrator clicks on "Order Data" button a client request will be raised as an AJAX call which in turn, makes a call to a PHP script for obtaining the requested data. This PHP script will try to locate the corresponding data files in the "Z" drive and read the data and insert all the records in TB_GPS_FTP table. Once this task gets completed, then another PHP script gets executed in background which perform select operation on TB_GPS_FTP table using "Select <field_list> into outfile <out_put_file_name> from <table_name> where <condition>" command. This script will create a new sub-folder in the name of OrderID in the web server and create new data files for each day within that sub-folder. After file creation a "zip" file will be created and finally an e-mail will be delivered to concern user with the above "zip" file as attachment as per figure (Fig. 11). This will complete the whole order process.
Figure 6 Order form for requesting required data
Figure 7 Order request email (System generated)
Figure 8 Email response against order placed
Figure 9 Data Order screen
802

Atul Ashok Manke et al. International Journal of Science, Engineering and Technology, 2016, Volume 4 Issue 5 ISSN (Online): 2348-4098 , ISSN (Print): 2395-4752
Figure 10 Delivery of Ordered data via Email
Plotting of required parameters as a function of Time. We are representing our plots in two different ways. Main features of plots we are generating and displaying in the website are as follows:
a) Most of the plots represent parameter values against various PRN/SVID numbers distinctly as a function of time. Since there are almost 150 PRN/SVID numbers all together, legend in tabular format with custom colour codes and labels are placed in plots wherever required.
b) In one type of plot categorisation is based on satellite group i.e. GPS, GLONASS, GALILEO etc. which means all PRN/SVID number belongs to GPS satellites will have same color.
c) Time and date are displayed under X-axis.
This software package also includes a facility called "Data availability Calendar" with link to see few resultant plots for specific day as per figure (Fig. 12). This page shows the month-wise calendar for a year. Each day of the month gets converted to a hyperlink if there exists any data in the database table for that day, otherwise it will be shown as plain text.
Figure 11 Data Availability Calendar
Database Objects
The package also contains few database objects including stored procedures, triggers, views, and tables to store the required information in structured and normalized form as per Table 3. The details of these database objects are as under:
Table 2 Database objects used in the package
S. No. Database Object Description/Purpose Primary Key
1. TB_GPS_INSTRUMENTS
This table is used to store the information about both the receivers including the IP address of respective PCs. INSTRUMENTID
2. TB_GPS_SATELLITESThis table stores the information regarding various supported satellites with their PRN/SVID range, offset etc.
SAT_ID
3. TB_SEPT_NEW (Trigger : TR_RESULT)
This table is used for temporary storage of data. It's structure is designed in such a manner that data from both type of receivers can be stored with some additional information. A database trigger is associated with this table to calculate the required parameter using formulas given in table #. And store the results in TB_GPS_RESULTS table. The table remains empty.
INSTRUMENTID, GPS_WN,TOW, SVID
4. TB_GPS_RESULT
This table contains the calculated values for all the required parameter as columns. The data from this table is used for plotting various plots.
INSTRUMENTID, GPS_WN,TOW,SVID
5. TB_GPS_ACTIVITY_LOG
This table contains the information regarding activity performed by user, like (plotting, ordering/requesting data). It also contains the information about selection criteria made by the user along with client IP address.
ORDERID
6. TB_GPS_FTP
This is a temporary table similar to structure of Data Files. This is used for generating new Data files and associated with Ordering/Requesting data activity.
INSTRUMENTID, GPS_WN,TOW, SVID
7. TB_GPS_LOG
This table contains the log of data uploaded through the respective receivers PC. Its information can be used to determine any missing data also.
8. TB_GPS_USERSThis table contains the details of registered Users who can use the portal for their requirement.
USEREMAIL,USERID
9. VI_LOG_CAL This view is used for displaying Data Availability Calendar.
10. SP_GPS_DATA
This store procedure is called if user requests for plotting data. The user selection is passed as input argument to this procedure and it applies the criteria and get the relevant data from TB_GPS_RESULT table. The output records are used for plotting
803
Atul Ashok Manke et al. International Journal of Science, Engineering and Technology, 2016, Volume 4 Issue 5 ISSN (Online): 2348-4098 , ISSN (Print): 2395-4752
Summary
The package is developed using the Open Source tools and Licensed version of MATLAB. It uses Network Storage Access drive to store and retrieve the GPS/GNSS data in secured manner. The PHP script can access this network drive only when it is mounted using “System Internal Suite” of Windows 10. This package is tested in “Windows 10” based Apache Web-server within PRL LAN. With little modification it can be deployed in main server to make it available for global users. This package is very user friendly, secure, and supports all the major browsers available in various platforms. The package can be further enhanced to incorporate more plots.
It can be observed by various plots rendered by the package that the various parameters calculated using the GPS data and depicting the Ionospheric conditions show temporal variability. All the variations of the GPS data predicting the ionospheric irregularities can be added to the GPS data as corrections to improve its accuracy.
The Global Navigation Satellite System (GNSS) which consists of GALILEO, GLONASS and other navigation systems along with the GPS system can help predict the ionospheric conditions but in a way better than GPS. The navigational accuracy can thus be improved even further by analyzing the data from a GNSS receiver and comparing it with the GPS data.
Acknowledgements
This work is supported by the Dept. of Space Govt. of India. Thanks are due to Prof. D. Pallam Raju for his valuable inputs and suggestions.
References [1]. Access a mapped network drive from PHP (Windows). Retrieved from https://awesometoast.com/
[2]. Adewale, A. O., E. O. Oyeyemi, A. B. Adeloye, C. N. Mitchell, J. A. R. Rose, and P. J. Cilliers (2012), A study of L-band scintillations and total electron content at an equatorial station, Lagos, Nigeria, Radio Sci., 47, RS2011, doi:10.1029/2011RS004846.
[3]. Convert STEC in to VTEC. Retrieved from http://gnss.be
[4]. Ionospheric pierce point. Retrieved from https://en.wikipedia.org/
[5]. Kintner, P. M., B. M. Ledvina, and E. R. de Paula (2007), GPS and ionospheric scintillations, Space Weather, 5, S09003, doi:10.1029/2006SW000260
[6]. Mala S. Bagiya. 2010: Multitechnique Studies of Ionospheric Phenomena [dissertation]. [Rajkot, Gujarat]: Saurashtra University.
[7]. Norsuzila Ya’acob, Mardina Abdullah and Mahamod Ismail (2010). GPS Total Electron Content (TEC) Prediction at Ionosphere Layer over the Equatorial Region, Trends in Telecommunications Technologies. Christos J Bouras (Ed.), ISBN: 978-953-307-072-8, InTech, Available from: http://www.intechopen.com/
[8]. P. V. S. Rama Rao, K. Niranjan, D. S. V. V. D. Prasad, S. Gopi Krishna, and G. Uma. On the validity of the ionospheric pierce point (IPP) altitude of 350km in the Indian equatorial and low-latitude sector. Ann. Geophys., 24, 2159–2168, 2006
[9]. Platform independent MySQL database solution with blob support. Retrieved from https://in.mathworks.com/
[10]. Rechard B Langley. University of New Brunswick GPS World July 2006
[11]. Standalone CGI executable to deploy an application on the web using the MATLAB Compiler. Retrieved from http://in.mathworks.com/
[12]. Windows Sysinternals. Retrieved from https://technet.microsoft.com/
Author’s details 1Scientist/Engineer - SC, Space and Atmospheric Sciences Division, Physical Research Laboratory, Ahmedabad, Gujarat, India, [email protected] 2Associate Professor, Space and Atmospheric Sciences Division, Physical Research Laboratory, Ahmedabad, Gujarat, India, [email protected]
Copy for Cite this Article- Atul Ashok Manke, D. Chakarabarty, “An Integrated Software platform for GPS/GNSS Ionospheric data analysis”, International Journal of Science, Engineering and Technology, Volume 4 Issue 5: 2016, pp. 796-804 .
804