An integrated remote sensing-GIS approach for the analysis ...
42
ORE Open Research Exeter TITLE An integrated remote sensing-GIS approach for the analysis of an open pit in the Carrara marble district, Italy: slope stability assessment through kinematic and numerical methods AUTHORS Francioni, M; Salvini, R; Stead, D; et al. JOURNAL Computers and Geotechnics DEPOSITED IN ORE 29 February 2016 This version available at http://hdl.handle.net/10871/20283 COPYRIGHT AND REUSE Open Research Exeter makes this work available in accordance with publisher policies. A NOTE ON VERSIONS The version presented here may differ from the published version. If citing, you are advised to consult the published version for pagination, volume/issue and date of publication
Transcript of An integrated remote sensing-GIS approach for the analysis ...

ORE Open Research Exeter
TITLE
An integrated remote sensing-GIS approach for the analysis of an open pit in the Carrara marbledistrict, Italy: slope stability assessment through kinematic and numerical methods
AUTHORS
Francioni, M; Salvini, R; Stead, D; et al.
JOURNAL
Computers and Geotechnics
DEPOSITED IN ORE
29 February 2016
This version available at
http://hdl.handle.net/10871/20283
COPYRIGHT AND REUSE
Open Research Exeter makes this work available in accordance with publisher policies.
A NOTE ON VERSIONS
The version presented here may differ from the published version. If citing, you are advised to consult the published version for pagination, volume/issue and date ofpublication

An integrated remote sensing-GIS approach for the analysis of an open 1
pit in the Carrara marble district, Italy: slope stability assessment 2
through kinematic and numerical methods 3
4
Authors: Francioni, M. (a); Salvini, R. (b); Stead, D. (a); Giovannini, R. (b); Riccucci, S. (b); Vanneschi, 5
C. (b); Gullì, D. (c). 6
7
(a) Department of Earth Sciences, Simon Fraser University, Burnaby, BC, Canada. 8
(b) Department of Environment, Earth and Physical Sciences and Centre of Geotechnologies, University 9
of Siena, San Giovanni Valdarno, AR, Italy. 10
(c) Regione Toscana - Operative Unit of Mining Engineering (U.O.I.M.) AUSL 1 Carrara,Tuscany, Italy 11
12
Corresponding author: Francioni, M. Department of Earth Sciences, Simon Fraser University, Burnaby, 13
BC, Canada, 8888 University Drive, Burnaby, B.C., Canada, V5A 1S6. E-mail: [email protected]. Phone: 14
778-782-7288 15
16
Abstract 17
18
Over the last decade, terrestrial laser scanning and digital terrestrial photogrammetry techniques have 19
been increasingly used in the geometrical characterization of rock slopes. These techniques provide 20
innovative remote sensing tools which overcome the frequent problem of rock slope inaccessibility. 21
Comprehensive datasets characterizing the structural geological setting and geometry of the slopes can be 22
obtained. The derived information is very useful in rock slope investigations and finds application in a 23
wide variety of geotechnical and mine operations. In this research an integrated remote sensing – GIS 24
approach is proposed for the deterministic kinematic characterization of the Lorano open pit in the Apuan 25
Alps of Italy. Based on the results of geomatic and engineering geological surveys, additional 26
geomechanical analysis using a 3D finite difference method will be presented in order to provide a better 27
understanding of the role of stress-induced damage on slope performance. 28
29
Keywords: Unmanned aerial vehicle; terrestrial laser scanning; GIS, deterministic kinematic analysis, 3D 30
finite difference method; stress-induced damage. 31
32
33

1. Introduction 34
35
Surface mining represents a major important economic activity for many countries worldwide. With the 36
high number of people working in the mining industry, safety in the workplace has become an over-riding 37
priority. In this context, the use of new technologies to study and monitor mining and quarrying areas can 38
play a very important role in risk assessment and management. 39
This paper, developed within the framework of the Italian National Research Project PRIN2009, provides 40
a new approach for the study of open pit quarry slopes based on the integrated use of remote sensing 41
techniques for deterministic stability analyses using combined simple kinematic analysis techniques and 42
three dimensional Finite Difference Method (FDM) stress models. The research describes the case study 43
of the Lorano open pit, characterized by a buttress- shaped remnant from previous excavation activities. 44
The quarry is located in the Carrara district of the Apuan Alps (Italy) which is the most active marble 45
quarrying region in Europe. Here several quarry walls reach hundreds of meters in height and are 46
dominated by natural slopes with very complex morphology. In such an environmental context 47
conventional structural and engineering geological surveys can only be executed at the foot of the slope; 48
therefore, the data obtained from these surveys often provides an incomplete knowledge of the area. An 49
alternative approach would be to have surveys carried out by technicians who are trained in rope access 50
climbing on high rock slopes. There are however limitations and technical difficulties in the 51
implementation of such rope access survey methods, including the close proximity to the quarry wall 52
which compromises visibility and the ability to recognize large-scale geological features, as well as the 53
unavailability of suitable cartographic maps. For these reasons, the use of remote sensing techniques has 54
the potential to significantly increase the information on the geometry and the structural geological setting 55
of quarry slopes. 56
In this research, two different remote sensing techniques have been used to complement the data obtained 57
from traditional engineering geological surveys. The remote sensing methods used included Terrestrial 58
Laser Scanning (TLS) and Unmanned Aerial Vehicle (UAV) based Digital Terrestrial Photogrammetry 59
(DTP). Several authors have demonstrated the use of TLS and DTP in the study of rock slopes and the 60
advantages that these techniques offer in the structural geological and kinematic analysis of rock slopes 61
[30], [3], [38], [20], [79], [50], [31], [54], [77], [78], [69], [71]. Although UAV technology has been 62
increasingly used in the last few years there remain few published references related to the study of rock 63
slopes [42], [60], [22]. 64
Information gained from these remote sensing techniques was used in this case study for analysing the 65
open pit and overhanging quarry slopes. Two different analyses were carried out; the first, a kinematic 66
analysis to examine the most probable slope failure mechanism and the second a FDM study focused on 67

understanding the stress distribution within the slope. The kinematic analysis was performed using an 68
integrated remote sensing – Geographic Information System (GIS) approach. 69
This allowed for a deterministic kinematic analysis based on the geometry of the slope and joint sets. 70
Based on a similar concept, different approaches were used by Brideau et al. [13] and Salvini and 71
Francioni [70]. Brideau et al. [13] compared the wedge intersection vector orientations with the 72
topographic surfaces from a DSM to understand the influence of three-dimensional topography on slope 73
stability analysis. Salvini and Francioni [70] carried out a form of “kinematic back-analysis” using the 74
joint attitudes to identify the areas on the slope that could be affected by future failures. 75
The FDM analysis was carried out using a simplified 3D model derived from TLS and topographic map 76
at scale of 1:2,000 and focused on characterisation of the rock slope stress distribution. It is known from 77
literature how stress-induced damage due to excavation can be a frequent problem in mining and 78
quarrying and the presence of such stress-induced fractures was observed in the study area in this and 79
previous studies [18], [52] and [17]. These newly generated excavation stress-induced brittle fractures 80
may be an important consideration in the stability of an area and their study could decrease the risk of 81
failure and increase the quality of marble in future extraction works. The principal aim of this study was 82
to understand the stress-induced damage caused by the in-situ stress acting in the area and/or the 83
excavation processes. Several authors have studied the relationship between the acting in-situ stresses, the 84
excavation process and brittle fracturing in excavation areas, particularly in underground mining [14], 85
[15], [28], [29], [16]. In this research the ItascaTM
FLAC3D code [49], was used for modelling of 86
excavation induced stress in the quarry slopes. 87
88
2. The Lorano open pit case study 89
90
The Lorano open pit is located in the Carrara district where marble quarrying is the most important 91
economic activity. Marble extraction in this area has a long history dating back to the Roman Empire (VI 92
– II B.C). Today the Carrara district is the most important marble mining area in Europe with more than 93
100 active quarries and a production of around 1,000,000 tons/year of blocks and aggregated gravels [18]. 94
Geologically, the Apuan Alps belong to the Northern Apennines and are a compressional fold-thrust belt 95
formed during the Oligocene due to the collision between the Corsica-Sardinia microplate and the Italian 96
peninsula [4], [52], [17]. 97
Evidence for two main tectonic phases can be found in this area. During the first so-called D1 phase (late 98
Oligocene-very early Miocene), there was compression associated with under-thrusting of the Adriatic 99
plate, and deposition following the North-East direction of the Tuscan Nappe and the Ligurids non-100
metamorphic units. In these conditions, limestone, dated at 180 My, was metamorphosed to marble. 101

Related to this event, is the formation of the metamorphic foliation (S1) that represents the axial plane of 102
sheath folds (from microscopic to kilometre scale) that characterize the major part of the Apuan Alps. The 103
general S1 direction is relatively constant from N 130o E to N 160
o E. This metamorphic foliation 104
represents a direction of weakness in the marble in the Carrara district and, although it is not a true open 105
discontinuity set, it can have an important control on the nucleation and propagation of brittle fracturing 106
[18], [52] and [17]. During the second phase (D2), which started in the early Miocene, compression 107
continued so that all the structures that had developed during D1 were re-folded into complex, antiformal 108
stack geometry with the presence of parasitic folds. Subsequently, compression ended during the last 109
stages of the D2 phase and brittle rather than ductile tectonics occurred. This step was characterised by 110
open and kink folds and normal extension faults with low and high dips. This extensional phase caused 111
stretching, denudation and uplift phenomena, bringing higher and lower structures to the same level. In 112
this context, the Apuan Alps now represent a wide tectonic window within the thickened Apennine Nappe 113
[17]. 114
The Lorano open pit is located in the normal limb of the “Pianza Anticline”, between the “Carrara 115
syncline” in the South-West, and the “Vallini syncline” in the North-East. The open pit is characterized 116
by a rock buttress shape, a remnant of previous excavation activities left to ensure the stability of the rock 117
slope to the rear. The marble buttress is accessible from three sides and is approximately 150 m high and 118
between 30 to 50 m wide (Figure 1). In the study area there are two different types of marble outcrops: 119
the “Ordinario marble”, that characterizes the buttress, and the “Venato marble” a natural outcrop 120
occurring on the mountain slope above. 121

122
Figure 1. Perspective view of the study area: Lorano open pit walls characterized by the rock buttress 123
shape (the scale is indicative only); inset map shows the location of the study area. 124
125
3. Geomatic and engineering geological surveys 126
127
Most of the open pit walls in the study area are hundreds of meters high and are dominated by natural 128
slopes with very complex morphology which can be a source of danger for workers below. In such an 129
environment, engineering geological surveys are traditionally executed only in accessible areas at the foot 130
of the slope. The data obtained from these surveys fails to provide complete information of the entire 131
slope as required for deterministic slope analysis. 132
Quarry wall inspections are conducted once a year by rope access climbers but are often constrained by 133
technical difficulties, low visibility compromising the recognition of large-scale geological features, and 134
high cost. Remote sensing techniques can provide an excellent alternative and TLS and DTP in particular 135
are being increasingly used in the study of such areas. Using these techniques it is possible to obtain very 136
detailed information on the structural geological setting and slope geometry, even in the case of 137
inaccessible steep slopes. The integrated use of DTP and TLS for the study of the buttress and the 138
overhanging slope will be shown in this paper. Special emphasis will be given to the use of UAV for the 139
DTP survey. 140
141
3.1 Unmanned Aerial Vehicle for photogrammetric surveys 142
143
Digital terrestrial photogrammetry is a remote sensing technique in which the geometric properties of 144
objects are determined by the measurement of photographic images. DTP is used in many different fields, 145
including topographic mapping, architecture, engineering, and, more recently, engineering geology [67], 146
[44], [76], [33], [34]. Slama [73], Linder [56], and Kraus [53] provide further details on the theory of this 147
technique. 148
Given that pseudo-perpendicular directions of acquisition are necessary owing to the height and steepness 149
of the slopes; traditional remote sensing techniques such as aerial photogrammetry are generally not 150
suitable. The authors have previously discussed the advantages and disadvantages of using different 151
methodologies for photogrammetric data acquisition depending on the slope morphology and the 152
accessibility of rock faces [77], [78], [33], [34]. In this case, considering the elevation and the complex 153
geometry of the buttress (Figure 1), an UAV was used to acquire high spatial resolution images. The 154
survey was carried out by mounting a stabilized digital camera Sony NEX-5N onto a Falcon 8 (Asctec 155
Gmbh) vehicle (Figure 2A and B). The physical CCD frame size of the cameras is 23.5 x 15.6 mm, while 156
the resolution is 16.1 Megapixels. 157
Based on a flight plan, photographs were automatically taken in order to cover the whole site acquiring 158
vertical strips of images with a minimum 70% overlap and 30% sidelap. Auto-positioning of the UAV 159
was controlled by the integrated inertial measurement unit. Due to the complex morphology of the area 160
and the buttress shape, three different lines-of-sight were used during the photogrammetric survey. Figure 161
2C shows the orthophoto of the whole open pit and highlights the three different lines-of-sight. 162
163

164
Figure 2. UAV survey: the Falcon 8 with stabilized digital camera Sony NEX-5N (A), vehicle during the 165
flight on the right (B) and orthophoto of the open pit with the three different lines-of-sight used during the 166
photogrammetric survey (C). 167
168
Based on the sensor format, horizontal and vertical fields of view varied with the distance from the walls; 169
Table 1 shows the image size of the utilized camera. 170
Image size (pixel) Image size (mm)
Width 3935 333.2
Height 2620 221.8
Table 1. Photogrammetric image size (300 dpi). 171
172
With the objective of obtaining very precise output, 91 natural Ground Control Points (GCP) were 173
measured on the buttress walls using a LeicaTM
TCRP 1203+R1000 reflectorless Total Station. The GCPs 174
are points with known coordinates that must be recognizable on the photographs to facilitate their exterior 175
orientation process (procedure used to define the camera position, rotation and its line-of-sight at the 176
instant of the exposure [73], [56], [53]) that was executed by means of the Leica Photogrammetric Suite 177
(LPS) module of the ERDASTM
IMAGINE software. The Root Mean Square Error (RMSE) in image and 178
ground units (respectively pixel and cm) obtained for each strip during the absolute orientation process is 179
shown in Table 2. 180
181
182
183

Line-of-sight
(degrees to North)
RMSE
(image unit, pixel)
RMSE
(ground unit, mm)
1 (270) 2.3 33
2 (330) 4.7 48
3 (50) 2.7 35
Table 2. Line-of-sight, image and ground RMSE. 184
185
3.2 Terrestrial laser scanning 186
187
In addition to DTP, terrestrial laser scanning was used to provide additional geometric information about 188
the buttress and to validate the data obtained from the photogrammetric survey. TLS is a survey technique 189
for rapidly obtaining the geometry of objects with high precision. Several types of laser scanner currently 190
exist with different measurement principles and technical specifications [7], [37]. In this paper, a RieglTM
191
Z420i laser scanner was used for the survey. This instrument uses time-of-flight technology to determine 192
distances to an object at a maximum distance of about 1 km. 193
Considering the geometry of the buttress, three point clouds were acquired to limit the occlusions in the 194
output data; the slope scanning resolution was set to 0.07 m at a distance of 300 m. Sturzenegger and 195
Stead [78] and Francioni et al. [34] discussed the complexity of aligning several point clouds in the same 196
reference system through the registration process. The integrated use of Total Station (TS), differential 197
GPS (Global Positioning System) can be adopted to overcome problems related to the registration 198
process. In this case study 15 High-Definition Surveying (HDS) targets were used in the TLS data 199
acquisition whose absolute coordinates were acquired by a TS topographic survey. The targets were 200
automatically recognized by the LeicaTM
Cyclone software (used also in the TLS data post-processing) so 201
that the registration could be easily computed by assigning them absolute coordinates. The topographic 202
survey played an important role in the registration process and will be described in more detail in the 203
following section. 204
205
3.3 Topographic survey 206
207
The topographic survey was carried out by means of the LeicaTM
TCRP 1203+R1000 reflectorless Total 208
Station and two geodetic Leica™ 1200 GPS receivers. They were essential for the acquisition of the HDS 209
targets and GCPs for photogrammetry. During the TS survey, the intersection method was used to relate 210
all the measurements to a unique reference system. Using this technique it was possible to locate the TS 211
in different positions (suitable for the acquisition of HDS targets and GCPs) and to relate all the 212
measurements to the first station (called “Master Station”). The use of the TS and the intersection 213
methods are explained in detail in Francioni et al. [36] and Francioni et al. [34]. 214

The GPS survey was used to determine the absolute coordinates of all the points measured with the TS; to 215
accomplish this, a GPS receiver was set up in the same position as the Master Station and the absolute 216
coordinate of the latter determined. Subsequently, a second GPS receiver was utilized to obtain the zero-217
Azimuth for the TS and, finally, the absolute coordinates of all the measured points determined. The 218
differential GPS surveys were performed in static modality with an acquisition time of up to 3 hours. The 219
coordinates of the points acquired with this technique were corrected by post-processing procedures using 220
contemporary data recorded by two permanent GPS stations (Lucca and Borgo a Mozzano). The 221
orthometric heights of the Master and the zero-Azimuth stations were also calculated in collaboration 222
with the Italian Military Geographical Institute. 223
224
3.4 Engineering geological survey 225
226
In order to provide more information about the structural geological setting of the slope and the 227
characteristics of the rock mass and joint surfaces, an engineering geological survey was carried out. Due 228
to the inaccessibility of the area, it was possible to carry out the scan lines only at the toe of the slope 229
(Figure 3). Seven scan lines were performed and more than 100 surfaces measured. Of these, only 77 230
were then used for the definition of the main joint sets. The remain surfaces were identified as brittle 231
fractures and, due to their different origin, irregular shape and unreliability in their measurement, they 232
were not considered in the definition of the main joint sets. Data from scan lines was used for the 233
characterization of rock mass according to the Bieniawski Rock Mass Rating (RMR, 1989) method. The 234
RMR system is a rock mass quality classification developed by the South African Council for Scientific 235
and Industrial Research [8] and subsequently updated in 1989 [78]. The Geological Strength Index (GSI) 236
was also estimated based on the rock mass structure and the rock discontinuity surface condition. This 237
method, used widely by the scientific community after its introduction [45], is not intended as a rock mass 238
classification, but rather to reflect the rock mass quality. The GSI value was then applied to estimate the 239
rock mass parameters in the Hoek-Brown strength criterion. The application and limitations of the GSI for 240
underground openings and rock slopes were recently reviewed by Marinos et al. [57] and Hoek and 241
Diederichs [47]. 242
243

244
Figure 3. Orthophoto of the open pit with scan lines 245
246
4 Data processing and deliverables 247
248
In this case study the UAV system, by limiting blind spots, played a very important role in the acquisition 249
of the photographs of the whole study area. The exterior orientation of the photographs was obtained 250
through the use of the 91 GCPs measured by the topographic survey. After the exterior orientation 251
process, a stereographic model of the buttress was built and used for the stereo-interpretation of structural 252
geological features including joint attitude, spacing and trace length. These features were stereo-restituted 253
using the Stereo Analyst module of ERDASTM
IMAGINE; the joint attitude was represented in the 254
stereoscopic model by triangles drawn co-planar with the discontinuities, while the spacing and trace 255
length were shown using 3D lines. Figure 4A shows stereographic representation of the discontinuities 256
measured on the slope using DTP. The three TLS point clouds acquired during the survey were registered 257
using the HDS targets and allowed the construction of a unique 3D model of the buttress. As mentioned 258
above, using the topographic surveys and the intersection method it was possible to align GCPs and HDS 259
targets in the same reference system with an estimated error of approximately 5 mm. In this way, the 260
stereoscopic model from DTP and the TLS 3D model were integrated and used for the construction of a 261
detailed full 3D model with high resolution orthophotos of the buttress (Figure 5). 262
The DTP approach provides a high level of data interpretability during the stereo-restitution but can be 263
prone to human error. For this reason, the attitude of the discontinuity surfaces and slopes was also 264
extracted from the TLS point clouds using the LeicaTM
Cyclone software through a semi-automatic 265
procedure. In practice, several points (at least three) representing the surface under investigation must be 266
selected on the point cloud; the software automatically recreates the surface and determines the attitude of 267

its pole. Figure 4B shows the stereographic representation of the discontinuities measured on the slope 268
using TLS. 269
270
Figure 4. Stereographic representation of measurements obtained from DTP (A) and TLS (B). 271
272

273
Figure 5. Integration of TLS and UAV photogrammetric data in the construction of the 3D model with 274
aligned orthophotos of the buttress. 275
276
All the measurements obtained from TLS and DTP were then integrated in a final stereographic 277
representation and the joint sets determined (Figure 6 and Table 3). K1, K2 and K3 represent the three 278
main joint systems surveyed with these techniques and S1 represent the structures associated with the 279
metamorphic foliation S1 which characterizes the Apuan Alps (see section 2). Table 3 also shows the 280
measurements of spacing and trace length carried out using the remote sensing data. However, due to the 281
difficulty in defining the trace length in the photogrammetric model (especially when the joint spacing is 282
small as often is the case in the Carrara marble district) and to fact that these parameters were required 283
in the following analyses, these measurements should be considered as a preliminary approximate 284
estimation only. 285
286
287

288
Figure 6. Integration of measurements obtained from TLS and DTP. 289
290
Joint set Dip
(deg)
Dip Direction
(deg)
Trace length
(m)
Spacing
(m)
K1 88 150 10 to 30 1 to 3
K2 54 077 10 to 30 1 to 3
K3 87 243 10 to 30 1 to 3
S1 52 235 2 to 20 1 to 10
Table 3. Data obtained from DTP and TLS. 291 292
Conventional engineering geological survey was necessary to assess the accuracy of the joint sets present 293
at the toe of the slope and to physically and mechanically characterise the discontinuities according to the 294
RMR method. Data obtained from this survey is provided in Figure 7 and Table 4; the results gained from 295

the rock mass rating show a good quality rock mass with an RMR value equal to 76. However, Figure 7 296
and Table 4 also show that the joint set distribution at the toe of the slope was slightly different to that 297
determined from DTP and TLS. Therefore, data in Table 4 may not be fully representative of all the joint 298
sets illustrated in Table 3 since they refer to different locations within the study area. In fact, GSI values 299
also vary within engineered areas (i.e. open pit) compared to the natural rock outcrops (i.e. the above 300
slope). For this reason and considering in detail the characteristics of the marble the GSI was estimated to 301
vary between 50 and 60 in the natural slope and between 70 and 80 in the open pit face. This is probably 302
due to the degree of weathering of the natural slope surface and to the fact that the joint spacing usually 303
increases with depth. 304
305
Figure 7. Stereographic representation of measurements determined from the conventional engineering 306
geological survey. 307

308
Joint set K1 K2 K3
Dip/Dip Dir 90o/332
o 71
o/080
o 84
o/059
o
Spacing (m) 1 1 1.5
Trace length (m) 10 to 20 10 to 20 10 to 20
Aperture (mm) 14 9 11
Infill Absent Absent Absent
Weathering Slight Slight Slight
JRC 4 9 5
JCS (MPa) 98 78 83
Water Medium inflow Absent Medium inflow
Table 4. Data obtained from the conventional engineering geological survey (mean values). 309
310
During both the remote sensing and engineering geological surveys, brittle (stress-induced) fractures were 311
identified (Figure 8). It is possible to differentiate these structures from pre-existing discontinuities based 312
on their irregular shape and the lower trace length. These characteristics can make their mapping 313
sometimes challenging with a higher degree of uncertainty and, for this reason the measurements related 314
to the stress-induced fractures were kept separate from those associated with joint sets. 315

316
Figure 8. Stress-induced damage noted in the marble buttress during the engineering geological and 317
photogrammetric surveys. 318
319
5 GIS and kinematic stability analyses 320
321
The kinematic slope stability analysis examines the potential for rock slope failures such as planar, 322
wedge, and toppling due to the presence of unfavourably oriented discontinuities. The analysis considers 323
the relative attitude of the discontinuities and the slope plus the effective friction angle along the joint 324
surfaces. Stereographic projections for the kinematic analysis of these simple failure modes are described 325
in Richards et al. [64] and Hoek and Bray [46]. Various widths of toppling envelope have been proposed 326
by Goodman and Bray [40], Cruden [21], Goodman [39], and Maurenbrecher and Hack [58]. 327
The results of this analysis are strongly influenced by the topography, as already documented by Brideau 328
et al. [13] who proposed the use of software such as Matterocking [50], which compares the wedge 329
intersection vector orientations with the topographic surfaces. 330

In this research, an integrated remote sensing – GIS analysis approach was proposed to overcome the 331
problem of complex geometry. GIS techniques have been used by several authors for slope stability 332
analysis [82], [81], [84], [85], [23], [6], since they provide various functions for capturing, inputting, 333
manipulating, transferring, visualizing, combining, querying, analysing, modelling, and outputting of the 334
geospatial data. The advent of new survey techniques (such as those used in this research) makes this 335
technique even more attractive because they allow a wider range of data to be analysed. In this research 336
the 3D model and the topographic map at scale of 1:2,000, gained from the TLS, were used in the 337
construction of a simplified Digital Surface Model (DSM) of the pit slope. 338
Starting from the DSM, a GIS spatial analysis was performed to highlight the dip direction of the slope 339
faces (Figure 9A). Different colours in Figure 10A represent slopes characterized by varying dip 340
direction. Based on the orientation of the slope faces and using the geo-structural data derived from the 341
geomatic and engineering geological surveys, it was possible to perform a kinematic GIS analysis of 342
slope stability. For each slope face, the steepest safe angle was calculated using the stereographic 343
projection of Dips 6.0 software [66]. The knowledge of the steepest safe angle is very useful for 344
understanding the maximum angle that a slope can be quarried at before subject to potential failures due 345
to interaction with discontinuities. This information was integrated with the steepness of the slope in 346
order to ascertain which areas may be affected by failure. Consequently, a further GIS spatial analysis 347
was carried out and the slope steepness calculated (Figure 9B). In this way, all the necessary information 348
was available to understand where failure mechanisms could occur. A supplementary spatial analysis was 349
carried out to combine the steepest safe angle with the slope steepness in order to further refine the 350
results. The friction angle was assumed to be 32o (with 5° of standard deviation) for all the joint systems 351
based on the published literature, [19], [62], [63], [32]. Figure 11 shows the results highlighting the 352
stereographic representation of main joint sets used for the analysis (Figure 10A) and the areas that could 353
be affected by planar (Figure 10B), wedge (Figure 10C), and direct toppling failures (Figure 10D). 354
355

356
Figure 9. Dip direction of slope faces (A) and slope steepness (B) calculated with GIS spatial analysis. 357
358
359
Figure 10. Results of the deterministic kinematic stability analysis: Stereographic representation of joint 360
sets shown in Table 3 (A); areas potentially affected by planar failure (B); areas potentially affected by 361
wedge failure (C); areas potentially affected by direct toppling (D). 362

Maps shown in Figures 10B and 10C highlight a strong similarity due to an important assumption in 363
RocscienceTM
[66] software regarding “pure” planar sliding on a single plane; in fact, in these types of 364
analyses, the occurrence of release planes, such as lateral joints, or tension cracks is assumed to allow 365
planar sliding. These planes are not explicitly involved in the conventional kinematic analysis for planar 366
sliding, but it is important to be aware that a release mechanism must normally exist to allow removal of a 367
block from the slope. This means that planar sliding can be considered as a special case of wedge failure 368
where sliding takes place on only one plane, and other planes act as release planes. It should be noted that 369
the foliation S1 was included in the analysis even if it is not a true open discontinuity set. This was 370
undertaken to reflect the fact that the S1 foliation represents a direction of weakness in the rock mass 371
which can have an important control on the dilation, nucleation and propagation of brittle fractures [18], 372
[52] and [17]. This phenomenon is visible in the upper right of Figure 8 where low angle fractures (with 373
irregular shape and direction similar to S1) seem to connect the high angle discontinuities that 374
characterize the buttress face. For this reason, the authorities decided to leave in place wider benches at 375
the base of the buttress with the aim to increase the overall stability and avoid the propagation of new 376
generated fractures between system discontinuities. 377
378
6 Three dimensional stress analyses using the finite difference method, FLAC3D 379
380
DTP, TLS and the engineering geological surveys provide fundamental data for an improved 381
understanding of the structural geological setting of the area. Using these methods it was possible to 382
analyse whether the fractures on the slope were related to the complex geological history of the area 383
and/or to the recent excavation activity. In fact, the progress of the excavation can cause the formation of 384
new brittle fractures due to the unloading stress. Their existence in the Carrara marble district (called 385
“forzature” by the local technicians) has been the cause not only of damage within the extracted blocks 386
and slabs, but also of several rock fall events as documented by several authors; see e.g. [17] and [18]. 387
In this research, the FLAC3D code [49] was used to analyse the stress distribution of the slope using the 388
Finite Difference Method. Although FLAC is a continuum numerical modelling approach and is not 389
appropriate to model a large number of fractures, selected discontinuities with simple intersections can be 390
discretely included as interfaces [55]. Numerous authors have described the use of FLAC for the analysis 391
of rock slopes and open pits [11], [43], [68]. 392
393
6.1 Stress distribution using the induced lithostatic stress 394
In this study, RhinocerosTM
SR4 software [59] was used with the aim of creating a 3D model closely 395
approximating the true geometry of the slope. TLS point clouds were processed to build the 3D model 396

and then exported into Kubrix software [49] to prepare for simulation using FLAC 3D [49]. Figure 11A-397
D shows the 3D model created by RhinocerosTM
SR4 and Kubrix. Figure 11A shows the initial geometry 398
used to calculate the initial stress distribution. Figure 11B shows the reconstruction of the topography 399
before the marble excavation. Figure 11C and D show the geometry of the buttress and the “history 400
points” (points of interest) respectively; the latter were located at different elevations on the marble 401
buttress and interrogated during the excavation progress. 402
403
404
Figure 11. 3D model of the marble quarry and buttress created in RhinocerosTM
SR4 and Kubrix: Initial 405
model (A), topography pre (B) and post (C) excavation and history points located in the buttress (D). 406
407
The marble was modelled as an elastic material with a unit weight of 27 KN/m3 with joints not considered 408
at this stage. The isotropic elastic and material option, in FLAC3D, provides the simplest representation 409

of material behaviour and is valid for homogeneous, isotropic, and continuous material that exhibits linear 410
stress-strain behaviour. 411
This decision was made after a careful examination of the literature and that, given the strength of the 412
marble rock mass and the limited depth of the quarry, little yield should occur under compressive stresses. 413
Moreover, this decision was also taken in agreement with the studies carried out by Wiles [83]. Wiles, 414
after a long discussion on the use and reliability of simple versus complex constitutive criteria noted that 415
the use of an elasto-plastic model makes the calibration of the model extremely difficult due the 416
uncertainty of the additional parameters required, (E, V and density vs E,v. Density, intact cohesion, 417
intact friction, dilation, rock mass cohesion, rock mass friction). In essence at this stage in our models we 418
have focused on location of stress concentrations, not yielding of these stresses. The latter would have 419
necessitated the assumptions inherent in scale-dependent downgrading of the rock properties and hence 420
possibly obscured the results. Wiles suggests, for making stress predictions, the use of an accurate 421
geometry and simple model (Homogeneous, elastic modelling is the best option since the only significant 422
parameter that must be specified is the far-field stress state). Table 5 shows the rock properties used in 423
this first simulation (called “Analysis 1”). 424
425
Parameters - Analysis 1 Value
Unit weight (KN/m3) 27
Deformation modulus (GPa) 48
Poisson’s ratio 0.27
Shear modulus (GPa) 19
Bulk modulus (GPa) 34
Table 5. Rock material parameters used in Analysis 1 426
427
Since the elevation of the model was approximately 440 meters, the lithostatic vertical stress σz (or σv) 428
was estimated to be almost 12 MPa at the base of the model. This value was gradually decreased from the 429
bottom to the top so that to be zero at the surface of the initial model. The K values, Kx and Ky in this 430
preliminary analysis were assumed to be equal to 0.4 (Equations 1 and 2). 431
432
Kx = σx/ σz Equation 1 433
Ky = σy/ σz Equation 2 434
435
The deformation modulus was calculated using the GSI value and RocData 4.0 software (RocscienceTM 436
2014 and Hoek & Diederichs, 2006), while the Shear and Bulk moduli were calculated from equations 3 437
and 4: 438

439
G = E/2(1+ν) Equation 3 440
K = E/3(1-2ν) Equation 4 441
442
where G is Shear modulus, K the Bulk modulus and ν the Poisson’s ratio. 443
444
The FLAC 3D code allowed the analysis of the stress distribution in the X, Y, and Z directions. Figure 12 445
shows the simulated stress distributions obtained in Analysis 1 in the X (Figure 12B), Y (Figure 12C), 446
and Z (Figure 12D) directions respectively. 447
448
449

Figure 12. FLAC3D models for Analysis 1 showing the simulated stress distribution and magnitude; 450
legend showing stress magnitude in MPa (A), stress distribution in XX direction (B), YY direction (C), 451
and ZZ direction (D). 452
453
The stress values change from negative to positive indicating compressive and tensile stresses 454
respectively. When positive values are present, the stress conditions are in tension and consequently, new 455
fractures may be created, due to the unloading stress. Figure 12 shows positive tensile stress in the 456
buttress with values in the X direction greater than in the Y direction. Figure 13 illustrates the stress state 457
in the X and Y directions as measured at the history points (the x-axis represents the number of 458
calculation steps in the analysis and the y-axis the value of stress in MPa). 459
460
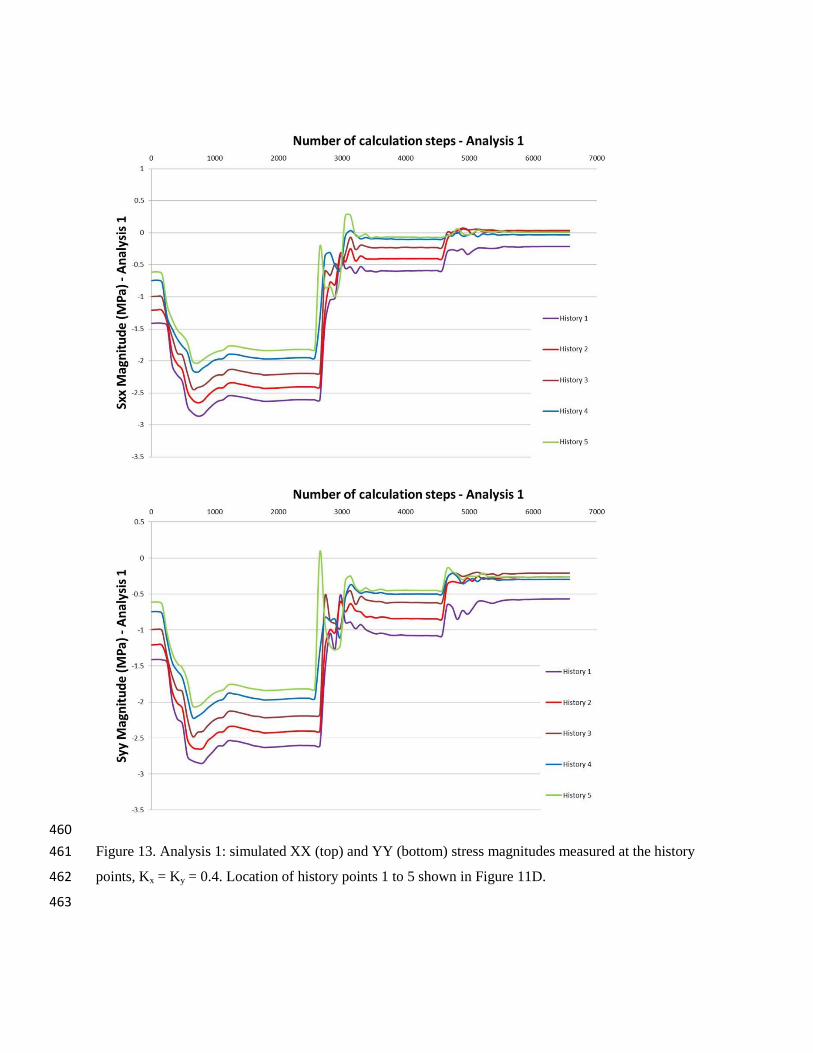
Figure 13. Analysis 1: simulated XX (top) and YY (bottom) stress magnitudes measured at the history 461
points, Kx = Ky = 0.4. Location of history points 1 to 5 shown in Figure 11D. 462
463

The graphs show how the X-stresses (SXX) reach positive values at history points number 2, 3 and 5 (up 464
to 0.04 MPa at the history point 2) and how they have very low negative values (compressive) at history 465
points 1 and 4. Moreover, all the history points show that Y-stresses (SYY) are very low and close to 466
positive values but that tensile stresses are not observed. It is important to note that, owing to the lack of 467
field in-situ stress measurements these results assume an initial Kx=Ky value of 0.4 and do not take into 468
account probable tectonic in-situ stresses; the results consequently show relative stress changes with 469
excavation only and not the true absolute values. 470
In order to understand how the assumed in-situ stress ratio may influence the results of the study, further 471
analyses were carried using different Kx, Ky values and stress tensors. The software WinTensor 4.0.4 [23] 472
was used for this purpose. 473
474
6.2 Stress distribution analysis based on palaeostress tensor calculation and assumed K value 475
476
The main palaeostress tensor acting in the study area was estimated by the software WinTensor 4.0.4 477
using a stress inversion technique based on fault and joint measurements. The inversion is based on the 478
assumption that slip on a plane occurs in the direction of the maximum resolved shear stress [18]. The 479
data used for this process are the strike and dip of the fault planes, the orientation of the slip line and the 480
sense of movement on the fault planes (which can be determined from grooves or slickensides). Data is 481
inverted to obtain the characteristic parameters of the reduced palaeostress tensor according to Angelier 482
and Mechler [5] and Delvaux [24]. The derived parameters refer to the attitude of the three principal 483
stress axes σ1, σ2, σ3 (where σ1 > σ2 > σ3) and to the stress ratio R (Equation 5) which expresses the 484
magnitude of the intermediate principal stress, σ2 relative to the magnitude of the major and minor 485
principal stresses σ1 and σ3 respectively. Some examples of the use of this software in the study of stress 486
fields in different parts of the world are given in [59], [26], [24], [25], [76]. 487
488
R = (σ2 - σ3) / (σ1 - σ3) with 0 < R < 1 Equation 5 489
490
The analysis in WinTensor 4.0.4 was based on 20 measurements of kinematic indicators found on two 491
different sides of the buttress and indicated two extensional regimes (σ1 = σv) with two different stress 492
tensors (Table 6). From the geological evidence visible in the area and in accordance with Bigazzi et al. 493
[10], Carmignani and Kligfield [17] and Ottria and Molli [61], it is suggested that these two stress tensors 494
are related to two different tectonic stages (so-called “D2S1” and “D2S2”) within the D2 tectonic phase. 495
During the older stage (D2S1), strike-slip and extensional movements with a general East-West 496
orientation took place at the same time (stress tensor 1 in Table 6). During the subsequent D2S2 further 497

tectonic denudation and unloading changed the deformation style toward a multi-directional extension 498
which was probably North-South directed within the study area (stress tensor 2 in Table 6). 499
500
Stress
Tensors R Type
1 0.5 Pure Extensional
(nearly E-W orientation)
2 0.5 Pure Extensional
(nearly N-S orientation)
Table 6. Stress tensors determined from analysis using WinTensor 4.0.4 501
502
Based on these results, two further FDM analyses (Analysis 2 and 3) were carried out simulating the latest 503
extensional regime (North-South directed). As the Y axis corresponds, in this case, to the North-South 504
direction, σy was set as the minor principal stress (σ3) to reproduce the North-South directed extensional 505
regime. The same lithostatic vertical stress σv, adopted in Analysis 1, was used and the Kx and Ky values 506
were assumed as 0.6 and 0.4 respectively for Analysis 2 and 0.8 and 0.4 for Analysis 3. 507
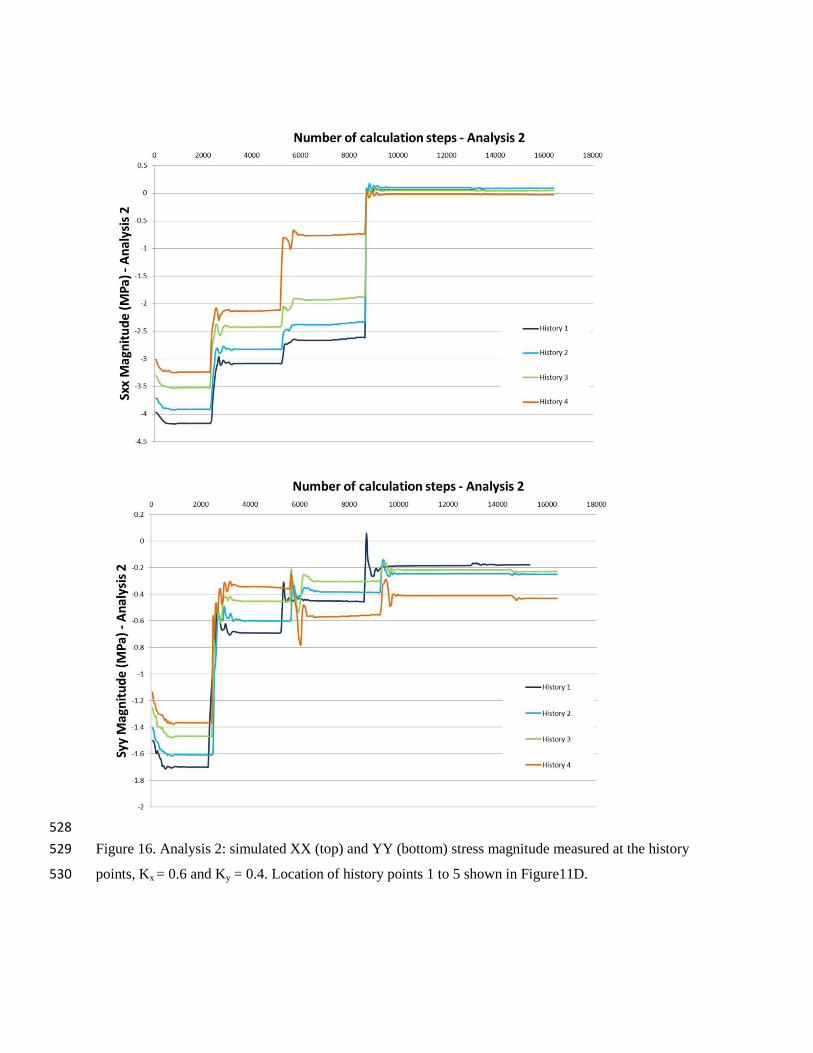
Figures 14 and 15 show the results in terms of the simulated stress distribution in the X and Y directions 508
for Analysis 2 (Kx = 0.6 and Ky = 0.4) and Analysis 3 (Kx = 0.8 and Ky = 0.4). Figures 16 and 17 show the 509
simulated magnitude of stress values in Analysis 2 and 3 respectively at the same history points as used in 510
Analysis 1. The two simulations confirm that positive (tensile) stress values can be reached in the buttress 511
in the X direction (history points 2, 3, 4 and 5 for both Analysis 2 and 3). This agrees with field 512
observations of the presence of visible stress-induced damage in the marble buttress noted during the 513
engineering geological and photogrammetric surveys (Figure 8). Moreover, in these two analyses the 514
magnitude of the tensile stresses are greater than obtained in Analysis 1(up to 0.15 MPa for the history 515
point 2 in the analysis 2 and up to 0.2MPa for the same history point in Analysis 3). 516
517

518
Figure 14: FLAC3D models for Analysis 2 showing the simulated stress distribution and magnitude; SXX 519
stress distribution in X direction (left) and SYY stress distribution in Y direction (right), Kx = 0.6 and Ky 520
= 0.4. Units of stress in MPa. 521
522
523
Figure 15: FLAC3D models for Analysis 3 showing the simulated stress distribution and magnitude; SXX 524
stress distribution in X direction (left) and SYY stress distribution in Y direction (right), Kx = 0.8 and Ky 525
= 0.4. Units of stress in MPa. 526
527
528
Figure 16. Analysis 2: simulated XX (top) and YY (bottom) stress magnitude measured at the history 529
points, Kx = 0.6 and Ky = 0.4. Location of history points 1 to 5 shown in Figure11D. 530

531
Figure 17. Analysis 3: simulated XX (top) and YY (bottom) stress magnitude measured at the history 532
points, Kx = 0.8 and Ky = 0.4. Location of history points 1 to 5 shown in Figure11D. 533
534
535
536

7 Discussion 537
538
This research demonstrates how an integrated remote sensing - GIS approach can improve the overall 539
understanding and the quality of data available for rock slope stability analysis. Recently, several DTP 540
techniques have been used by various authors to demonstrate their potential advantages in conducting 541
surveys in high and complex geometry rock slopes. Sturzenegger and Stead (2009a and b) showed how, 542
with the use of a tripod and long range focal length camera lenses, it is possible to calculate the joint 543
attitude with accuracies similar to those obtained from TLS. However, in case of complex rock slope 544
geometry and where problems of inaccessibility are encountered, this system tends to leave shadow 545
(occluded) areas in the output. Firpo et al. [33] and Francioni et al. [34] showed how the use of an 546
aerostatic balloon can solve problems related to the complexity of the slope, however, the inaccessibility 547
of the area facing the object under study can be an insurmountable problem. Salvini et al. [69] and [71], 548
clearly illustrated how the use of a helicopter can overcome the above mentioned problems. The use of 549
helicopter systems can be both complicated and expensive and the orientation of the photographs less 550
precise when compared to conventional terrestrial methods of survey. 551
In this context, the advent of UAV systems represents a very important innovation for remote sensing 552
techniques since it provides a very powerful and flexible tool for the acquisition of high resolution 553
photographs. Moreover, they are remotely controlled, thus avoiding the need of a crew and their cost is 554
highly variable and dependent on the specific site requirements. The use of UAV technology in the earth 555
sciences and more specifically in engineering geology has been documented in the literature [42], [60]. In 556
this research the survey was executed using a vehicle that can work in an autonomous manner or be 557
managed from the ground by remote control. Using this vehicle, it was possible to survey both the open 558
pit surface, which is characterized by a very steep geometry, and an overhanging slope which has a 559
complex morphology. All the photographs acquired by the UAV were oriented through the integrated use 560
of TS and differential GPS surveys. This procedure provides a very powerful approach for increasing 561
precision and accuracy of the photograph orientation and TLS registration procedures. The errors 562
obtained during the exterior orientation of photographs, shown in Table 2, are considered acceptable 563
given the survey distance and the complexity of the slope morphology. In fact, in spite of the accuracy 564
obtained in the measurement of GCP by topographic survey, the UAV is a light and remotely controlled 565
vehicle which can be prone to vibrations and instability phenomena during photograph acquisition. These 566
problems can result in misalignment of photographs and significant errors during their orientation. 567
Recently, the acquisition of a large number of photographs and the use of powerful software including 568
image matching algorithms for the orientation process and the creation of DSM and orthophotos (see 569
AgisoftTM
Photoscan Professional [1]) has been shown to decrease these errors. However, if the attitude of 570

the UAV is properly controlled, the orientation of photographs permits the creation of accurate 571
stereoscopic models and the stereo-restitution and measurement of geological features such as joint 572
attitude, spacing, and trace length. 573
TLS was used in this research to obtain a very high resolution 3D model of the slope and to validate the 574
results obtained from the stereo-restitution. Three different point clouds were acquired to avoid occlusions 575
at the rock slope face and subsequently registered to a unique model thanks to the topographic survey. 576
The maximum error estimated during the registration process was approximately 5 mm which is 577
considered to be acceptable. Joint sets derived from DTP and TLS were compared (Figure 5) and show a 578
good agreement in terms of both mean dip and dip directions. 579
To complement the geomatic surveys, engineering geological surveys were carried out to provide 580
supplementary information on the physical-mechanical characteristics of the joints and the rock mass. 581
Data obtained from these surveys was used in the characterization of rock mass according to the 582
Bieniawski RMR method and for estimation of the GSI. The values of RMR and GSI made it possible to 583
classify the rock mass as “good” in accordance with previous studies [63]. It must be highlighted that the 584
engineering geological survey permitted the definition of the joint sets recognizable at the base of the 585
open pit only and, consequently it is possible to observe some differences between the values obtained 586
from DTP and TLS. 587
In addition, a kinematic analysis was carried out in order to analyse the stability of the buttress and the 588
overhanging natural slope. Considering the quality and the amount of data available from the above 589
mentioned surveys, this analysis was performed using a deterministic approach. The study area was 590
subdivided into different zones based on a spatial analysis carried out by GIS techniques. The results 591
obtained from this analysis are in agreement with previous studies carried out in the area by geologists 592
and professional hand scaling personnel and with the mitigation work previously carried on the slope 593
[63]. 594
The last component of this research was a FDM analysis of the stress distribution in the buttress broadly 595
representative of its geological history and recent excavation stages. It is known from literature how 596
stress-induced damage due to excavation is a frequent problem in mining and quarrying activities and, as 597
mentioned previously, the presence of such stress-induced fractures was found in the study area. These 598
newly generated stress-induced brittle fractures may be an important consideration in the stability of an 599
area and their study could decrease the risk of failure and increase the quality of marble in future 600
extraction works. For this reason, with the aim of improving knowledge of the stress distribution in the 601
marble buttress, FDM analyses were carried out using FLAC 3D. An initial analysis (Analysis 1) was 602
performed using the induced lithostatic stress and Kx and Ky values both equal to 0.4. The simulation 603

results showed positive tensile stresses in certain positions on the buttress. Numerous researchers have 604
recently noted the role of tensile damage on rock slopes [28], [14], [15], [74] [75]. 605
It is important to emphasise that the concentration of tensile stresses may be increased if high in-situ 606
tectonic stresses are present. Since in-situ measurements regarding actual tectonic in-situ stress are not 607
available, it was decided to use the WinTensor software in an attempt to investigate the most probable 608
main stress tensors in the area. The study of palaeostress carried out with the WinTensor software helps to 609
understand how structures influenced the geological history of the area (e.g. based on the Anderson’s 610
classification – Anderson, [2]). It should be emphasised however the direction of palaeostress does not 611
necessarily coincide with the current stress tensor acting today. Nevertheless, recent studies carried out in 612
the Carrara marble district have confirmed that in this area there is a good correspondence between 613
palaeostress data gained with WinTensor and the stress acting today [61], [48] [41], [31]. 614
The analysis described in this paper has highlighted the presence of two main stress tensors: the first East-615
West directed and the second North-South. This result agrees with the theory that two different tectonic 616
stages (D2S1 and D2S2) took place within the D2 phase [10], [17], [61]. Two further FDM analyses was 617
then carried out (Analysis 2 and 3) simulating the most recent extensional regime (North-South directed) 618
and using Kx and Ky values equal to 0.6 and 0.4 for the Analysis 2 and to 0.8 and 0.4 for the Analysis 3 619
respectively. From the results of the FLAC3D simulation, it was possible to show how a relatively small 620
change in in situ stress ratio, K, modifies the spatial stress distribution. In fact, when comparing the 621
results of Analysis 1, 2 and 3, it is notable how in Analyses 2 and 3 the stress values measured in the X 622
direction at history points 2, 3, 5 and 5 attain positive (tensile) values and how these values increase going 623
from Analysis 1 to 3. This agrees with field observations of the presence of visible stress-induced damage 624
in the marble buttress noted during the engineering geological and photogrammetric surveys. 625
It should be emphasised that the WinTensor analysis is based on only 20 measurements due to the 626
difficulty in finding more slickenside kinematic indicators within the area (due to erosion and 627
inaccessibility). For this reason and because of the major importance that direct measurement of stress can 628
have on future slope analyses, it is clear that the described WinTensor stress study represents a first 629
preliminary stage in improving the understanding of the in-situ stress acting in the area and that further in-630
situ measurements would be necessary to better clarify stress response and induced damage within the 631
marble buttress. 632
633
8. Conclusions 634
635
In this research an integrated remote sensing - GIS approach was used to improve the overall 636
understanding and the quality of data available for the analysis of the Lorano open pit. The methodology 637
described overcomes a frequent problem related to the inaccessibility of rock slopes, owing to their 638
height, which can lead to erroneous evaluations of stability. DTP and TLS are shown to provide powerful 639
modelling and analytical tools in the study of the geometry of the slope. DTP was carried out through the 640
use of a UAV system. This technique overcomes problems related to elevation, steepness and complex 641
geometry of slope; it is less expensive than other photogrammetric techniques showed in previous 642
research such as aerostatic balloons and helicopters and with a good flight plan photogrammetric 643
acquisition of areas can be obtained that would be impossible to survey with any other vehicle or 644
methodology. TLS was performed using a long range laser scanner (up to 1 Km range) with three 645
different point clouds acquired to avoid occlusions. The TLS model was overlapped with the 646
photogrammetric model to create a high resolution 3D model useful in the definition of the main 647
geological features and in the development of the 3D slope model to be used in subsequent kinematic and 648
numerical analysis. 649
Kinematic analysis was carried out using GIS techniques. Using developed thematic maps, different 650
kinematic analyses were performed according to the varying slope geometries so as to determine the 651
steepest safe angles. As a result, this approach was able to overcome the common problem of complex 652
slope geometry encountered in kinematic slope analyses. 653
Finally, a FDM analysis of the stress distribution in the buttress was performed to verify the possibility of 654
tensile stress generation after the excavation phase. A study of palaeostress was carried out with the 655
WinTensor software to understand how structures influenced the geological history of the area. Based on 656
this study, a sensitivity analysis using different K values was performed in FLAC 3D to evaluate the 657
influence of assumed in-situ stress ratio on the simulated stress distribution in the buttress. This research 658
demonstrates that unloading due to erosion and slope excavation can lead to tensile stress in the marble 659
buttress and that this will be amplified when high in-situ stress conditions are present. The FDM 660
simulation shows that, even though the tensile stresses do not reach very high magnitudes and they might 661
not be enough to generate brittle fractures in the intact rock mass (for the Kx and Ky values until now 662
investigated), they are parallel to the X direction (West-East) which is approximately the same direction 663
as the strike of the S1 foliation surfaces that characterize most of the Apuan Alps. As the S1 foliation 664
represents the direction of weakness in the rock mass, it is suggested that S1 may have an important 665
control on the nucleation and propagation of brittle fracturing. Moreover, as before mentioned, the new 666
generated fractures, was observed connecting two adjacent system discontinuities. 667
This agrees with the field observations (often the brittle fractures in the Carrara marble district follow the 668
same direction as S1) and previous studies carried out in the area [18], [52] and [17]. Although this 669
research represents a preliminary study, it forms an important step and foundation for the analysis of the 670

buttress and a case example of stress analysis/damage in open pit slopes using a remote sensing/FDM 671
approach. 672
673
8.1 Future developments and works 674
Field measurements of in-situ stress were not available for this research. As this data becomes available 675
(in collaboration with the Unità Sanitaria Locale - USL1 of Massa-Carrara), further numerical modelling 676
will be carried out to allow the absolute stress distribution during the quarry excavation phases to be 677
better understood (particularly in order to evaluate the buttress behaviour in case of low and very low (up 678
to ≈ 0,1) Kx and Ky values [32]. 679
Laboratory testing will be performed to improve the information on the mechanical properties of the 680
marble and to better define the role of the S1 foliation in the tensile strength of the rock. Further 681
numerical simulation will then also be undertaken using a FDEM-DFN (Discrete fracture Network) 682
approach (e.g. Elfen and Slope Model [65] [49]) to allow simulation of stress-induced brittle fracture 683
generation and propagation. Based on the research presented in this paper further protection works were 684
carried out on the natural slope overhanging the open pit and three different monitoring systems installed 685
which have been operational since 2012 [72]. The first is a geotechnical monitoring system comprising 686
extensometers and crack-meters, and the other two are topographic systems consisting of a terrestrial 687
interferometer and a robotic total station. Data from these instrumentation systems will form an important 688
constrain for future rock slope damage research and constraining existing and future stability models of 689
the buttress area. 690
691
Acknowledgments 692
693
The authors wish to thank the Carrara USL1 (Mining Engineering Operative Unit – Department of 694
Prevention in the person of Eng. Pellegri, M.), La Sapienza University of Rome (Prof. Bozzano, F. leader 695
of the Italian National Research Project PRIN2009), and Ingeo Systems – Leica Geosystems (Eng. 696
Lapini, M.). Moreover, we are extremely grateful to the company “Cooperativa Cavatori Lorano” and, in 697
particular, to the quarry manager Ferrari, M. 698
699
References 700
[1] AgisoftTM
Photoscan Professional, 2014. http://www.agisoft.ru/products/photoscan. 701
[2] Anderson, E. M. 1951. The Dynamics of Faulting and Dyke Formation with Application to 702
Britain. Oliver and Boyd, Edinburgh, ed. 2:206. 703

[3] Abellán, A., Vilaplana, J.M., Martinez, J. 2006. Application of a long-range Terrestrial Laser 704
Scanner to a detailed rock fall study at Vall de Núria (Eastern Pyrenees, Spain). Engineering Geology 88, 705
136-148. 706
[4] Alvafez, W., Cocozza T., Wezel, F.C. 1974. Fragmentation of the Alpine orogenic belt by 707
microplate dispersal. Nature 248, 309-314. 708
[5] Angelier, J., Mechler, P. 1977. Sur une methode graphique de recherche des contraintes 709
principales egalement utilisable en tectonique et en seismologie: 1a methode des diedres droits, Bull. Soc. 710
Geol. France, 7(19), 1309-1318. 711
[6] Aringoli, D. Calista, M., Gentili, B., Pambianchi, G., Sciarra, N. 2008. Geomorphological 712
features and 3Dmodelling of Montelparo mass movement (Central Italy), Engineering Geology, 99, 70-713
84. 714
[7] Beraldin, J. A. 2004. Integration of laser scanning and close-range photogrammetry— the last 715
decade and beyond. Proceedings: XXth International Society for Photogrammetry and Remote Sensing 716
(ISPRS) Congress, Istanbul, Turkey, 972-983. 717
[8] Bieniawski, Z. 1973. Engineering classification jointed rock masses. Transactions of the South 718
African Institution of Civil Engineers, 15, 335-344. 719
[9] Bieniawski, Z. 1989. Engineering Rock Masses Classification. John Wiley and Sons Inc. New 720
York, NY, USA, 272 pp. 721
[10] Bigazzi, G., di Pisa, A.,Gattiglio, M., Meccheri, M., Norelli, P. 1988. La struttura catoclastica-722
milonitica di Foce di Mosceta, Alpi Apuane sud orientali (M. Corchia, Gruppo delle Panie). Atti Soc Sci. 723
Nat., Mem. Ser. A., 95, 105-116. 724
[11] Board, M., Chacon, E., Varona, P., Lorig, L. 1996. Comparative analysis of toppling behaviour at 725
Chuquicamata open-pit mine, Chile. Trans. Instit. Min. Metall., 105, A11-A21. 726
[12] Bott, M.H.P. 1959. The mechanisms of oblique slip faulting. Geol. Mag. 96. 109-117. 727
[13] Brideau M.A., Pedrazzini A., Stead D., Froese C., Jaboyedoff M., van Zeyl D. 2011. Three-728
dimensional slope stability analysis of South Peak, Crowsnest Pass, Alberta, Canada. Landslides, 8, 139-729
158. 730
[14] Cai, M., Kaiser, P.K., Martin, C.D. 2001. Quantification of rock mass damage in underground 731
excavations from microseismic event monitoring, International Journal of Rock Mechanics and Mining 732
Sciences, 38, 1135-1145. 733
[15] Cai, M., Kaiser, P.K., Tasaka, Y., Maejima, T., Morioka, H., Minami. M. 2004. Generalized 734
crack initiation and crack damage stress thresholds of brittle rock masses near underground excavations. 735
International Journal of Rock Mechanics and Mining Sciences, 41, 833-847. 736

[16] Cai, M., Kaiser, P.K., Morioka, H., Minami, M., Maejima, T., Tasaka, Y., Kurose, H. 2007. 737
FLAC/PFC coupled numerical simulation of AE in large-scale underground excavations. International 738
Journal of Rock Mechanics and Mining Sciences, 44, 550-564. 739
[17] Carmignani, L., Kligfield, R, 1990. Crustal extension in the Northern Apennines: the transition 740
from compression to extension in the Alpi Apuane core complex. Tectonics, v9,1275-1303. 741
[18] Carmignani, L.,Conti, P., Fantozzi, P.L., Mancini S., Massa G., Molli G., Vaselli L. 2007. I 742
marmi delle Alpi Apuane. Geoitalia; 21, 19-30. 743
[19] Chang C.T., Monteiro P., Nemati K., Shyu K. 1996. Behavior of marble under compression. 744
Journal of Materials in Civil Engineering, Vol. 8, No. 3, August 1996, pp. 157-170. 745
[20] Coggan, J.S., Wetherelt, A., Gwynn, X.P., Flynn, Z. 2007. Comparison of hand-mapping with 746
remote data capture systems for effective rock mass characterisation, 11th Congress of International 747
Society for Rock Mechanics, Lisbon 2007, 9th - 13th July 2007, Proceedings of 11th Congress of the 748
International Society for Rock Mechanics - the second half century of rock mechanics, 1, 201-205. 749
[21] Cruden, D.M. 1989. Limit to common toppling. Can Geotech J 26:737-742 750
[22] Danzi, M., Di Crescenzo, G., Ramondini, M., Santo, A. 2013. Use of unmanned aerial vehicles 751
(UAVs) for photogrammetric surveys in rockfall instability studies. Rendiconti Online Societa Geologica 752
Italiana, 24, 82-85 753
[23] Dahal, R.K., Hasegawa, S., Nonomura, A., Yamanaka, M., Dhakal, S. 2008. DEM-based 754
deterministic landslide hazard analysis in the Lesser Himalaya of Nepal, Georisk 2, 161-178. 755
[24] Delvaux, D. 1993. Quaternary stress evolution in East Africa from data of the western branch of 756
the East African rift. In: Thorweihe, Schandelmeier (Eds.), Geoscientific Research in Northern Africa, 757
Balkema, Rotterdam, pp. 315-318. 758
[25] Delvaux, D., Barth, A. 2010. African stress pattern from formal inversion of focal mechanism 759
data. Implications for rifting dynamics. Tectonophysics 482, 105-128. 760
[26] Delvaux, D., Kervyn, F., Macheyeki, A., Temu, E.B. 2012. Geodynamic significance of the TRM 761
segment in the East African Rift (W-Tanzania): Active tectonics and paleostress in the Ufipa plateau and 762
Rukwa basin, Journal of Structural Geology, 37, 161-180. 763
[27] Delvaux, D. Sperner, B. 2003. Stress tensor inversion from fault kinematic indicators and focal 764
mechanism data: the TENSOR program. In: New Insights into Structural Interpretation and Modelling (D. 765
Nieuwland Ed.). Geological Society, London, Special Publications, 212: 75-100. 766
[28] Diederichs, M.S., 1999. Instability of hard rock masses: the role of tensile damage and relaxation. 767
PhD thesis, University of Waterloo. 768

[29] Diederichs, M.S, Kaiser, P.K., Eberhardt, E. 2004. Damage initiation and propagation in hard 769
rock during tunnelling and the influence of near-face stress rotation. International Journal of Rock 770
Mechanics and Mining Sciences, 41, 785-812. 771
[30] Feng, Q.H., Röshoff, K., 2004. In-situ mapping and documentation of rock faces using a full-772
coverage 3D laser scanner technique. International Journal of Rock Mechanics and Mining Sciences 41 773
(3), 139-144. 774
[31] Ferrero, A. M., Forlani G., Rondella R., Voyat H.I. 2009. Advanced geostructural survey methods 775
applied to rock mass characterization. Rock Mech Rock Eng 42 (4), 631-65. 776
[32] Ferrero A.M., Gullì D., Migliazza M., Segalini A. 2013. In situ stress measurements 777
interpretations in large underground marble quarry by 3D modeling. International Journal of Rock 778
Mechanics and Mining Sciences, Vol. 60, pp. 103-113. 779
[33] Firpo, G., Salvini, R., Francioni, M., Ranjith, P.G. 2011. Use of Digital Terrestrial 780
Photogrammetry in rock slope stability analysis by Distinct Element numerical methods. International 781
Journal of Rock Mechanics and Mining Science, 48 (7), 1045-1054. 782
[34] Francioni. M., Salvini, R., Stead, D. Litrico, S. 2014. A case study integrating remote sensing and 783
distinct element analysis to quarry slope stability assessment in the Monte Altissimo area, Italy. 784
Engineering Geology, 183, 290-302. 785
[35] Francioni M. 2013. Development in the study of rock slopes: an integrated remote sensing – 786
stability analysis approach. PhD thesis. University of Siena. 787
[36] Francioni, M, Girgenti C. and Vanneschi C. 2013. Underground quarrying industry and terrestrial 788
laser scanning. Proceedings to IX Convegno Giovani Ricercatori di Geologia Applicata. Napoli, Italy, 789
14th - 15th February 2013. 790
[37] Fröhlich, C., Mettenleiter, M. 2004. Terrestrial laser scanning — new perspectives in 3D 791
surveying. In: Thies, M., Koch, B., Spiecker, H., Weinacker, H. (Eds.), Laser-scanners for Forest and 792
Landscape 793
[38] Ghirotti, M., Genevois, R. 2007. A complex rock slope failure investigated by means of 794
numerical modelling based on laser scanner technique. In Proceedings: 1st Canada-US Rock Mechanics 795
Symposium, Eds E, Eberhardt, D. Stead and T. Morrison, May 27-31, Vancouver, 917-924. 796
[39] Goodman, R.E. 1989. Introduction to rock mechanics, 2nd edn. Wiley, New York, p 576 797
[40] Goodman, R.E., Bray, J.W. 1976. Toppling of rock slopes. In: Rock engineering for foundations 798
and slopes, Proceedings of a Specialty Conference vol. 2. American Society of Civil Engineering, New 799
York, p. 201-234. 800
[41] Gullì, D., Pellegri, M., Cortopassi, A. 2010. Experimental study for stress analysis on different 801
Carrara marble underground quarries. International Symposium on Deformation Characteristics of 802
Geomaterials, September 1-3, Seoul, Korea, 1296 - 1302. 803
[42] Haarbrink, R.B., Eisenbeiss, H. 2008. Accurate DSM production from unmanned helicopter 804
systems. International Archives of Photogrammetry, Remote Sensing and Spatial Information Sciences, 805
XXXVII/B1. PRC, Beijing, 159-164. 806
[43] Handley, M. F., Karparov, K. N. 2007. Proposed thrust failure analytical method for slope 807
collapse in open pit mines," in The Second Half Century of Rock Mechanics (11th Congress of the 808
International Society for Rock Mechanics, Lisbon, July 2007), Vol. 1, pp. 645-652, L. Ribeiro e Sousa, C. 809
Olalla, and N. Grossmann, Eds. London: Taylor & Francis Group. 810
[44] Haneberg, W.C. 2008. Using close range terrestrial digital photogrammetry for 3-D rock slope 811
modelling and discontinuity mapping in the United States. Bulletin of Engineering Geology and the 812
Environment, 67: 457-469. 813
[45] Hoek, E., Brown, E.T. 1997. Practical estimates of rock mass strength. International Journal of 814
Rock Mechanics and Mining Sciences 34 (8), 1165-1186. 815
[46] Hoek, E., Bray, J.W. 1981. Rock slope engineering, Third edition. The Institution of Mining and 816
Metallurgy, London, 358 pp. 817
[47] Hoek, E., Diederichs, M.S. 2006. Empirical estimation of rock mass modulus. International 818
Journal of Rock Mechanics and Mining Sciences 43 (2), 203-215. 819
[48] Iabichino, G., Gullì, D., Cravero M., Bianchini, S. 2006. Comparison between 2D overcoring and 820
hydraulic fracturing stress measurements in the Apuane Alps. In-situ Rock Stress – Lu, Li, Kjørholt & 821
Dahle (eds) Taylor & Francis Group, London, ISBN 0-415-40163-1 822
[49] Itasca Software 2012. FLAC3D; Kubrix; Slope Model. http://www.itascacg.com/software/flac3d 823
[50] Jaboyedoff M, Baillifard F, Couture R, Locat J, Locat P. 2004. Toward preliminary hazard 824
assessment using DEM topographic analysis and simple mechanic modeling. In: Lacerda WA, Ehrlich M, 825
Fontoura AB, Sayo A (eds) Proceedings of the 9th International symposium on landslides. Balkema, 826
Rotterdam, pp 191-197 827
[51] Jaboyedoff, M., Oppikofer, T., Minoia, R., Locat, J., Turmel, D. 2008. Terrestrial LIDAR 828
investigation of the 2004 rockslide along Petit Champlain Street, Québec City (Québec, Canada). 829
Proceedings: 4th Canadian Conference on Geohazards, 20-24May, Québec, Canada, 8 pp. 830
[52] Kligfield, R. 1979. The Northern Apennines as a collisional orogeny. Am. J. Sci. 279, 676-69. 831
[53] Kraus, K. 2007. Photogrammetry, Geometry from Images and Laser Scans. Berlin: De Gruyter. 832

[54] Lato, M., Diederichs, M.S., Hutchinson, D.J., Harrap, R. 2009. Optimization of LiDAR scanning 833
and processing for automated structural evaluation of discontinuities in rock masses. International Journal 834
of Rock Mechanics and Mining Sciences 46, 194-199. 835
[55] Lightfoot, N., Maccelari, M.J. 1999. Numerical Modelling of Mine Workings. SIMRAC Final 836
Project Report GAP 415. Pretoria: Department of Minerals and Energy. 837
[56] Linder, W., 2003. Digital Photogrammetry - Theory and Applications. Heidelberg. 838
[57] Marinos, V., Marinos, P., Hoek E, 2005. The geological strength index: applications and 839
limitations. Bull Eng Geol Environ 64:55-65. 840
[58] Maurenbrecher P.M., Hack H.R.G.K. 2007. Toppling mechanism: resolving the question of 841
alignment of slope and discontinuities. In: Ribeiro e Sousa L, Ollala C, Grossmann N, (eds) 11th 842
Congress of the International Society for Rock Mechanics. Taylor and Francis, London, pp 725-728. 843
[59] McNeel and Associates, 2011. Rhinoceros 4, SR9. http://www.rhino3d.com/download/rhino/4.0. 844
[60] Niethammer, U., Rothmund S., James M. R., Travelletti J., Joswig M. 2010. UAV-based remote 845
sensing of landslides. International Archives of Photogrammetry, Remote Sensing and Spatial 846
Information Sciences, Vol. XXXVIII, 496 - 501. 847
[61] Ottria G., Molli G. 2000. Superimposed brittle structures in the late-orogenic extension of the 848
northern Apennine: results from the Carrara area (Alpi Apuane, NW Tuscany). Terra Nova, Vol. 12, 52-849
59. 850
[62] Perazzelli P., Graziani A., Rotonda T. 2009. Stability analysis of an active marble quarry by 851
DEM modelling. Proceedings of the International Conference on Rock Joints and Jointed Rock Masses, 852
Arizona, USA, January 7-8, 2009. 853
[63] Profeti, M., Cella, R. 2010. Relazione sulla stabilità dei fronti – Cava Lorano n. 22. Technical 854
report. 855
[64] Richards, L.R., Leg, G.M.M., Whittle, R.A. 1978. Appraisal of stability conditions in rock slopes. 856
In: Bell FG (ed) Foundation engineering in difficult ground. Newnes-Butterworths, London, pp 449-512. 857
[65] Rockfield 2012. ELFEN 2D/3D Numerical Modelling Package. Rockfield Software Ltd., 858
Swansea. http://www.rockfield.co.uk/ 859
[66] Rocscience 2014. Rocscience software products - DIPS 6.0, RocData 5.0. 860
https://www.rocscience.com. 861
[67] Roncella, R., Forlani, G., Remondino, F. 2005. Photogrammetry for geological applications: 862
automatic retrieval of discontinuity orientation in rock slopes. In: Proc SPIE-IS&T electronic imaging, 863
Videometrics 5665,17-27. 864
[68] Sainsbury, B., Pierce, M. Mas Ivars, D. 2008. Analysis of Caving Behavior Using a Synthetic 865
Rock Mass - Ubiquitous Joint Rock Mass Modeling Technique, In Proceedings of the 1st Southern 866

Hemisphere International Rock Mechanics Symposium (SHIRMS), Y. Potvin, J. Carter, A. Dyskin and R. 867
Jeffrey (eds), 16 - 19 September 2009, Perth, Australia, Australian Centre for Geo-mechanics, Perth, Vol. 868
1 - Mining and Civil, pp. 243 - 254. 869
[69] Salvini, R., Francioni, M., Fantozzi, P.L., Riccucci, S., Bonciani, F., Mancini, S. 2011. Stability 870
analysis of “Grotta delle Felci” Cliff (Capri Island, Italy): structural, engineering-geological, 871
photogrammetric surveys and laser scanning. Bull. Eng Geol Environ 70, 549-557. 872
[70] Salvini, R., Francioni, M. 2013. Geomatic for slope stability and rock fall runout analysis: a case 873
study along the Alta Tambura road in the Apuan Alps (Tuscany, Italy). Italian Journal of Engineering 874
Geology and Environment. Book series 6, Genevois R and Prestininzi A. (eds.), 481-492. 875
[71] Salvini, R., Francioni, M., Riccucci, S., Bonciani, F., Callegari, I. 2013. Photogrammetry and 876
laser scanning for analyzing slope stability and rock fall runout along the Domodossola–Iselle railway, 877
the Italian Alps. Geomorphology 185, 110-122. 878
[72] Salvini R., Vanneschi C., Gullì D., Forchione F., Riccucci S. and Francioni M. 2014. Integration 879
of geotechnical and remote monitoring systems for the analysis and control of ground deformation in 880
marble quarrying (Apuan Alps, Italy). in “Engineering Geology for Society and Territory. Vol. 5 Urban 881
Geology, Sustainable Planning and Landscape Exploitation”, Lollino G., Manconi A., Guzzetti F., 882
Culshaw M., Bobrowsky P. and Luino F. (eds.), 183-188. 883
[73] Slama, C.C. (Ed.) 1980. Manual of Photogrammetry, 4th edition. American Society of 884
photogrammetry, Falls Church, 1056 pp. 885
[74] Stead, D., Eberhardt, E., Coggan, J.S. 2004. Modelling of complex rock slope failure mechanisms 886
using a hybrid finite-/discrete-element code. 1067-1072. in Landslides Evaluation and Stabilization. ISBN 887
04 1535 667 9 Proc IXth ISL, Eds Lacerda et al. Rio de Janeiro, 2004. 888
[75] Stead, D., Eberhardt, E. 2013. Understanding the mechanisms of large landslide. Vaiont 2013, 889
Italian Journal of Engineering Geology, Italian journal of engineering geology and environment. Book 890
series 6, Genevois R. and Prestininzi A. (eds.), 85 - 112 891
[76] Sturzenegger, M., Stead, D., Beveridge, A., Lee, S., van As., A. 2009. Long-range terrestrial 892
digital photogrammetry for discontinuity characterization at Palabora open-pit mine. In Diederichs M. & 893
Grasselli G. eds. “ROCKENG09: Proceedings of the 3rd
CANUS Rock Mechanics Symposium”, Toronto, 894
paper 3984, 10 pp. 895
[77] Sturzenegger, M., Stead, D. 2009(a). Close-range terrestrial digital photogrammetry and 896
terrestrial laser scanning for discontinuity characterization on rock cuts. Engineering Geology 106, 163-897
182. 898

[78] Sturzenegger, M., Stead, D. 2009(b). Quantifying discontinuity orientation and persistence on 899
high mountain rock slopes and large landslides using terrestrial remote sensing techniques. Natural 900
Hazards and Earth System Sciences 9 (2), 267-287. 901
[79] Tonon, F., Kottenstette, J.T. 2007. Laser and photogrammetric methods for rock face 902
characterization. Report on a Workshop Held in Golden, Colorado, June 17-18, 2006. American Rock 903
Mechanics Association, 6 pp. 904
[80] Vandeginste, V., Faure, J.L., Osadetz, K., Roure, F. Swennen, R. 2012. Paleostress evolution in 905
the Canadian Cordilleran foreland fold-and-thrust belt west of Calgary. Geologica Belgica, Vol. 15/1-2, 906
pp. 42-52. 907
[81] Van Westen, C.J. 1998. GIS in landslide hazard zonation: a view, with cases from the Andes of 908
Colombia, in: F.P. Martin, D.I. Heywood (Eds.), Mountain Environment and Geographic Information 909
Systems, Taylor & Francis, pp. 35-165. 910
[82] VanWesten, C.J., Terlien, M.T.J. 1996. Deterministic landslide hazard analysis in GIS: a case 911
study from Manizales (Colombia), Earth Surface Processes and Landforms, 21, 853-868. 912
[83] Wiles, t. d. 2005. Reliability of numerical modelling predictions. International Journal of Rock 913
Mechanics and Mining Sciences, Vol. 43, 454-472 914
[84] Xie, M., Esaki, T., Cai M.F. 2004. A GIS-based method for locating the critical 3D slip surface in 915
a slope, Computers and Geotechnics, 31, 267-277. 916
[85] Xie, M., Esaki, T., Qiu, C., Wang C.X. 2006. Geographical information system-based 917
computational implementation and application of spatial three-dimensional slope stability analysis, 918
Computers and Geotechnics, 33, 260-274. 919
920
921
922