AN INTEGRATED DESIGN ENVIRONMENT FOR …academic.csuohio.edu/embedded/Publications/Thesis/Sunil...
101
AN INTEGRATED DESIGN ENVIRONMENT FOR SMALL SATELLITES SUNIL GAVINI Bachelor of Electrical Engineering JNT University, India April, 2004 Submitted in partial fulfillment of requirements for the degree MASTER OF SCIENCE IN ELECTRICAL ENGINEERING at the CLEVELAND STATE UNIVERSITY December, 2006
Transcript of AN INTEGRATED DESIGN ENVIRONMENT FOR …academic.csuohio.edu/embedded/Publications/Thesis/Sunil...

AN INTEGRATED DESIGN ENVIRONMENT FOR SMALL
SATELLITES
SUNIL GAVINI
Bachelor of Electrical Engineering
JNT University, India
April, 2004
Submitted in partial fulfillment of requirements for the degree
MASTER OF SCIENCE IN ELECTRICAL ENGINEERING
at the
CLEVELAND STATE UNIVERSITY
December, 2006

This thesis has been approved
for the Department of Electrical and Computer Engineering
and the College of Graduate Studies by
________________________________________________
Thesis Committee Chairperson, Dan Simon
________________________________
Department/Date
________________________________________________
Yongjian Fu
________________________________
Department/Date
________________________________________________
Wenbing Zhao
________________________________
Department/Date

To my family and friends

iv
ACKNOWLEDGEMENTS
I would like to express my sincere gratitude to my thesis advisor Dr. Dan Simon,
for the ingenious commitment, encouragement and highly valuable advice he provided
me over the entire course of this thesis.
I would also like to thank my committee members Dr. Yongjian Fu and Dr.
Wenbing Zhao, for their support and advice. I should not forget to thank Dr. Charles
Alexander from the CREATE team for funding me through my course of study.
I also like to thank my lab mates at the Embedded Control Systems Research
Laboratory for their encouragement and intellectual input during the entire course of this
thesis, w ithout w hich this w ork w ouldn‟t have been possible.
Finally, I wish to thank my parents and my friends who have always been a
constant source of inspiration to me.

v
AN INTEGRATED DESIGN ENVIRONMENT FOR SMALL
SATELLITES
SUNIL GAVINI
ABSTRACT
Small satellites are generally spacecraft weighing around few hundred kilograms
that are confined mostly to low Earth orbit where they perform specific tasks such as
remote sensing, conduct science operations, and serve as technology test beds and
communication relays. This ultimately results in a multibillion industry. Hence the design
of these small satellites plays an important role in developing a satellite. The following
thesis discusses an Integrated Design Environment for satellite design that integrates the
software required for the satellite design onto a single platform.
Software that is used for project management, requirements management and
electrical/power simulations are integrated using Visual Basic.Net. This allows the
developer to access the software from a single interface, reducing access time and
providing file sharing over the network.

vi
TABLE OF CONTENTS
Page
LIST OF TABLES… … … … … … … … … … … … … … … … … … … … … … … … … … … ix
LIST OF FIGURES… … … … … … … … … … … … … … … … … … … … … … … … … … ...x
I INTRODUCTION ....................................................................................................... 1
1.1 Literature Review........................................................................................ 3
1.2 Small Satellite Design Procedures .............................................................. 4
1.3 Integrated Design Environment for Small Satellites .................................. 6
1.4 The Space Mission Life Cycle .................................................................... 8
1.5 The Six-Step Process ................................................................................ 10
1.6 Thesis Organization .................................................................................. 15
II PROJECT MANAGEMENT .................................................................................. 16
2.1 Microsoft Project ...................................................................................... 18
2.2 Microsoft Office Project Server ................................................................ 20
2.3 Microsoft Project in the IDE ..................................................................... 22
2.4 Features of Microsoft Project .................................................................... 24
III REQUIREMENTS MANAGEMENT .................................................................... 33
3.1. Requirements Engineering ........................................................................ 34
3.2. Cradle ........................................................................................................ 36

vii
3.3. Cradle Modules ......................................................................................... 38
3.4. Cradle Components ................................................................................... 39
3.5. Cradle Functionality.................................................................................. 41
3.6. Model-Based Systems Engineering .......................................................... 45
IV DESIGN SIMULATIONS ...................................................................................... 51
4.1 Advantages of Simulations ....................................................................... 52
4.2 Ansoft Simplorer ....................................................................................... 54
4.3 Features of Simplorer ................................................................................ 55
4.4 Simplorer Examples .................................................................................. 60
V IMPLEMENTATION ............................................................................................. 71
5.1 The Integrated Design Environment ......................................................... 72
5.2 Project Management ................................................................................. 75
5.3 Requirements Management ...................................................................... 76
5.4 Design Simulations ................................................................................... 76
VI CONCLUSIONS And FUTURE WORK .............................................................. 78
6.1 Conclusions ............................................................................................... 78
6.2 Future Work .............................................................................................. 81
REFERENCES ................................................................................................................ 82

viii
APPENDICES ................................................................................................................. 86
A. Resource Management Table of Microsoft Project Template .................. 87
B. VHDL Code for Analog-to-Digital Conversion ....................................... 89

ix
LIST OF TABLES
Table Page
TABLE I: Tasks Listed In The Microsoft Project Template ..................................... 22
TABLE II: Data Pairs Of External Load (N) .............................................................. 64
TABLE III: Allocated Resources For Each Task ......................................................... 87

x
LIST OF FIGURES
Figure Page
Figure 1: Centralized and Distributed Design/Analysis ............................................. 5
Figure 2: High level diagram of the IDE .................................................................. 14
Figure 3: Project Server options in Microsoft Project .............................................. 21
Figure 4: Gantt Chart View from IDE Template...................................................... 26
Figure 5: Calendar View from IDE Template .......................................................... 27
Figure 6: Network Diagram from IDE Template ..................................................... 28
Figure 7: PERT Analysis Toolbar ............................................................................ 29
Figure 8: Resource Sheet from the Template of the IDE ......................................... 31
Figure 9: Reports menu from Microsoft Project ...................................................... 31
Figure 10: Tracking Gantt View for the IDE Template ............................................. 32
Figure 11: Cradle modules ......................................................................................... 39
Figure 12: Cradle Capture Interface in Microsoft Word ............................................ 42
Figure 13: Class Diagram of the Users Class ............................................................. 46
Figure 14: Activity Diagram for a Print Class............................................................ 47
Figure 15: State Chart Diagram for a Cradle Server .................................................. 48
Figure 16: Use Case Diagram for IDE ....................................................................... 50

xi
Figure 17: Three Phase Full Converter with DC Motor ............................................. 61
Figure 18: Motor Current and Voltage with Source Voltages ................................... 62
Figure 19: DC Motor Speed Control Using a PID Controller .................................... 64
Figure 20: Motor Speed, Current and Voltage waveforms with Load ....................... 65
Figure 21: PIC symbol after editing using Symbol Editor ......................................... 66
Figure 22: Simple circuit diagram using the PIC_ADC Block .................................. 67
Figure 23: With MAX=8 RES=8 and Input=5 V (EMF value), Clock=1 ms ............ 68
Figure 24: With MAX=255 RES=8 and Input=255 V (EMF value), Clock=1 ms .... 69
Figure 25: With MAX=255 RES=8 and Input=10 V (Pulse input), Clock=1 ms ...... 69
Figure 26: With MAX=255 RES=8 and Input=255 V (Pulse input), Clock=20 us ... 70
Figure 27: IDE Homepage.......................................................................................... 73
Figure 28: IDE Design Phases Screen ........................................................................ 74
Figure 29: IDE Subsystems Design Phase Screen ..................................................... 75

1
CHAPTER I
INTRODUCTION
Small satellites have existed since the dawn of the Space Age, but the success of
these satellites was overshadowed by large satellites which dominated the space industry.
A new approach to satellite design utilizing modern small satellites arose in the late
1980s and opened up a new class of space applications. Today major advances in
microelectronics, in particular microprocessors, have made smaller satellites a viable
alternative. They provide cost-effective solutions to traditional problems at a time when
space budgets are decreasing. Interest in small satellites is growing rapidly, a fact which
is evident by the initiation of satellite programs by businesses, governments, universities
and other organizations around the world with applications in military, science,
technology, remote sensing, and communications.
Examples of the increased interest in small satellites are NAS A ‟s S m all E xplorer
(S M E X ) P rogram , N A S A ‟s E arth S cience S ystem P athfinder (E S S P ) satellite [1],
N A S A ‟s S pace T echnology 5 program , the N anosat C onstellation T railblazer satellite,
the A ir F orce R esearch L aboratory‟s T echnology S atellite of the 21 st Century (TechSat
21) and the MightySat programs. Further advances in small satellite capabilities are being

2
driven by research into new technologies such as microelectromechanical systems
(MEMS), microelectronics, software, and lightweight components.
The increase in the number of small satellite launches over the past two decades
and the planned inclusion of small satellites in many future programs indicate that there is
a need for system engineering tools which will aid in the conceptual studies for these
programs and which are appropriate to small spacecraft and the new technologies from
which they are derived. Systems engineering is concerned with the improvement of the
overall performance of the satellite, such as the reduction of mass, power consumption,
and cost.
Spacecraft design is an established discipline, but the characteristics of small
satellites are different from those of traditional large satellites with respect to mass,
surface area, solar panel technology, and electromechanical devices. Hence, there is a
need to design tools to support the requirements of small satellites. The overall process
used to design small satellites and large satellites may be the same, but the tools vary
significantly. In this paper, a new design tool for small satellites, in the form of an
Integrated Design Environment (IDE), is proposed and constructed.
In this Chapter, Section 1.1 discusses the literature review done for this thesis
while Section 1.2 discusses the satellite design procedures in use today. The Integrated
Design Environment for small satellites as well as the motivation for implementing new
techniques in satellite design procedures is discussed in Section 1.3. Section 1.4 deals
with the space mission life cycle, and Section 1.5 explains the procedure used in this IDE,
namely, a six-step process which includes all the phases of satellite design: concept,
3
definition, design, development, operation and disposal. Section 1.6 gives an overview of
the thesis organization.
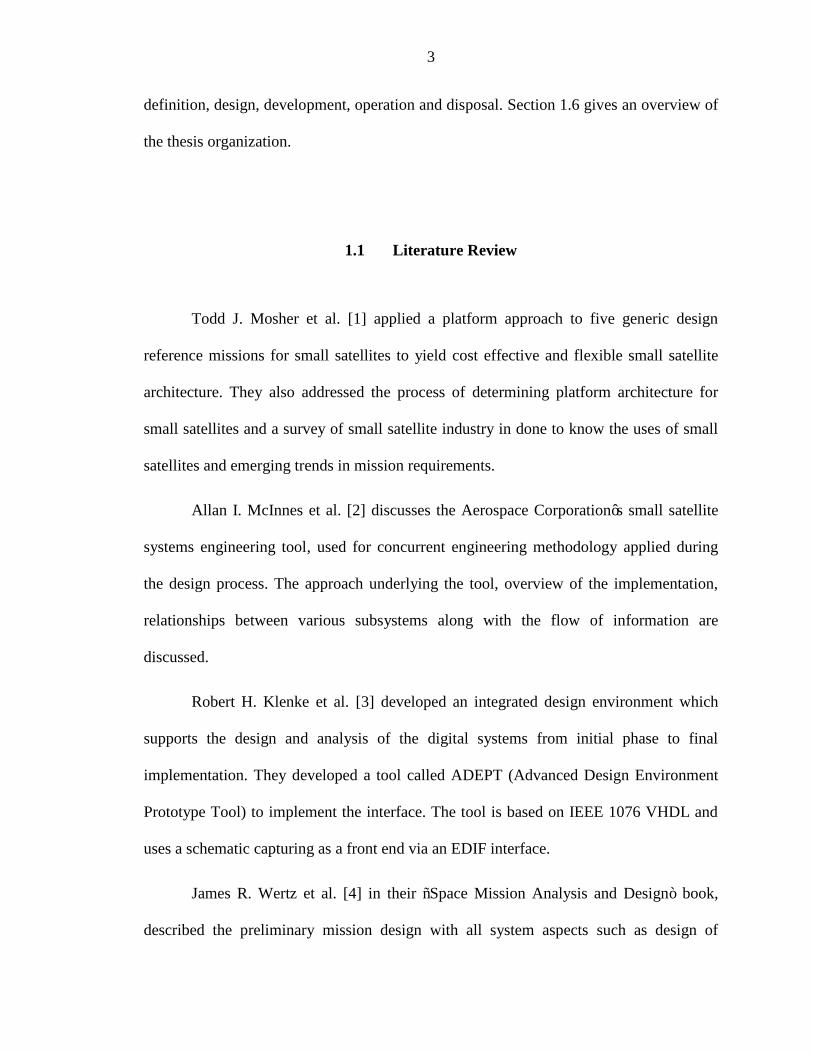
1.1 Literature Review
Todd J. Mosher et al. [1] applied a platform approach to five generic design
reference missions for small satellites to yield cost effective and flexible small satellite
architecture. They also addressed the process of determining platform architecture for
small satellites and a survey of small satellite industry in done to know the uses of small
satellites and emerging trends in mission requirements.
Allan I. McInnes et al. [2] discusses the Aerospace Corporation‟s small satellite
systems engineering tool, used for concurrent engineering methodology applied during
the design process. The approach underlying the tool, overview of the implementation,
relationships between various subsystems along with the flow of information are
discussed.
Robert H. Klenke et al. [3] developed an integrated design environment which
supports the design and analysis of the digital systems from initial phase to final
implementation. They developed a tool called ADEPT (Advanced Design Environment
Prototype Tool) to implement the interface. The tool is based on IEEE 1076 VHDL and
uses a schematic capturing as a front end via an EDIF interface.
James R. Wertz et al. [4] in their “Space Mission Analysis and Design” book,
described the preliminary mission design with all system aspects such as design of

4
spacecraft, orbital design, mission geometry, payload, ground segment and operations. It
also describes the design of small spacecraft with defining mission parameters and
requirements refining and the process of reducing cost.
Todd Mosher et al. [5] discusses the A erospace C orporation‟s sm all satellite cost
model (SSCM) and small satellite design model (SSDM), used extensively by the
systems engineers to understand conceptual spacecraft designs. The SSCM is used for
cost estimation using a spreadsheet by gathering information from the developer on the
specific components used and purpose for which the satellite will be used. The SSDM is
a general purpose spreadsheet model used by spacecraft systems engineers to explore a
variety of design solutions and identify critical subsystems.
1.2 Small Satellite Design Procedures
Traditional small satellite design methods use sequential and multidisciplinary
processes which have several disadvantages. For example, the design of one subsystem
may be dependent on that of another subsystem, so the design of the first subsystem
cannot proceed until the design of the second has been completed. The result is that the
time required for the overall design of the satellite design is substantially increased. In
addition the communication of design data from the personnel responsible for one
subsystem to the personnel responsible for another can be a complex and time-consuming
task. Apart from the sequential design process there are two more processes that are
recognized by the Aerospace Corporation [2].

5
1.2.1 Centralized Design/Analysis
To improve satellite design using the traditional sequential process, the Aerospace
Corporation developed a centralized design process (Figure 1 (a)) based on concurrent
design methodology. In this design process, a systems engineer works with a subsystem
specialist to construct simple subsystem designs that have good overall performance. In
this case all of the subsystem requirements are considered simultaneously, and this has
the advantage of using more options in a given design cycle as well as decreasing the
design cycle time.
(a) Centralized Design/Analysis (b) Distributed Design Analysis
Figure 1: Centralized and Distributed Design/Analysis [2]
1.2.2 Decentralized Design/Analysis
A concurrent engineering approach to spacecraft design can also be used in a
distributed mode as shown in Figure 1 (b). In this process the individuals work on a
single subsystem and the results are linked via a network to other specialists designing
other subsystems. This process has an advantage over the Centralized Design process,

6
because the subsystem specialist is part of the network during the design process
iteration, and therefore can design the subsystem using more complex algorithms [2].
1.3 Integrated Design Environment for Small Satellites
In general, tools or software available for the design of the satellite subsystem are
not linked within the design environment. This disconnection leads to the system model
being of little use to the design team as a starting place for their implementation. At
worst, the system model developed using these types of tools can be completely
inaccurate because of assumptions and abstractions that cannot be verified until the
design is almost complete, at which point redesign is too time consuming and expensive.
Even those design environments which employ the system level model often use different
terminology for different parts of the model and require the user to develop complex, ad
hoc interfaces between components modeled at different levels of abstraction. Using
different modeling paradigms for each type of analysis that is to be performed causes a
lack of coordination among various design teams [3].
Major changes are required to this traditional satellite design process because of
the growth of technology with onboard processing capability and the continuing
emphasis on low-cost missions. In this thesis a new method for the design and analysis of
small satellites is proposed. With this Integrated Design Environment (IDE), satellite
analysis and design is an evolving process. The IDE is a single software package that can

7
be used for design, integration, testing, launch and orbital operations support (some
operations are yet to be included).
This IDE unifies the main software involved in each phase of the small satellite
development. The IDE will not only allow users to design and build small satellites, but
also allows for ready retrieval of inform ation. T his is a type of “know ledge capture” w ith
which satellite design expertise can be leveraged for future satellite design projects. The
IDE, when installed on a network, allows developers to enter any satellite design phase
that they desire, and they can work on more than one phase simultaneously. Also, the
simulation results or design procedures of one subsystem can be shared over the existing
network facilitating sharing and the usage of the same design paradigms within the
design group. But with this procedure, sharing the design process may require a database
server for accuracy in using the relevant files of each project. For example if a subsystem
specialist SS1 wishes to work on power system design for satellite A and subsystem
specialist SS2 for satellite B, the correct power system design files corresponding to
satellite A must be accessible by SS1 and of satellite B by SS2. This is possible only with
a background database server which maintains all the subsystem files under the
corresponding satellite or project titles.
This IDE is being implemented in Visual Basic.NET (VB.NET), a development
tool that is used to develop Windows-based applications. It is an object oriented (OO)
programming language which can be viewed as Visual Basic implemented on Microsoft
.NET Framework. It supports rich user interface tools that are available in the Windows
operating system. All of the rapid application development (RAD) tools that developers
have come to expect from Microsoft are found in Visual Basic .NET, including drag-and-

8
drop design and combined with the ability to write code for forms. Visual Basic .NET
supports the extensive use of external applications and dynamic object creation through
the Component Object Model1 (COM) in which reference objects can be created
dynamically for the external objects and used for programming. The IDE for small
satellite design includes several design and simulation software packages, including tools
for electronics simulation, orbit analysis, structural dynamics, and power distribution.
1.4 The Space Mission Life Cycle
The life cycle of a satellite space mission generally progresses through four main
stages [4].
1.4.1 Concept Exploration
The first is the Concept Exploration stage during which three basic activities
occur: Requirements Generation (by Users and Operators), Acquisition Management (by
Developers) and Planning (by Sponsors).
Users and Operators develop and coordinate a set of broad needs and performance
objectives. At the same time, developers modify and expand the concepts developed by
the user and operating community. The sponsors develop an overall program structure
and estimate budgets to meet the needs of users, operators and developers. The main goal
1 Microsoft Visual Basic .NET, Microsoft Visual Basic and COM are trademarks of Microsoft Corporation

9
during this stage is to assess the need for the space mission and develop alternatives that
meet the requirements of the user.
1.4.2 Detailed Development
During the Detailed Development stage, the Project Manager and the System
Development Manager work closely to develop detailed data and process models, refine
system and functional requirements, and refine high level architecture and logical design.
There are three key reviews during this stage: the Detailed Level Requirements Review,
the Logical Design Review, and the Technical Design Review.
1.4.3 Production and Deployment
The Production and Deployment stage commences as the third step and
encompasses Operations and Support. During the Production and Deployment stage, the
system should achieve the operational capability that satisfies mission needs.
There are primarily two tasks in the production stage: Low-Rate Initial
Production and Full-Rate Production. The Low-Rate Initial Production stage should
result in the completion of manufacturing development. The systems engineering effort
in the Full-Rate Production and Deployment stage delivers the fully-funded quantity of
systems and supporting material and services for the program. During this stage, the
system attains Initial Operational Capability.

10
As the combined components develop into a system, test and evaluation processes
reveal issues that require improvements or redesign. The initial manufacturing process
may also reveal issues that were not anticipated.
1.4.4 Operations and Support
The objective of this stage is the execution of a program that meets operational
support performance requirements and sustains the system in the most cost-effective
manner over its total life cycle. When the system reaches the end of its useful life, it
must be disposed in a safe manner. These two work efforts, Sustainment and Disposal,
comprise the Operations and Support Stage [6].
1.5 The Six-Step Process
The life cycle of the space mission is distributed over six phases in this IDE
which are extracted from the ideas of the general space mission life cycle discussed in
Section 1.4. Each stage from the actual satellite design life cycle may be covered in one
or more of these six phases. Each phase in turn may be used for the design or operation of
one or more subsystems. In general, these six phases exist for every project that is created
using the IDE. Also the design concepts of a particular subsystem of one satellite can be
used in the design of another satellite‟s subsystem. These six phases are discussed as
below in Sections 1.5.1 through 1.5.6.

11
1.5.1 Concept
Requirements from the users, developers and the sponsors are usually gathered in
the Concept phase. Primary issues such as mission statement, cost factors, required
resources, and time-schedules are usually organized using Microsoft Project 20032 during
this phase.
1.5.2 Definition
The primary data that is collected in the Concept phase is reviewed by the
subsystem specialists from the point of view of the optimization requirements necessary
for efficient operation of the satellite, including cost effectiveness, as well as user
requirements. In this phase
a. The technical and business baselines for the spacecraft project are defined;
b. Design processes for the subsystems are reviewed as stated in the mission
statement;
c. The state charts for the system are drawn, elaborating the complete satellite
system including all subsystems;
d. The requirements are modified depending on the design techniques that are
feasible;
e. The project time-line is designed and resources are allocated to each subsystem.
2 Microsoft Project 2003 is a trademark of Microsoft Corporation.

12
Cradle3 requirement analysis software is used to meet the needs of the Definition
phase.
1.5.3 Design
In this phase the various subsystems involved in the design of a satellite are
designed and simulated in software. Though simulations are not as accurate as the real
system, they generally give an idea of how the real system will behave under various
conditions such as a change in temperature or a change in pressure. They also provide the
means to test the subsystems under various conditions and design enhancements when
possible. The subsystems that are to be considered in the satellite design are:
a. Command and Control (Electrical)
b. Communication Subsystem
c. Payload Subsystem
d. Mechanisms and Deployment Subsystem
e. Power Subsystem
f. Thermal Management Subsystem
g. Propulsion and Orbit Maintenance
h. Structure (Mechanical)
Simplorer v7.04 is used to design the electrical and power subsystems. Currently,
only these two subsystems have been implemented. The rest of the subsystems will be
implemented in the future.
3 Cradle is a trademark of ThreeSL. 4 Simplorer v 7.0 is a trademark of Ansoft Corporation.

13
1.5.4 Development
In this phase, assembly, test and launch (ATLO) operations take place. After the
subsystem units have been assembled, the following system level tests are performed:
a. Thermal testing, simulating the conditions in space.
b. Mission simulations.
c. Acoustics, simulating the environment required.
These and other specifications must be met depending on the type of the satellite
being developed. The satellite is to be developed in a laboratory that has met all of the
specifications required for a safe operation.
1.5.5 Operations
This phase includes the operations performed on the satellite after its deployment.
The commands are sent from the ground stations and are received by the command and
data handling module on the satellite. This module coordinates the activities between
various subsystems on the satellite ensuring the safe operation of the satellite.
a. This phase starts immediately after the launch of the spacecraft.
b. The mission operations include the control and command of the spacecraft.
c. Depending on the complexity of the spacecraft and the mission, the mission
operations team is defined.
The IDE communicates with the satellite from the ground station using Visual
Basic software.

14
1.5.6 Disposal
This phase is useful in design of the techniques required for the safe disposal of
the spacecraft.
The six phase life cycle of the IDE can be seen as shown in Figure 2.
Figure 2: High level diagram of the IDE5
5 Drawn in Microsoft Word with an idea from the architecture of the IDE.

15
1.6 Thesis Organization
Chapter 2 of the thesis deals with the Concept phase, in which the Project
Management procedures are discussed with a template created in Microsoft Project 2003.
Chapter 3 discusses the Definition phase in which Cradle software is used to illustrate
how the requirements are refined and shows how to draw system diagrams such as
Dataflow diagrams, State charts etc.
In Chapter 4, the electrical subsystem design is discussed using the Simplorer
software. Each of Chapters 2, 3 and 4 discuss an example which gives a better idea of
using the respective software. Chapter 5 gives an overview of the implementation
procedures in this IDE. Conclusions and possible future work are discussed in Chapter 6.

16
CHAPTER II
PROJECT MANAGEMENT
A project can be defined as a unique undertaking that has clearly defined start and
finish dates and requires the management of time, resources, cost and quality to create a
unique product or service. Project management is the discipline of organizing and
managing resources so that the project is completed within the defined scope, available
man-power, materials, time and cost constraints [7].
The main task of project management is to ensure that a project is delivered
within the defined constraints. The other tasks are optimized allocation and integration of
the inputs required to meet the pre-defined objectives. Project management usually
follows the major phases termed as the feasibility study, project planning,
implementation, evaluation and support or maintenance. These phases include developing
a project plan, defining project goals and objectives, specifying tasks or how goals will be
achieved, what resources are needed and associating budgets and timelines for
completion [7]. It also includes implementing the project, along with careful controls to
stay on the "critical path", i.e., to ensure the plan is being managed according to the
strategy.

17
The discipline of Network Analysis began in the early 1950s, where in Europe the
development of such techniques as the Critical Path Method (CPM) and Project Network
Techniques began. With the development of the Polaris missile system in the USA, the
technique called Program Evaluation and Review Technique or PERT evolved. These
simple analysis techniques allow a project manager to define a series of tasks that are
essential to be undertaken to achieve the product, to link the tasks in a logical pattern to
form a network, and analyze individual task timings to calculate a critical path to achieve
an end date. Thus Network Analysis is the core technique of all modern project
management practices [7].
These techniques are good in concept, but their practical application requires
substantial calculations more suited to a computer which allows a project manager to
produce a plan quickly and, more importantly, to revise that plan as time progresses.
Project managers can assign resources to tasks and distribute their workloads with
appropriate cost assignments. Today there are many software packages available for
project management such as Active Project, Leading Project, and Microsoft Project,
which differ in features among which are project tracking, resource management, task
management, and web services. Therefore, it is important to understand the principles of
project planning before applying them to a project management software package like
Microsoft Project which is used in this IDE.
In this chapter, Section 2.1 gives a brief introduction to Microsoft Project and
Section 2.2 gives an overview of Microsoft Project Server. Section 2.3 lists all the tasks
that are used for the template of the IDE. Section 2.4 explains briefly the features such as

18
the Gantt chart, Calendar, Network Diagram, and the PERT Analysis Technique provided
by the Microsoft Project.
2.1 Microsoft Project
Microsoft Project (or MSP) is a project management software program developed
by Microsoft, designed to assist project managers in developing plans, assigning
resources to tasks, tracking progress, managing budgets, preparing reports and analyzing
workloads. The first version of Microsoft Project for Windows v1.0 was released in 1987
on a contract to a small external company. In 1988 the company was taken over by
Microsoft, releasing the developed project as part of Microsoft Windows 3.0. The
Macintosh version of Microsoft Project was released in July 1991. From then until 2003
six versions were released for both Windows and Macintosh [8], and the Project 2007
version is under development and is planned to be released in 2007.
Microsoft Project is a scheduling and planning tool for project managers,
providing easy-to-use tools for preparing a project schedule and assigning
responsibilities. It is a flexible software application for creating schedule graphics,
estimating resource requirements, analyzing task dependencies, and tracking project
progress. It can also be used to provide a graphical presentation for a project schedule,
where the tasks are listed and assigned with task durations, resources, dates, costs and, etc
[9]. In many project environments, managing scarce staff resources and dealing with

19
difficult schedules are the major obstacles to achieve project success. Microsoft Project is
a planning tool which assists the project manager in performing the following tasks:
a. Organize the project plan and facilitate tuning it with time and budget constraints.
b. Schedule tasks in the appropriate sequence and with deadlines that must be met.
c. Assign resources and costs to tasks, schedule tasks around the availability of
resources, and provide links between elements of the project (tasks, resources, and
assignments) and related project management documents in other applications.
d. Collaborate with other project stakeholders by reviewing the schedule and by
notifying resources of their assignments.
e. Prepare professional-looking reports to explain the project to stakeholders such as
owners, top management, supervisors, workers, subcontractors, and the public.
f. Publish the project on a server for other project managers to access and for
stakeholders to review via Internet browsers.
g. Track all the information gathered about the work, duration, costs, and resource
requirements for the project.
h. Exchange project information with other Microsoft Office System applications
such as Access, Excel, PowerPoint, and Word.
Microsoft Project also supports communication between the team members.
When work begins on the project, Microsoft Project can be used to do the following:
a. Track progress and analyze the evolving real schedule to see if it will finish on
time and within budget.

20
b. Notify resources of changes in their assignments and get progress reports on work
that has been accomplished and that is yet to be done.
c. Revise the schedule to accommodate changes and unforeseen circumstances.
d. Post automatically updated progress reports on the Project Server, or on an
Internet Web site or a company intranet.
e. Produce final reports on the success of the project and evaluate problem areas for
consideration in future projects.
Microsoft Project creates critical path schedules, which can be resource leveled,
and chains or links can be visualized in a Gantt chart. It also facilitates different user
access levels to projects, views, and other project related data. Custom objects such as
calendars, views, tables, filters and fields can be stored in a project server, so that all
users can share them over the network.
2.2 Microsoft Office Project Server
Microsoft extends the capabilities of Microsoft Project with Project Server and
Web Access. Project Server stores the project information in a central database, protected
from unauthorized access and corruption. A project administrator can control security,
defining users and access rights for a particular project [10].
The Project Center supports reporting across an organization at the project level.
The Project manager can communicate project plans and distribute task assignments to
team members. Assignment of tasks can be distributed to team member home pages in

21
Web Access, who in turn need to communicate their status and changes to keep the
project manager up to date. Project Server supports electronic communication over the
web via Web Access. The options that are available in Microsoft Project for
communication with the Project Server (or Project Center) are as shown in Figure 3.
Figure 3: Project Server options in Microsoft Project
Resource workloads can be analyzed by Project Center and resources with
Resource Center, allowing organizations to forecast future resource requirements and
make more efficient use of resources. View definitions are easier to understand and more
robust with Web Access than with Microsoft Project. Views can be protected to assist
standardization. Project Server stores custom calendars, views, tables, filters, and fields in
an Enterprise global location where users have access to the latest version every time
Microsoft Project is restarted.

22
2.3 Microsoft Project in the IDE
A template has been created for using Microsoft Project in this IDE. This template
consists of the tasks that are assumed to be common to most of the satellite design
projects [4]. The six-step satellite design process discussed in Section 1.5 of Chapter I is
implemented in the template with each stage being the main task with one or more sub-
tasks included in it. Milestones (important events) such as reviewing the process at
various levels have also been included as tasks. All the tasks along with their
corresponding total duration in days, start date, finish date, percentage work completed
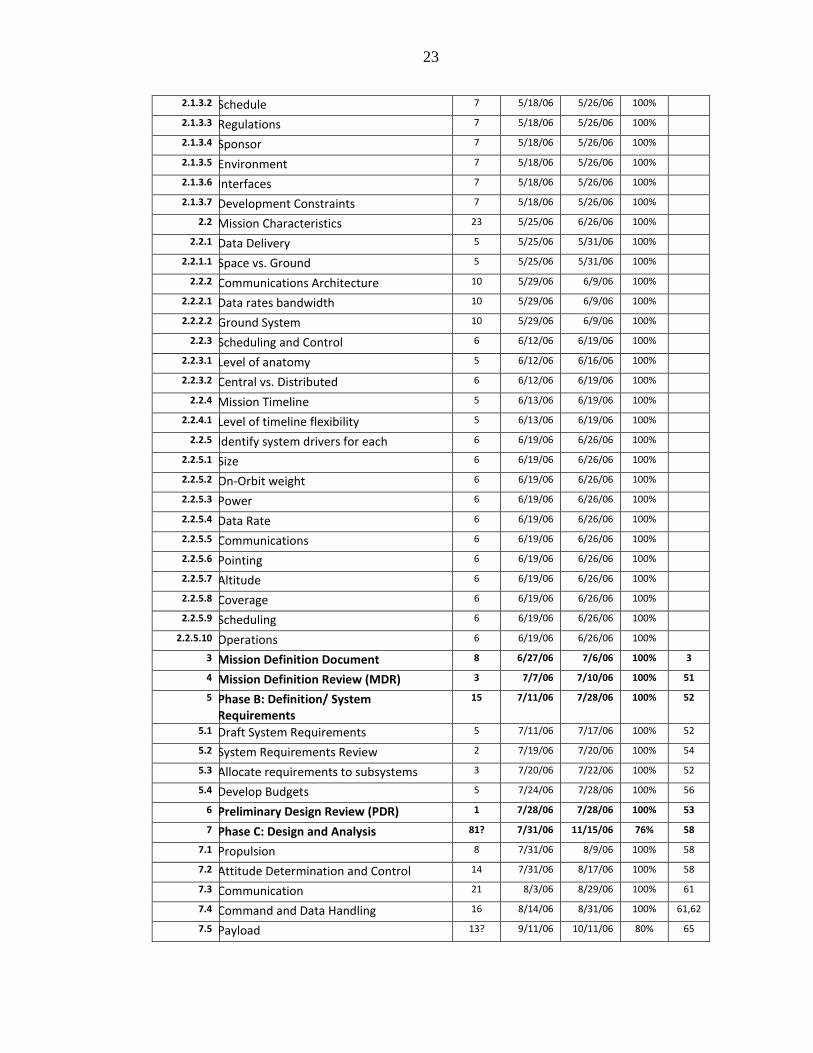
(% Finish) and the predecessors have been listed in the form of a table as in Table I.
TABLE I: TASKS LISTED IN THE MICROSOFT PROJECT TEMPLATE WBS Task Name No.
of Days
Start Date
Finish Date
% Finish
Predecessor
1 Project Name: Test Document 198? 5/2/06 1/31/07 42%
2 Phase A :Preliminary Analysis 38 5/4/06 6/26/06 100%
2.1 Mission Needs/ Requirements 17 5/4/06 5/26/06 100%
2.1.1 Functional Needs/ Requirements 12 5/4/06 5/19/06 100%
2.1.1.1 Performance 3 5/4/06 5/8/06 100%
2.1.1.1.1 Primary Objective 3 5/4/06 5/8/06 100%
2.1.1.1.2 Payload 3 5/4/06 5/8/06 100%
2.1.1.1.3 Size 3 5/4/06 5/8/06 100%
2.1.1.2 Coverage 4 5/8/06 5/11/06 100%
2.1.1.2.1 Orbit 4 5/8/06 5/11/06 100%
2.1.1.2.2 Swath width 4 5/8/06 5/11/06 100%
2.1.1.3 Responsiveness 10 5/8/06 5/19/06 100%
2.1.1.3.1 Communications architecture 5 5/8/06 5/12/06 100%
2.1.1.3.2 Processing delays 5 5/15/06 5/19/06 100% 14
2.1.2 Operational Needs/Requirements 6 5/8/06 5/15/06 100%
2.1.2.1 Duration 6 5/8/06 5/15/06 100%
2.1.2.2 Availability 6 5/8/06 5/15/06 100%
2.1.2.3 Survivability 6 5/8/06 5/15/06 100%
2.1.2.4 Data Distribution 6 5/8/06 5/15/06 100%
2.1.3 Constraints 7 5/18/06 5/26/06 100%
2.1.3.1 Cost 7 5/18/06 5/26/06 100%
23
2.1.3.2 Schedule 7 5/18/06 5/26/06 100%
2.1.3.3 Regulations 7 5/18/06 5/26/06 100%
2.1.3.4 Sponsor 7 5/18/06 5/26/06 100%
2.1.3.5 Environment 7 5/18/06 5/26/06 100%
2.1.3.6 Interfaces 7 5/18/06 5/26/06 100%
2.1.3.7 Development Constraints 7 5/18/06 5/26/06 100%
2.2 Mission Characteristics 23 5/25/06 6/26/06 100%
2.2.1 Data Delivery 5 5/25/06 5/31/06 100%
2.2.1.1 Space vs. Ground 5 5/25/06 5/31/06 100%
2.2.2 Communications Architecture 10 5/29/06 6/9/06 100%
2.2.2.1 Data rates bandwidth 10 5/29/06 6/9/06 100%
2.2.2.2 Ground System 10 5/29/06 6/9/06 100%
2.2.3 Scheduling and Control 6 6/12/06 6/19/06 100%
2.2.3.1 Level of anatomy 5 6/12/06 6/16/06 100%
2.2.3.2 Central vs. Distributed 6 6/12/06 6/19/06 100%
2.2.4 Mission Timeline 5 6/13/06 6/19/06 100%
2.2.4.1 Level of timeline flexibility 5 6/13/06 6/19/06 100%
2.2.5 Identify system drivers for each 6 6/19/06 6/26/06 100%
2.2.5.1 Size 6 6/19/06 6/26/06 100%
2.2.5.2 On-Orbit weight 6 6/19/06 6/26/06 100%
2.2.5.3 Power 6 6/19/06 6/26/06 100%
2.2.5.4 Data Rate 6 6/19/06 6/26/06 100%
2.2.5.5 Communications 6 6/19/06 6/26/06 100%
2.2.5.6 Pointing 6 6/19/06 6/26/06 100%
2.2.5.7 Altitude 6 6/19/06 6/26/06 100%
2.2.5.8 Coverage 6 6/19/06 6/26/06 100%
2.2.5.9 Scheduling 6 6/19/06 6/26/06 100%
2.2.5.10 Operations 6 6/19/06 6/26/06 100%
3 Mission Definition Document 8 6/27/06 7/6/06 100% 3
4 Mission Definition Review (MDR) 3 7/7/06 7/10/06 100% 51
5 Phase B: Definition/ System Requirements
15 7/11/06 7/28/06 100% 52
5.1 Draft System Requirements 5 7/11/06 7/17/06 100% 52
5.2 System Requirements Review 2 7/19/06 7/20/06 100% 54
5.3 Allocate requirements to subsystems 3 7/20/06 7/22/06 100% 52
5.4 Develop Budgets 5 7/24/06 7/28/06 100% 56
6 Preliminary Design Review (PDR) 1 7/28/06 7/28/06 100% 53
7 Phase C: Design and Analysis 81? 7/31/06 11/15/06 76% 58
7.1 Propulsion 8 7/31/06 8/9/06 100% 58
7.2 Attitude Determination and Control 14 7/31/06 8/17/06 100% 58
7.3 Communication 21 8/3/06 8/29/06 100% 61
7.4 Command and Data Handling 16 8/14/06 8/31/06 100% 61,62
7.5 Payload 13? 9/11/06 10/11/06 80% 65
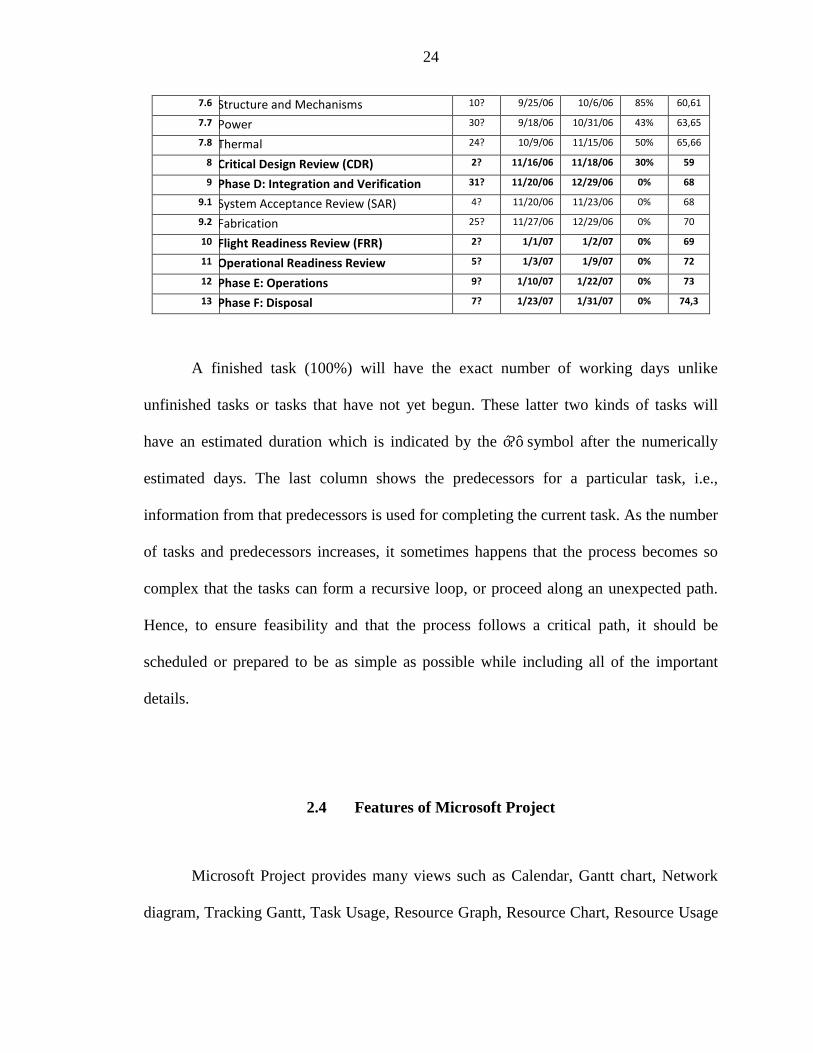
24
7.6 Structure and Mechanisms 10? 9/25/06 10/6/06 85% 60,61
7.7 Power 30? 9/18/06 10/31/06 43% 63,65
7.8 Thermal 24? 10/9/06 11/15/06 50% 65,66
8 Critical Design Review (CDR) 2? 11/16/06 11/18/06 30% 59
9 Phase D: Integration and Verification 31? 11/20/06 12/29/06 0% 68
9.1 System Acceptance Review (SAR) 4? 11/20/06 11/23/06 0% 68
9.2 Fabrication 25? 11/27/06 12/29/06 0% 70
10 Flight Readiness Review (FRR) 2? 1/1/07 1/2/07 0% 69
11 Operational Readiness Review 5? 1/3/07 1/9/07 0% 72
12 Phase E: Operations 9? 1/10/07 1/22/07 0% 73
13 Phase F: Disposal 7? 1/23/07 1/31/07 0% 74,3
A finished task (100%) will have the exact number of working days unlike
unfinished tasks or tasks that have not yet begun. These latter two kinds of tasks will
have an estimated duration w hich is indicated by the „?‟ sym bol after the num erically
estimated days. The last column shows the predecessors for a particular task, i.e.,
information from that predecessors is used for completing the current task. As the number
of tasks and predecessors increases, it sometimes happens that the process becomes so
complex that the tasks can form a recursive loop, or proceed along an unexpected path.
Hence, to ensure feasibility and that the process follows a critical path, it should be
scheduled or prepared to be as simple as possible while including all of the important
details.
2.4 Features of Microsoft Project
Microsoft Project provides many views such as Calendar, Gantt chart, Network
diagram, Tracking Gantt, Task Usage, Resource Graph, Resource Chart, Resource Usage

25
and many other views as desired by the user. A resource sheet where all the resources can
be managed is also available. It can also generate user-friendly reports which vary from
project summary to individual task status, and these are customizable to meet
requirements. A feature which exports the project to Microsoft Excel is useful for further
analysis of the simple PERT analysis technique. These and many other features aid the
project manager in maintaining the project at various levels. Some of these features are
discussed in Sections 2.4.1 through 2.4.8 [7].
2.4.1 Gantt chart
A Gantt chart is a graphical representation of the duration of tasks over time. This
is a project planning tool that can be used to represent the timing of tasks required to
complete a project. Since Gantt charts are simple to understand and easy to construct,
they are used by most project managers. A variety of Gantt charts are available such as
the Basic Gantt, Milestone Gantt, Bar Gantt, Baseline Gantt, Timeline Gantt, Summary
Gantt, and Spotlight Gantt.
In a Gantt chart, each task occupies one row, and dates run along the top in
increments of days, weeks or months, depending on the total length of the project. The
expected time for each task is represented by a horizontal bar. Tasks may run
sequentially, in parallel or overlapping. As the project progresses, the chart is updated by
filling in the bars to a length proportional to the fraction of work that has been
accomplished on the task. When resources are added to individual tasks, each bar
corresponding to a task in the Gantt chart shows the resource information beside the bar.

26
Gantt charts are generally good for projects that have a small number of tasks.
More complex projects require subordinate charts which detail the timing of all the
subtasks that make up one main task. The important events in the project are called
"milestone" events, marked with a special symbol of an upside-dow n triangle „‟ called
nabla.
Figure 4: Gantt Chart View from IDE Template
These charts illustrate the start and finish dates of the terminal elements and
summary elements of a project. Terminal elements and summary elements comprise the
work breakdown structure (WBS) of the project. Gantt charts can also show the
dependency of relationships between activities (i.e., the precedence network), which can

27
be seen as lines between the activities as in Figure 4. Also shown are the options
provided for custom viewing.
2.4.2 Calendar View
The Calendar view shows the Gantt bars on a desktop calendar. Tasks can be
created, edited, and linked, and resources can be assigned in the same way as in the Gantt
View. The view can be refined using filters to select a particular resource or type of
activity. The calendar can be viewed by selecting View>Calendar or by clicking on the
Calendar icon on the View Bar. A screen shot of a particular week of activities in the
template created for this IDE is shown in Figure 5.
Sunday Monday Tuesday WednesdayThursday Friday Saturday1 2 3 4 5 6 7
Project Name: Test Project
Payload, 13.4 days
Structure and Mechanisms, 31 days
Power, 30 days
Figure 5: Calendar View from IDE Template

28
2.4.3 Network Diagram
The Network Diagram is a logic chart showing all of the tasks and the task
dependencies which are the logical relationship between tasks. This view is used to create
and fine-tune the schedule in a flowchart format. Tasks can be created, edited, and linked,
and resources can be assigned in the same way as in the Gantt View. Select
View>Network Diagram or click the Network Diagram icon on the View bar. Figure 6
shows a part of the network diagram in the template created for this IDE.
Figure 6: Network Diagram from IDE Template
Each rectangular box in the Network Diagram corresponds to a task and a
hexagonal box represents a milestone. Tasks which are one hundred percent completed

29
are marked with a cross on the box. Tasks that have begun but partially finished are
marked with a single line across the box and those that not begun yet will be plain.
2.4.4 Program Evaluation and Review Technique Analysis in Microsoft Project
Microsoft Project implements a quantitative risk analysis technique called PERT
(Program Evaluation and Review Technique). The PERT model was developed in the
1950s to address uncertainty in the estimation of project parameters. According to classic
PERT, expected task duration is calculated as the weighted average of the most
optimistic, the most pessimistic, and the most likely time estimates. Using PERT in
Microsoft Project is very easy using the PERT Toolbar. To enable the PERT toolbar
(shown in Figure 7), on the View menu, from the Toolbars menu choose PERT Analysis.
Figure 7: PERT Analysis Toolbar
Microsoft Project has four views that aid in entering data for PERT analysis:
views for the optimistic, expected, and pessimistic duration, as well as a PERT entry
sheet. The most powerful is the PERT entry sheet which allows the user to enter and see
all durations together. The Calculate PERT button on the toolbar shows the results of

30
calculations performed on optimistic, expected and pessimistic durations in the form of a
Gantt chart.
The classic PERT methodology has a number of limitations. The main problem is
associated with accurately estimating the optimistic, most likely, and the pessimistic
durations of the task.
2.4.5 Resource Rates
Microsoft Project creates budgets based on assigned work and resource rates. As
resources are assigned to tasks and assignment work estimated, the program calculates
the cost (the work times the resource rate), which rolls up to the task level and then to any
summary tasks and to the project level. Resource definitions (people, equipment and
materials) can be shared between projects using a shared resource pool. Each resource
can be assigned to multiple tasks in multiple plans, and each task can be assigned
multiple resources. The application then schedules tasks based on resource availability as
defined in the resource calendars.
2.4.6 Resource Sheet
A Resource Sheet is a list of resources and their related information. The resource
sheet view is used to review, add, or edit data about resources and to copy or paste
information from one resource to another. Different tables can be applied to view
resource information from different perspectives, or a filter can be applied to display only

31
the required information. A typical resource sheet taken from the template is as shown in
Figure 8.
Figure 8: Resource Sheet from the Template of the IDE
2.4.7 Reports
Reports are a series of built in layouts that can be edited and customized for
building new reports. The user can select any of the options available as shown in Figure
9. The Custom selection offers the user a variety of reports related to Cost, Project
Summary, Resources and Tasks. These can be further customized to meet user
requirements by selecting which columns the user wishes to print.
Figure 9: Reports menu from Microsoft Project

32
2.4.8 Tracking Gantt
Tracking Gantt is similar to the normal Gantt chart view, although the bars are
thinner. This view is useful for viewing the Baseline, which is a snapshot of the main
elements of the project before the start of project. A sample Tracking Gantt view is
shown in Figure 10 in which the base lines are compared against the actual work
progress. The baselines are the grey lines with dashed lines on them. This view is helpful
in reports when displaying the current status of the project.
Figure 10: Tracking Gantt View for the IDE Template

33
CHAPTER III
REQUIREMENTS MANAGEMENT
A requirement is a specification given about an individual system function.
Requirements that must be supported by the system are specified in detail and should be
achievable and testable. They are designed taking information from a variety of sources,
such as the customer/user, regulations/codes, and the corporate entity.
Defining requirements is a complex process which uses performance analysis,
trade studies, constraint evaluation and cost benefit analysis. These requirements are
framed by the business analysts or requirements engineers, who discuss the requirements
with the user along with the other stakeholders (people involved in the project). Then
they formulate the feasible requirements and transfer them to the developers in the form
of a technical document. Developers generally follow the requirements provided to them
and develop a system that is expected to meet the user requirements. It can be stated that
these business analysts or requirements engineers form a bridge of communication
between users and developers. Hence, the communication must be done precisely, so that
there will be a minimal difference between the user requirements and the final system at
the end of the project [11].

34
Section 3.1 of this chapter describes the procedures used in requirements analysis.
Section 3.2 gives an introduction to the Cradle software, Section 3.3 describes the Cradle
Modules, and Section 3.4 describes the Cradle Components. Cradle functionalities are
discussed in Section 3.5, which will show why Cradle is used in this IDE. Section 3.6
explains model-based systems engineering, which uses diagrams to illustrate the
requirements in Cradle Software.
3.1. Requirements Engineering
Requirements are the foundation of a system and form the basis for the design,
manufacture, test and operation of a system. As each requirement has a cost impact on
the overall system, it is necessary that an optimum set of requirements be specified before
development. Modifying requirements later in the development cycle has a significant
cost impact on the system, and hence care must be taken when defining them. A survey
by the Standish Group6 shows the importance of requirements engineering. The analysis
of more than 352 companies reporting on more than 8,000 software projects showed that
[12]:
a. Of all software projects, about 31 percent are canceled even before they were
completed accounting for a waste of $81 billion.
b. About 53 percent of the projects were about 189 percent of their original estimate
cost.
6 The Standish Group is an Information Technology leader in project and value performance, formed in 1985 to collect case information on real IT failures and environments.

35
c. In large companies, only about 9 percent of the projects were completed on time
and within budget.
d. In small companies, only about 16 percent of the projects were completed on time
and within budget.
In systems engineering and software engineering, requirements engineering
encompasses all of the tasks that go into the initiation, scoping and definition of a new or
altered system. Conceptually, requirements engineering includes three types of activities:
a. Requirements elicitation is the task of communication with customers and users to
determine what their requirements are.
b. Requirements analysis determines whether the stated requirements are unclear,
incomplete, ambiguous or contradictory and resolves these issues.
c. Requirement recording is documenting the requirements in various forms such as
use cases, process specifications, and natural-language documents.
During the elicitation period, performed in an iterative fashion, new requirements
may be added or the existing modified. This is especially necessary in developing or
changing an existing system because the requirements can clarify the important issues
between the stakeholders and developers and because:
a. End users may not know exactly what they want.
b. Users may insist on new requirements after the cost and schedule have been fixed.
c. Technical personnel and end users may use different terminology which may lead
to problems when final product is delivered.
36
Requirements analysis helps to create the environment and relations between
stakeholders and can be a long and arduous process. The process may include holding
interviews or focus groups and thereby developing prototypes and use cases.
Requirements analysis is also called requirements engineering, requirements
specification, system analysis, or operational concept documenting.
Today there are many software tools on the market to manage these requirements.
Of these, Analyst Pro, AxiomSys, ClearSpecs Composer, Cradle, IBM Rational Rose are
just a few. In this IDE, Cradle Version 5.3 is being used because of the features it
provides, which will be discussed in the following sections.
3.2. Cradle
T hreeS L ‟s Cradle is a multi-user, multi-project, systems engineering
environment, and it can span the entire systems and software development lifecycle. It
“provides a set of tools that can integrate all project phases, activities and deliverables
within a single, configuration managed, access controlled framework” [13]. Cradle can
also be used as a web portal for project information in an integrated systems engineering
environment.
All project activities can be defined within a project schema. Cradle‟s multi-user,
high capacity database can manage huge volumes of data, which allows requirements
(and other item types) to contain text, tables, graphics etc. Database items can also be
linked to external data objects such as URLs and data in other databases.

37
Cradle facilitates requirements to be linked to a wide variety of Unified Modeling
Language (UML), use case, functional, behavioral, dynamic and architectural models.
They can also be allocated to business processes and operational sequences, which in turn
can be allocated to functions, classes, etc. Estimation of performance and budget
aggregation, along with allocation within and across these architectures, is fully
supported by Cradle. It also provides resources to develop the models for hardware and
software, along with the generation and reverse engineering of source code.
The requirements for designing a small satellite must include its objectives,
specifications, physical description, functional requirements, power management and
distribution, command and data handling, attitude determination and control,
environmental performance, and testing.
The payload accommodation requirements may include details of mass, geometry,
thermal interfaces, power, and electromagnetic interference limits along with other
important data. The mission architecture adds further requirements such as on-board data
processing, communication links, batteries, propulsion, and reliability. These and other
requirements should specify the details of every system that is related to the satellite that
is being developed. These requirements give the subsystem specialist an idea of what and
how a particular subsystem needs to be implemented.
These requirements should be made available to the whole team including the
customer and other stakeholders. This is necessary so that during common reviews, such
as a Preliminary Design Review (PDR) or a Critical Design Review (CDR), the team can
take corrective actions, if needed, decide on elements which need to be included, or

38
decide on the modification of existing elements. These reviews also give an idea of the
progress of the project and aid in amending future timelines accordingly.
3.3. Cradle Modules
Cradle modules are various interfaces that are used for communicating with the
Cradle Server, and each module has its own features. For example, modules such as the
Project Data Module or the Workbench provide an interface for managing the whole
project with a user management feature and a requirements management feature. The
Requirements Management module can capture the requirements from Word or Excel.
This Section gives a brief overview of all the modules that are available in Cradle, and
Figure 11 shows various modules that are available.
a. PDM (Project Data Module) provides the main project framework which provides
user management, an extensible project schema, alerts, and viewing requirements.
b. REQ (Requirements Management) is a tool to capture requirements and manage
them from multi-version source documents, with support for Microsoft Word,
Excel and PDF.
c. MET (Metrics) “provides a tool to gather and analyze project statistics from live
project data” [14].
d. SYS (Systems Modeling) provides an analysis and design modeling environment.
e. PERF (Performance Modeling) “provides pre-simulation predictive performance
assessment, budget allotment and data [grouping]” [14].

39
Figure 11: Cradle modules [14]
f. SWE (Software Engineering) is a tool for code generation and the reverse
engineering process.
g. DOC (Document Generator) is a tool for document generation.
h. WEBP (Web Publishing) is for publishing project data for sharing details among
users and other stakeholders.
i. WEBA (Web Access) provides restricted access to project data through web
browsers and the Cradle Web Server.
j. WRK (WorkBench) allows customizable access to project data to create
specialized environments for stakeholders.
3.4. Cradle Components
Cradle supports the full development lifecycle through the use of different
interfaces. Each of these components may support many Cradle modules. These
components are discussed in this section.

40
3.4.1. Toolset
Toolset is a UNIX based interface which comprises most modules provided by
Cradle and is the backbone of Cradle [14]. Most features of Cradle are available with the
Toolset and it is an example for Project Data Module or PDM. It is used for project
administration, requirements management, systems modeling, systems engineering, etc.
3.4.2. WorkBench
WorkBench is a Windows based interface and supports many of the modules that
Toolset supports and presents them in a clear and user friendly interface. This component
is designed for team managers and project managers to use as it provides an easy-to-use
interface.
3.4.3. WEBA (Web Access)
The WEBA module is a component that is also a Cradle module. The web access
component allows distributed teams to work together on the same project at the same
time using a web browser. Web publishing to HTML, XML and SVG7 is provided [13].
7 SVG or Scalable Vector Graphics is for describing 2D graphics and graphical applications in XML.

41
3.4.4. Document Publisher
Document Publisher is a component used to generate complex documents which
may include tables, matrices, diagrams, images, and nested information, from the data
stored in the Cradle Database. It can quickly generate the complete document by
outputting data from Cradle to Microsoft Word.
Toolset, WorkBench and Web Access can all perform administration tasks,
manage, create, amend, delete and manage relationships between items of data and output
that data in a variety of ways.
3.5. Cradle Functionality
Cradle supports a full development lifecycle, can be distributed across a full team,
and licenses can be utilized whenever required. Sections 3.5.1 through 3.5.6 discuss
various functions Cradle provides to the user.
3.5.1. Requirements Capture and Management
The requirements capture process involves gathering documents received from
external or internal sources and producing an initial set of requirements. Each document
formally received for a project is termed a source document, whose content has to be
analyzed. Each statement will be satisfied by, and cross referenced to, one or more

42
formal requirements. Other forms of data can be captured into Cradle as items called
Frames which can contain data in the form of text, images, documents, and video [14].
Cradle is fully integrated with Microsoft Word, Microsoft Excel, and Adobe PDF.
With the interface shown in Figure 12, it provides a requirements capture facility, which
scans customer statements, extracts requirements and assumptions, and creates cross
references to the original document. The user can login into a particular project and select
all items, sections, and tables that need to be captured and exported.
Figure 12: Cradle Capture Interface in Microsoft Word

43
The requirements capture process essentially creates and maintains a set of cross
references between carefully identified statements within source documents and
requirements derived from them. These requirements are further engineered to produce
the set of formal requirements which form the basis for the development of the system.
In order to attain a consistent level of detail between requirements sets, a
sequence of operations called focus and split operations are performed on the original
captured requirements, transforming them into improved requirements set for the system.
Splitting requirements is an approach often used to split large requirements sets, in which
the requirement is subdivided into lower-level, more detailed parts. In a focus operation,
several requirements are combined together into a single requirement.
3.5.2. Analysis
Different models are considered for the requested system, which can be developed
using a wide range of recognized modeling methodologies. Each diagram has
specifications and Data Definition entries, which can be linked to the initial requirements.
This allows each aspect of any model to be traced to one or more requirements at any
stage of the development process. Examples of modeling methodologies are discussed in
Section 3.6.

44
3.5.3. Systems Design
The model is developed based on the requirements, and the lead teams track the
process. Any changes that are made which may impact another part of the system will
automatically raise an alert, so that other stakeholders will be notified of that change.
3.5.4. Testing
Testing can be done by linking the initial requirements to specific functions, to
specific architecture, to specific tests, and to test results. This records, in a definable and
traceable manner, how every requirement is satisfied.
3.5.5. Implementation
Requirements can be tracked in Cradle from the initial capture stage, and all
models and proposed solutions can be regularly checked against them. This insures that
the implementation will work well, since changes made to the requirements can be
managed, and any impact upon the system can be viewed by the alert system.
3.5.6. Formal Delivery
With the help of Document Publisher, the final documentation for the system can
be produced, showing how every requirement agreed to in the contract has been satisfied,
implemented and tested.

45
3.6. Model-Based Systems Engineering
Model-based systems engineering is a multi-faceted discipline that utilizes
diagrams as a means of interpreting and communicating functional and behavioral
aspects of models. Many diagram types, such as an Activity diagram, a Behavior
Diagram, a Class Diagram, a Data Flow diagram, a Process Flow diagram, a State Chart
diagram, and a Use Case diagram, can be used for both analysis and implementation in
Cradle. Some of these are discussed in this section [14].
3.6.1. Class Diagram
A Class Diagram is the basis of Object Oriented (OO) analysis and design. A
Class Diagram consists of the classes of the system, their interrelationships, and the
operations and attributes of the classes (defined by Process Specifications, PSpec). The
PSpec for a class is mandatory, because Cradle stores the set of class attributes and
operations not within the Class Diagrams, but within frames of the PSpecs. Each instance
of a class on a Class Diagram may have a different symbolic representation. A class is
said to be defined in the package that contains it, but may be declared within any other
package that the designer requires.
Classes exhibit relationships with other classes. These relationships range from a
simple association, through a part-of-aggregation or composition relationships, to
inheritance relationships. These relations are associated with a connection symbol, which
can be 0, 1, an integer or * (many). Navigation can be added to the relationships by

46
symbols that include arrowheads. The navigation for a relationship indicates the direction
in which it can be queried. By default, relationships are bidirectional. Figure 13 shows a
sample class diagram for the Users class.
Figure 13: Class Diagram of the Users Class
3.6.2. Activity Diagram
In an Object Oriented (OO) Unified Modeling Language (UML) model, the static
representation of the system is a set of Class Diagrams. Each class may have an
associated Activity Diagram to show the internal behavior and/or algorithm for the class.
The Class Activity Diagram shows one or more parallel sequences of possible behaviors
distributed along a timeline, which in turn may have branches and optional
synchronization.

47
An Activity Diagram represents a set of component activities that are required to
describe the behavior of a class. The Activity Diagram shows these component activities
along a vertical timeline, which may be split into branches and associated
synchronization points to show concurrency as in Figure 14. Activity diagrams contain a
time-sequenced representation of the functionality of a class, and are related to the class‟s
associated State Chart diagram.
Figure 14: Activity Diagram for a Print Class
48
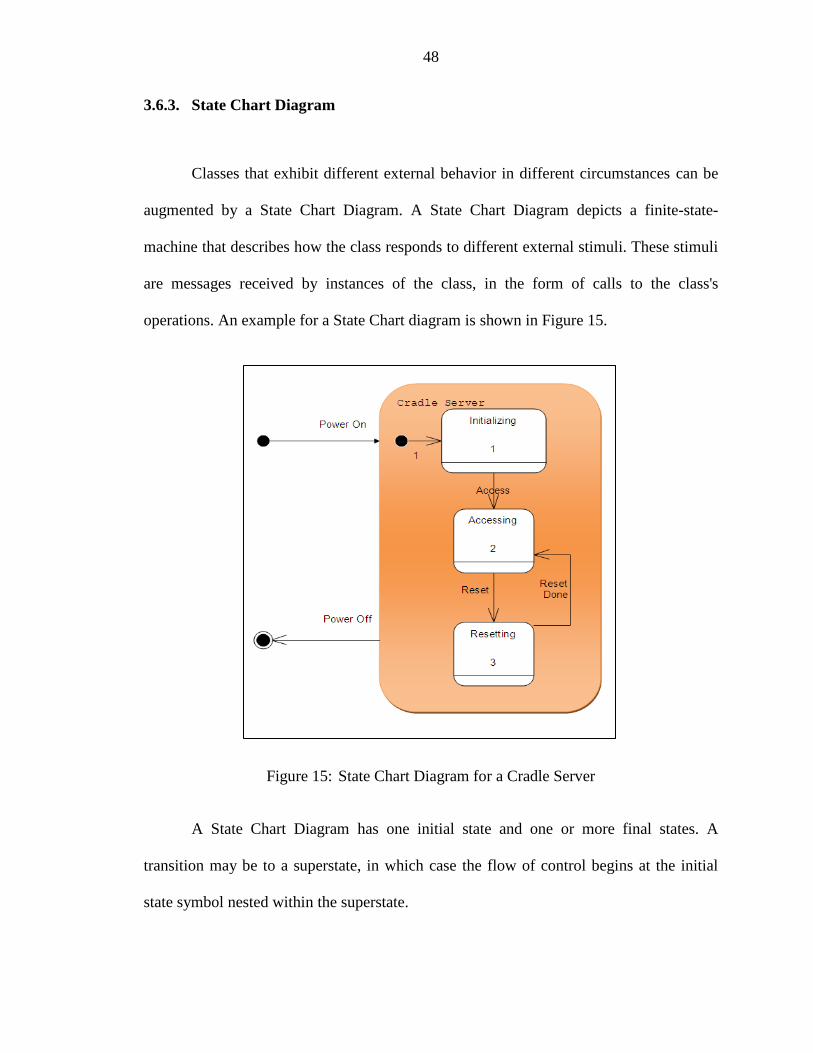
3.6.3. State Chart Diagram
Classes that exhibit different external behavior in different circumstances can be
augmented by a State Chart Diagram. A State Chart Diagram depicts a finite-state-
machine that describes how the class responds to different external stimuli. These stimuli
are messages received by instances of the class, in the form of calls to the class's
operations. An example for a State Chart diagram is shown in Figure 15.
Figure 15: State Chart Diagram for a Cradle Server
A State Chart Diagram has one initial state and one or more final states. A
transition may be to a superstate, in which case the flow of control begins at the initial
state symbol nested within the superstate.

49
A superstate may contain more than one set of nested states and transitions. Each
set can be separate from all other sets having their own initial state and final state
symbols. These sets are considered to be running concurrently. A transition from a
superstate is considered to come from any or all of the states within it. A superstate may
have superstates nested within it, of which each may contain states and transitions, and
other superstates [14].
3.6.4. Use Case Diagram
Use Case Diagrams are used to describe the interaction between a system and its
environment and are used extensively in object oriented programming. Each use case
shows how the system interacts with the users and other systems to achieve a particular
goal. An object oriented model is begun by examining the interaction between the system
under study and its environment.
A Use Case diagram represents the environment as a set of external actors who
participate in classes of interaction with the system. Each class of interactions is called a
use case. Each use case contains one or more possible sequences or flows of events
between the system and the environment. These flows can be a normal sequence or those
related to alternate cases or error-handling situations. A scenario is a particular route
through the normal, alternate, or error use case flows, and is normally chosen to
emphasize a particular alternate sequence or a particular exceptional case. Common
behavior among use cases may be shown in a shareable use case marked with a border. A
sample Use Case scenario for the IDE is shown in Figure 16.

50
Figure 16: Use Case Diagram for IDE
Cradle allows hierarchies of Use Case diagrams, in which a use case can be
expanded into a lower-level diagram, either to show more detail or to show alternate
scenarios within the use case.

51
CHAPTER IV
DESIGN SIMULATIONS
A simulation may be defined as a replica or a model of a real system, which,
when passes certain simulated tests, demonstrates that the real product can be built.
Simulations aid the designer in understanding basic research principles and analytical
techniques, and aid researchers in exploring new analytical techniques applied to a
problem. These simulations can serve as a tool for teachers, evaluators and
methodologists, to address complex analysis, theories and assumptions. The analyst
designs the simulation based on a known model, and analyzes its performance when
various changes have been introduced. This is possible because the simulations facilitate
direct manipulation of the model to see how the results change and the analysis is
affected [15].
Simulations are easier to analyze than analyzing real data, because the analyst
never perfectly knows the real-world process that caused the particular measured values
to occur. In a simulation, the analyst can control factors making up the data and
manipulate them to see their affect on the analysis. Simulations can also be more
advantageous than abstract theory for research topics because they enable the analyst to
interact directly with the model, change assumptions, and develop a good system.

52
Section 4.1 of this chapter presents an overview of the advantages of using
simulations. Section 4.2 gives an introduction to Ansoft Simplorer software, while
Section 4.3 discusses some of the features provided by Simplorer software. Section 4.4
discusses an example of a PID speed control for a DC motor with a three phase rectifier,
and an example of an analog-to-digital converter design.
4.1 Advantages of Simulations
The main advantage of simulations is that they provide practical feedback for real
systems. This allows the user to explore alternative designs for a system without actually
building the system, and hence eliminates the alternatives that do not improve
performance or service quality. Studying a range of alternatives also helps in identifying
various properties of the system.
Another benefit of simulations is that they permit users to study a system at
different levels of abstraction. Because of this, the user can understand the details and
interaction between the high level components of the system. This permits the user to
study the overall system without becoming overwhelmed by the complexity of the system
that accrues as the lower-level details are added. The entire system can then be built upon
the “top -dow n” technique. W orking at a higher level of abstraction also facilitates rapid
prototyping, in which preliminary systems are designed quickly for the purpose of
studying the feasibility and practicality of the high-level design.

53
Simulation modeling tools allow more agility and rapid results as compared to
load testing on a test bed. It permits testing and analysis to proceed without constructing
the actual system. The model can be modified in less time, and new results can be
obtained quickly [16].
Simulations can also be used as an effective means for teaching or demonstrating
concepts to students. Simulations which can dynamically show the behavior and
relationship of all the system components provide the student with a meaningful
understanding of the system's nature.
Simulation modeling makes possible the exploration of many options quickly,
leading to better understanding and decision making. In summary, the benefits of
simulation modeling are:
a. Easy exploration of a wide range of alternative approaches.
b. A test bed is not required to run the load tests.
c. Flexibility to apply new alternatives and also results can be obtained more
rapidly.
d. Cost effectiveness, since there are no costs to buy parts to build a system.
Simulations also have the advantage of allowing large number of tests of a
problem with minimal cost. Also the models and simulations results are easily accessible
over a network and are portable. Software available today allows the user to simulate
various systems in various domains. Software to simulate aerospace, electromechanical,
and physical systems, 3D models, and many other types of systems are available. These

54
software provide features such as exporting and recording results. In this IDE Ansoft
Simplorer v 7.0 is used for electrical circuit simulations and satellite design.
4.2 Ansoft Simplorer
Ansoft is a developer of electronic design automation (EDA) software which
designs state-of-the-art products, such as electromechanical components and systems,
power electronics, wireless products, ICs and printed circuit boards (PCBs). Simplorer®
is a simulation package from Ansoft for electrical circuit simulations. It is used for the
simulation of large-scale, multi-domain systems commonly found in the automotive,
aerospace/defense and industrial automation industries. The wide range of modeling
techniques, statistical analysis capability, and adherence to IEEE standards, facilitate the
reduction of modeling time and increase engineering efficiency when designing
electrical, mechanical, power-electronic, and electromechanical systems using Simplorer.
The software features powerful model-generation tools, model libraries, co-simulation
capability, and VHDL-AMS modeling techniques.
“S im plorer's unique sim ulator coupling and co -simulation technologies utilize a
data exchange backbone, which auto-interactively selects optimum simulators with
numerical algorithms specifically tuned for the multi-domain nature of electromechanical
system s” [17]. These technologies allow users to create models in various domains, at
different levels of abstraction, and simulate complex electromechanical systems quickly
and easily.

55
4.3 Features of Simplorer
Simplorer supports linear, non-linear, and continuous signal systems with various
analysis types such as DC, AC and transient analysis. It can also interact with other
Ansoft software such as Maxwell, Q3D Extractor, and RMxprt, along with third party
software such as MATLAB, Simulink, MathCAD, and C/C++.
Simplorer also features statistical analysis and optimization tools such as Monte
Carlo, 3D graphic, and Genetic Algorithm. It also supports scripting in Visual Basic, Java
and Tcl/Tk. It has a fast and numerically stable circuit simulator, and a block-diagram
system simulator for signal analysis and control design. Simplorer also incorporates
VHDL-AMS, the IEEE industry-standard modeling language for analog, digital, mixed-
signal, and multi-domain systems [17].
With a wide range of modeling techniques, statistical analysis capability and
adherence to IEEE standards, Simplorer significantly reduces modeling time, the number
of physical prototyping iterations and increases engineering efficiency when designing
automotive, aerospace, electrical, power electronics, and electromechanical systems.
Sections 4.3.1 through Section 4.3.5 explain some of the features provided by Simplorer.

56
4.3.1 Creating New Library Elements
Simplorer allows user to add new elements to the existing library and save them
for later use. To create new libraries in Simplorer the following steps must be followed.
a. Choose File>New Library in the Model Agent, or New Library on the shortcut
menu of a tab in the Model Agent, Schematic, or Symbol Editor.
b. Define the library name and location and click Save.
c. Click New in the Resource Tables area and select a language for model text
strings and click OK. A new set of entries appears in the list.
d. Repeat step c to add more than one language.
e. Click New in the Simulation Tables area and select SML20 for the simulation
description used in version 7.0 and click OK. A new set of entries appears in the
list. Repeat this to add another modeling language.
f. Click OK to create the new model library.
The model library will be inserted into the model tree without a model. Models
can be inserted via Element>New or by dragging and dropping from other libraries. The
name for the model library and language resources can be modified later. An example
illustrating how to create an analog to digital converter (ADC) as a new library element is
given in Section 4.4.3.
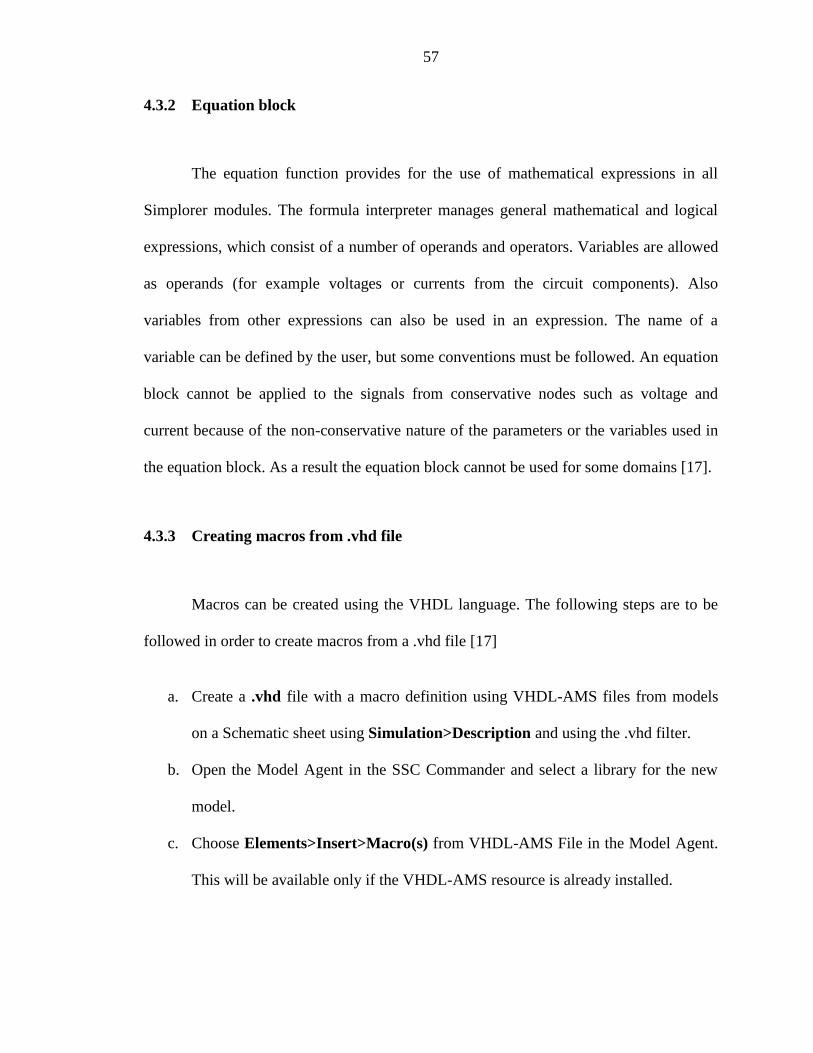
57
4.3.2 Equation block
The equation function provides for the use of mathematical expressions in all
Simplorer modules. The formula interpreter manages general mathematical and logical
expressions, which consist of a number of operands and operators. Variables are allowed
as operands (for example voltages or currents from the circuit components). Also
variables from other expressions can also be used in an expression. The name of a
variable can be defined by the user, but some conventions must be followed. An equation
block cannot be applied to the signals from conservative nodes such as voltage and
current because of the non-conservative nature of the parameters or the variables used in
the equation block. As a result the equation block cannot be used for some domains [17].
4.3.3 Creating macros from .vhd file
Macros can be created using the VHDL language. The following steps are to be
followed in order to create macros from a .vhd file [17]
a. Create a .vhd file with a macro definition using VHDL-AMS files from models
on a Schematic sheet using Simulation>Description and using the .vhd filter.
b. Open the Model Agent in the SSC Commander and select a library for the new
model.
c. Choose Elements>Insert>Macro(s) from VHDL-AMS File in the Model Agent.
This will be available only if the VHDL-AMS resource is already installed.

58
d. Select the VHDL-AMS file with macro description. The dialog displays all
available macro definitions in the VHDL-AMS file.
e. Define the title and language for the macro identified by the function, and click
Insert and repeat the steps if more than one macro is contained in the source
code.
f. The model completed and integrated in the selected library can be changed at any
time until it is locked.
4.3.4 VHDL-AMS
The VHDL-AMS Basic Library has been developed to support the user with the
basic functionality, circuit components and blocks. The models have been developed
according to the IEEE 1076.1 (VHDL Analog and Mixed Signal Extensions Standard)
[17].
The functionality of all VHDL-AMS models is a subset of that available with the
equivalent SML models. Also, the VHDL-AMS and VHDL models do not use wizards to
parameterize the models. Advantages of VHDL-AMS are the model exchangeability
between the simulation tools, multi-level modeling, multi-domain modeling and mixed-
signal modeling which supports analog and digital and multiple modeling styles such as
behavioral and dataflow.
VHDL-AMS models may be used in parallel with SIMPLORER models. All
VHDL-AMS models are simulated by the analog simulator and the digital solver. It is
possible to view the inputs and outputs of the VHDL-AMS model using the appropriate

59
analog or digital display element. Also the internal values used within the architecture of
a model can be viewed in the display graphs and shared as variables between models. If
the VHDL-AMS design needs to be exported to other simulators, then the internal values
of the model should not be used outside the model.
4.3.5 Symbol Editor
Every component in a model library has a symbol which is displayed when the
component is placed on the Schematic sheet. Component symbols are language
dependent, and each language can provide its specific symbol. With the Symbol Editor,
modification of existing component symbols is possible.
Along with the graphic properties, optional features can be defined, such as
switch areas and conditions for symbol changes during a simulation process. The Symbol
editor can be used for creating/modifying the parts of an element symbol, modifying
symbols, editing pins, creating animated symbols, creating interactive symbols, and
modifying representations and displays.
Simplorer provides many other programs depending on the requirement.
Programs that are available with Simplorer are Schematic, Editor, Day-post processor,
Model Agent, Symbol Editor, Experiment Tool, Analytical FA, C Model Wizard, Report
Manager, and an Excel plug-in [17]. Simplorer Schematic is used to draw a schematic of
a model. This is discussed with an example of a PID speed control for a DC motor with a
three phase rectifier in Section 4.4.1 and Section 4.4.2. Another example of how to add a
new element is given in Section 4.4.3.

60
4.4 Simplorer Examples
A three phase full wave converter operating with a DC motor is given as an
example to illustrate how to use a Schematic sheet. The speed control for this DC motor
is done with a PID controller and is discussed in Section 4.4.2. To demonstrate how to
add a new element to the library of elements already provided by Simplorer, another
example of an Analog-to-Digital converter is given in Section 4.4.3.
4.4.1. Three Phase Full Converter with DC Motor
Rectification is the process of converting an alternating current or voltage into a
direct current or voltage. This conversion is achieved using a variety of circuits based on
switching devices such as diodes, thyristors, power transistors, etc. These rectifiers can be
classified into three categories: uncontrolled, full-controlled and half-controlled.
The control of the rectification can be done by Phase Angle Control in which
switching devices such as thyristors can be controlled to switch on and off periodically
with a certain phase, by setting a firing angle. The firing angle determines the continuous
or discontinuous operation of the rectifier.
Three phase rectifiers are commonly used in large power applications, using step-
up and step-down transformers. As an example, a three phase full converter with a DC
motor developed in this IDE is shown in Figure 17. The load, a DC motor in this case, is
fed via a three phase half-wave connection, and the return path via the other half of the
supply (with no need for a neutral). The upper group of the diodes is called the positive

61
half group as they operate during the positive half of the supply, and the other set is
called the negative half group [18].
Figure 17: Three Phase Full Converter with DC Motor
The diode Df is called a freewheeling diode, which transfers load current away
from the rectifier whenever the load voltage goes into a reverse state. This diode also
prevents a reversal of the load voltage (except for small voltage drop across the diode).
The capacitor C1 is used for power factor (PF) correction at the load terminals. The
values of the various parameters used are as given below.
a. Voltage Sources Ea, Eb, Ec = 240 V , 50 H z w ith each 120 phase difference.
b. Rectifier Diodes D1, D2, D3, D4, D5, D6, freewheeling diode Df and switch BJT1
values are:
i. Forward Voltage = 0.8 V
ii. R everse R esistance = 100 K Ω
iii. B ulk R esistance = 1 m Ω
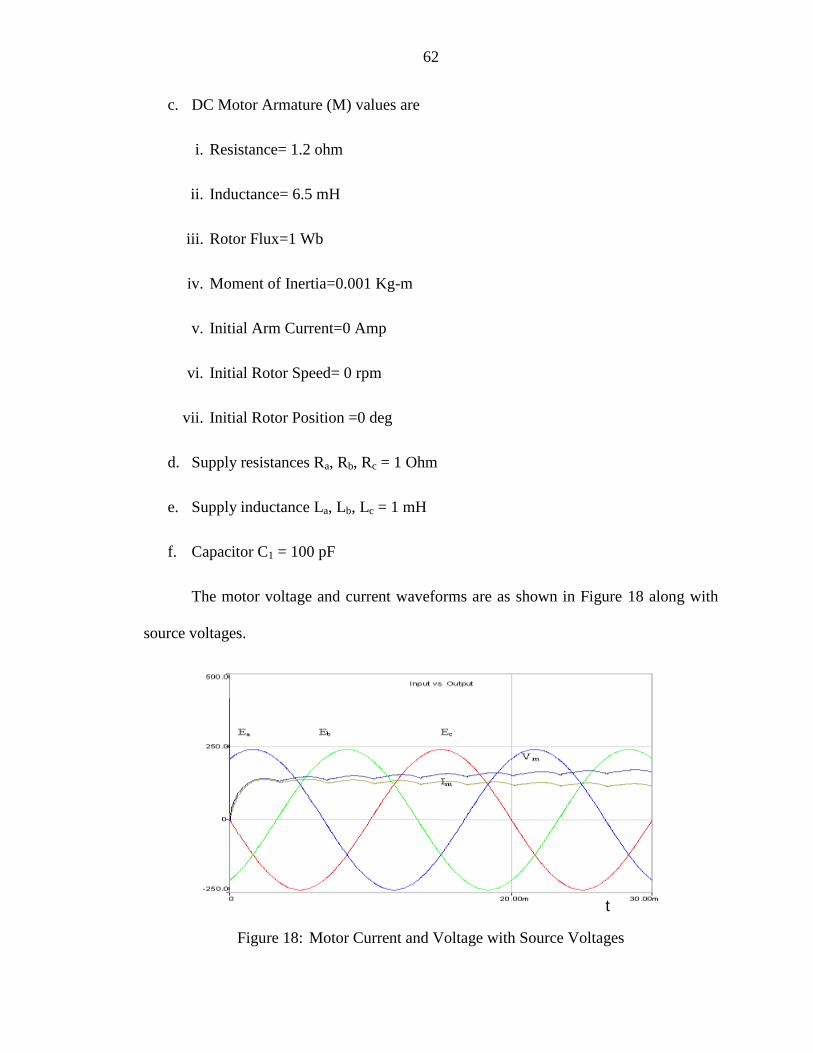
62
c. DC Motor Armature (M) values are
i. Resistance= 1.2 ohm
ii. Inductance= 6.5 mH
iii. Rotor Flux=1 Wb
iv. Moment of Inertia=0.001 Kg-m
v. Initial Arm Current=0 Amp
vi. Initial Rotor Speed= 0 rpm
vii. Initial Rotor Position =0 deg
d. Supply resistances Ra, Rb, Rc = 1 Ohm
e. Supply inductance La, Lb, Lc = 1 mH
f. Capacitor C1 = 100 pF
The motor voltage and current waveforms are as shown in Figure 18 along with
source voltages.
Figure 18: Motor Current and Voltage with Source Voltages
t

63
4.4.2. Proportional-Integral-Differential (PID) Controller
PID feedback controllers are widely used controllers. To control the rotational
speed of the system in this example a PID controller is used. The three parameters
available for the tuning of the PID are proportional gain Kp, integral gain Ki and
derivative gain Kd. These parameters are chosen on a trial and error basis so as to achieve
the desired response of the system.
(1)
The error signal, which is the difference between a set value of the speed and the
measured, is sent to the PID controller. The controller is used to reduce the error to zero.
The controller computes both the derivative and the integral of this error signal. The
controller output will be equal to the sum of proportional gain (Kp) times the error,
integral gain (Ki) times the integral of the error, and the derivative gain (Kd) times the
derivative of the error as shown in the above equation (1). The output of the controller is
then fed back to the system directly or through a switch.
The values of Kp, Ki and Kd are adjusted manually on a trial-and-error basis to
obtain an error of zero. Figure 19 shows the circuit diagram for the speed control of the
DC motor discussed in Section 4.4.1.
The values used for the PID controller parameters in order to obtain good
performance are:
a. Proportional gain Kp = 60,
b. Integral Gain Ki = 1, and

64
c. Derivative gain Kd = 0.2
Good performance was determined by considering the overshoot, settling time,
amplitude and linearity of the response.
Figure 19: DC Motor Speed Control Using a PID Controller
The applied load values are:
TABLE II: DATA PAIRS OF EXTERNAL LOAD (N) No x-axis:
t[s]
y-axis:
Y 1 0 0
2 0.075 50
3 0.1 50
i. Period = 0.1s
ii. Phase = 0 deg
iii. Periodic = YES

65
It can be seen from Figure 20, the speed and voltage of the DC motor are
suddenly dropped whenever a load is applied at regular intervals. The current of the DC
motor increases so as to meet the load whenever is applied.
Figure 20: Motor Speed, Current and Voltage waveforms with Load
4.4.3. Analog-to-digital Converter
The Analog-to-Digital (A/D) Converter module in a PIC microcontroller has five
inputs for the 28-pin microcontrollers and eight for the 40-pin microcontrollers. In
general the analog input charges a sample and hold capacitor, whose output is the input
into the ADC converter. The converter then generates a digital result of this analog level
using successive approximation. The A/D conversion of the analog input signal
magnitude, at a particular instant of time, results in a corresponding 10-bit digital
number. The A/D module has high and low voltage reference input. For the A/D

66
converter to meet its specified accuracy, the charge holding capacitor must be allowed to
fully charge to the input channel voltage level [19].
Mathematically the digital equivalent of an analog input is calculated by the
repeated division of the analog input value w ith „2‟ or 10 (in binary), until a remainder of
zero is obtained. Then the digital (binary) equivalent of the analog input is obtained by
the combination of all the remainders with the last remainder as the most significant bit.
Using the symbol editor, the symbol for the PIC is drawn and is shown in Figure
21. After the element has been designed and locked for deployment, the user cannot
change the symbol or the behavior of the element. Therefore user-defined elements also
represent the same accessibility of the libraries, restricting the ability of the user to
change the behavior of the user-defined libraries.
8
Figure 21: PIC symbol after editing using Symbol Editor
Using the properties of the PIC_ADC block, the user can specify the pins to use.
Also the type of each pin can be specified as a bit, real, or electrical which indicates the
8 All output pins that are available for the PIC_ADC block are not shown in the figure. They can be viewed by setting specific pins to be visible in the properties page of the element.
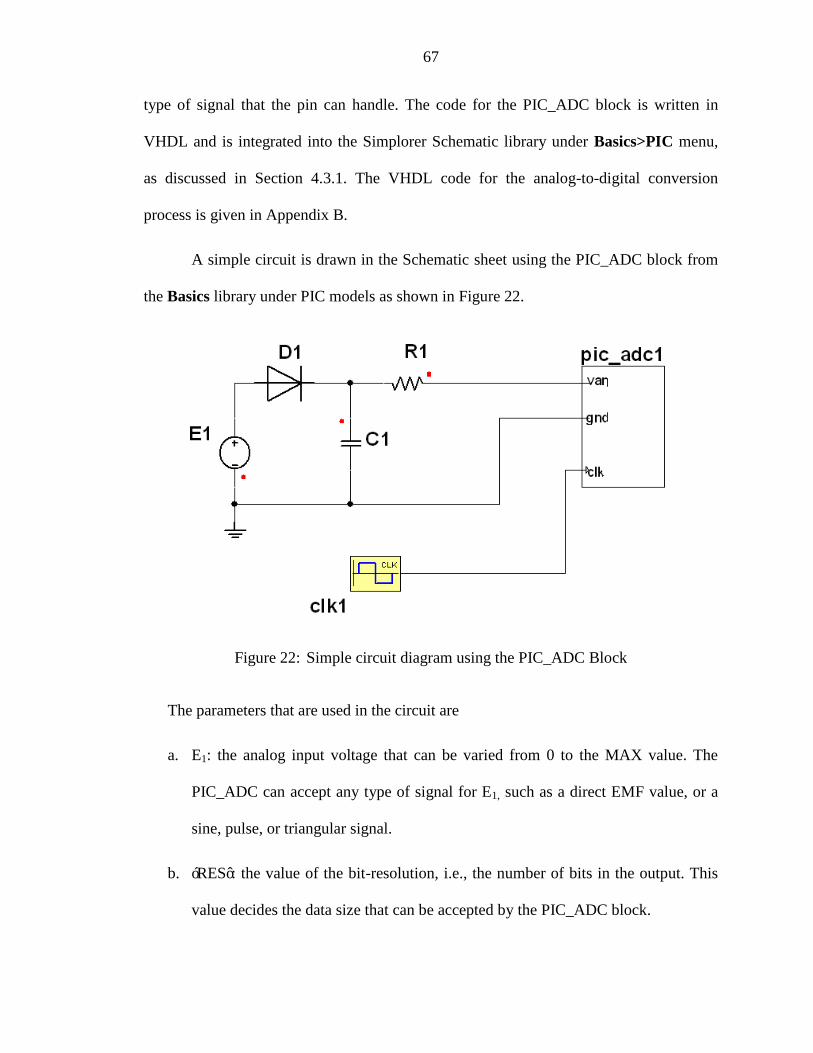
67
type of signal that the pin can handle. The code for the PIC_ADC block is written in
VHDL and is integrated into the Simplorer Schematic library under Basics>PIC menu,
as discussed in Section 4.3.1. The VHDL code for the analog-to-digital conversion
process is given in Appendix B.
A simple circuit is drawn in the Schematic sheet using the PIC_ADC block from
the Basics library under PIC models as shown in Figure 22.
Figure 22: Simple circuit diagram using the PIC_ADC Block
The parameters that are used in the circuit are
a. E1: the analog input voltage that can be varied from 0 to the MAX value. The
PIC_ADC can accept any type of signal for E1, such as a direct EMF value, or a
sine, pulse, or triangular signal.
b. „R E S ‟: the value of the bit-resolution, i.e., the number of bits in the output. This
value decides the data size that can be accepted by the PIC_ADC block.

68
c. Clock input: the value can be varied from 1 KHz (1ms)-50 KHz (20µs)
The voltage at the pin Van referenced to ground is measured and the ADC
calculates the equivalent digital value.
Outputs viewed in 2D Digital Graph9 (selected from displays of Schematic
library) are as shown in Figure 23 through Figure 26 with varying values of MAX, Input
and Clock.
Figure 23: With MAX=8 RES=8 and Input=5 V (EMF value), Clock=1 ms
9 The 2D Digital graph can display the output in digital scale for each parameter selected.

69
Figure 24: With MAX=255 RES=8 and Input=255 V (EMF value), Clock=1 ms
Figure 25: With MAX=255 RES=8 and Input=10 V (Pulse input), Clock=1 ms

70
Figure 26: With MAX=255 RES=8 and Input=255 V (Pulse input), Clock=20 us
Thus, Ansoft Simplorer is used to simulate electrical circuits in this IDE. For
mechanical, orbital, thermal, and stress simulations, other software such as Ansoft
Maxwell and Satellite Tool Kit (STK) are used. These have not yet been integrated into
this IDE. Software packages such as Simplorer and Maxwell can even communicate with
each other, facilitating the ability of developers to share their simulations with one
another.

71
CHAPTER V
IMPLEMENTATION
An Integrated Design Environment (IDE) for Small Satellites has been
implemented in the Visual Basic.Net programming language. The operating system used
is Microsoft Windows XP Professional. Microsoft Project has been implemented by
using its COM components provided in the library of Visual Basic.Net. A template has
been created to assist the user in identifying the major steps involved in designing a
satellite. This template can be accessed directly from the IDE for any project. ThreeSL
Cradle and Ansoft Simplorer are accessible directly from the IDE. These are coded to
open directly, since they need login details to open a particular project. Also, since both
Cradle and Simplorer are server-licensed, there have been security issues, keeping their
libraries inaccessible. The system used is an Intel Pentium 4 processor running at 3.0
GHz with 512 MB memory.
Section 5.1 of this chapter gives a brief overview of the IDE and contains the
screenshots of pages developed to build a satellite. Section 5.2 gives an idea of how
project management is performed using Microsoft Project. Section 5.3 discusses how
T hreeS L ‟s C radle softw are is used for requirem ents management. And Section 5.4 shows
how electrical simulations are done using Ansoft Simplorer.

72
5.1 The Integrated Design Environment
The IDE is designed in a way that a user can access any particular file at any stage
of the satellite design life cycle. It also allows the user to work on more than one phase at
a time. Links are provided to sponsored page for specific information or for online help.
The main menu consists of three options: File, Tools and Help. From the File
menu, the user can create a new project or open an existing project or file. There is also a
facility for printing any document available on the network which belongs to any project.
The Tools menu provides an exporting feature through which the user can export a
screenshot of a diagram or design to a Microsoft Word document. This feature and the
IDE Help are yet to be implemented.
The first page which is accessed when the IDE is opened is shown in Figure 27.

73
Figure 27: IDE Homepage
When the user clicks on the Start button, the IDE loads a second page which has
the links to the six phase process for the satellite appear. Also, from the side menu, the
user can visit a particular software website for help and technical support. A screen shot
of this page is shown in Figure 28.

74
Figure 28: IDE Design Phases Screen
Since the Design phase involves more than one design domain, another window is
created which can access various simulation tools such as Simplorer, Maxwell, and the

75
Satellite Toolkit. So far only the Ansoft Simplorer implementation has been completed. A
screenshot for this is shown in Figure 29.
Figure 29: IDE Subsystems Design Phase Screen
5.2 Project Management
For project management, Microsoft Project has been incorporated in this IDE. A
template has been created to assist users in identifying the key project elements involved
in developing a satellite. Time scheduling and resource management for various tasks are

76
implemented in this template. All tasks that are involved in building a satellite are listed
as Table I in Section 2.3 of Chapter II. Also various graphs for this template are provided
in Chapter II. Resources for each task listed in Table I are given in Appendix A as Table
III.
5.3 Requirements Management
In this ID E requirem ents m anagem ent is achieved using T hreeS L ‟s C radle
software. Various components and functionalities of Cradle are discussed in Chapter III.
Typical requirements for developing this IDE are managed with the help of Cradle and
are provided as an example under project code IDE1. Some of the available modeling
methodologies are discussed in Section 3.6 along with the figures.
5.4 Design Simulations
For simulating electrical systems for satellite design, in this IDE Ansoft Simplorer
v7.0 is used. As an example a three phase rectifier with a DC motor is simulated in
Section 4.4.1 of Chapter IV, with Section 4.4.2 discussing its speed control using a PID
controller. A periodically switching load is applied to the DC motor. The motor voltage,
current, and its speed are plotted against the pulsating load as is shown in Figure 18 and
Figure 20.

77
Another example is an analog-to-digital converter (ADC) module of a PIC
microcontroller is discussed in Section 4.4.3 to illustrate how an element is added to the
library (discussed in Section 4.3.1). The element is shown in Figure 21 with a simple
circuit application in Figure 22. The output results are viewed in a 2D Digital graph and
are shown in Figures 23 through 26, with various parameters of the converter.

78
CHAPTER VI
CONCLUSIONS AND FUTURE WORK
6.1 Conclusions
In this thesis, an Integrated Design Environment (IDE) for the design of Small
Satellites has been created. This IDE provides an integrated environment for project
management, requirements management and electrical and mechanical simulations. To
provide a systematic approach of design and development, this IDE includes a six-step
process, namely, Concept, Definition, Design, Development, Operation and Disposal.
The IDE provides an easy to use interface for developing a satellite, and the
design page is especially simplified so that a designer can work on any of the subsystems
or development phases of the whole project. Also this IDE reduces the total development
time by reducing the time expended in exchanging files, since the files can be shared over
a network, and the access time, since the designer can open software from a single
interface.

79
Project Management, which is an important aspect of every project, has been
implemented in this IDE using Microsoft Project, and it has been programmed in Visual
Basic.Net using its libraries, i.e., the COM components. Microsoft Project assists project
managers in assigning resources to the tasks, tracking the progress of each task, and
modifying the project plan according to current requirements. It also provides a Project
Server to share the files over a network, publish the information to the internet or to the
local network, providing all the team members access to the updated version of the
project file directly.
T hreeS L ‟s Cradle is used for Requirements Management, which is another
important aspect of a development project. Requirements for developing this IDE are
managed with Cradle and are provided as an example along with the IDE package.
Modeling methodologies such as Class diagrams, Use Case diagrams, State Chart
diagrams, Activity diagrams, etc., can be drawn using Cradle. There is full traceability of
functional, performance and derived requirements with direct association to each model
drawn. Cradle provides Toolset and Workbench as interfaces to manage the
requirements, implement modeling methodologies, and manage projects and users.
Toolset, designed in a UNIX environment, provides almost all the functionalities
of Cradle and can be said to be the backbone of Cradle. WorkBench, developed in the
Windows environment, provides a simpler interface than the Toolset, but it does not
provide some of the features such as modeling diagrams and import/export.
Ansoft‟s Simplorer is used to simulate electrical circuits in this IDE. Simplorer
provides easy access to libraries for modeling various circuits and supports multi-domain

80
simulations. It also supports the addition of new user-defined elements/models to the
existing libraries.
The access time for opening all the software (implemented so far) was measured
and calculated to be about 55 seconds on an average10. The IDE can be run on various
machines, and the minimum PC requirements considered for better functionality of the
IDE are:
a. Processor: Intel Pentium 4 and above and running at 1.73 GHz and above.
b. Memory: 512 MB (1 GB recommended)
c. Hard Disk: 2 GB to install all software
The Aerospace Corporation developed the Small Satellite Design Model (SSDM)
and Small Satellite Cost Model (SSCM), to gather and analyze small satellite technical
and cost data [5]. The IDE, when compared with the above mentioned tools, facilitates
implementation for designers, since the SSDM and SSCM models serve as a preliminary
analysis tools for systems engineers to understand conceptual spacecraft designs. But the
IDE lacks the functionality for gathering preliminary information about the satellite and
providing the designer with a matched model based on the requirements.
The fully developed IDE, when compared to the manual approach of satellite
design, reduces the total design time since the files can be easily shared over the network,
and a designer can work on more than one subsystem at a time.
10 Average is calculated by opening all the software 20 times, on a Pentium 4 processor running at 3.0 GHz with 512 MB RAM.
81
6.2 Future Work
This IDE is in its initial stages of development, and hence there is substantial
amount of future work to be done. This IDE has implemented only the first two phases of
the six-step process successfully, namely, the Concept phase and the Definition phase.
The third phase, the Design phase, has been partially implemented. This IDE has the
flexibility to allow future implementation of the remaining phases in the six-step process.
This IDE does not have a user-authentication process. A database can be
developed which can be used for file management over the network and for user account
management. This database can improve the overall safety and accessibility of all the
files. Based on the past results, with a database there is a possibility of providing a
satellite model in early stages of development by collecting information similar to that of
the A erospace C orporation‟s S m all S atellite Design Model.
This IDE could be made more user-friendly by having a menu bar with options
such as Import/Export, Print, User switching, and Search (for a particular File or Project
over the network). Web publishing and web access features can be included, so that the
user can work from anywhere over the local network or the internet. Another
improvement would be the addition of documentation features for exporting the required
project summary to Microsoft Word, exporting tabular data to Microsoft Excel, and for
assisting users in preparing better presentations.

82
REFERENCES
1. T odd J. M osher, A m anda F . V aughn, “A P latform A pproach to S m all S atellite
D esign,” 54 th International Astronautical Congress of the International
Astronautical Federation, the International Academy of Astronautics, and the
International Institute of Space Law 29, Bremen, Germany, September – 3
October 2003.
2. Allan I. McInnes, Daniel M. Harps, Jeffrey A . L ang, and C harles M . S w enson, “A
system s E ngineering T ool for S m all S atellite D esign,” P roceedings of the 15 th
Annual AIAA/USU Conference on Small Satellites, SSC01-VI-5, 2001.
3. Robert H. Klenke, Moshe Meyassed, James H.Aylor, Barry W. Johnson, Ramesh
R ao and A nup G hosh, “A n Integrated D esign E nvironm ent for P erform ance and
D ependability A nalysis,” Proceedings of the 34th annual conference on Design
automation, D A C ‟97, pp. 184 -189, Anaheim California, ACM 1997.
4. James R. Wertz and Wiley J. Larson, “S pace M ission A nalysis and D esign,”
Third Edition, Microcosm Press and Kluwer Academic Publisher, 1999.

83
5. Todd Mosher, Mark Barrera and Norman L ao “Integration of Small Satellite Cost
and Design Models for Improved Conceptual Design-to-C ost”, T he A erospace
Corporation.
Available: http://www.lr.tudelft.nl/live/binaries/8c2bdbe5-543b-4524-ba08-
8e6cf12eb709/doc/paper04.pdf
6. Acquisition Community Connection, Defense Acquisition University.
Available: https://acc.dau.mil/
7. M ike G len, M V P , “M icrosoft P roject”, T echT rax E zine.
Available: http://pubs.logicalexpressions.com/Pub0009/
8. Microsoft Project, Wikipedia.
Available: http://en.wikipedia.org/wiki/Microsoft_project
9. T im P yron, “S pecial E dition U sing M icrosoft O ffice P roject 2003”, Q ue
Publisher, February 2004.
10. Official Microsoft Project Website.
Available: http://office.microsoft.com/project
11. IBM Reference for Developers.
Available: http://www-128.ibm.com/developerworks/architecture

84
12. T he S tandish G roup, “T he C H A O S R eport” , 1994.
http://www.standishgroup.com/sample_research/chaos_1994_1.php
13. Volere (A sister site to The Atlantic Systems Guild Inc.) Requirements Resources.
Available: http://www.volere.co.uk/
14. ThreeSL Cradle official website.
Available: http://www.threesl.com/
15. William Trochim and Sarita D avis, “C om puter S im ulations for R esearch D esign”.
Available: http://www.socialresearchmethods.net/simul/
16. D onald C raig, “Extensible Hierarchical Object-Oriented Logic Simulation with an
A daptable G raphical U ser Interface”, 1996.
Available: http://www.cs.mun.ca/~donald/msc/node6.html
17. Ansoft Simplorer Official Website.
Available: http://ansoft.com/products/em/simplorer/
18. M D S ingh, K B K anchandani, “P ow er E lectronics”, T ata M cG raw -Hill
Publishing Company Limited, New Delhi, 1998.

85
19. PIC16F87X Data Sheet, 28/40-Pin 8-Bit CMOS FLASH Microcontrollers,
Microchip Technology Incorporated, 2001.
Available: http://ww1.microchip.com/downloads/en/DeviceDoc/30292c.pdf

86
APPENDICES

87
A. Resource Management Table of Microsoft Project Template
TABLE III: ALLOCATED RESOURCES FOR EACH TASK WBS Task Name Days Start Finish %
Finish Cost
($) Hours
1 Project Name: Test Project 198? 5/2/06 1/31/07 42% 160,081 2,000
2 Phase A :Preliminary Analysis/ Concept 38 5/4/06 6/26/06 100% $85,920 2,824
2.1 Mission Needs/ Requirements 17 5/4/06 5/26/06 100% $38,785 1,272
2.1.1 Functional Needs/ Requirements 12 5/4/06 5/19/06 100% $13,715 448
2.1.1.1 Performance 3 5/4/06 5/8/06 100% $2,980 96
2.1.1.1.1 Primary Objective 3 5/4/06 5/8/06 100% $745.00 24
2.1.1.1.2 Payload 3 5/4/06 5/8/06 100% $745.00 24
2.1.1.1.3 Size 3 5/4/06 5/8/06 100% $745.00 24
2.1.1.2 Coverage 4 5/8/06 5/11/06 100% $2,955 96
2.1.1.2.1 Orbit 4 5/8/06 5/11/06 100% $985.00 32
2.1.1.2.2 Swath width 4 5/8/06 5/11/06 100% $985.00 32
2.1.1.3 Responsiveness 10 5/8/06 5/19/06 100% $4,875 160
2.1.1.3.1 Communications architecture 5 5/8/06 5/12/06 100% $1,225 40
2.1.1.3.2 Processing delays 5 5/15/06 5/19/06 100% $1,225 40
2.1.2 Operational Needs/Requirements 6 5/8/06 5/15/06 100% $7,325 240
2.1.2.1 Duration 6 5/8/06 5/15/06 100% $1,465 48
2.1.2.2 Availability 6 5/8/06 5/15/06 100% $1,465 48
2.1.2.3 Survivability 6 5/8/06 5/15/06 100% $1,465 48
2.1.2.4 Data Distribution 6 5/8/06 5/15/06 100% $1,465 48
2.1.3 Constraints 7 5/18/06 5/26/06 100% $13,640 448
2.1.3.1 Cost 7 5/18/06 5/26/06 100% $1,705 56
2.1.3.2 Schedule 7 5/18/06 5/26/06 100% $1,705 56
2.1.3.3 Regulations 7 5/18/06 5/26/06 100% $1,705 56
2.1.3.4 Sponsor 7 5/18/06 5/26/06 100% $1,705 56
2.1.3.5 Environment 7 5/18/06 5/26/06 100% $1,705 56
2.1.3.6 Interfaces 7 5/18/06 5/26/06 100% $1,705 56
2.1.3.7 Development Constraints 7 5/18/06 5/26/06 100% $1,705 56
2.2 Mission Characteristics 23 5/25/06 6/26/06 100% $37,990 1,248
2.2.1 Data Delivery 5 5/25/06 5/31/06 100% $2,450 80
2.2.1.1 Space vs. Ground 5 5/25/06 5/31/06 100% $1,225 40
2.2.2 Communications Architecture 10 5/29/06 6/9/06 100% $7,275 240
2.2.2.1 Data rates bandwidth 10 5/29/06 6/9/06 100% $2,425 80
2.2.2.2 Ground System 10 5/29/06 6/9/06 100% $2,425 80
2.2.3 Scheduling and Control 6 6/12/06 6/19/06 100% $4,155 136
2.2.3.1 Level of anatomy 5 6/12/06 6/16/06 100% $1,225 40
2.2.3.2 Central vs. Distributed 6 6/12/06 6/19/06 100% $1,465 48
2.2.4 Mission Timeline 5 6/13/06 6/19/06 100% $2,450 80
2.2.4.1 Level of timeline flexibility 5 6/13/06 6/19/06 100% $1,225 40

88
2.2.5 Identify system drivers for each 6 6/19/06 6/26/06 100% $16,115 528
2.2.5.1 Size 6 6/19/06 6/26/06 100% $1,465 48
2.2.5.2 On-Orbit weight 6 6/19/06 6/26/06 100% $1,465 48
2.2.5.3 Power 6 6/19/06 6/26/06 100% $1,465 48
2.2.5.4 Data Rate 6 6/19/06 6/26/06 100% $1,465 48
2.2.5.5 Communications 6 6/19/06 6/26/06 100% $1,465 48
2.2.5.6 Pointing 6 6/19/06 6/26/06 100% $1,465 48
2.2.5.7 Altitude 6 6/19/06 6/26/06 100% $1,465 48
2.2.5.8 Coverage 6 6/19/06 6/26/06 100% $1,465 48
2.2.5.9 Scheduling 6 6/19/06 6/26/06 100% $1,465 48
2.2.5.10 Operations 6 6/19/06 6/26/06 100% $1,465 48
3 Draft Mission Definition Document 8 6/27/06 7/6/06 100% $1,945 64
4 Mission Definition Review (MDR) 3 7/7/06 7/10/06 100% $745 24
5 Phase B: Definition/ System Requirements
15 7/11/06 7/28/06 100% $3,880 120
5.1 Draft System Requirements 5 7/11/06 7/17/06 100% $1,270 40
5.2 System Requirements Review 2 7/19/06 7/20/06 100% $550 16
5.3 Allocate requirements to subsystems 3 7/20/06 7/22/06 100% $790 24
5.4 Develop Budgets 5 7/24/06 7/28/06 100% $1,270 40
6 Preliminary Design Review (PDR) 1 7/28/06 7/29/06 100% $265 8
7 Phase C: Design and Analysis 83? 7/31/06 11/17/06 76% $38,381 1,259.2
7.1 Propulsion 8 7/31/06 8/9/06 100% $1,990 64
7.2 Attitude Determination and Control 14 7/31/06 8/17/06 100% $3,430 112
7.3 Communication 21 8/3/06 8/29/06 100% $5,110 168
7.4 Command and Data Handling 16 8/14/06 8/31/06 100% $3,910 128
7.5 Payload 13? 9/11/06 11/11/06 65% $3,286 107.2
7.6 Structure and Mechanisms 31? 9/25/06 11/6/06 23% $7,510 248
7.7 Power 30? 9/18/06 11/13/06 80% $7,270 240
7.8 Thermal 24? 10/9/06 11/17/06 85% $5,830 192
8 Critical Design Review (CDR) 2? 11/16/06 11/20/06 65% $505 16
9 Phase D: Development-Integration and Verification
31? 11/20/06 12/29/06 0% $8,555 279.68
10 Flight Readiness Review (FRR) 2? 1/1/2007 1/2/07 0% $505 16
11 Operational Readiness Review (ORR) 5? 1/3/07 1/9/07 0% $1,225 40
12 Phase E: Operations 9? 1/10/07 1/22/07 0% $2,230 72
13 Phase F: Disposal 7? 1/23/07 1/31/07 0% $1,750 56

89
B. VHDL Code for Analog-to-Digital Conversion
LIBRARY IEEE;
USE IEEE.STD_LOGIC_1164.ALL;
USE IEEE.ELECTRICAL_SYSTEMS.ALL; //Libraries and references
ENTITY PIC_ADC IS //Begin of definition for element PIC_ADC
GENERIC (MIN: REAL:= -1.0; //Minimum limit ,default=0
MAX: REAL:= 1.0; //Maximum limit ,default=1
RES: INTEGER:= 8); //Resolution ,default=8
PORT (TERMINAL VAN, GND: ELECTRICAL; //Terminals Van and GND with input electrical signals
SIGNAL CLK: IN BIT:= '0'; //Clock input signal
SIGNAL VD: OUT BIT_VECTOR (9 DOWNTO 0):= (OTHERS => '0')); //Output digital signals, up to 10 bits
END ENTITY PIC_ADC;
ARCHITECTURE behav OF PIC_ADC IS //Begin of description of PIC_ADC
QUANTITY V ACROSS VAN TO GND; //V is the I/P vol. b/w Van and GND
BEGIN
PROCESS
VARIABLE delta_v: REAL:= 0.0; //Declare variables delta_v and VARIABLE input_hold: REAL:= 0.0; //input_hold calculating digital
// value
BEGIN
WAIT ON CLK;
delta_v:= MAX - MIN; //Set delta_v and input_hold
input_hold:= V - MIN;
IF (CLK'EVENT AND CLK = '1') THEN // When clock is high
FOR i IN RES-1 DOWNTO 0 LOOP //Loop RES down to 0
delta_v:= delta_v / 2.0; // calculate the digital output

90
IF input_hold >= delta_v THEN
VD(i) <= '1';
input_hold := input_hold - delta_v;
ELSE
VD (i) <= '0';
END IF;
IF (v>MAX) THEN //If input is greater than maximum value set all
VD(i) <='0'; // bits high
END IF;
END LOOP;
END IF;
END PROCESS; //End of process and
END ARCHITECTURE; //End of architecture