An Integrated Approach to Video Streaming over Best Effort and QoS Enabled Packet Switched Networks...
55
An Integrated Approach An Integrated Approach to Video Streaming over to Video Streaming over Best Effort and QoS Best Effort and QoS Enabled Packet Switched Enabled Packet Switched Networks Networks Avideh Zakhor UC Berkeley
-
date post
21-Dec-2015 -
Category
Documents
-
view
224 -
download
1
Transcript of An Integrated Approach to Video Streaming over Best Effort and QoS Enabled Packet Switched Networks...

An Integrated Approach to An Integrated Approach to Video Streaming over Best Video Streaming over Best
Effort and QoS Enabled Effort and QoS Enabled Packet Switched Networks Packet Switched Networks
Avideh ZakhorUC Berkeley

Outline
Past work: Unicast Multicast
Experimental resultsFuture work

Problem Overview
Real-time video delivery over best-effort Internet Need RATE-CONTROL for dynamic sharing
Adaptive transport protocolScalable compression
Need ERROR-RESILIENCEReal-time constraint - no retransmissionsBursty traffic - FEC ineffective
No changes of current infrastructure
Exploit interplay between compression/transport

Solution Overview (cont’d)
What is scalable video? Embedded representation - subsets corresponding to
same video at lower rates
Why scalability? Rate-shaping via simple filtering - low
latency/complexity Allows decoding on machines with limited power
Why not MPEG? Pre-compressed MPEG video is unable to respond to
dynamic transmission rate imposed by rate control Severe error propagation from packet loss Scalable MPEG typically generates only 2-3 rates
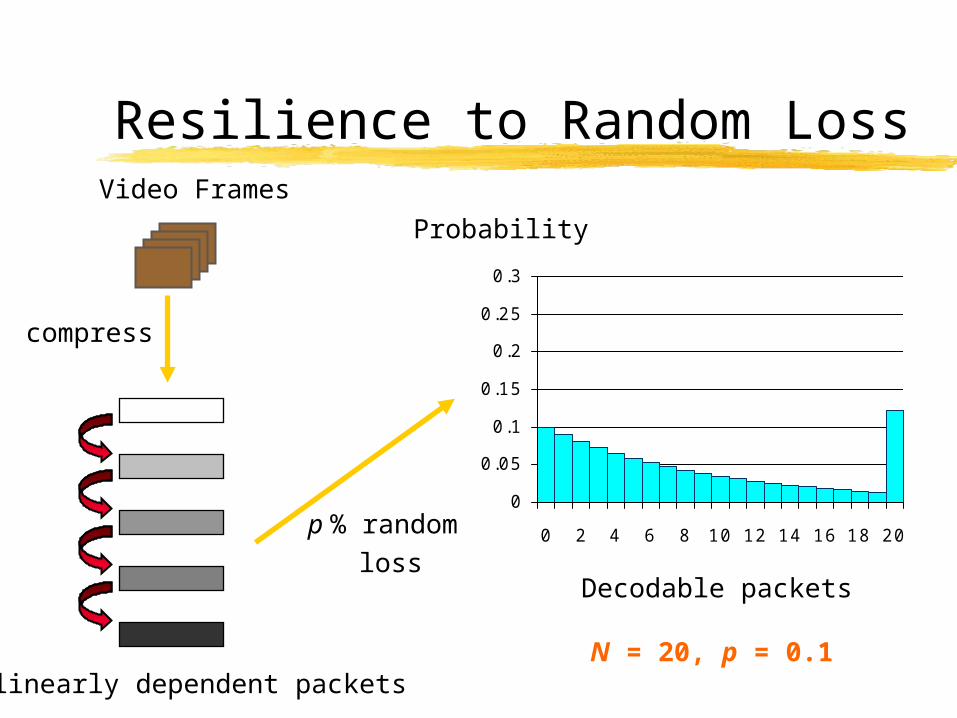
Resilience to Random LossVideo Frames
compress
N linearly dependent packets
0
0.05
0.1
0.15
0.2
0.25
0.3
0 2 4 6 8 10 12 14 16 18 20
Probability
Decodable packets
p % random
loss
N = 20, p = 0.1

Resilience to Random Loss (Cont’d)
Video Frames
compress
0
0.05
0.1
0.15
0.2
0.25
0.3
0 2 4 6 8 10 12 14 16 18 20
Probability
Decodable packets
p % random
loss
N = 20, p = 0.1N independent packets

Implementation - Overview
Compression overview 3D subband coding with error resilient
packetization multi-rate quantization for scalability
Unicast Transport overview rate-based protocols TCP-friendly over larger time-scale for reduced
variability in data rate

Achieving Error Resilience
Partitions coefficients into groups of blocks
Each group gets a block from every subband but in different spatial location
Groups compressed independently
One packet formed from each group
Error resilience comes from the ability to decode packets independently
Packets are equally important Disperse effects of packet lossPartitioning into groups of blocks: the
gray blocks are compressed together.

R1
R2
R3
MSB
LSB
MSB
LSB
MSB
LSBcoefficient
blocks from
a partition
Achieving Rate Scalability
Order bit-planes by energy reduction per bit Fine rate-scalability achieved by preferential
truncation of bit-planes

A Famous Example
Original Lena Lena compressed at 0.3 bpp
and subjected to 20%
random packet loss
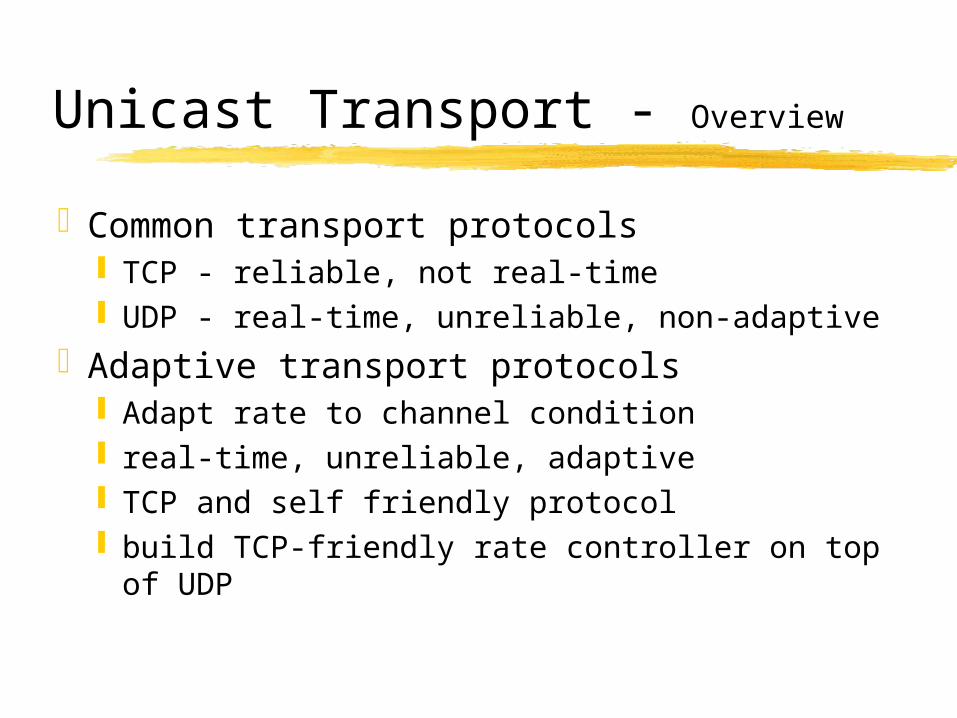
Unicast Transport - Overview
Common transport protocols TCP - reliable, not real-time UDP - real-time, unreliable, non-adaptive
Adaptive transport protocols Adapt rate to channel condition real-time, unreliable, adaptive TCP and self friendly protocol build TCP-friendly rate controller on top of
UDP

TCP Friendliness
Average bandwidth =122. *
*
MTU
rtt p
MTU : Maximum Transport Unit, a constant set to 500 bytes in our experiments
Floyd et. al. [1997]

Results OverviewPerformance under uniform loss (simulated)Internet Unicast Experiments (HK-Berkeley, Berkeley-
Toronto)
TCP Uncontrolled UDP Verifying TCP-friendly protocol TCP-friendly protocol + non-resilient coding TCP-friendly protocol + non-resilient coding +
adaptive FEC TCP-friendly protocol + our resilient coding

Performance under Loss
“Raiders” sequence at 800 kbps subjected to simulated 5% random packet loss
Considers 5 schemes proposed scheme with error resilient
packetization and 250 byte packets (GOP 4) subband coding with 1 packet per subband (GOP
4) subband coding scheme (ICIP 96) so that packet
n depends on packet n-1 etc. (GOP 4). MPEG-1 with GOP 2 packetized according to
RFC2250 with average packet size 250 bytes. (do not split a slice across packets if possible)
MPEG-1 with GOP 15 similarly packetsized

Performance - 5% loss
0
1000
2000
0
1000
2000
0
1000
2000
0
1000
2000
0
1000
2000
Time (s)
MSE
MPEG
GOP-15
MPEG
GOP-2
ICIP-96
1 subband
per packet
Proposed Scheme
25

TCP-Friendliness
Throughput for concurrent transmission Toronto to Berkeley

TCP Friendliness(Toronto - Berkeley, 2 pm, May 8, 1998)
- Extra traffic started at time = 80 seconds causes transient losses and increase in rtt- Losses remain low after protocol reduces transmission rate

Video Quality - Review
0
200
400
600
800
1000
MS
E
0
200
400
600
800
1000
MS
E
Resilient Video + Flow Control
Non-resilient Video + Flow Control
0
200
400
600
800
1000
MS
E
Non-resilient Video + FEC + Rate Control
300 s
300 s
300 s

Multicast with Hierarchical FEC
Receiver-driven approach: Code FEC data in hierarchical/layered
manner Carry each “layer” using a different
multicast group (address) Each receiver individually decides how
many layers to subscribe based on past history
Introduce latency to FEC layers to achieve “interleaving”

Hierarchical FEC - Timing Diagram
Video Layer 1
Video Layer 2
Video Layer 3
FEC Layer 1
FEC Layer 2
Time = 0
GOP 0
GOP 0
GOP 0
Time =
GOP 1
GOP 1
GOP 1
GOP 0
Time = 2
GOP 2
GOP 2
GOP 2
GOP 0
GOP 1
Time = 3
GOP 3
GOP 3
GOP 3
GOP 1
GOP 2

Hierarchical FEC - Example
Source
Interactive User
Passive viewer, no loss
Passive viewer, low loss
Passive viewer, high loss
Video Data
FEC layer 1
FEC layer 2

HFEC – Partitioning into layers
Fig.3 : Partitioning FEC packets into FEC layers
FEC Layer 1
FEC Layer 2
HFEC
M FEC packets
m1
m2
k data packets

Time = 0Time = Time = 2
Layer 1
Layer 2
Layer 3
Layer 4
Useful Packet Useless Packet Packet Loss
Resilient Video Multicast

Creating Menu of Data+FECP
ack
et L
oss
Rat
e (%
)
Rate (kbps)
5
15
30
300 600 1000
X Y Z
Y’
Z’

Optimal protection at 5% loss
0
100
200
300
400
500
600
700
800
900
1000
Rat
e (k
bp
s)
FEC-7
FEC-6
FEC-5
FEC-4
FEC-3
FEC-2
FEC-1
FEC-0
DataX
Y
Z

Optimal protection at 35% loss
0
100
200
300
400
500
600
700
800
900
1000
Rate
(kb
ps)
FEC-2
FEC-1
FEC-0
Data
Z’

Experimental Setup
Source:Berkeley
Receiver:Gatech
Receiver:ISI
Berkeley-ISI : 12 hops Berkeley-Gatech: 13 hops Common hops: 7
4 data layers of 100 kbps each
4 FEC layers of 50 kbps each for the base data layer
Raider sequence at 12 fps packet size 320 byte each GOP span 1/3 second
7
6
5

Result: Loss Trace (Exp 2)
Packet loss measured over 1/3 s intervals Bursty: varies from 0% to over 90%
0
0.2
0.4
0.6
0.8
1
1.2
Time 100 s
Packet receptionrate

Result: Video Traces
MSE trace without FEC (Berkeley-ISI)
0
200
400
600
800
1000
0
200
400
600
800
1000
MSE trace with hierarchical FEC (Berkeley-ISI)
MSE
MSE

Experimental Results
Repeat experiment using Sender at Indiana Receivers at Sweden and Berkeley
One receiver with FECOne receiver without FEC, at each location
6 data layers (100 kbps)4, 2 FEC layers (50 kbps) to protect data
layer 0, 1.

Experimental Results
With FEC at Sweden(ave MSE = 32)
No FEC at Sweden(ave MSE = 83)
Loss Rate after FEC
Loss Rate before FEC

Multicast Rate Control
Regardless of current rate: On congestion drop layers Otherwise probe for bandwidth to add layers Motivated by TCP rate control
Challenges IP-multicast
Unaware of network topologyUnaware of rates of other receiversNo mechanism for cross group communications
Given IP-multicast, how to achieve fair allocation when multiple sessions compete for bandwidth

Rate Control Mechanisms
RLM: communicate to sync: nonscalable Cannot synch across sessions.
RLC: Synch fails across sessions.Proposed Approach: ERC:
Measure network quantities to determine rate at each receiver
No explicit sync; Scales well; works across multiple sessions; fair sharing of b/w.
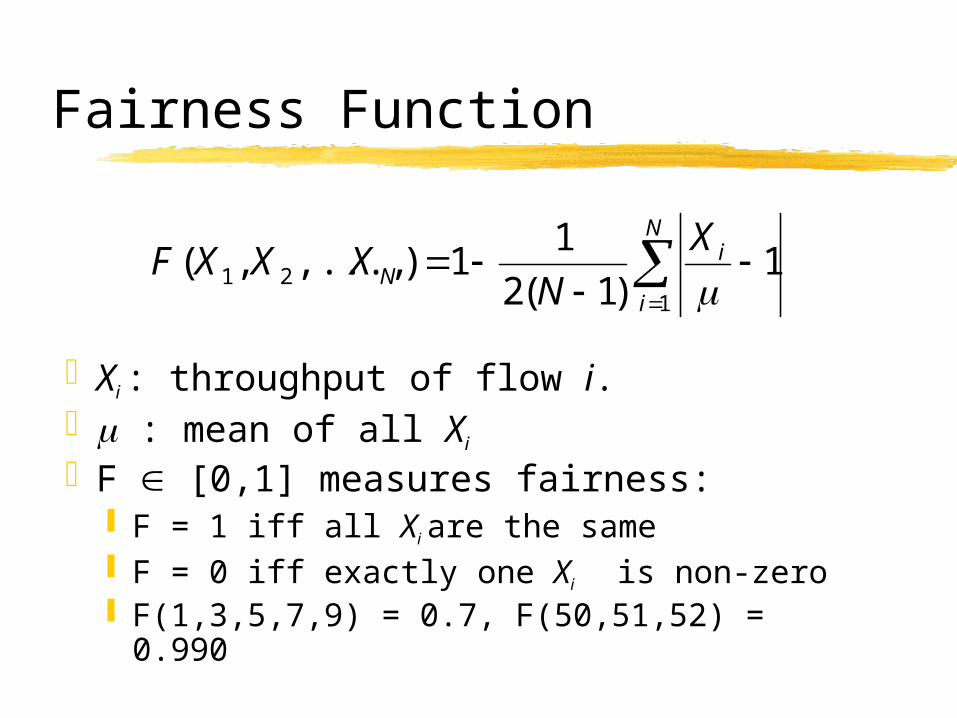
Fairness Function
Xi : throughput of flow i. : mean of all Xi
F [0,1] measures fairness: F = 1 iff all Xi are the same F = 0 iff exactly one Xi is non-zero F(1,3,5,7,9) = 0.7, F(50,51,52) = 0.990
N
i
iN
X
NXXXF
121 1
)1(2
11),...,,(

Experimental Setup - Dumbbell
Use ns simulator Fix
- RTT b : Average bandwidth per
flow (500 kbps) Vary
N : number of flows g : granularity, or the
no. of layers that can pass through b
M : Max-to-mean ratio, i.e., max rate / b.
Limits throughput if M N
Sender 1
Sender N
Receiver 1
Receiver N
100Mbps2ms
0.5xN Mbps40ms
Fig. A1: “Dumbbell” Topology for inter-session fairness

Results – Fairness Comparison
00.10.20.30.40.50.60.70.80.9
1
2 5 10 15 20Number of Flows
Fair
nes
s
ERC-LinRLM-LinRLC-LinERC-ExpRLM-ExpRLC-Exp
Fig. A2: Fairness comparison for ERC, RLM and RLC using Linear and Exponential layering (average over 3 runs, M
fixed)

0.92
0.94
0.96
0.98
1
20 15 10 5 2
3.1
4.2
6.3
12.5
Results – Fairness of ERC
Fairness
No of Session
Granularity
Fig. A3: Fairness of ERC with varying number of flows and granularity (Max-mean ratio fix at 3,
average over 5 runs)

Results – Fairness of ERC
0.92
0.94
0.96
0.98
1
1 2 3 4 5 6
3.14.2
6.312.5
Fairness
Granularity
Max-mean Ratio
Fig. A4: Fairness of ERC with varying number of max-mean ratio and granularity (10 flows, average
over 5 runs)

ERC+TCP
Fig. A8: Sharing of bandwidth by 2 ERC (top) and 2 TCP (bottom) flows on “dumbbell”
0 100 200 300 400 500 600 700 800 900 10000
500
1000
Rat
e (k
bps)
0 100 200 300 400 500 600 700 800 900 10000
500
1000
Rat
e (k
bps)
0 100 200 300 400 500 600 700 800 900 10000
500
1000
Rat
e (k
bps)
0 100 200 300 400 500 600 700 800 900 10000
500
1000
Time (s)
Rat
e (k
bps)
(a)
(b)
(c)
(d)

RLM+TCP
Fig. A9: Sharing of bandwidth by 2 RLM (top) and 2 TCP (bottom) flows on “dumbbell”
0 100 200 300 400 500 600 700 800 900 10000
500
1000
Time (s)
Rate
(kbps) 0 100 200 300 400 500 600 700 800 900 1000
0
500
1000
Rate
(kbps) 0 100 200 300 400 500 600 700 800 900 1000
0
500
1000
Rate
(kbps) 0 100 200 300 400 500 600 700 800 900 1000
0
500
1000
Rate
(kbps)
(a)
(b)
(c)
(d)

RLC (Exp)+TCP
Fig. A10: Sharing of bandwidth by 2 RLC (top) and 2 TCP (bottom) flows on “dumbbell”
0 100 200 300 400 500 600 700 800 900 10000
500
1000
Rat
e (k
bps)
0 100 200 300 400 500 600 700 800 900 10000
500
1000
Rat
e (k
bps)
0 100 200 300 400 500 600 700 800 900 10000
500
1000
Rat
e (k
bps)
0 100 200 300 400 500 600 700 800 900 10000
500
1000
Time (s)
Rat
e (k
bps)
(a)
(b)
(c)
(d)

Future Work
So far, best effort packet switched, wired.
How about “non best effort”, or QoS enabled packet switched networks?
How about wireless?

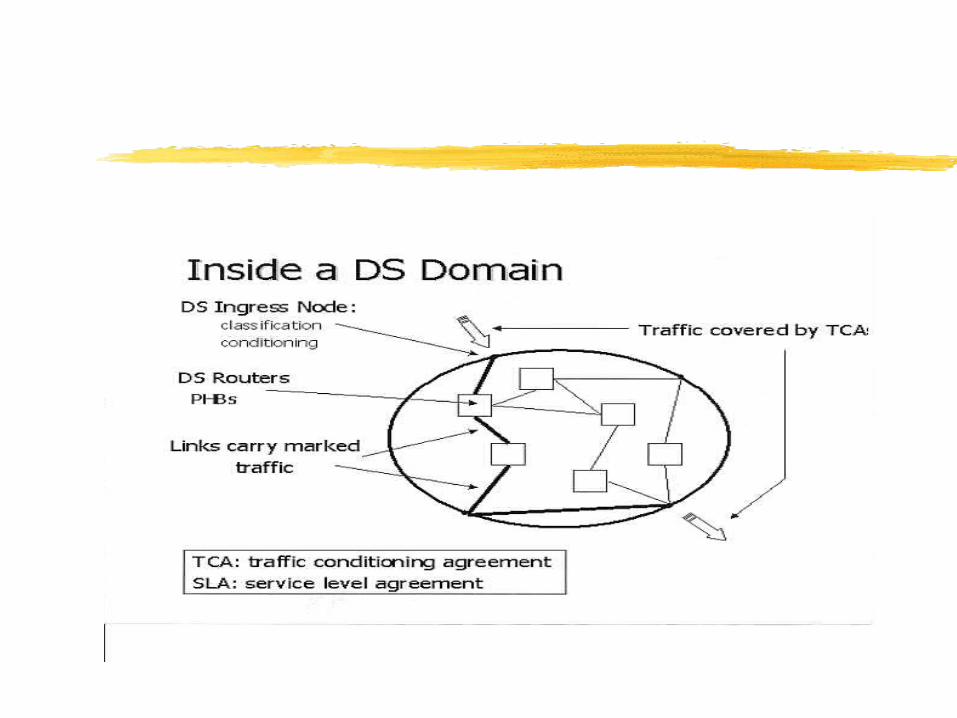
QoS enabled P.S. Networks
Integrated Services/RSVP Reserve resources at the router for each
flow Does NOT scale well, large overhead
Diffserv: Aggregate flows into few classes Service each class differently at the routers Scales well; pushes complexity to the edge

Diffserv and video
Routers affect real time processing:
Different queues and processing algorithms for different classes.
Results in different loss/delay
Decompose video into streams of different delay/loss:
Better utilize network resources
Provide some level of quality of service.
Minimize compression efficiency loss.

How to decompose
Decomposition across loss already done: Not all bits are equal, UEP, layered
codingDelay decomposition more
challenging Exploit dependency among I,B,P
frames in MPEG encoding

Frame Order
I B1 B2 P1 B3 B4 P2 B5 B6 P3 B7 B8
Coding/Transmit Order (TO)
Display Order (DO)
B1 B2 I B3 B4 P1 B5 B6 P2 B7 B8 P3

Delay of Frames
I B1 B2 P1 B3 B4 P2 B5 B6 P3 B7 B8
B1 B2 I B3 B4 P1 B5 B6 P2 B7 B8 P3
TO
DO
- I, P frames tolerate 1 extra “slot” of delay.

First Strike
B I
P
Spread of delay tolerance
PIB
BP
I
FLS
SLS
MLS
0 T 2T 3T

Verification
NS simulationsExperimental Testbeds:
California Research and Education Network (CALREN2)
Collaborative Advanced Interagency Research Network (CAIRN)

Wireless Video Networking
Major issues in real time streaming: Wired: congestion, transport layer Wireless: loss at the physical layer, time
varying channelApproach: adaptive integrated
approach Optimize physical, link, transport,
application layer simultaneously. Adaptation across all layers to channel

Adaptation to the Physical Channel
RTP
UDP
IP
Data / Radio Link
Physical
Socket Interface
Packetization
ApplicationSource/channel coding rate, error resilient codec
UDP lite vs. UDP
Number/kind of retransmission, block size
Feedback to other layers

Issues to Address
Adaptation times: Can the channel info be passed along
“on time” to other layers to do something useful?
Playback different from interactive. Simulations and experiments:
Opnet Two testbeds at Berkeley

Test bed
GSM Pacbell Network
LAN
UDPLite
PPP
RLP
GSM phone
laptop Desktop