
Unit 2 Consonants and Vowels The classification of consonants and vowels.
Journal of Modern Languages
Vol. 20, (2010)
1
An Instrumental Analysis of English
Vowels Produced by Omanis
Ali Hubais
Sur University College
Stefanie Pillai
University of Malaya
Abstract This article examines the pronunciation of English monophthongs by ten male
Omani speakers. Vowel quality was measured according to the frequencies of
the first (F1) and second formants (F2), and vowel duration was measured to
investigate length contrasts between typical vowel pairs. The findings suggest
that the vowels produced by the Omani speakers occupied a similar vowel
space as British English vowels although individual vowels have different
qualities. The vowels also showed a length contrast between vowel pairs with
quality contrast being less distinctive. In addition, the vowels produced by the
Omani speakers were similar to those produced by Arabic speakers from
different regions, giving rise to the perception of an Arabic-accented English.
Although the findings presented in this article are preliminary in nature, they
contribute to the growing body of research on the production of vowels in
different varieties of English.
Keywords: vowels, Arabic English, instrumental analysis, vowel quality, vowel
length, Omani English
1. Background Global English is today spoken in a multitude of accents, and one of the major
differences in the pronunciation of English lies in the realisation of vowels in
different varieties of English (see e.g. Maxwell & Fletcher, 2009; Mutonya,
2008; Salbrina, 2006; Yan & Vaseghi, 2003). Since differences in the number of
vowels and in vowel quality have been found in varieties of English as a first
(L1) and second language (L2), the same phenomenon can be anticipated in the
English vowels produced by Omanis whose L1 is usually Arabic.
Most references claim that Modern Standard Arabic has just six vowels:
three short and three long, and no diphthongs (e.g. Al-Ani, 1970; Alghamdi,
1998; Kotby et al., 2011; Newman, 2002). Arabic thus has a smaller vowel set
compared to English (Mitchell, 1993).
1.1. Arabic-Accented English Arabic-accented English has been investigated by Flege and Port (1981), Mitleb
(1981) and Munro (1993). The findings from these studies suggest that speakers
from different parts of the Arab world display similar characteristics in the way

Hubais & Pillai
2
that they produce English sounds. These include a lack of vowel length contrast
and the tendency to produce diphthongs as monophthongs. However, like Mitleb
(1981), Munro (1993) found that Arabic speakers used a greater difference of
duration to make a vowel length contrast than American English speakers. These
findings were derived from the production of English vowels by Arabic speakers
from seven Arabic speaking countries, and compared to the vowels of 23 native
speakers of American English. Munro (1993, p. 51) explained that the durational
ratios used by the Arabic speakers in making English tense and lax vowel pairs
tended to be similar to the ratios in similar vowel pairs in Arabic, which
suggests that the subjects in his study “may have applied Arabic perceptual and
productive strategies to English”. He suggests that in view of the greater length
contrast in Arabic, there tends to be an exaggeration in length difference in
English vowel pairs, which unlike Arabic vowels, may also be contrasted in
terms of their quality. However, Munro (1993) reported that on average, all the
vowels produced by Arabic speakers were consistently shorter that those
produced by American speakers, which according to him could be due to a
transfer from the length properties of similar Arabic vowels, which are shorter.
A similar finding was reported by Cox and Palethorpe (2005) who found that
long vowels and diphthongs tend to be shortened by Lebanese Australian
speakers.
In relation to vowel quality, Munro (1993) found that the back vowels
produced by Arabic speakers tend to be similar to their analogous Arabic
vowels. Other studies of Arabic speakers’ production of English vowels also
showed similarities across speakers from different regions. For example,
Jordanian and Saudi speakers were found to transfer length contrast as in Arabic
to their English vowels (Flege & Port, 1981; Mitleb, 1981).
1.2. Acquiring Sounds in L2 Flege’s (1995) Speech Learning Model (SLM) posits that the acquisition of L2
sounds depends on the level of perceived similarity between phonemes in the
first and second language, with phonemes with a higher level of dissimilarity
being easier to acquire than those that are similar. The rationale for this model is
that when a different phoneme is encountered in L2, the differences are noticed
or perceived and following this, learners are able to create a new category for
the particular phoneme (Flege, 1995). On the contrary, L2 sounds which are
similar to L1 sounds will be merged with existing L1 categories and therefore, it
can be expected that such sounds will be less native-like (Flege, MacKay &
Meador, 1999).
There is a problem, however, with SLM in relation to the identification of
perceived similarity between sounds, and perhaps because of this, other studies
have found contrary evidence on the relationship between perceived similarity
and the level of difficulty of learning L2 sounds. For instance, Munro (1993) did
not find the correspondence between the degree of dissimilarity and ease of
learning in his study of Arabic speakers and their production of English vowels.
Hence, there is still no adequate explanation as to why similar categories of L1

An Instrumental Analysis of English
Vowels Produced by Omanis
3
and L2 sounds are easily learnt while those that are more dissimilar may not be
learnt and produced accurately.
2. The Present Study In accordance with the current literature, it can be predicted that Omanis will
have fewer problems with vowels with equivalents in Arabic, and more
problems with those with no Arabic equivalent. Since length is contrasted in
Arabic, it can be assumed that length distinctions between English vowels are
unlikely to cause problems for Omanis.
With these two points in mind, this study aims to address the following
research questions:
What are the qualities of English monophthongs produced by the
Omani subjects?
To what extent are contrasts in vowel pairs maintained by the Omani
subjects?
To what extent does Arabic influence the English vowels produced by
Omanis?
3. Method The following sub-sections describe the methodology used in the study.
3.1. Subjects The subjects in this study were 10 male Omani postgraduate students with an
average age of 31 (Hubais, 2009). All had Arabic as their L1 and English as
their L2, and they had all completed their Bachelor’s degree in Oman, where
English is the medium of instruction in higher education for most subjects. At
the time of the study, they were doing postgraduate courses in Malaysia, where
the medium of instruction was English. The subjects used English on a daily
basis to communicate with their lecturers and classmates not from Arabic-
speaking countries.
3.2. Data The data consisted of a word list containing the target vowels embedded in a
CVC context, in which the consonants were bilabial stops. The rationale for
using stops is to ensure easy identification of the target vowel while minimising
the effects of co-articulation on the vowel. The use of the stops also made it
easier to identify the vowel on the spectrogram and in the waveform (see Figure
1).
Hubais & Pillai
4
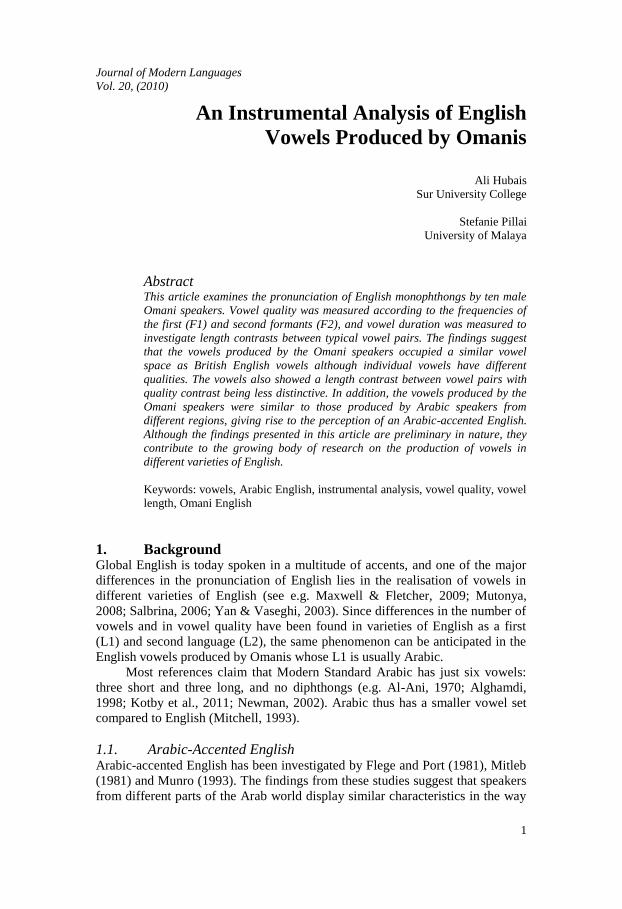
Figure 1. Screenshot of the word bid
Each target vowel was embedded in two CVC words, making a total of 220
tokens. The words were in turn embedded in a carrier sentence to provide a
more natural speaking context. The list of words is provided in the Appendix. In
the event, the vowel /ɪ/ for Speaker 3 was removed from the analysis as it was
produced as a diphthong. Schwa was not examined in this study as it only
appears in unstressed syllables. The recordings were carried out in a quiet place
using a headset microphone and a laptop installed with Praat Version 5.0.34
(Boersma & Weenink, 2008). A sampling rate of 44, 100 Hz and 16 bits was
used to ensure good quality recordings for instrumental analysis.
3.3. Transcription and Annotation The recorded data was transcribed and annotated using Praat 5.0.34 (Boersma &
Weenink, 2008). The measurements of the first and second formant were taken
and annotated. The target vowels were segmented on a wide-band spectrogram,
with reference to the related waveform and auditory inspection (see Pillai,
Zuraidah, Knowles & Tang, 2010). The first and second formants (F1 and F2) of
the vowels were measured at the midpoint of the vowels (see Figure 1), where
vowels tend to be at their most steady state, and are considered the most reliable
point to measure monophthongs (Hillenbrand, Getty, Clark & Wheeler, 1995).
Vowel duration was measured from the onset of the vowel (determined from the
beginning of the formant structure following the release of the initial stop) to the
offset of the vowel (determined as the point just before the cessation of the
acoustic signal for the following stop consonant (see Figure 1). The formants
were measured based on Linear Predictive Coding (LPC) formant tracks
overlaid on spectrograms generated in Praat. Where the formants shown on the
spectrogram were off-mark, the measurements were taken manually.

An Instrumental Analysis of English
Vowels Produced by Omanis
5
3.4. Data Analysis The analysis of the first two formants is based on the Formant Frequency Model
(see Watt & Tillotson, 2001). This model is based on the premise that the first
and second formants relate to vowel height and advancement/ retraction
respectively. Most studies of vowels focus on the first two formants, as these are
generally deemed to be important for the perception of vowel quality (see e.g.
Flemming & Johnson, 2007; Hawkins & Midgley, 2005).
The average F1 and F2 values for each of the eleven vowels were then
converted into the Bark Scale (Zwicker & Terhardt, 1980) in order to plot the
vowels on a vowel chart. This conversion provided an indication on the relative
quality of the vowels produced by the speakers and enabled a comparison with
similarly produced results of other studies. The F1 and F2 values of each
speaker’s vowels were also generated to examine the distribution of the vowels
in terms of how widely each vowel was distributed and also how pairs of vowels
contrasted. In relation to this, an F1 vs. F2 vowel plot was used as is common
practice in the study of vowels (e.g. Flemming & Johnson, 2007; Hawkins &
Midgley, 2005). The mean durations for each of the vowel pairs were also
compared to see whether the length contrasts were maintained.
4. Findings The average distance from the centroid for each vowel was calculated to get an
indication of how spread out they were in the vowel space. This was done by
calculating the Euclidean distance for all the vowels for /ɜː/ (see Deterding,
1997). The average formant frequencies and Euclidean distance (in Bark) for the
Omani subjects are shown in Table 1.
Table 1. Average F1 and F2 of English monophthong vowels produced by male Omani subjects
Vowels F1 (Hz) F2 (Hz) F1 (Bark) F2 (Bark)
Euclidean
Distance
(Bark)
ɪ 389 2029 3.75 13.20 2.49
iː 329 2296 3.19 13.98 3.43
e 394 2059 3.80 13.29 2.56
æ 636 1580 5.88 11.55 1.47
ʌ 567 1261 5.31 10.03 1.10
ɑː 672 1227 6.17 9.85 1.88
ɒ 476 1030 4.53 8.70 2.15
ɔː 522 886 4.93 7.75 3.12
ʊ 496 1237 4.70 9.90 0.95
uː 374 1030 3.61 8.70 2.36
ɜː 474 1827 4.51 12.51 1.67
Ave 485 1497 4.58 10.86 2.15
Data from Deterding (1997, p. 49) were used as a comparison to the data in this
study to ascertain the extent to which the vowels produced by the subjects were
different from native British English models. The average distances from the
centroid for the vowels produced by the Omanis and British speakers were
compared. In comparison with British English vowels produced in citation form

Hubais & Pillai
6
(2.57 Bark), the Omani English vowels (2.15 Bark) proved to be less peripheral.
However, according to a correlated samples t-test, there was no significant
difference between the average distances for the two sets of data (t = 2.81, df =
9, p > 0.01). An F1 vs. F2 plot generated using the F1 and F2 measurements
converted to Bark is presented in Figure 2.
Figure 2. Formant plot for Omani English vowels
As shown in Figure 2, the vowel /e/ (marked with an asterisk) appears to be
collapsed with /ɪ/. Thus, the words pet and bet, and pit and bit are realised with a
vowel approximating /ɪ/. In a blind perceptual test which involved asking
listeners to identify the words being played (Say pit again or Say pet again),
nine subjects were perceived to be producing the word bit and only one as pit,
when in actual fact the word pet was being played in each case. The word pit
was also perceived as having a voiced bilabial stop. This auditory perceptual test
further confirms that there is a merger of the /e/ and /ɪ/ vowels by the speakers.
A scatter plot of the distribution of these two vowels produced by all the
speakers illustrates the overlapping tendency of these vowels (see Figure 3).
Figure 3. Scatter plot of Omani English /e/ and / ɪ /
iː ɪ e*
æ ʌ ɑː
ɒ ɔː ʊ
uː
ɜː
2
3
4
5
6
7
8
9
78910111213141516
F1
(B
ark
)
F2 (Bark)
2
3
4
5
6
101112131415
F1
(B
ark
)
F2 (Bark)
ɪ e

An Instrumental Analysis of English
Vowels Produced by Omanis
7
A similar phenomenon is also evident in Munro (1993) although this is not
discussed at length. As depicted in Figure 4 /ɪ/ and /e/ are produced close
together by the subjects in his study (Munro, 1993, p. 46), although these vowels
are produced lower and more back than the ones produced by the Omani
subjects in this study. This could be because of the different phonetic contexts in
which the vowels were placed in both studies and also the English-speaking
environment of the speakers in Munro’s study. The data obtained from Munro’s
study and the Omani subjects in this study show that the front vowels occupy a
similar vowel space with the Omani English vowels being produced slightly
more fronted than the ones in Munro’s study. On the other hand, there appears to
be more differences in the back vowels with those in Munro’s study being more
back in the vowel space.
Figure 4. Munro’s Data for Arabic Speakers (Source: Munro, 1993, p. 46)
It is also interesting to note that not only is there evidence of /e/ being collapsed
with /ɪ/, essentially producing one vowel, there is also the phenomenon of the
voiceless stop /p/ being perceived as /b/. This can be explained by the lack of
aspiration in the production of the voiceless stops. The average Voice Onset
Time (VOT) for the stop in pet and pit produced by the Omani subjects was 14
msec. This results in /p/ being perceived as /b/, and is consistent with findings
from other studies on the production of English /p/ by Arabic speakers (e.g.
Flege & Port, 1981; Rasmussen, 2007).
Another vowel that is produced differently is /ɜː/ which was produced in a
front rather than central position by the Omani subjects (see Figure 2). Munro’s
study did not report on this vowel probably because it tends to be rhotacised in
American English preceding an r, such as in the word bird. The speakers in this
study also tended to pronounce the post-vocalic r, thus affecting the quality of
the preceding vowel producing an almost diphthong-like quality. This could
explain why /ɜː/ appears more fronted in the vowel chart.
From Figure 2, it can also be noticed that /ɒ/ is produced higher than /ɔː/
and closer to /uː/. To ascertain how different the vowels produced by the Omani
iː
ɪ
e
æ ʌ ɑː
ʊ
uː
2
3
4
5
6
7
8
9
78910111213141516
F1
(B
ark
)
F2 (Bark)

Hubais & Pillai
8
subjects in the present study compared with the speakers in Munro’s (1993, p.
46) study, the F1 and F2 of the vowels reported in the latter were compared with
the same ones in the present study (see Figure 5 and Figure 6).
Figure 5 shows an overlay of the vowels (except for /ɜː/, /ɒ/ and /ɔː/) from
both studies to illustrate the similarities and the differences between the vowels
produced by Arabic speakers. The conflation of the /ɪ/ and /e/ pairings occurs in
both sets of data but while both groups of speakers display similar vowel quality
in some instances, which would probably result in the identification of an Arab
accent, the differences in vowel quality may be due to the fact that the speakers
in Munro’s study had been living in the United States for an average of 5.7
years, and also the different regional origins of all the speakers.
Figure 5. Overlay of vowels for Omani speakers and mixed Arabic speakers from Munro’s study
To obtain a clearer picture on the extent to which particular vowel pairs are
contrasted, average vowel durations and scatter plots of /ɪ/-/iː/, /ʊ/-/uː/, /ʌ/-/ɑː/
and /ɒ/-/ɔː/ were generated. Since /e/ appears to be closer to /ɪ/ (see Figure 2),
the vowel pairs, /e/ and /æ/, were not included in this analysis.
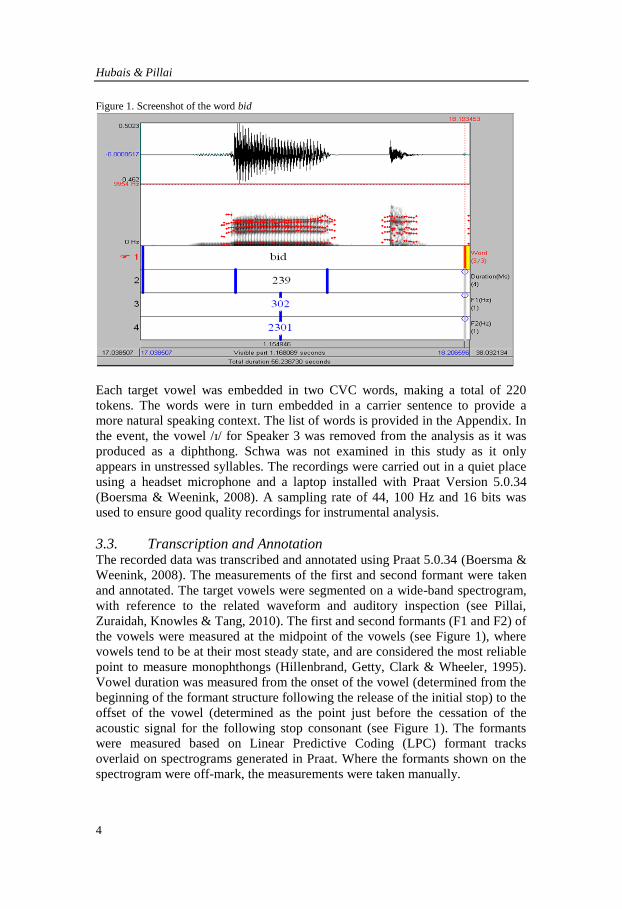
4.1. Vowel Contrast between /ɪ/ and /iː/ A scatter plot for the vowel pair /ɪ/ and /iː/ indicates that /iː/ was produced
higher and more front than /ɪ/ (see Figure 6). This is similar to Munro’s findings,
where the F1 is higher for /ɪ/ (449 Hz) than for /iː/ (319 Hz), indicating a lower
vowel. Further, the F2 for /iː/ is higher than for /ɪ/, indicating that the former is a
higher vowel. Although the two sets of vowels do not overlap very much, they
appear quite close to each other on the chart suggesting that there is a lack of
contrast in terms of quality between them.
iː ɪ
e*
æ
ʌ
ɑː
u
uː
2
3
4
5
6
7
8
9
78910111213141516
F1
(B
ark
)
F2 (Bark)
Munro's Study Omani Speakers
An Instrumental Analysis of English
Vowels Produced by Omanis
9
Figure 6. Scatter plot of /ɪ/ and /iː/
In terms of vowel length, all the speakers distinguish between /iː/ and /ɪ/ (see
Table 2), with the mean length for /iː/ being 166 msec and 74 msec for /ɪ/,
resulting in a short/long ratio of .44. This finding is similar to Cox and
Palethorpe (2005) who found a ratio of .69 for /hVd/ and .73 for /hVt/ contexts
for all their vowel pairs. Similarly, Munro (1993) also found that the Arabic
speakers in his study tend to exaggerate length contrast between this pair of
vowels with a ratio of 1:6, probably imitating such contrast that is present in
similar Arabic vowel pairs. The difference in average duration between the
vowel pairs of each speaker is evident in Figure 7. The line graph also shows
that while the average length is more consistent for /ɪ/ (m = 74 msec, s.d. = 13
msec), that of /iː/ is more distributed (m = 166 msec, s.d. = 54 msec). The
inconsistent distribution in the average duration for /iː/ could be due to speakers’
idiosyncrasies.
Table 2. Comparison of the average duration of /ɪ/ and /iː/ (in msec.)
Speakers S1 S2 S4 S5 S6 S7 S8 S9 S10 Average
/ iː/ 198 270 196 159 152 112 186 91 133 166
/ɪ/ 82 87 70 72 87 67 86 54 58 74
Difference 116 183 126 87 65 45 100 37 75 92
Figure 7. Length Distinction between /ɪ/ and /iː/
1
2
3
4
5
6
121314151617
F1
(B
ark
)
F2 (Bark)
ɪ i:
0
50
100
150
200
250
300
S1 S2 S4 S5 S6 S7 S8 S9 S10
Du
rati
on
(m
sec)
Speakers
/ iː/
/ɪ/

Hubais & Pillai
10
4.2. Vowel Contrast between /ʊ/ and /uː/ Figure 8 shows the distribution of the /ʊ/ and /uː/ vowels produced by the
subjects, where it can be seen that there is an overlap between the two vowels
where vowel quality is concerned. The F1 for /ʊ/ (496 Hz) is higher than for /uː/
(374 Hz) indicating that the former is produced more open. The F2 for /ʊ/ (1237
Hz) is slightly higher than for /uː/ (1030 Hz) which suggests that it is more
fronted. A similar finding was reported in Munro (1993).
Figure 8. Scatter Plot of /ʊ/ and /uː/
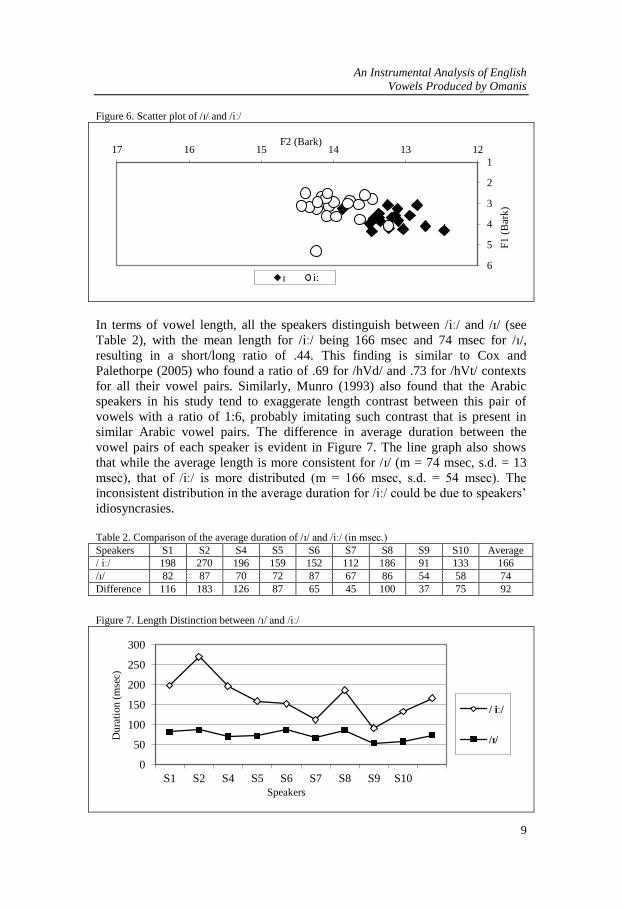
In relation to length contrast, similar to previous studies, length is contrasted
with the ratio of short to long vowels being 0.45 (see Cox & Palethorpe, 2005;
Munro, 1993). The average duration of /uː/ (m = 209 msec, s.d. = 54 msec) is
longer than that of /ʊ/ (m = 94 msec, s.d. = 13 msec) as shown in Table 3, and is
comparable to the average durations reported in Munro (1993, p. 44), which are
221.6 msec and 154 msec for /uː/ and /ʊ/ respectively. This length contrast is
reflected in Figure 9, which shows the average duration for /uː/ being
consistently higher than for /ʊ/ despite the inconsistent pattern among the
speakers. For example, Speaker 7 tended to exaggerate length in words like
booed and cooed resulting in a mean duration of 330 msec for /uː/, the highest
among all the speakers.
Table 3. Comparison of the average duration of /ʊ/ and /uː/ (in msec)
Speakers S1 S2 S3 S4 S5 S6 S7 S8 S9 S10 Average
/uː/ 254 192 184 251 161 201 330 157 181 181 209
/ʊ/ 91 111 113 79 86 101 76 105 96 80 94
Difference 163 81 71 172 75 101 254 52 85 101 115
1
2
3
4
5
6
7
8
9
10
678910111213141516
F1
(B
ark
)
F2 (Bark)
u u:
An Instrumental Analysis of English
Vowels Produced by Omanis
11
Figure 9. Length Difference between /ʊ/ and /uː/ (in msec)
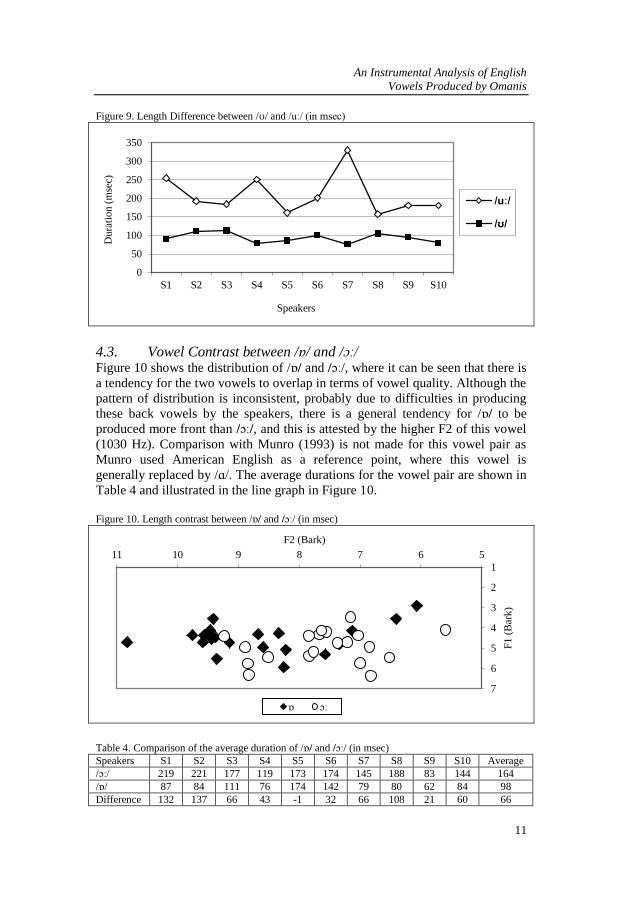
4.3. Vowel Contrast between /ɒ/ and /ɔː/ Figure 10 shows the distribution of /ɒ/ and /ɔː/, where it can be seen that there is
a tendency for the two vowels to overlap in terms of vowel quality. Although the
pattern of distribution is inconsistent, probably due to difficulties in producing
these back vowels by the speakers, there is a general tendency for /ɒ/ to be
produced more front than /ɔː/, and this is attested by the higher F2 of this vowel
(1030 Hz). Comparison with Munro (1993) is not made for this vowel pair as
Munro used American English as a reference point, where this vowel is
generally replaced by /ɑ/. The average durations for the vowel pair are shown in
Table 4 and illustrated in the line graph in Figure 10.
Figure 10. Length contrast between /ɒ/ and /ɔː/ (in msec)
Table 4. Comparison of the average duration of /ɒ/ and /ɔː/ (in msec)
Speakers S1 S2 S3 S4 S5 S6 S7 S8 S9 S10 Average
/ɔː/ 219 221 177 119 173 174 145 188 83 144 164
/ɒ/ 87 84 111 76 174 142 79 80 62 84 98
Difference 132 137 66 43 -1 32 66 108 21 60 66
0
50
100
150
200
250
300
350
S1 S2 S3 S4 S5 S6 S7 S8 S9 S10
Du
rati
on
(m
sec)
Speakers
/uː/
/ʊ/
1
2
3
4
5
6
7
567891011
F1
(B
ark
)
F2 (Bark)
ɒ ɔː

Hubais & Pillai
12
The mean length differences for /ɔː/ (m =164 msec, s.d. = 50 msec) and /ɒ/ (m =
98 msec, s.d. = 43 msec) are the most inconsistent among the pairs examined in
this study. Again like the inconsistent pattern for vowel quality, this could
indicate that the speakers were having difficulties in the production of these
back vowels. Although length is contrasted, for seven of the speakers the
difference in mean duration is below 100 msec, and for one speaker (S5) vowel
length is not discriminated.
Figure 11. Length contrast between /ɒ/ and /ɔː/ (in msec)
4.4. Vowel Contrast between /ʌ/ and /ɑː/ From Figure 12 , it can be seen that there is considerable overlap between /ʌ/
and /ɑː/ but with the latter being produced lower than /ʌ/. This is reflected in the
higher F1 average of /ɑː/ (672Hz) compared to /ʌ/ (672Hz). The average
durations for the vowel pair are shown in Table 5 and illustrated in the line
graph in Figure 13 which shows that the speakers consistently produced /ʌ/ (m =
93 msec, s.d. = 35 msec) with a shorter duration than /ɑː/ (m =184 msec, s.d. =
37 msec). Although the quality of the two vowels differs from British English,
the same trend can be observed in Southern British English (Deterding, 1997).
Figure 12. Scatter plot of /ʌ/ and /ɑː/
0
50
100
150
200
250
S1 S2 S3 S4 S5 S6 S7 S8 S9 S10
Du
rati
on
(m
sec)
Speakers
/ɔː/
/ɒ/
3
5
7
9
78910111213
F1
(B
ark
)
F2 (Bark)
ʌ ɑː

An Instrumental Analysis of English
Vowels Produced by Omanis
13
Table 5. Comparison of the average duration of /ʌ/ and /ɑː/ (in msec)
Speakers S1 S2 S3 S4 S5 S6 S7 S8 S9 S10 Average
/ɑː/ 205 243 228 180 192 172 172 180 131 142 184
/ʌ/ 148 150 100 74 71 79 69 98 59 89 93
Difference 58 93 129 106 121 93 104 82 72 53 91
Figure 13. Length contrast between /ʌ/ and /ɑː/ (in msec)
The analysis of the four vowel pairs are consistent with previous studies which
show that Arabic speakers tend to maintain, if not exaggerate, length contrast
even if vowel quality is not strongly contrasted. This is perhaps to be expected
given that Arabic has been found to have a short to long vowel ratio of 0.51
(Alghamdi, 1990, as cited in Alghamdi, 1998).
4.5. Influence of Arabic Vowels The analysis on vowel quality and vowel contrast show that the Omani subjects
in this study displayed particular characteristics when producing English vowels.
These include the merger of /ɪ/ and /e/ and the fronting of /ɜː/ as well as the
indefinite pattern of length discrimination for the rounded back vowels, /ɔː/ and
/ɒ/. Since the L1 of the subjects is Arabic, this study sought to examine the
possible influence of Arabic vowels on their production of English vowels. The
basis of the comparison is that the speakers may transfer the properties of Arabic
vowels to their production of analogous English vowels. Thus, since Modern
Standard Arabic has /i/, /a/ and /u/ and their lengthened counterparts, the Omanis
may produce corresponding English vowels with similar acoustic characteristics
as their Arabic counterparts in terms of vowel quality and length contrast. On
the other hand, it might be expected that Arabic speakers will have problems
with the vowels that are not present in Arabic. Measurements for F1 and F2
were obtained from Al-Ani (1970, p. 23) to enable comparison with the data
from this study (see Table 6).
0
50
100
150
200
250
300
S1 S2 S3 S4 S5 S6 S7 S8 S9 S10
Du
rati
on
(m
sec)
Speakers
/ɑː/
/ʌ/

Hubais & Pillai
14
Table 6. F1 and F2 of Arabic Vowels (Source: Al-Ani, 1970, p. 23)
Arabic vowels F1 (Hz) F2 (Hz) F1 (Bark) F2 (Bark)
iː 285 2200 2.78 13.71
i 290 2200 2.83 13.71
a 600 1500 5.58 11.20
aː 675 1200 6.19 9.70
u 290 800 2.83 7.14
uː 285 775 2.78 6.96
A juxtaposition of Arabic vowels and similar English vowels is presented in
Figure 14 which shows the Arabic vowels being produced more peripherally
than the Arabic English vowels. There is some indication of Arabic vowel
quality spilling over into the speakers’ production of English vowels for /iː/,
/æ/and /ɑː/ but not for /ʊ/ and /uː/ which is more fronted than the Arabic
equivalents. The latter reflects the trend in British English of fronting back
vowels (Fabricuis, 2007; Ferragne, & Pellegrino, 2010).
The Omanis produce English /iː/ quite similarly to Arabic /i/ and / iː/,
while /æ/ is produced with a similar quality to Arabic /a/, and /ɑː/ to Arabic /aː/.
However, the lack of vowel quality contrast for Arabic /i/-/iː/ and /u/-/uː/ is not
replicated in the production of similar pairs in English. Thus, the speakers
distinguished both quality (albeit not so distinctly) and length, which is
predictable since Arabic makes use of length contrast more than quality
(Alghamdi, 1998). It should be noted that while there appears to be L1 influence
on the production of some of the vowels, these vowels are produced similar to
British English vowels such as is the case with /iː/ and /æ/ or in the case of /ɑː/
with British English /ʌ/. The vowels which are not present in Arabic such as /e/
and /ɜː/ display different peculiar characteristics with the former merging with
/ɪ/, and the latter produced closer to British English /e/.
Figure 14. Comparisons of Arabic vowels with Omani English vowels

An Instrumental Analysis of English
Vowels Produced by Omanis
15
5. Summary In relation to the first research question on the qualities of English
monophthongs produced by the Omani subjects, it was found that the vowels
occupied a slightly smaller vowel space than British English. However, the
quality of most of the vowels showed stark contrast to British English. In
general /iː/, /æ/, /ɑː/, /ʌ/ and especially /ɪ/, /ɜː/, /ʊ/ and /ɔː/ appeared to be
produced more fronted than in British English. The fronting of /ɜː/ could be
attributed to the realisation of the following r in the target words by the
speakers, while /e/ seemed to have shifted towards /ɪ/, a phenomenon which was
found in Munro (1993).
In terms of vowel contrast between vowel pairs, the Omani subjects
contrasted vowel length more than vowel quality in the vowel pairs /ɪ/-/iː/, /ʌ/-
/ɑː/, /ʊ/-/uː/, and /ɒ/-/ɔː/. The pairs of vowels were produced close to each other
with overlaps between the vowels in all these pairs, especially for the back
vowels, suggesting that there is no clear separation in terms of how they were
produced. In other words, the pairs were not always produced as distinct vowels
in terms of quality. While there was evidence of length contrast, there was no
uniformity in the average duration of the length difference between these pairs
of vowels, and this discrepancy was mainly due to the inconsistent average
duration of the long vowels. Still, similar with the findings from previous
studies, length distinction was maintained by the Omani speakers.
The Omani subjects produced /iː/ similar to Arabic /i/ and /iː/, while /æ/ is
produced similar to Arabic /a/, and /ɑː/ to Arabic /aː/. The implication of this is
that they may have assimilated Arabic vowel qualities into their production of
corresponding English vowels as predicted by the SLM. However, this
phenomenon did not occur for /ʊ/ and /uː/. In Arabic, these vowels are produced
more back in the vowel space but the Omani subjects produced /uː/ quite close
to the British English equivalent, which is more fronted. The same did not occur
for /ʊ/ which is instead a lot more fronted than Arabic /u/ and /uː/. The fronting
of these back vowels by the Omani subjects could be a reflection of the current
phenomenon in British English for /uː/ fronting, which has also been observed in
Brunei and Hong Kong English. The vowels which are not present in Arabic
such as /e/ and /ɜː/ display different peculiar characteristics with the former
merging with /ɪ/. The Omani subjects also distinguished vowel length in these
pairs of vowels, which is predictable since Arabic makes use of vowel length
contrast more than quality (Alghamdi, 1998).
6. Conclusion Based on instrumental analysis, this study showed that Omanis share certain
vowel qualities with other Arab speakers of English, contributing to them having
perceivable Arab-accented English, and simultaneously, a more distinct variety,
which may interfere with intelligibility. It also provided preliminary data and
findings from which to launch further research, and which can also inform the
teaching and learning of pronunciation, an area that is much neglected in Oman.

Hubais & Pillai
16
The findings from this research imply that particular English vowels may
need more attention when it comes to the teaching of English sounds to Omanis.
Although there is general acceptance and tolerance of different English accents,
there is a possibility that unfamiliar realisations may cause problems of
intelligibility especially in cross-cultural communication. This is especially so
with the lack of contrast between English /ɪ/ and /e/. Thus, the teaching of
English in Oman may need to take into consideration the need to focus on
English pronunciation, an area that tends to be glossed over.
However, this study was limited to ten male subjects and therefore
constitutes a preliminary look at the production of English vowels by Omanis. In
order to obtain a more detailed description of the way in which Omanis produce
English vowels, future research should firstly, comprise a bigger number and a
wider range of subjects. Secondly, the data collection should be expanded to
include different speaking contexts, to enable a richer data set from which to
extract vowel quality and length contrast, and include diphthongs as well.
Thirdly, the phonetic environment in which the target vowels are placed has to
be extended to counter for co-articulatory effects, such as that encountered with
the realisation of post-vocalic -r. In addition, future research should include
perceptual tests to examine the rate of intelligibility, that is, the extent to which
listeners from different areas understand Omani speakers and how this correlates
with their production of English vowels. Finally, as inadvertently discovered in
this study, there are issues with other areas of sound production, such as the lack
of VOT for voiceless stops. Thus, there is a need for research into other areas of
the English pronunciation of Omanis.
References Al-Ani, S. (1970). Arabic phonology. The Hague: Mouton.
Alghamdi, M. (1998). A spectrographic analysis of Arabic vowels: A cross-dialectal
study. Journal of King Saud University, 10(1), 3-24.
Boersma, P., & Weenink, D. (2008). Praat: Doing phonetics by computer (Version
5.0.34). Retrieved September 22, 2008, from http://www.praat.org/.
Cox, F., & Palethorpe, S. (2005). A preliminary acoustic phonetic examination of
Lebanese Australian English. Paper presented at the Australian Language and
Speech Conference, Sydney, Australia. Retrieved March 4, 2009 from
http://clas.mq.edu.au/felicity/Papers/ Cox%26PaleL%26S05FnalBW.pdf
Deterding, D. (1997). The formants of monophthongs vowels in Standard British English
pronunciation. Journal of International Phonetics Association, 27(1-2), 47-55.
Fabricuis, A. (2007). Vowel formants and angle measurements in diachronic
sociophonetic studies: Foot-fronting in RP. In J. Trouvain, & W. Barry (Eds.),
Proceedings of the 16th International Congress of Phonetic Sciences (ICPhS
XVI), held on 6-10 August 2007 in Saarbrücken, Germany (pp. 1477-1480).
Ferragne, E., & Pellegrino, F. (2010). Formant frequencies of vowels in 13 accents of the
British Isles. Journal of the International Phonetic Association, 40(1), 1-34.
Flege, J. E. (1995). Second Language speech learning: Theory, findings and problems. In
W. Strange (Ed.), Speech perception and linguistic experience: Issue in cross-
language research (pp. 229-273). Timonium: York Press. Retrieved February
6, 2009 from http://jimflege.com/files/ Flege_in_Strange_1995.pdf.

An Instrumental Analysis of English
Vowels Produced by Omanis
17
Flege, J. E., MacKay, I. R. & Meador, D. (1999). Native Italian speakers’ perception and
production of English vowels. Journal of the Acoustical Society of America,
106, 2973-2987.
Flege, J., & Port, R. (1981). Cross-language phonetic interference: Arabic to English.
Language and Speech, 24, 125-146.
Flemming, E., & Johnson, S. (2007). Rosa's roses: Reduced vowels in American English,
Journal of the International Phonetic Association, 37, 83-96.
Hawkins, S., & Midgley, J. (2005). Formants frequencies of RP monophthongs in four
age groups of speakers. Journal of The International Phonetic Association,
35(2), 183-199.
Hillenbrand, J., Getty, L. A., Clark, M. J., & Wheeler, K. (1995). Acoustic characteristics
of American English vowels. Journal of the Acoustical Society of America, 97,
3099-3111.
Holes, C. (1990). Gulf Arabic. New York: Routledge.
Hubais, A. M. F. (2009). An instrumental analysis of English Vowels Produced by
Omani Speakers. Unpublished master’s research report, University of Malaya,
Kuala Lumpur, Malaysia.
Kotby M. N., Saleh M., Hegazi M., Gamal N., Abdel Salam M., Nabil A., & Fahmi S.
(2011). The Arabic vowels: Features and possible clinical application in
communication disorders. Folia Phoniatr Logop, 201(63), 171-177.
Maxwell, O., & Fletcher, J. (2009). Acoustic and durational properties of Indian English
vowels. World Englishes, 28(1), 52-69.
Mitchell, T. F. (1993). Pronouncing Arabic. Oxford: Oxford University Press.
Mitleb, F. (1981). Timing of English vowels spoken with an Arabic accent. Research in
Phonetics, 2, 193-226.
Munro, M. J. (1993). Production of English vowels by native speakers of Arabic: Accent
measurements and accentedness ratings. Language & Speech, 36(1), 39-66.
Mutonya, M. (2008). African Englishes: Acoustic analysis of vowels. World Englishes,
27(3/4), 434-449.
Newman, D. (2002). The phonetic status of Arabic within the world's languages: The
uniqueness of the lughat al-daad. Antwerp Papers in Linguistics, 100, 65-75.
Newman, D. L., & Verhoeven, J. (2002). Frequency analysis of Arabic vowels in
connected speech. Antwerp Papers in Linguistics, 100, 77-86.
Norlin, K. (1984). Acoustic analysis of vowels and diphthongs in Cairo Arabic. Lund
University Working Papers, 27, 185-207.
Pillai, S., Mohd. Don, Z., Knowles, G., & Tang, J. (2010). Malaysian English: an
instrumental analysis of vowel contrasts. World Englishes, 28(1), 159–172.
Rasmussen, Z. B. (2007). The interlanguage speech intelligibility benefit: Arabic-
accented English. Unpublished senior honours thesis. Utah: University of Utah.
Retrieved March 6, 2009, from http://www.linguistics.utah.edu/speechlab/
Rasmussen%202007.pdf
Salbrina Haji Sharbawi. (2006). The vowels of Brunei English. English World-Wide,
27(3), 247-264.
Watt, D., & Tillotson, J. (2001). A spectrographic analysis of vowel fronting in Bradford
English. English World-Wide, 22(2), 269-302.
Yan, Q., & Vaseghi, S. (2003). Analysis, modeling and synthesis of formants of British,
American and Australian accents. Proceedings of the Institute of Electrical and
Electronics Engineers Conference on Acoustics, Speech and Signal Processing,
712-755.
Hubais & Pillai
18
Zwicker, E., & Terhardt, E. (1980). Analytical expression for critical-band rate and
critical bandwidth as a function of frequency. Journal of the Acoustical Society
of America, 68, 1523-1525.
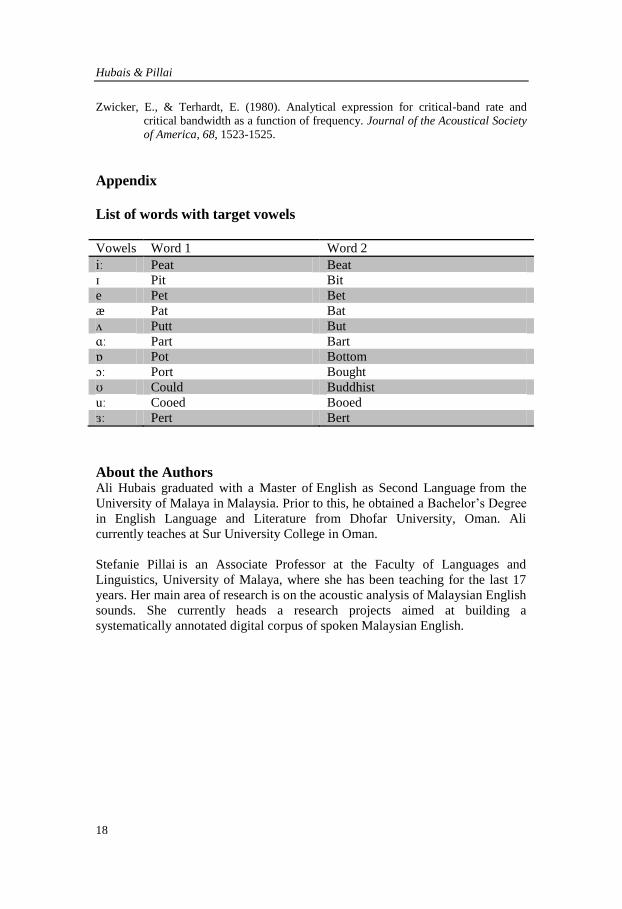
Appendix
List of words with target vowels
Vowels Word 1 Word 2
iː Peat Beat
ɪ Pit Bit
e Pet Bet
æ Pat Bat
ʌ Putt But
ɑː Part Bart
ɒ Pot Bottom
ɔː Port Bought
ʊ Could Buddhist
uː Cooed Booed
ɜː Pert Bert
About the Authors Ali Hubais graduated with a Master of English as Second Language from the
University of Malaya in Malaysia. Prior to this, he obtained a Bachelor’s Degree
in English Language and Literature from Dhofar University, Oman. Ali
currently teaches at Sur University College in Oman.
Stefanie Pillai is an Associate Professor at the Faculty of Languages and
Linguistics, University of Malaya, where she has been teaching for the last 17
years. Her main area of research is on the acoustic analysis of Malaysian English
sounds. She currently heads a research projects aimed at building a
systematically annotated digital corpus of spoken Malaysian English.