An insight into lidars for offshore wind measurements · An insight into lidars for offshore wind...
35
Thursday, January 26, 2012 1 An insight into lidars for offshore wind measurements Matt Smith Wind Lidar Innovations January 2012
Transcript of An insight into lidars for offshore wind measurements · An insight into lidars for offshore wind...
Thursday, January 26, 2012 1
An insight into lidars for offshore wind measurements
Matt Smith Wind Lidar Innovations January 2012
Thursday, January 26, 2012 2
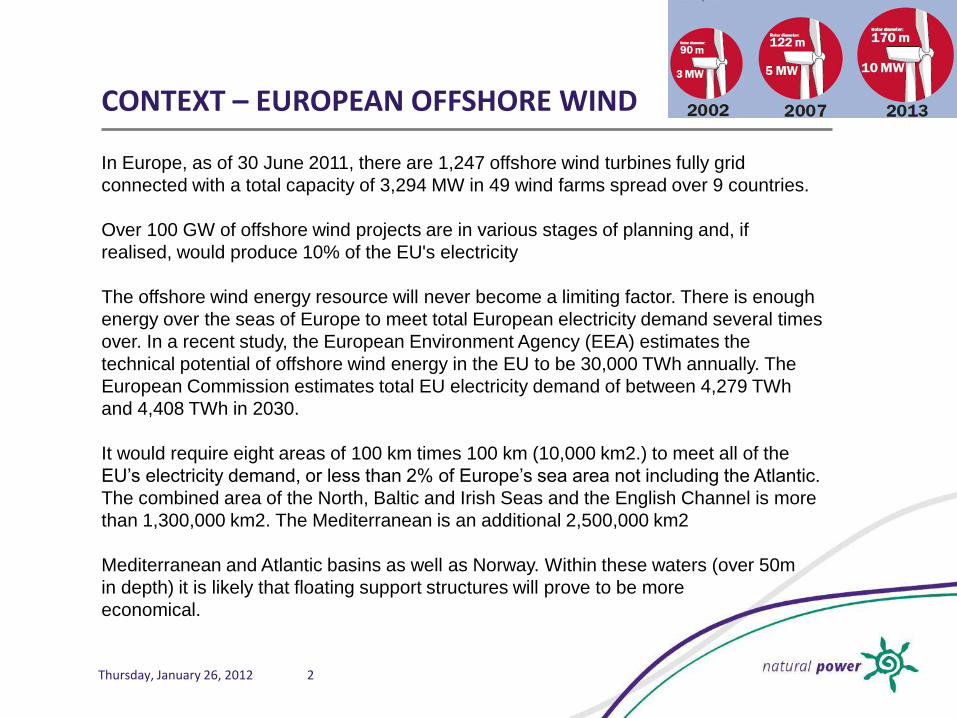
CONTEXT – EUROPEAN OFFSHORE WIND
In Europe, as of 30 June 2011, there are 1,247 offshore wind turbines fully grid
connected with a total capacity of 3,294 MW in 49 wind farms spread over 9 countries.
Over 100 GW of offshore wind projects are in various stages of planning and, if
realised, would produce 10% of the EU's electricity
The offshore wind energy resource will never become a limiting factor. There is enough
energy over the seas of Europe to meet total European electricity demand several times
over. In a recent study, the European Environment Agency (EEA) estimates the
technical potential of offshore wind energy in the EU to be 30,000 TWh annually. The
European Commission estimates total EU electricity demand of between 4,279 TWh
and 4,408 TWh in 2030.
It would require eight areas of 100 km times 100 km (10,000 km2.) to meet all of the
EU’s electricity demand, or less than 2% of Europe’s sea area not including the Atlantic.
The combined area of the North, Baltic and Irish Seas and the English Channel is more
than 1,300,000 km2. The Mediterranean is an additional 2,500,000 km2
Mediterranean and Atlantic basins as well as Norway. Within these waters (over 50m
in depth) it is likely that floating support structures will prove to be more
economical.

Thursday, January 26, 2012 3
CONTENTS
Introduction to Lidar Reasons for Lidar measurements offshore Offshore lidar history, acceptance and best practice Existing platforms, monopiles, tilt ups and other fixed solutions for lidar Floating lidars - why the industry wants them Floating lidars – two main product developments Floating lidars - what is available today Going forwards – power performance testing offshore turbines

Thursday, January 26, 2012 4
THE NATURAL POWER GROUP
Renewable energy consultancy, management services and product innovation.
Onshore wind, offshore wind, wave & tidal, and biomass energy.

Thursday, January 26, 2012 5
THE NATURAL POWER GROUP
Founded in 1996 250+ Employees 14 Offices
U.K. France U.S. Turkey Chile

Thursday, January 26, 2012 6
INTRODUCTION TO LIDAR
Principles of operation:
• Laser radiation scatters from atmospheric aerosols
• A laser is focussed at a point incident with the aerosols
• Aerosols movement follows the wind
• Scattered radiation is ‘Doppler’ shifted by the wind speed
• The ‘in-line’ component of wind speed is measured
LASER
DETECTOR TARGET
transmitted light
scattered and received light (with Doppler
frequency shift)
local oscillator (reference beam)

Thursday, January 26, 2012 7
INTRODUCTION TO LIDAR
Lidar can provide: • remote wind profiling across heights from 10 metres to
200 metres
• hub height , tip height measurements and beyond
• wind speed measurements – both vertical and horizontal wind components
• turbulence intensity measurements
• minimised health and safety risks due to removal of working at height on mast structures
• rapid installation in hard to reach areas – forested sites, helicopter drop zones
Thursday, January 26, 2012 8
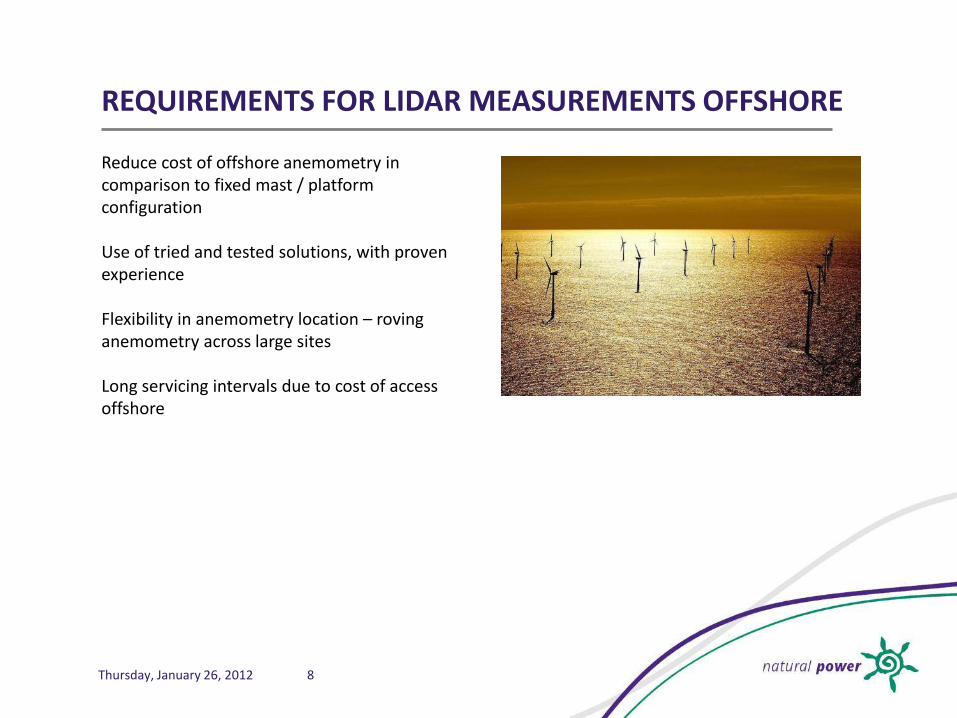
REQUIREMENTS FOR LIDAR MEASUREMENTS OFFSHORE
Reduce cost of offshore anemometry in comparison to fixed mast / platform configuration Use of tried and tested solutions, with proven experience Flexibility in anemometry location – roving anemometry across large sites Long servicing intervals due to cost of access offshore
Thursday, January 26, 2012 9
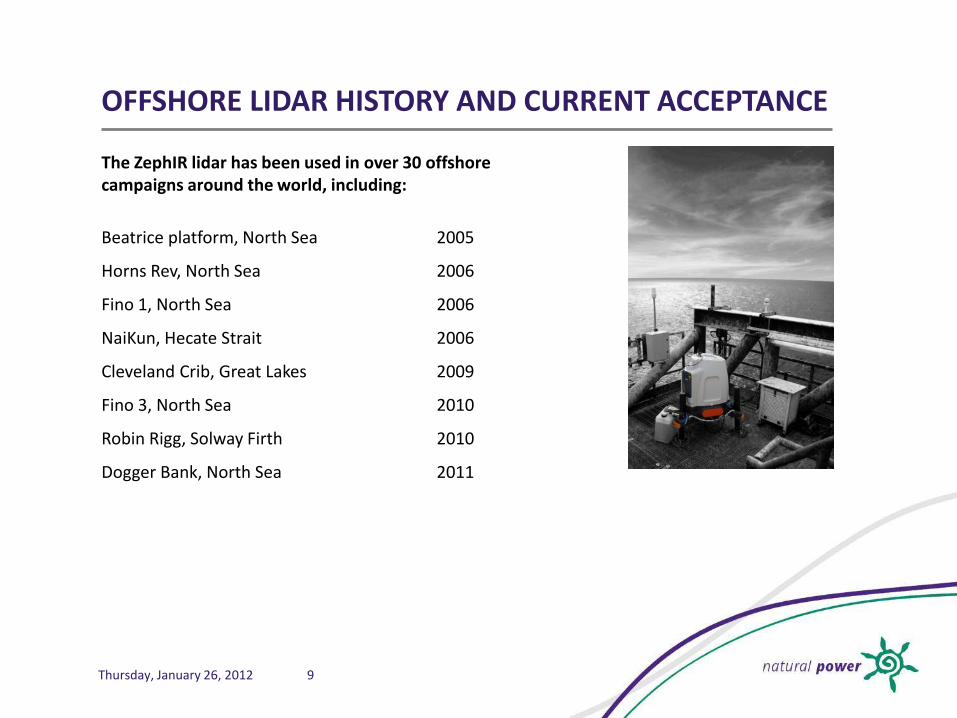
OFFSHORE LIDAR HISTORY AND CURRENT ACCEPTANCE
The ZephIR lidar has been used in over 30 offshore campaigns around the world, including:
Beatrice platform, North Sea 2005
Horns Rev, North Sea 2006
Fino 1, North Sea 2006
NaiKun, Hecate Strait 2006
Cleveland Crib, Great Lakes 2009
Fino 3, North Sea 2010
Robin Rigg, Solway Firth 2010
Dogger Bank, North Sea 2011

Thursday, January 26, 2012 10
NORSEWIND – NORTHERN SEAS WIND INDEX DATABASE
GOALS:
• Offshore resource
assessment
• Lidar utilisation in the wind
industry
• Satellite based remote
sensing
• Computational modelling
• Offshore wind shear
profiling
• Wind power forecasting
• Offshore economics

Thursday, January 26, 2012 11
NORSEWIND – NORTHERN SEAS WIND INDEX DATABASE
REMOTE SENSING: The project was the first systematic use of Lidar for large area mapping LiDAR Network maintained by: Oldbaum, GL Garrad Hassan Deutschland, Kjeller Vindteknikk Developed its own testing and validation programme Over 3000 operational days of data (to Nov 2011) + Level of system availability and reliability - Getting a system offshore
SOME LESSONS: Offshore Shear –Extremely important Mast Flow Distortion – an issue even when looking at IEC “compliant” masts Offshore Deployments – never easy

Thursday, January 26, 2012 12
OFFSHORE LIDAR HISTORY AND CURRENT ACCEPTANCE
Offshore deployments are subject to three key performance criteria for wind data: Lidar velocity calibration Lidar performance verification Lidar batch production results These criteria form the basis for many of the Best Practice Guidelines in place today, including: GL Garrad Hassan Natural Power
Thursday, January 26, 2012 13
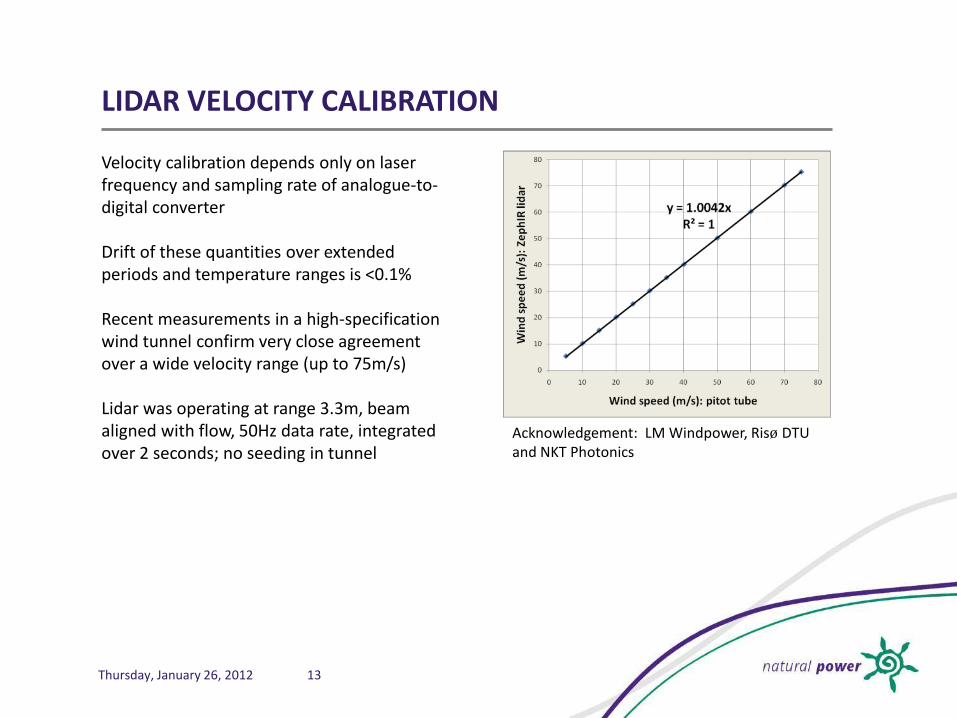
LIDAR VELOCITY CALIBRATION
Velocity calibration depends only on laser frequency and sampling rate of analogue-to-digital converter Drift of these quantities over extended periods and temperature ranges is <0.1% Recent measurements in a high-specification wind tunnel confirm very close agreement over a wide velocity range (up to 75m/s) Lidar was operating at range 3.3m, beam aligned with flow, 50Hz data rate, integrated over 2 seconds; no seeding in tunnel
Acknowledgement: LM Windpower, Risø DTU and NKT Photonics
Thursday, January 26, 2012 14
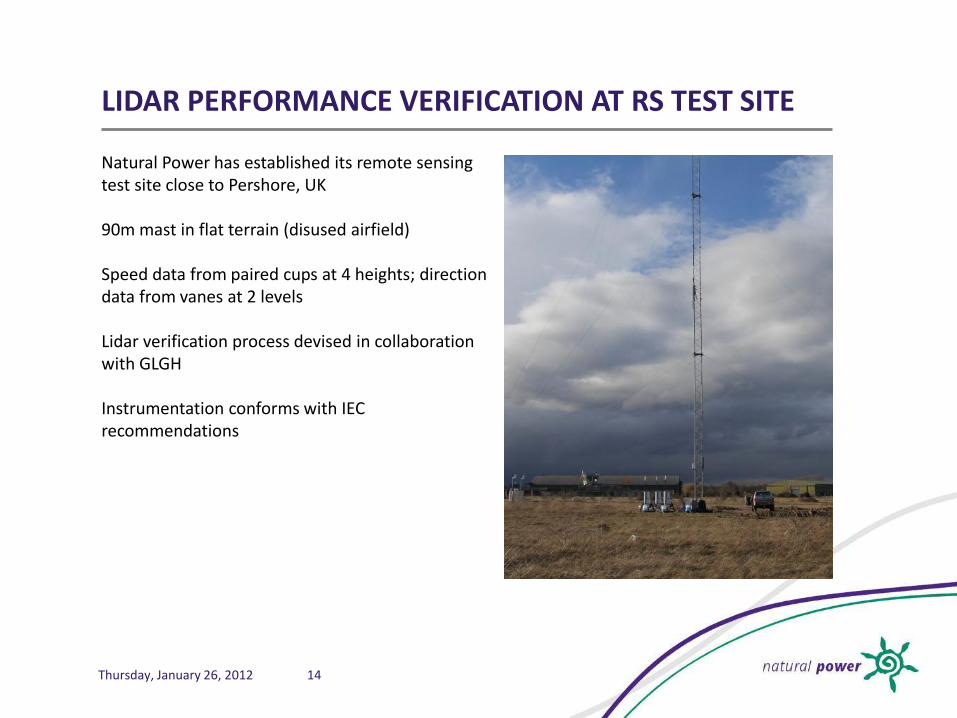
LIDAR PERFORMANCE VERIFICATION AT RS TEST SITE
Natural Power has established its remote sensing test site close to Pershore, UK 90m mast in flat terrain (disused airfield) Speed data from paired cups at 4 heights; direction data from vanes at 2 levels Lidar verification process devised in collaboration with GLGH Instrumentation conforms with IEC recommendations
Thursday, January 26, 2012 15
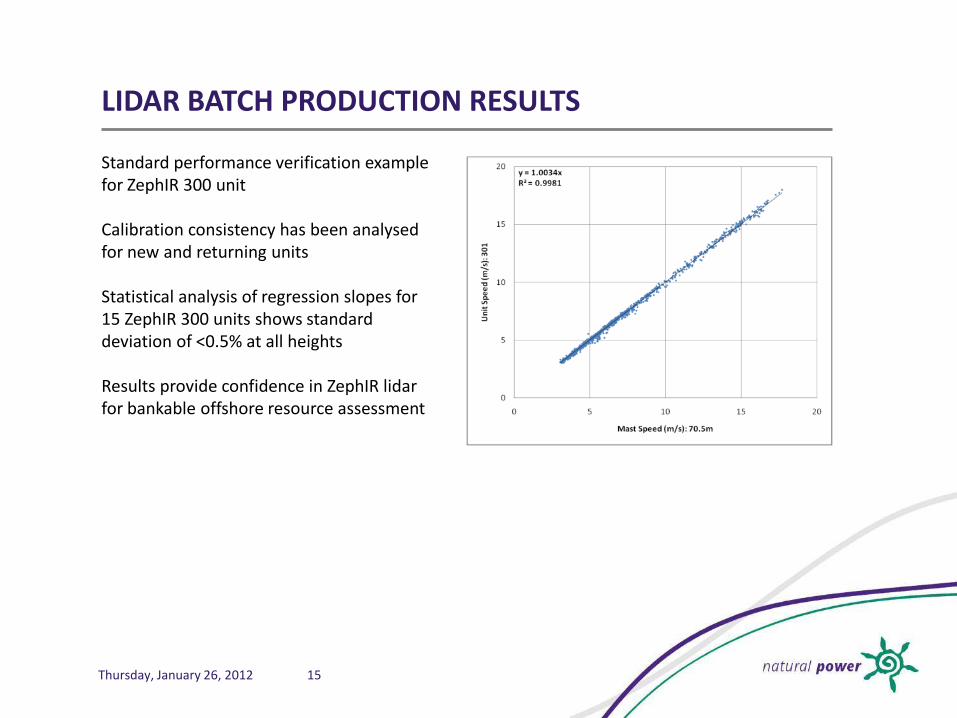
LIDAR BATCH PRODUCTION RESULTS
Standard performance verification example for ZephIR 300 unit Calibration consistency has been analysed for new and returning units Statistical analysis of regression slopes for 15 ZephIR 300 units shows standard deviation of <0.5% at all heights Results provide confidence in ZephIR lidar for bankable offshore resource assessment

Thursday, January 26, 2012 16
Offshore Simple terrain
Complex/Forested
Single ZephIR, no co-located mast YES YES NO
Single ZephIR with co-located mast YES YES YES*
BEST PRACTICE APPLICATIONS
The following table summarises Natural Power’s present position on the acceptability of different ZephIR campaign configurations where ZephIR is being used as the primary measurement device for the purposes of finance level resource and energy yield analysis *Mast should be at least 15 m above the tree tops. Volume-to-point conversion calculations may be required (discussed later). It is assumed in all cases that the ZephIR unit is subject to pre-and post campaign verification on a suitably-equipped calibration test site (see following slides).

Thursday, January 26, 2012 17
OFFSHORE BEST PRACTICE
ZephIR can be recommended as a primary wind measurement system for offshore wind farms. There is a significant and consistent body of evidence to support the use of ZephIR in offshore conditions as the sole data capture system. Consider the installation of two Lidar systems for redundancy and to enable continued data to be collected during service intervals. Where redundant ZephIRs are not practical or possible, consideration should be given to the installation of a short mast (20m above platform height) in order that there is a second source of wind measurements. This should be done in the interests of data coverage, and not for wind speed measurement validation.
Thursday, January 26, 2012 18
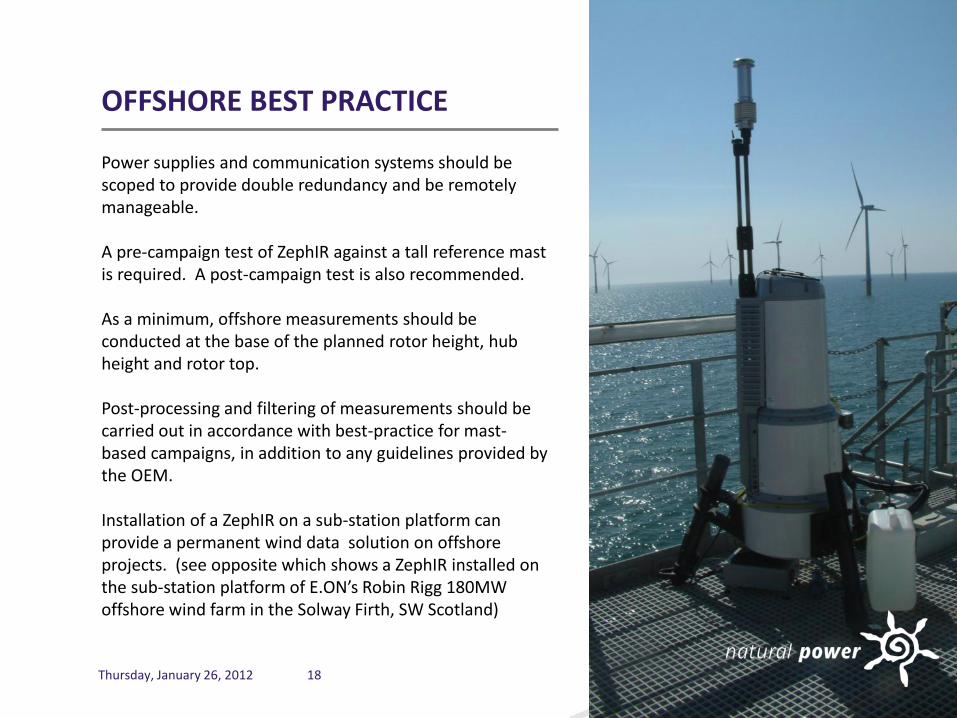
OFFSHORE BEST PRACTICE
Power supplies and communication systems should be scoped to provide double redundancy and be remotely manageable. A pre-campaign test of ZephIR against a tall reference mast is required. A post-campaign test is also recommended. As a minimum, offshore measurements should be conducted at the base of the planned rotor height, hub height and rotor top. Post-processing and filtering of measurements should be carried out in accordance with best-practice for mast-based campaigns, in addition to any guidelines provided by the OEM. Installation of a ZephIR on a sub-station platform can provide a permanent wind data solution on offshore projects. (see opposite which shows a ZephIR installed on the sub-station platform of E.ON’s Robin Rigg 180MW offshore wind farm in the Solway Firth, SW Scotland)

Thursday, January 26, 2012 19
METHODOLOGY FOR INITIAL FEASIBILITY STUDIES
Based on the use of an initial onshore ZephIR deployment • Ideally at nearest point of coast to project location • Quick and low cost installation, compared to a platform in early stages • Ideally mains powered and secure
Derive offshore data point from validated meso-scale wind climate model (i.e. Vortex)
• Provides long-term (10-yr.) wind resource statistics and time series data Correlation of onshore ZephIR data with meso-scale model data
• Perform correlation every 3 months (if required) • Allows meso-scale model to be tuned to real data and prediction uncertainty reduced • Derived site wind resource statistics can be used to perform an energy yield analysis
This method permits early, low-cost resource analysis, and delivers energy yield reports with lower uncertainty than can be otherwise achieved (without an offshore platform) Offshore on-site data collection will still typically be required to provide full and final finance-grade analysis (see narec Case Study)...

Thursday, January 26, 2012 20
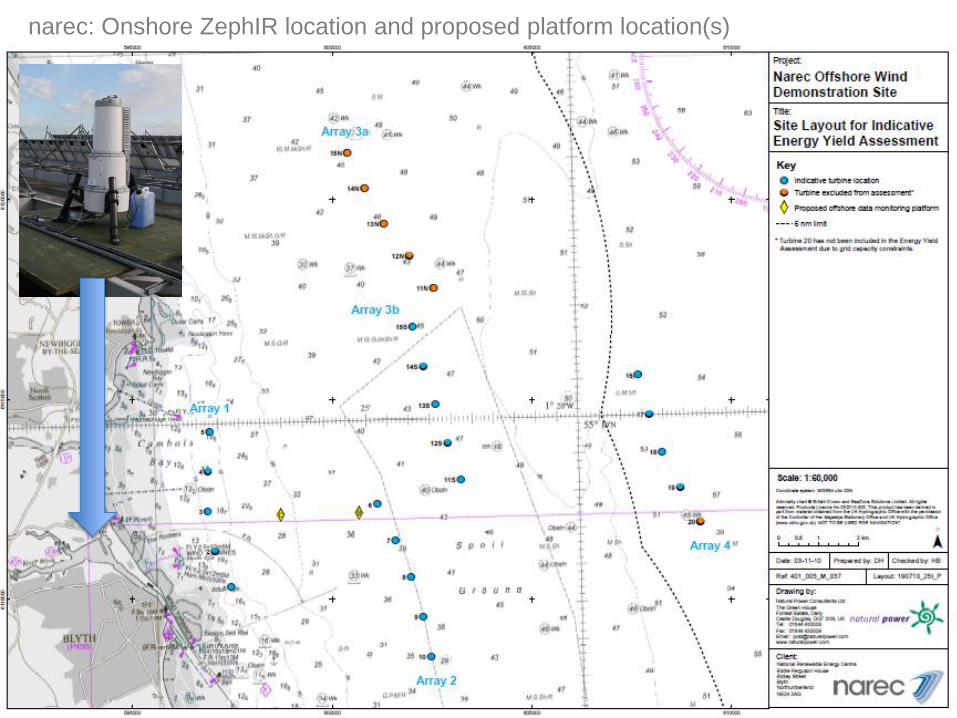
NAREC: CASE STUDY IN THE NORTH SEA
narec offshore wind demonstrator project (Northumberland, UK) Phase 1: Onshore building mounted ZephIR, <5km from project location Onshore ZephIR data correlated with long-term offshore Vortex meso-scale model data, as per methodology described above Data and results used to underpin ongoing resource analysis, energy yield prediction and site classification reports for the site owner and prospective site tenants (turbine OEMs) Phase 2: A second ZephIR and a tall met. mast are to be platform-mounted offshore Onshore ZephIR to remain in-situ to provide consistency and allow extension of data period All data will be utilised to produce finance-grade energy yield prediction and site classification reports, with minimised prediction uncertainty Public domain reports by Natural Power (publicly funded project): http://www.narec.co.uk/testing_development/offshore_demonstration_site/report_downloads/
Thursday, January 26, 2012 21
narec: Onshore ZephIR location and proposed platform location(s)

Thursday, January 26, 2012 22
EUROPEAN WATER DEPTHS
Thursday, January 26, 2012 23
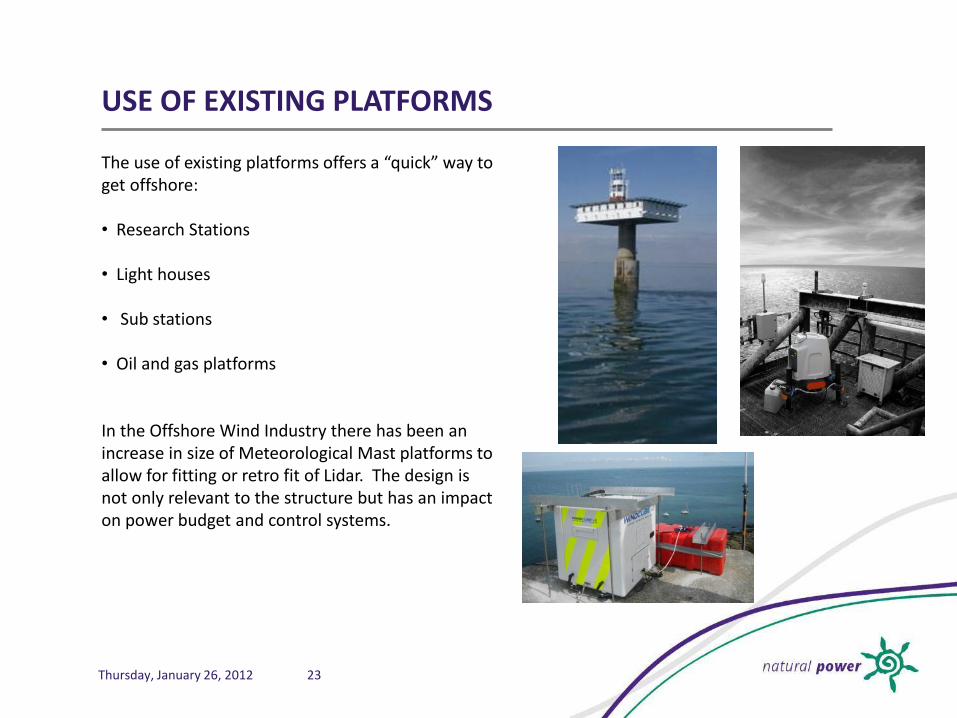
USE OF EXISTING PLATFORMS
The use of existing platforms offers a “quick” way to get offshore: • Research Stations
• Light houses
• Sub stations
• Oil and gas platforms
In the Offshore Wind Industry there has been an increase in size of Meteorological Mast platforms to allow for fitting or retro fit of Lidar. The design is not only relevant to the structure but has an impact on power budget and control systems.
Thursday, January 26, 2012 24
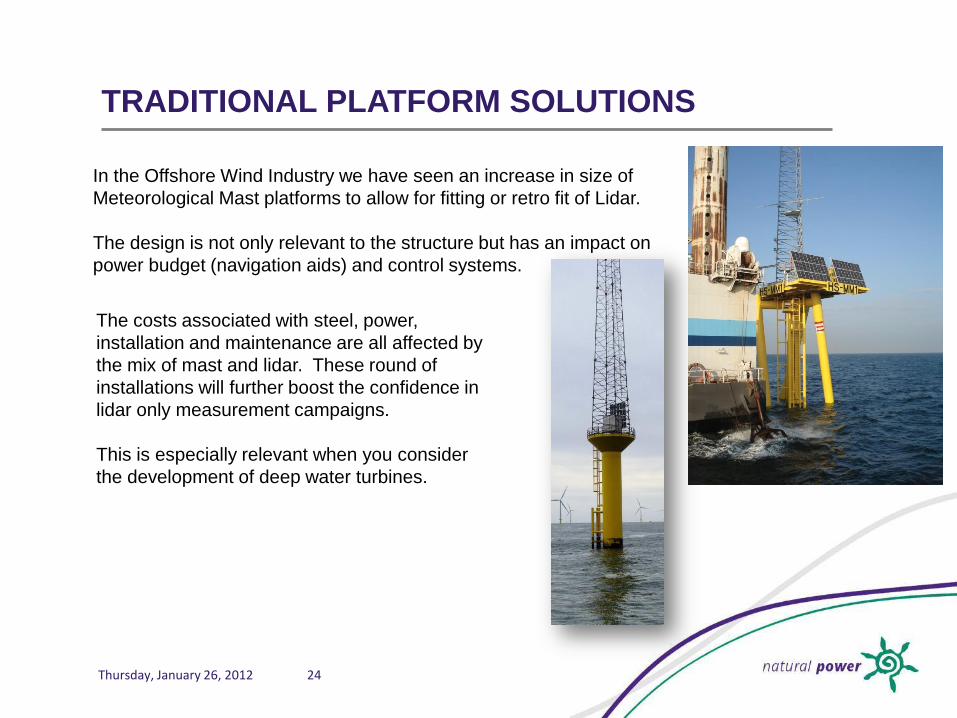
TRADITIONAL PLATFORM SOLUTIONS
In the Offshore Wind Industry we have seen an increase in size of
Meteorological Mast platforms to allow for fitting or retro fit of Lidar.
The design is not only relevant to the structure but has an impact on
power budget (navigation aids) and control systems.
The costs associated with steel, power,
installation and maintenance are all affected by
the mix of mast and lidar. These round of
installations will further boost the confidence in
lidar only measurement campaigns.
This is especially relevant when you consider
the development of deep water turbines.

Thursday, January 26, 2012 25
TRADITIONAL PLATFORM SOLUTIONS
Suction Bucket Foundations

Thursday, January 26, 2012 26
DEEP WATER TURBINES

Thursday, January 26, 2012 27
TWO MAIN FLOATING LIDAR PRODUCT DEVELOPMENTS
Free floating lidar - free-motion platforms with motion compensation Device floats on the water surface and compensate the motion of the buoy either:
• physically (using devices such as gimbals) or; • in the processing of data (through algorithms)
“Free floating” lidars are useful tools for the industry but can have higher uncertainty attached to their data; particularly in more extreme offshore wave conditions. It is difficult to validate these compensations without experiencing all of the possible waves but they still offer a valuable insight into offshore wind conditions. Motion-restricted floating lidar Motion of the floating platform is minimised as much as possible removing the need for motion compensation, aiming to spend as much time as possible with the device within 5 degrees of vertical without there being large vertical or horizontal movements. Easier to validate wind data as scenario is more representative of a lidar based on a fixed platform offshore or based at ground level onshore.
Thursday, January 26, 2012 28
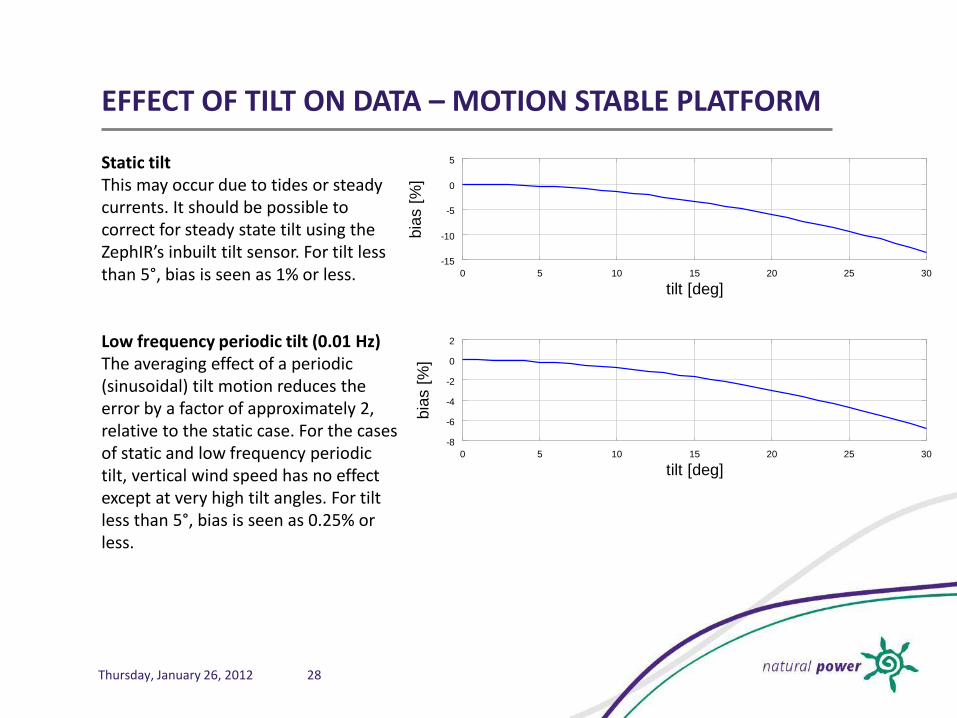
Static tilt This may occur due to tides or steady currents. It should be possible to correct for steady state tilt using the ZephIR’s inbuilt tilt sensor. For tilt less than 5°, bias is seen as 1% or less. Low frequency periodic tilt (0.01 Hz) The averaging effect of a periodic (sinusoidal) tilt motion reduces the error by a factor of approximately 2, relative to the static case. For the cases of static and low frequency periodic tilt, vertical wind speed has no effect except at very high tilt angles. For tilt less than 5°, bias is seen as 0.25% or less.
-15
-10
-5
0
5
0 5 10 15 20 25 30
bia
s [
%]
tilt [deg]
-8
-6
-4
-2
0
2
0 5 10 15 20 25 30
bia
s [
%]
tilt [deg]
EFFECT OF TILT ON DATA – MOTION STABLE PLATFORM

Thursday, January 26, 2012 29
FLOATING PLATFORM LIDAR CASE STUDIES
“SeaZephIR” – production lidar mounted on spar buoy for platform stability
Concept trialled in 2009: two ZephIR units deployed off coast of Norway, LandZephIR on small island, SeaZephIR buoy anchored out to sea
Separation of units 800m: excellent correlation obtained
Thursday, January 26, 2012 30
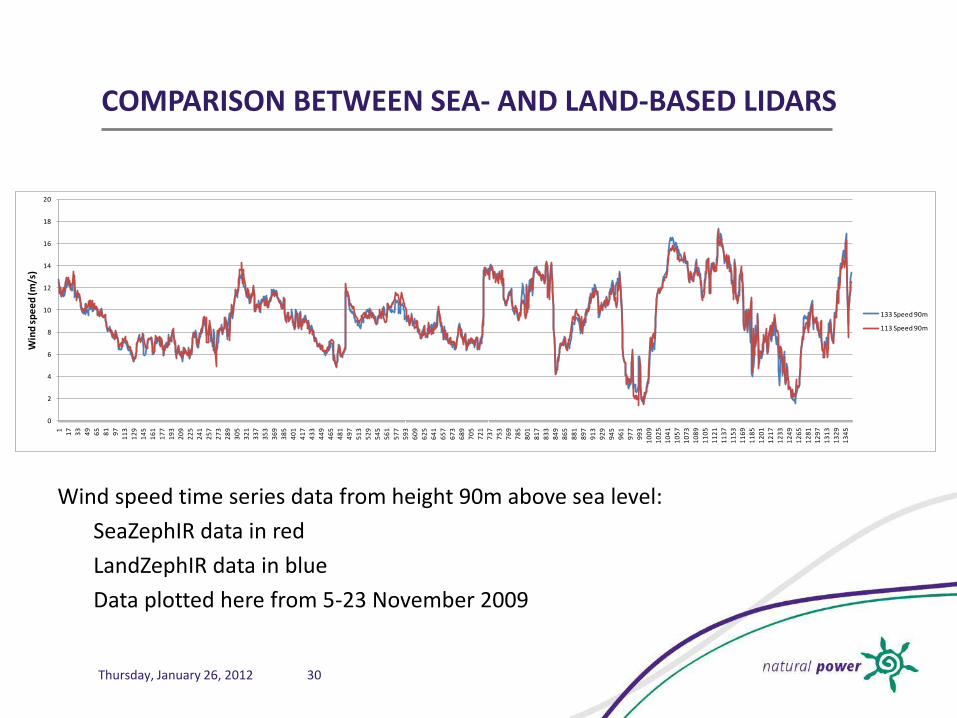
COMPARISON BETWEEN SEA- AND LAND-BASED LIDARS
Wind speed time series data from height 90m above sea level:
SeaZephIR data in red
LandZephIR data in blue
Data plotted here from 5-23 November 2009
0
2
4
6
8
10
12
14
16
18
20
1 17
33
49
65
81
97
11
3
12
9
14
5
16
1
17
7
19
3
20
9
22
5
24
1
25
7
27
3
28
9
30
5
32
1
33
7
35
3
36
9
38
5
40
1
41
7
43
3
44
9
46
5
48
1
49
7
51
3
52
9
54
5
56
1
57
7
59
3
60
9
62
5
64
1
65
7
67
3
68
9
70
5
72
1
73
7
75
3
76
9
78
5
80
1
81
7
83
3
84
9
86
5
88
1
89
7
91
3
92
9
94
5
96
1
97
7
99
3
10
09
10
25
10
41
10
57
10
73
10
89
11
05
11
21
11
37
11
53
11
69
11
85
12
01
12
17
12
33
12
49
12
65
12
81
12
97
13
13
13
29
13
45
Win
d s
pe
ed
(m/s
)
133 Speed 90m
113 Speed 90m
Thursday, January 26, 2012 31
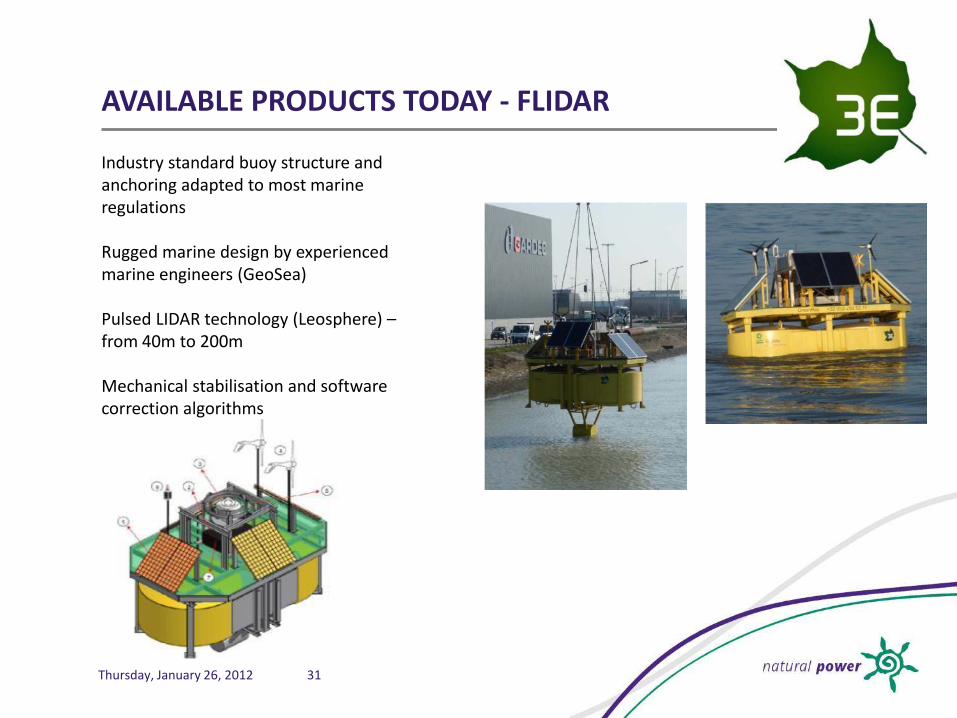
AVAILABLE PRODUCTS TODAY - FLIDAR
Industry standard buoy structure and anchoring adapted to most marine regulations Rugged marine design by experienced marine engineers (GeoSea) Pulsed LIDAR technology (Leosphere) – from 40m to 200m Mechanical stabilisation and software correction algorithms

Thursday, January 26, 2012 32
AVAILABLE PRODUCTS TODAY – WIND SENTINEL
Industry standard buoy structure and anchoring adapted to most marine regulations Rugged marine design by experienced marine engineers (AXYS NOMAD buoy) Pulsed LIDAR technology (Catch The Wind) – from 30m – 150m (extendable) Motion compensated data

Thursday, January 26, 2012 33
AVAILABLE PRODUCTS TODAY – WAVESCAN ZEPHIR
Marine designed by experts at Fugro Oceanor Mounted on the existing successful Fugro Wavescan buoy Continuous Wave ZephIR lidar measuring from 10m-200m Currently at pre-production prototype, testing being conducted Sletringen light house, Frøya.
Thursday, January 26, 2012 34
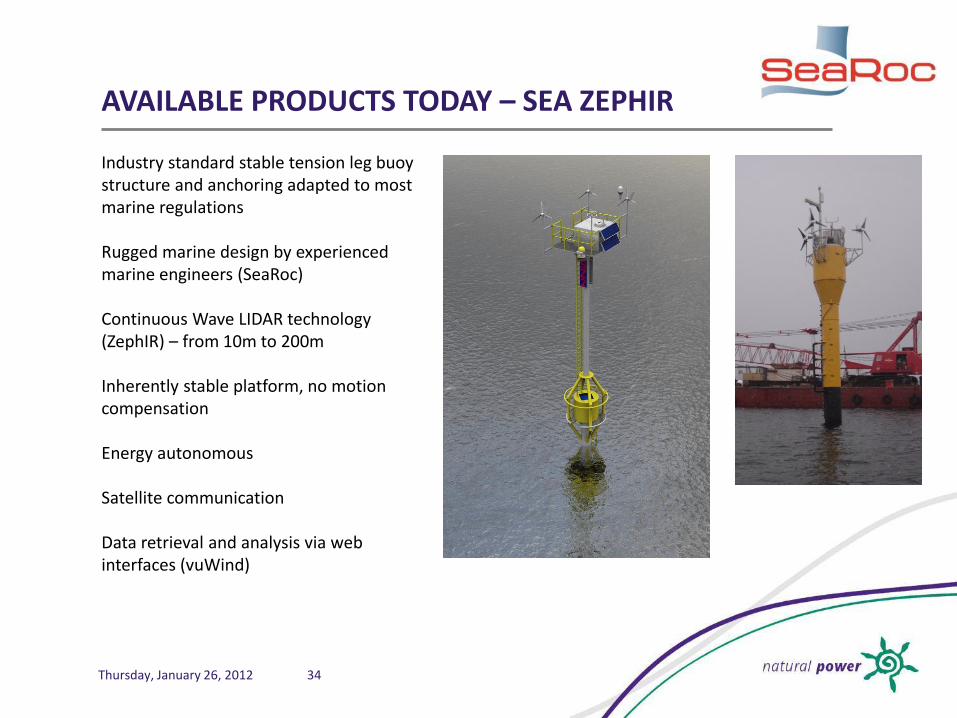
AVAILABLE PRODUCTS TODAY – SEA ZEPHIR
Industry standard stable tension leg buoy structure and anchoring adapted to most marine regulations Rugged marine design by experienced marine engineers (SeaRoc) Continuous Wave LIDAR technology (ZephIR) – from 10m to 200m Inherently stable platform, no motion compensation Energy autonomous Satellite communication Data retrieval and analysis via web interfaces (vuWind)
Thursday, January 26, 2012 35
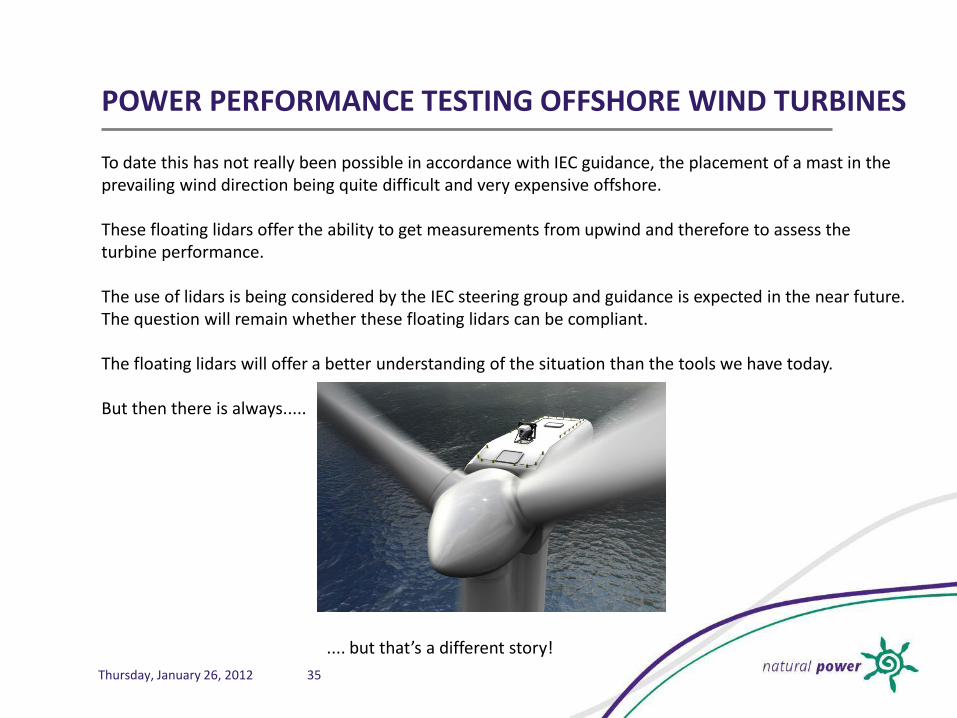
POWER PERFORMANCE TESTING OFFSHORE WIND TURBINES
To date this has not really been possible in accordance with IEC guidance, the placement of a mast in the prevailing wind direction being quite difficult and very expensive offshore. These floating lidars offer the ability to get measurements from upwind and therefore to assess the turbine performance. The use of lidars is being considered by the IEC steering group and guidance is expected in the near future. The question will remain whether these floating lidars can be compliant. The floating lidars will offer a better understanding of the situation than the tools we have today. But then there is always.....
.... but that’s a different story!