
An insight into downstream developments: Energy efficiency in
20
Global Unit Gas An insight into downstream developments: Energy efficiency in gas heating appliances Werner Weßing, Head of Efficient Home and Building Technology Kraków, 24/25 May 2012
Transcript of An insight into downstream developments: Energy efficiency in

Global Unit Gas
An insight into downstream developments:
Energy efficiency in gas heating appliances
Werner Weßing, Head of Efficient Home and Building Technology
Kraków, 24/25 May 2012

Global Unit Gas
GIE, Kraków 24/25 May 2012 2
Contents
1. Requirements on the global energy market
2. Target in Europe: Increase share of renewable energies
3. Environmental targets in Germany
4. Market structure in Germany
5. Research subjects at E.ON Ruhrgas
6. Intercomparison of appliance technologies
7. Conclusion

Global Unit Gas
GIE, Kraków 24/25 May 2012 3
1. Requirements on the global energy market
CO2 reductions
Primary energy reductions (e.g. improved thermal insulation)
Increase in renewable energy use (e.g. appliances, biomethane, hydrogen)
Predicted long-term rise in global temperatures caused
by increasing levels of carbon emissions
62
209
69 62
391
1444
763
157
0
200
400
600
800
1000
1200
1400
1600
Kernbrennstoffe Kohle Erdgas Erdöl
Re
ich
we
ite
in
Ja
hre
n
Reserve Reserve + Ressource
Static lifetime of (global) conventional energy sources
Source: BGR / EWI / Prognos
Global warming according to IPCC
scenario A1B: 2046-2065,
Source: IPCC
Coal Natural gas Oil Nuclear fuels
Tem
per
atu
re d
evia
tio
n (
rela
tive
to
196
1-9
0) in
K
Sta
tic lifetim
e in y
ears

Global Unit Gas
GIE, Kraków 24/25 May 2012 4
2. Target in Europe: Increase share of renewable energies
Share of energy from renewable sources in gross final
energy consumption in 2008 and targets for 2020
Source: IE Leipzig
Global Unit Gas
GIE, Kraków 24/25 May 2012 5
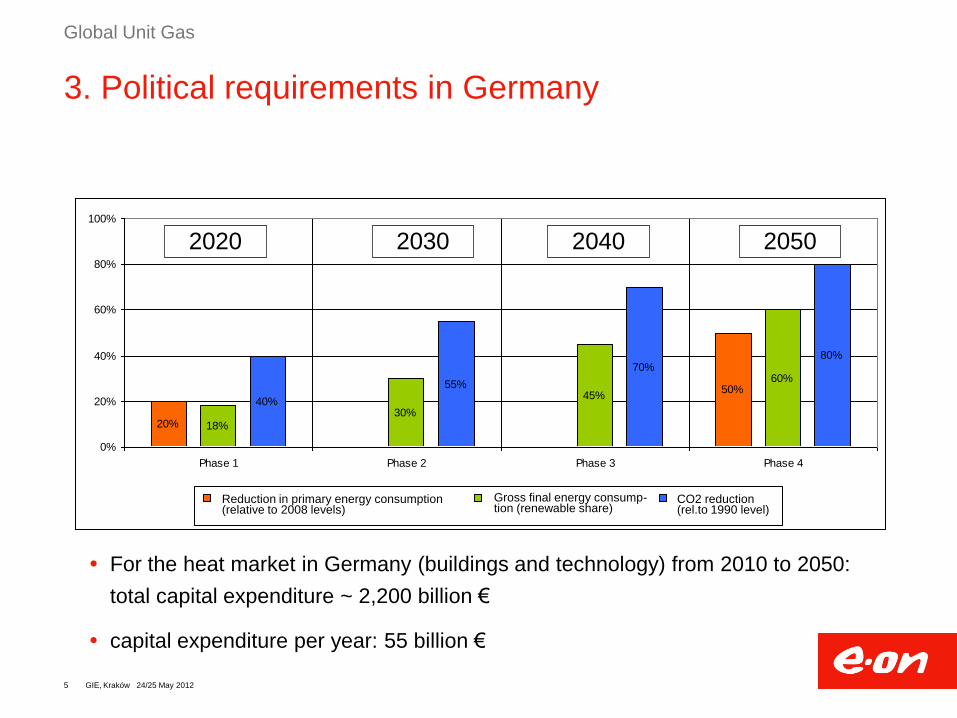
3. Political requirements in Germany
20%
50%
18%
30%
45%
60%
40%
55%
70%80%
0%
20%
40%
60%
80%
100%
Phase 1 Phase 2 Phase 3 Phase 4
Reduzierung des Primärenergieverbrauchs
(Bezugsjahr 2008)
Bruttoendenergieverbrauch,
erneuerbarer Anteil
CO2-Reduzierung
(Bezugsjahr 1990)
2020 2030 2040 2050
Reduction in primary energy consumption (relative to 2008 levels)
Gross final energy consump-tion (renewable share)
CO2 reduction (rel.to 1990 level)
For the heat market in Germany (buildings and technology) from 2010 to 2050:
total capital expenditure ~ 2,200 billion €
capital expenditure per year: 55 billion €

Global Unit Gas
GIE, Kraków 24/25 May 2012 6
4. 'New' customer groups
Differentiated offers required
Source: SW Bonn Energie und Wasser
Price-sensitive customers
Lifestyle
customers
Ecologically-
minded
customers
Will
ing
ness to
pa
y
Personal commitment
Today
Uniform
group
Yesterday
Many different groups with
very individual requests
Global Unit Gas
GIE, Kraków 24/25 May 2012 7
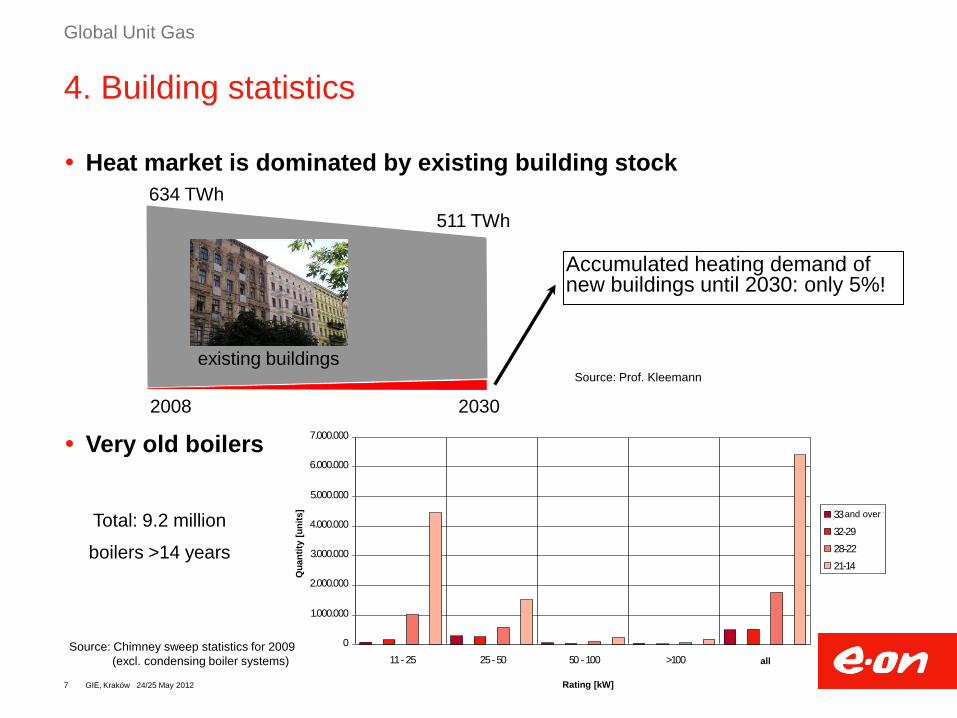
4. Building statistics
Heat market is dominated by existing building stock
Very old boilers
existing buildings
Accumulated heating demand of new buildings until 2030: only 5%!
2008 2030
634 TWh
511 TWh
existing buildings
0
1.000.000
2.000.000
3.000.000
4.000.000
5.000.000
6.000.000
7.000.000
11 - 25 25 - 50 50 - 100 >100 alle
Leistung [kW]
Anza
hl [
Stü
ck] 33 und älter
32-29
28-22
21-14
Source: Chimney sweep statistics for 2009
(excl. condensing boiler systems)
Source: Prof. Kleemann
Total: 9.2 million
boilers >14 years
Rating [kW]
Qu
an
tity
[u
nit
s]
all
and over

Global Unit Gas
GIE, Kraków 24/25 May 2012 8
5. "Appliance technology" responsibilities of the
Gas Utilisation Department at E.ON Ruhrgas
Applications &
Renewables
Local Power
Generation
Condensing type
Gas & Solar
MicroCHP
GHP Initiative
Fuel Cell
Smart Home
Appliance tests:
Laboratory tests
Field tests
to determine
energy efficiency aspects
environmental aspects
gas property aspects
economic aspects

Global Unit Gas
GIE, Kraków 24/25 May 2012 9
5. Gas heat pump field tests
66 test sites in total

Global Unit Gas
GIE, Kraków 24/25 May 2012 10
5. Micro-CHP field tests
176 test sites in total
Global Unit Gas
GIE, Kraków 24/25 May 2012 11
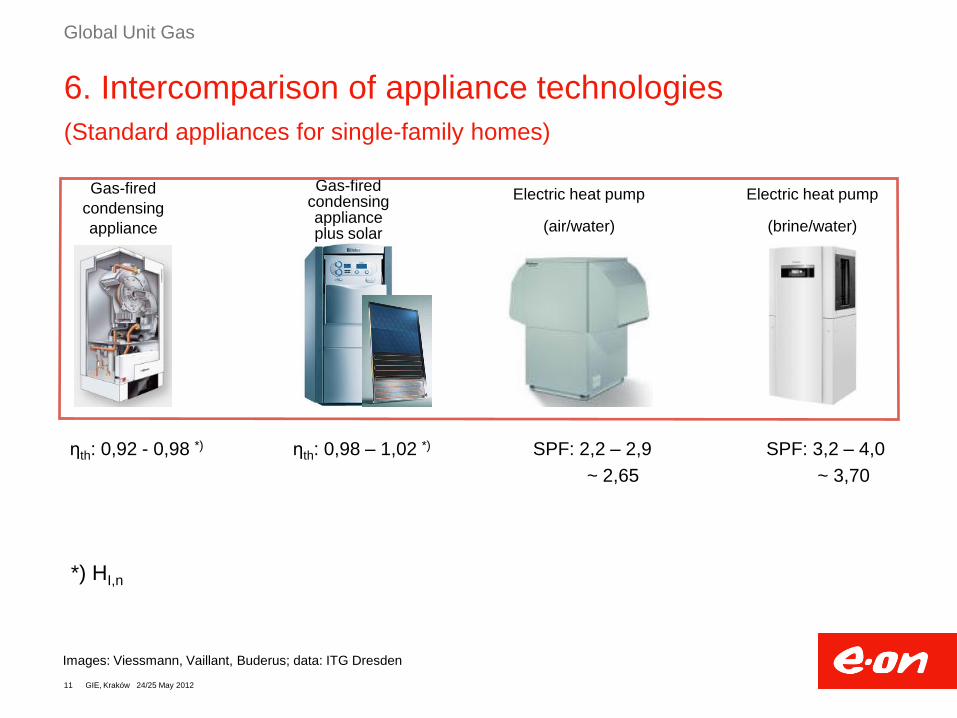
6. Intercomparison of appliance technologies
(Standard appliances for single-family homes)
ηth: 0,92 - 0,98 *)
Gas-fired
condensing
appliance
ηth: 0,98 – 1,02 *)
Gas-fired condensing appliance plus solar
SPF: 2,2 – 2,9
~ 2,65
Electric heat pump
(air/water)
SPF: 3,2 – 4,0
~ 3,70
Electric heat pump
(brine/water)
Images: Viessmann, Vaillant, Buderus; data: ITG Dresden
*) HI,n
Global Unit Gas
GIE, Kraków 24/25 May 2012 12
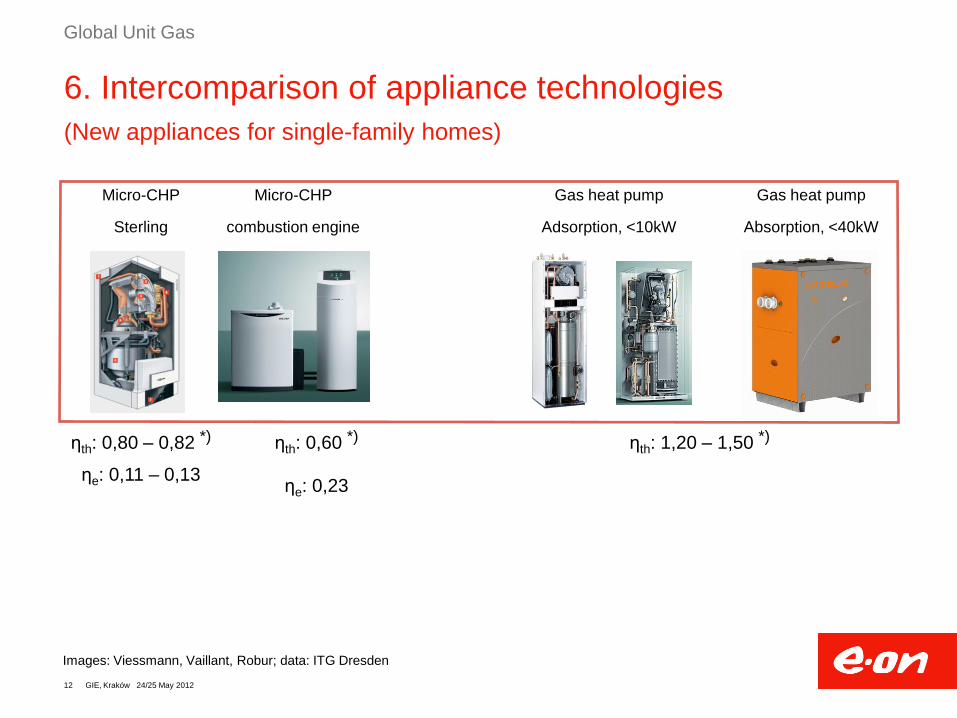
6. Intercomparison of appliance technologies
(New appliances for single-family homes)
ηth: 0,80 – 0,82 *)
ηe: 0,11 – 0,13
Micro-CHP
Sterling
Images: Viessmann, Vaillant, Robur; data: ITG Dresden
Micro-CHP
combustion engine
ηth: 0,60 *)
ηe: 0,23
ηth: 1,20 – 1,50 *)
RoburViessmann
DesorptionAdsorption DesorptionAdsorption
Gas heat pump
Adsorption, <10kW
Gas heat pump
Absorption, <40kW
Global Unit Gas
GIE, Kraków 24/25 May 2012 13
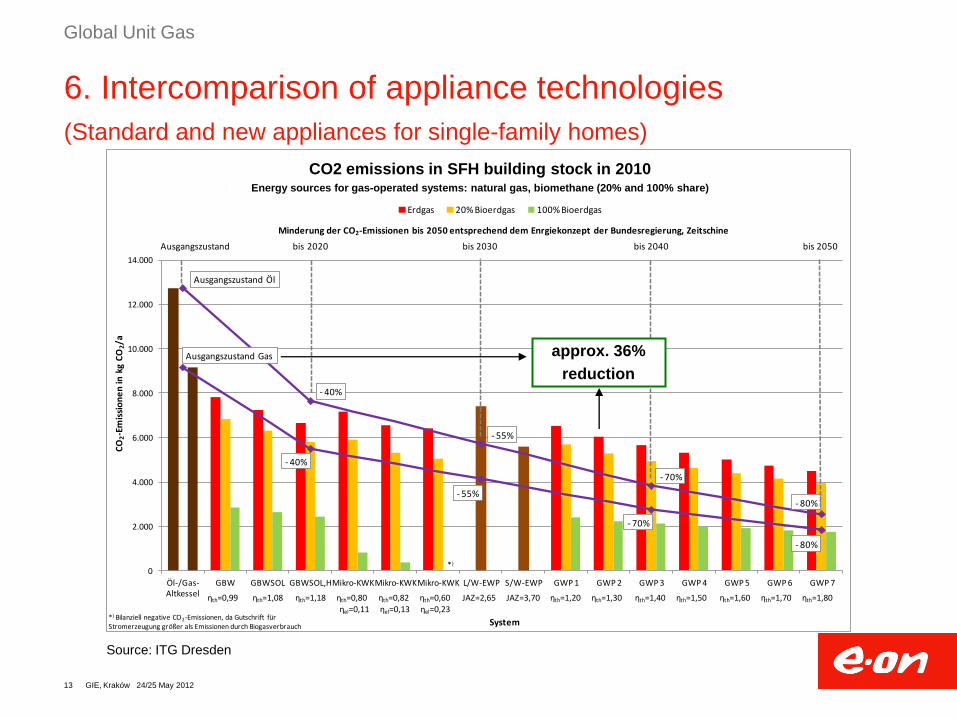
6. Intercomparison of appliance technologies
(Standard and new appliances for single-family homes)
Ausgangszustand Öl
- 40%
- 55%
- 70%
- 80%
Ausgangszustand Gas
- 40%
- 55%
- 70%
- 80%
0
2.000
4.000
6.000
8.000
10.000
12.000
14.000
Öl-/Gas-Altkessel
GBW GBWSOL GBWSOL,HMikro-KWKMikro-KWKMikro-KWK L/W-EWP S/W-EWP GWP 1 GWP 2 GWP 3 GWP 4 GWP 5 GWP 6 GWP 7
CO
2-E
mis
sio
ne
n in
kg
CO
2/a
System
CO2-Emissionen im EFH Bestand, 2010 Energieträger bei gasbetriebenen Systemen: Erdgas, Bioerdgas (20% und 100% Anteil)
Erdgas 20% Bioerdgas 100% Bioerdgas
Ausgangszustand bis 2020 bis 2030 bis 2040 bis 2050
Minderung der CO2-Emissionen bis 2050 entsprechend dem Enrgiekonzept der Bundesregierung, Zeitschine
ηth=0,99 ηth=1,08 ηth=1,18 ηth=0,80 ηth=0,82 ηth=0,60 JAZ=2,65 JAZ=3,70 ηth=1,20 ηth=1,30 ηth=1,40 ηth=1,50 ηth=1,60 ηth=1,70 ηth=1,80
ηel=0,11 ηel=0,13 ηel=0,23 *) Bilanziell negative CO2-Emissionen, da Gutschrift für Stromerzeugung größer als Emissionen durch Biogasverbrauch
*)
approx. 36%
reduction
Source: ITG Dresden
CO2 emissions in SFH building stock in 2010 Energy sources for gas-operated systems: natural gas, biomethane (20% and 100% share)

Global Unit Gas
GIE, Kraków 24/25 May 2012 14
6. Intercomparison of appliance technologies
(Standard and new appliances for single-family homes)
approx. 35%
reduction
Source: ITG Dresden
Non-renewable primary energy demand in SFH building stock Energy sources for gas-operated systems: natural gas, biomethane (20% and 100% share)

Global Unit Gas
GIE, Kraków 24/25 May 2012 15
6. Intercomparison of appliance technologies
(Standard and new appliances for single-family homes)
18%
30%
45%
60%
0%
10%
20%
30%
40%
50%
60%
70%
80%
GBW GBWSOL GBWSOL,H Mikro-KWK Mikro-KWK Mikro-KWK L/W-EWP S/W-EWP GWP 1 GWP 2 GWP 3 GWP 4 GWP 5 GWP 6 GWP 7
An
teil
ern
eu
erb
are
r En
erg
ien
System
Anteil erneuerbarer Energien im EFH BestandEnergieträger bei gasbetriebenen Systemen: Erdgas, Bioerdgas (20% und 100% Anteil)
Erdgas 20% Bioerdgas 100 % Bioerdgas
bis 2020 bis 2030 bis 2040 bis 2050
Entwicklung des Anteils erneuerbaren Energien bis 2050 entsprechend dem Enrgiekonzept der Bundesregierung, Zeitschine
ηth=0,99 ηth=1,08 ηth=1,18 ηth=0,80 ηth=0,82 ηth=0,60 JAZ=2,65 JAZ=3,70 ηth=1,20 ηth=1,30 ηth=1,40 ηth=1,50 ηth=1,60 ηth=1,70 ηth=1,80
ηel=0,11 ηel=0,13 ηel=0,23
Source: ITG Dresden
Share of renewable energies in SFH building stock Energy sources for gas-operated systems: natural gas, biomethane (20% and 100% share)

Global Unit Gas
GIE, Kraków 24/25 May 2012 16
6. Intercomparison of appliance technologies
(Standard and new appliances for single-family homes)
Ausgangszustand Öl
- 40%
- 55%
- 70%
- 80%
Ausgangszustand Gas
- 40%
- 55%
-70%
- 80%
0
2.000
4.000
6.000
8.000
10.000
12.000
14.000
Öl-/Gas-Altkessel
GBW GBWSOL GBWSOL,H Mikro-KWK Mikro-KWK L/W-EWP S/W-EWP GWP 1 GWP 2 GWP 3 GWP 4 GWP 5 GWP 6 GWP 7
CO
2-E
mis
sio
ne
n in
kg
CO
2/a
System
CO2-Emissionen im EFH Bestand, 2020 Energieträger bei gasbetriebenen Systemen: Erdgas, Bioerdgas (20% und 100% Anteil)
Erdgas 20% Bioerdgas 100% Bioerdgas
Ausgangszustand bis 2020 bis 2030 bis 2040 bis 2050
Minderung der CO2-Emissionen bis 2050 entsprechend dem Enrgiekonzept der Bundesregierung, Zeitschine
ηth=0,99 ηth=1,08 ηth=1,18 ηth=0,80 ηth=0,65 JAZ=2,80 JAZ=3,90 ηth=1,20 ηth=1,30 ηth=1,40 ηth=1,50 ηth=1,60 ηth=1,70 ηth=1,80
ηel=0,15 ηel=0,25 *) Bilanziell negative CO2-Emissionen, da Gutschrift für Stromerzeugung größer als Emissionen durch Biogasverbrauch
*) *)
approx. 46%
reduction
Source: ITG Dresden
CO2 emissions in SFH building stock in 2020 Energy sources for gas-operated systems: natural gas, biomethane (20% and 100% share)

Global Unit Gas
GIE, Kraków 24/25 May 2012 17
6. Intercomparison of appliance technologies
(Standard and new appliances for single-family homes)
Ausgangszustand Öl
- 40%
- 55%
- 70%
- 80%
Ausgangszustand Gas
- 40%
- 55%
-70%
- 80%
0
2.000
4.000
6.000
8.000
10.000
12.000
14.000
Öl-/Gas-Altkessel
GBW GBWSOL GBWSOL,H Mikro-KWK Mikro-KWK L/W-EWP S/W-EWP GWP 1 GWP 2 GWP 3 GWP 4 GWP 5 GWP 6 GWP 7
CO
2-E
mis
sio
ne
n in
kg
CO
2/a
System
CO2-Emissionen im EFH Bestand, 2030 Energieträger bei gasbetriebenen Systemen: Erdgas, Bioerdgas (20% und 100% Anteil)
Erdgas 20% Bioerdgas 100% Bioerdgas
Ausgangszustand bis 2020 bis 2030 bis 2040 bis 2050
Minderung der CO2-Emissionen bis 2050 entsprechend dem Enrgiekonzept der Bundesregierung, Zeitschine
ηth=0,99 ηth=1,08 ηth=1,18 ηth=0,80 ηth=0,65 JAZ=3,00 JAZ=4,10 ηth=1,20 ηth=1,30 ηth=1,40 ηth=1,50 ηth=1,60 ηth=1,70 ηth=1,80
ηel=0,15 ηel=0,25 *) Bilanziell negative CO2-Emissionen, da Gutschrift für Stromerzeugung größer als Emissionen durch Biogasverbrauch
*)
Increased biomethane share
required to reach target
Source: ITG Dresden
CO2 emissions in SFH building stock in 2030 Energy sources for gas-operated systems: natural gas, biomethane (20% and 100% share)
Global Unit Gas
GIE, Kraków 24/25 May 2012 18
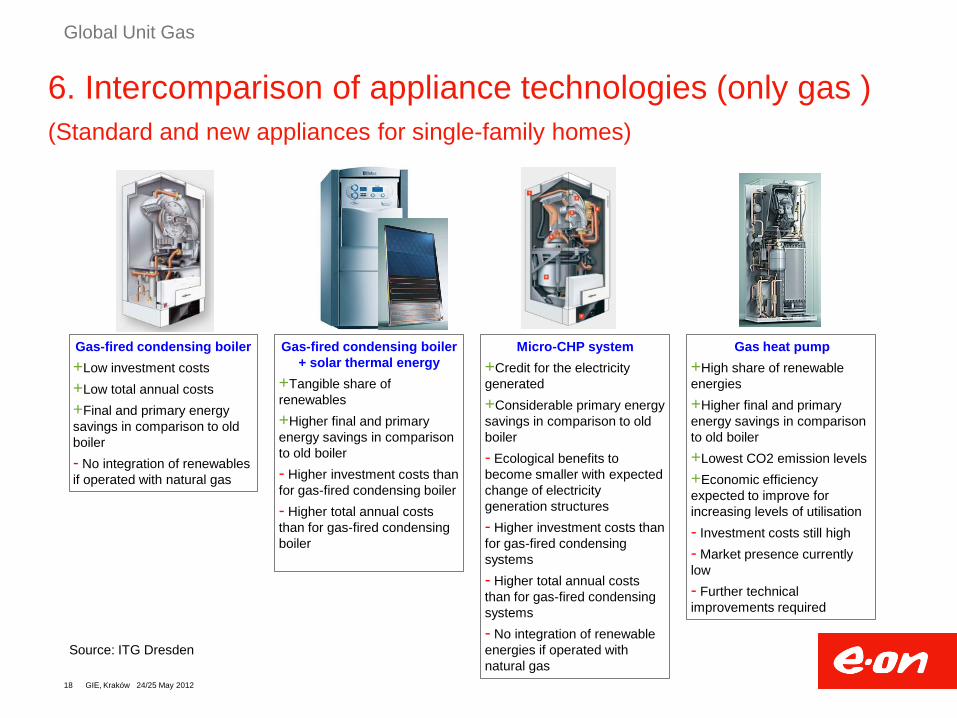
6. Intercomparison of appliance technologies (only gas )
(Standard and new appliances for single-family homes)
Gas-fired condensing boiler
+Low investment costs
+Low total annual costs
+Final and primary energy
savings in comparison to old
boiler
- No integration of renewables
if operated with natural gas
Gas-fired condensing boiler
+ solar thermal energy
+Tangible share of
renewables
+Higher final and primary
energy savings in comparison
to old boiler
- Higher investment costs than
for gas-fired condensing boiler
- Higher total annual costs
than for gas-fired condensing
boiler
Micro-CHP system
+Credit for the electricity
generated
+Considerable primary energy
savings in comparison to old
boiler
- Ecological benefits to
become smaller with expected
change of electricity
generation structures
- Higher investment costs than
for gas-fired condensing
systems
- Higher total annual costs
than for gas-fired condensing
systems
- No integration of renewable
energies if operated with
natural gas
Gas heat pump
+High share of renewable
energies
+Higher final and primary
energy savings in comparison
to old boiler
+Lowest CO2 emission levels
+Economic efficiency
expected to improve for
increasing levels of utilisation
- Investment costs still high
- Market presence currently
low
- Further technical
improvements required
Source: ITG Dresden
Global Unit Gas
GIE, Kraków 24/25 May 2012 19
7. Conclusion
New gas technologies (micro-CHP, gas heat pumps) are about to come into
the market in Germany on a major scale.
These technologies meet environmental requirements in the long term.
Compared with the current state of the art, some further technical
developments and a reduction in capital expenditure are required and
achievable.
Global Unit Gas
GIE, Kraków 24/25 May 2012 20
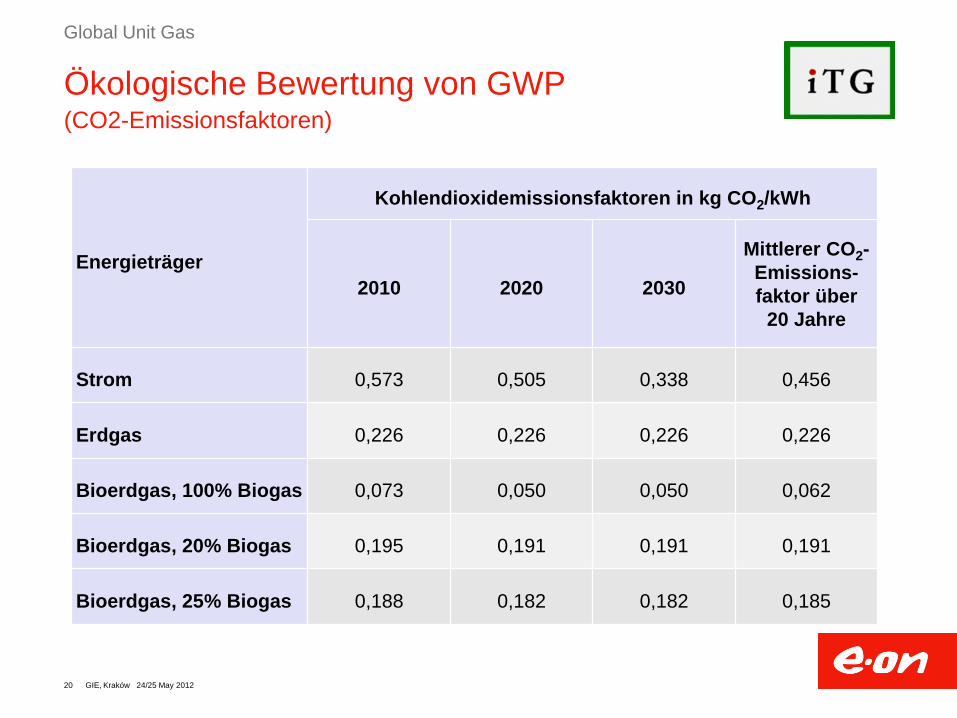
Energieträger
Kohlendioxidemissionsfaktoren in kg CO2/kWh
2010 2020 2030
Mittlerer CO2-
Emissions-
faktor über
20 Jahre
Strom 0,573 0,505 0,338 0,456
Erdgas 0,226 0,226 0,226 0,226
Bioerdgas, 100% Biogas 0,073 0,050 0,050 0,062
Bioerdgas, 20% Biogas 0,195 0,191 0,191 0,191
Bioerdgas, 25% Biogas 0,188 0,182 0,182 0,185
Ökologische Bewertung von GWP (CO2-Emissionsfaktoren)