An Innovative Approach to Managing Diabetes in a Large Public Health System Donna J. Calvin, PhD,...
28
An Innovative Approach to Managing Diabetes in a Large Public Health System Donna J. Calvin, PhD, FNP-BC, CNN Post Doctoral Research Associate University of Illinois at Chicago College of Nursing Department of Health Systems Science October 29, 2012
-
Upload
lorena-carter -
Category
Documents
-
view
213 -
download
0
Transcript of An Innovative Approach to Managing Diabetes in a Large Public Health System Donna J. Calvin, PhD,...
An Innovative Approach to Managing Diabetes in a Large Public Health
System
Donna J. Calvin, PhD, FNP-BC, CNN
Post Doctoral Research AssociateUniversity of Illinois at ChicagoCollege of NursingDepartment of Health Systems ScienceOctober 29, 2012

Oak Forest Hospital Fantus Clinic
Woodlawn Health CenterEnglewood Health Center

Background
0% 5% 10% 15% 20%
African Americans
Hispanics
Whites
US
Disparity in the Prevalence of Diabetes in Chicago

Background
Chicago Diabetes Death Rates
per 100,000
CDPH, 2004

Background
Chicago Plan for Public Health System Improvement, 2012-2016
Diabetes Hospitalizations by Chicago Zip Codes,
2007

Access
Cultural incongruence
Lack of knowledge - Provider - Patient
Background

United States
13 millionMean A1C 7.6%50% < 725% > 9.0
Chicago-County Clinics
40,000 Mean A1C 8.8% 18% < 7.0% 60% > 9.5%
2001 data

PurposeTo determine the impact of a system-level quality assurance program aimed to improve diabetes outcomes among an urban minority population.
GoalReduce the average blood glucose level (A1C) among a low income, predominately African American and Hispanic population.
Optimal HbA1c (A1C) <7.0 %
A measure of chronic glucose control, and reflects the
prevailing level of glycemia over the past three months.

Cost of managing diabetes:$174 billion total
$116 billion medical expenditures
$58 billion in reduced national productivity
Significance

Benefits of Decreasing A1C by 1%
Significance
14% 14%
Decrease in risk of all Diabetes
complications
40% 40%
Decrease in risk of microvascular
diseases

Decreasing A1C Prevents:
Blindness
Kidney Failure
Amputation
Significance

What Should We Do?

Our Evidence-Based Program
Network Diabetes Program

Ophthalmologists
Physician/NURSE
Dieticians
Social Worker &Psychologist
Pharmacists
Family/FriendsPodiatrists
Patient
.
Providers
Our Evidence-Based Program

Our Evidence-Based Program
Motivational interviewing
Apply multidisciplinary approach
ABC goals
Signs, symptoms and treatment of hyper/ hypoglycemia self-management of hypo and hyperglycemia
Glucometer (prepare for testing and action if meter breaks or not functioning)
Provider-Level Strategies: Nurses receive three days of intensive education
Our Evidence-Based Program
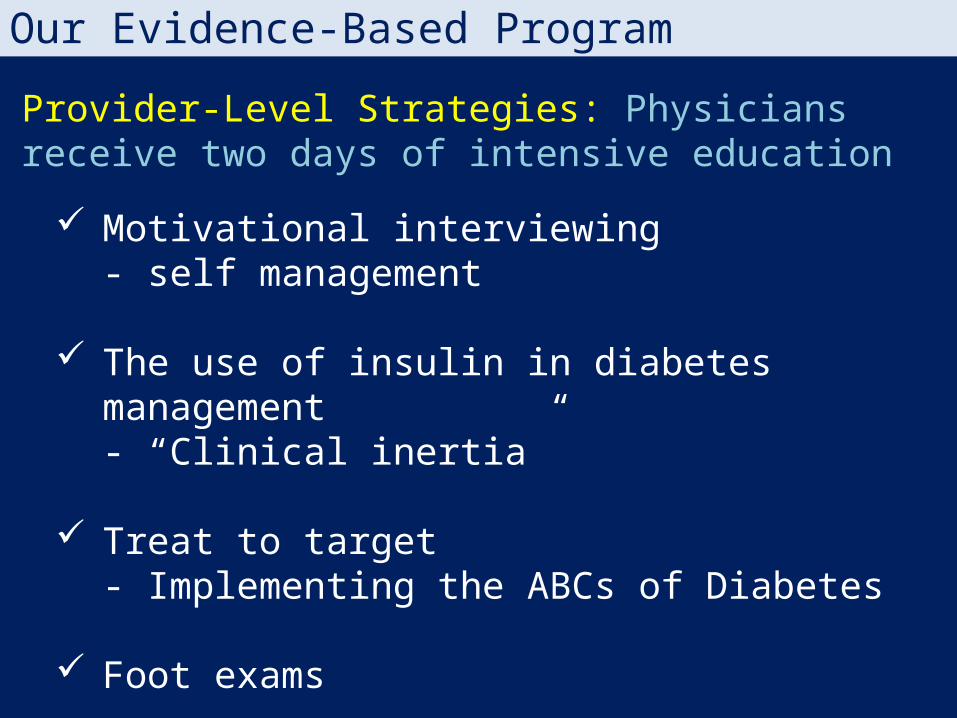
Motivational interviewing - self management
The use of insulin in diabetes management- “Clinical inertia”
Treat to target- Implementing the ABCs of Diabetes
Foot exams
Provider-Level Strategies: Physicians receive two days of intensive education

Our Evidence-Based Program
Patient-Level Strategies
Multicultural staff provide one-on-one encounters:
Knowledge Test
Basic discussion of diabetes
Review of lab results
Assessment of: dietary habits, lifestyle, psychosocial problems

Our Evidence-Based Program
Patient-Level Strategies
Adjustment of diabetes medication
Referral to: PCP, ophthalmology, podiatry, social worker and/or psychologist as needed
Appointment to attend diabetes class

Our Evidence-Based Program
Overview of diabetes
Basic self-management skills
Glucose monitoring
A personal consultation after the group class to discuss concerns and misperceptions
HbA1ccarbohydrates
strokeRetinopathy
Heart disease
Foot care
ESRD
Eating out
Diabetes Class (Spanish & English)
Our Evidence-Based Program
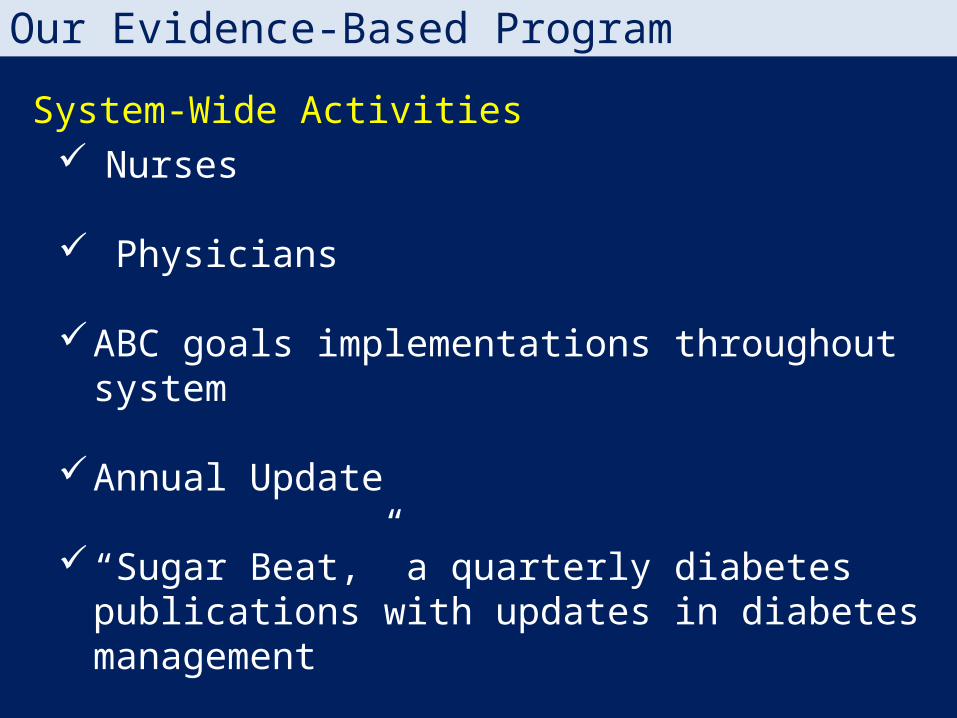
Nurses
Physicians
ABC goals implementations throughout system
Annual Update
“Sugar Beat,” a quarterly diabetes publications with updates in diabetes management
System-Wide Activities
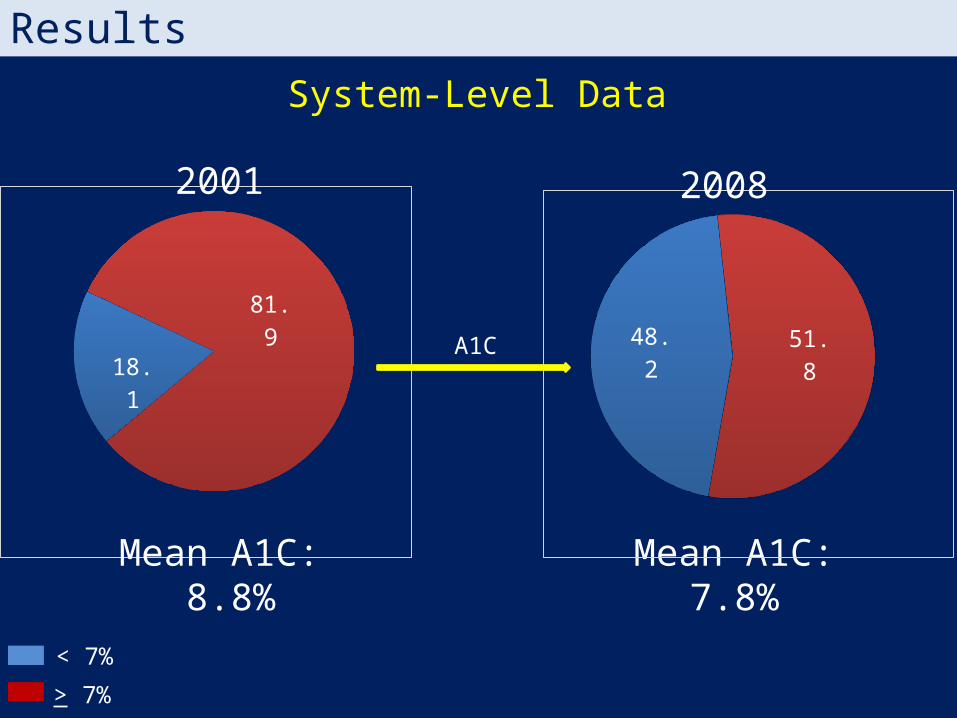
Results
18.181.9
Mean A1C:7.8%
48.2 51.8
< 7%
Mean A1C: 8.8%
> 7%
A1C
2001
System-Level Data
2008

Results
31%69%
78% 22%
System-Level DataA1C over 9.5%
2001 2008
< 9.5
> 9.5

12 Wk 26 Wk7.5
8
8.5
9
9.5
109.84 9.81
8.54
8.71
A1c_first A1c_lastN=5,922
NDP Data - More Complex PatientsCrossectional Analysis 2001-2012
ResultsA
1C
N=4,589

Summary of QA Program
Our Evidence-based Program is Effective:
Meeting national goals
American Diabetes Association (ADA) recognition
Continuity of care

Future Directions
Lifestyle Center
Last chance clinic
Diabetes Group visits
Collect and analyze data to determine what aspect of our program has the greatest impact

Elements of the Program
Treating difficult patients
Enhancing provider’s skills
Uniform management in the system (ABC)

Thank You!
Model for other publicly financed primary health
care systems

Thank You!
Questions?