An Information Literacy Snapshot: Authentic Assessment ...
18
170 An Information Literacy Snapshot: Authentic Assessment across the Curriculum Wendy Holliday, Betty Dance, Erin Davis, Britt Fagerheim, Anne Hedrich, Kacy Lundstrom, and Pamela Martin Wendy Holliday is Head of Teaching, Learning, and Research, at Northern Arizona University; e-mail: [email protected]. Bey Dance is Reference & Instruction Librarian, Erin Davis is Coordinator of Regional Campuses & E-Learning Librarian, Bri Fagerheim is Reference & Instruction Department Head, Anne Hedrich is Reference & Instruction Librarian, Kacy Lundstrom is Coordinator of Library In- struction, and Pamela Martin is Coordinator of Outreach and Peer Learning, all at Utah State University; e-mail: [email protected], [email protected], [email protected], [email protected], kacy. [email protected], [email protected]. © 2015 Wendy Holliday, Bey Dance, Erin Davis, Bri Fagerheim, Anne Hedrich, Kacy Lundstrom, and Pamela Martin, Aribution-NonCommercial (hp:// creativecommons.org/licenses/by-nc/3.0/) CC BY-NC. This paper outlines the process and results of an authentic assessment of student work using a revised version of the AAC&U’s Information Literacy VALUE rubric. This rigorous assessment, which included the scoring of nearly 900 student papers from four different stages across the undergraduate curriculum, revealed much about the process of authentic assessment of student learning, the struggles and competencies of our students, and a clear path forward for improving practice. It also gave us a broad view of student learning, allowing us to immerse ourselves in student work and providing a stronger narrative to share with stakeholders. or the last several years, stakeholders across higher education have been calling for greater accountability and transparency, especially in the assess- ment of student learning. High-profile books and articles have questioned the degree to which students are actually learning the knowledge and skills required to be successful and productive citizens. 1 Reform movements are challenging the status quo, including the credit-hour system for defining degrees, and calling for clearer definitions of learning outcomes and competency-based measures of success and completion. 2 Libraries have been engaged in this larger discourse at both local and national levels. The ACRL Value of Academic Libraries Report calls on librarians to articulate and demonstrate value to their larger institutions not on the basis of outputs, such as col- lection size or patrons served, but on the basis of their impact on student learning and success. 3 The Value Report, along with the broader higher education reform movement, requires clearly defined learning outcomes and more effective ways to assess student learning. Assessment is central to all of these efforts, not just to document a library’s contributions to student learning, but to “close the loop” and improve teaching and doi:10.5860/crl.76.2.170 crl14-575 brought to you by CORE View metadata, citation and similar papers at core.ac.uk provided by OpenKnowledge@NAU
Transcript of An Information Literacy Snapshot: Authentic Assessment ...

170
An Information Literacy Snapshot: Authentic Assessment across the Curriculum
Wendy Holliday, Betty Dance, Erin Davis, Britt Fagerheim, Anne Hedrich, Kacy Lundstrom, and Pamela Martin
Wendy Holliday is Head of Teaching, Learning, and Research, at Northern Arizona University; e-mail: [email protected]. Betty Dance is Reference & Instruction Librarian, Erin Davis is Coordinator of Regional Campuses & E-Learning Librarian, Britt Fagerheim is Reference & Instruction Department Head, Anne Hedrich is Reference & Instruction Librarian, Kacy Lundstrom is Coordinator of Library In-struction, and Pamela Martin is Coordinator of Outreach and Peer Learning, all at Utah State University; e-mail: [email protected], [email protected], [email protected], [email protected], [email protected], [email protected]. © 2015 Wendy Holliday, Betty Dance, Erin Davis, Britt Fagerheim, Anne Hedrich, Kacy Lundstrom, and Pamela Martin, Attribution-NonCommercial (http://creativecommons.org/licenses/by-nc/3.0/) CC BY-NC.
This paper outlines the process and results of an authentic assessment of student work using a revised version of the AAC&U’s Information Literacy VALUE rubric. This rigorous assessment, which included the scoring of nearly 900 student papers from four different stages across the undergraduate curriculum, revealed much about the process of authentic assessment of student learning, the struggles and competencies of our students, and a clear path forward for improving practice. It also gave us a broad view of student learning, allowing us to immerse ourselves in student work and providing a stronger narrative to share with stakeholders.
or the last several years, stakeholders across higher education have been calling for greater accountability and transparency, especially in the assess-ment of student learning. High-profile books and articles have questioned the degree to which students are actually learning the knowledge and skills
required to be successful and productive citizens.1 Reform movements are challenging the status quo, including the credit-hour system for defining degrees, and calling for clearer definitions of learning outcomes and competency-based measures of success and completion.2
Libraries have been engaged in this larger discourse at both local and national levels. The ACRL Value of Academic Libraries Report calls on librarians to articulate and demonstrate value to their larger institutions not on the basis of outputs, such as col-lection size or patrons served, but on the basis of their impact on student learning and success.3 The Value Report, along with the broader higher education reform movement, requires clearly defined learning outcomes and more effective ways to assess student learning. Assessment is central to all of these efforts, not just to document a library’s contributions to student learning, but to “close the loop” and improve teaching and
doi:10.5860/crl.76.2.170 crl14-575
brought to you by COREView metadata, citation and similar papers at core.ac.uk
provided by OpenKnowledge@NAU

An Information Literacy Snapshot 171
learning. It is not enough to demonstrate value at isolated moments in time and in discrete pockets of the university. Assessments must provide actionable evidence of areas of success and weakness, at the assignment, classroom, and curricular level to allow librarians to make changes at all of these points to improve student learning.
Merrill-Cazier Library at Utah State University (USU) is a research library that supports a course- and curriculum-integrated approach to information literacy (IL) instruction, working with faculty to identify the most effective courses and instruc-tional approaches to teach information literacy in general education and the major. We believe that information literacy should be sequenced throughout the curriculum in a “ratcheted” approach, beginning with basic skills in freshman composition and culminating in more discipline-specific and sophisticated learning experiences in senior-level courses in each major. Students should build upon prior learning experiences and practice IL skills with greater independence as they move through their coursework.
At USU, the foundation for information literacy is established in required first- and second-year composition courses (though students can test out of the first year). Stu-dents in those courses receive an average of two to four library instruction sessions, usually in a library instruction classroom focused on hands-on research with assistance from a librarian. Many students also receive disciplinary instruction in their majors, usually in an introductory or mid-level course. Librarians are currently in the process of using curriculum mapping to further identify which courses and assignments in the disciplines are best suited for library instruction integration. Both disciplinary courses used in this study did receive library instruction and are required by their major.
Previously, we completed several smaller assessments of student learning, mainly in the English composition courses. Our prior assessments, however, did not give us an accurate picture of how students were developing IL skills across the curriculum. We had isolated assessment data, including rubric-based analysis of student papers and citation analyses of bibliographies, but our assessments usually used convenience samples from classes and instructors who agreed to cooperate. We also had older data from the Standardized Assessment of Information Literacy Skills test, but this did not tell us much about actual student performance of IL skills, including using informa-tion for a purpose and evaluating information in disciplinary contexts. These data, along with anecdotal evidence from librarians and faculty, indicated that students were locating and citing high-quality scholarly sources, but that they were not using information effectively in their writing. In particular, students struggled in choosing sources that best supported their thesis and they failed to place sources in conversation with one another, and with their own voice, in meaningful ways. This generally resulted in weaker arguments and less effective use of evidence. National studies confirmed these suspicions.4 We also had no solid assessment data to see whether students were further developing their IL skills in their majors.
We decided to conduct a large-scale authentic assessment project to address several of these concerns. First, we wanted to review actual student work, using a rubric, so that we could see how students were using information in their writing, rather than just measuring what kinds of sources they were locating and citing. Second, we wanted to get a sense of how students were developing skills across the curriculum and not just in a single class. We selected four courses from different areas of the curriculum, most of which received IL instruction, which would illustrate trends in students’ IL performance at different levels (freshman and sophomore introductory composition courses, a mid-level psychology course, and a capstone history course). We decided to use the AAC&U VALUE rubric for Information Literacy for several reasons.5 First, our institution had already incorporated the “Essential Learning Outcomes” that the rubric addresses. The VALUE rubrics are premised upon a shared understanding of

172 College & Research Libraries March 2015
student learning outcomes and performance, developed by faculty experts, including librarians. They are also designated as “beta” products to be evaluated and revised through actual practice. Finally, they are “meta-rubrics” that provide assessment criteria across a span of coursework or an entire degree, rather than for a specific assignment or course. We assume that it takes a well-designed and -executed curriculum, not just individual courses, activities, and assignments, to teach IL effectively. The meta-rubric approach matched our goals to investigate how our IL program measured up in this more holistic sense.
Literature ReviewLibraries have long tried to improve library instruction and demonstrate value through assessment. However, librarians have often measured how students feel about instruc-tion or learning, rather than measuring what students actually learn.6 A 2012 review of IL assessment methods found a lack of systematic evaluation in student learning outcomes, concluding that more “meaningful evidence,” rather than just affective measures, is needed.7 Scharf emphasizes potential issues with relying on informa-tion literacy assessment based on surveys and multiple choice tests, including costs and limited information provided on performance.8 In addition, Oakleaf worries that libraries have little “experience assessing their impact in ways that have campuswide relevance,” calling on librarians to assess their impact across campus.9 To answer these challenges, many librarians are rethinking the methodologies used to measure the learning outcomes of library instruction. This has led to increased focus on authentic assessment, including assessing student works and looking at IL more holistically, rather than relying on traditional, or discrete, assessment practices. Our study relies heavily on literature relating to authentic assessment, and particularly to the use of rubrics in this process.
The literature defines authentic assessment in a variety of ways. Gulikers, Bastiaens, and Kirschner discuss some of the differing opinions on the definition of authentic assessment, and develop a five-point framework, which include the task, the physical or virtual context, the social context, the results and the criteria.10 Similarly, Mueller describes it as “assessment in which students are asked to perform real-world tasks that demonstrate meaningful application of essential knowledge and skills.”11 Accord-ing to Whitlock and Nanavati, authentic assessment looks at “what students can do in real-world contexts, attempting to measure students’ skill acquisition when the need for the skill and the use of the skill arise from a real-life situation.”12 Whitlock and Nanavati provide a process for authentic and performative assessment. Performative assessment entails assessing students’ skills in fulfilling an activity or action that has been the focus of instruction, but not necessarily the precise task the students will use in their coursework or a real-life task.13 The authors draw on information literacy and instructional design principles to provide an outline of steps and techniques librarians can use for developing their own program of authentic and performative assessment. For library instruction, authentic assessment could entail assessing students’ final re-search papers for a particular course, rather than measuring the students’ skills based on a quiz provided at the end of a library instruction session. Our study focuses on assessing research papers from students who had received library instruction to more accurately understand their information literacy abilities.
Recent research provides a range of examples of authentic assessment applied in academic libraries. Librarians are increasingly using rubrics to evaluate student work. Rubrics have been used to assess student bibliographies, student papers, or entire portfolios.14 Diller and Phelps used rubrics to assess e-Portfolios, determining that the use of rubrics in this process “directly measures student progress on meeting
An Information Literacy Snapshot 173
the goals of the [IL] program…and it attempts to see progress through the eyes of the students by asking for reflection on each artifact and how it affected learning.”15 Emmons and Martin conducted a rubric assessment of student papers to test the im-pact of their information literacy program, which included developing a rubric that they later shared with English instructors. Instructors were “particularly interested in the rubric as a device for teaching students and for evaluating the quality of their research.”16 Choinski, Mark, and Murphey developed and conducted a rubric assess-ment; while they acknowledge issues relating to refinement and use of rubrics, they determine that rubrics are objective and are “a useful tool to add to the assessment arsenal.”17 In a similar study, Knight emphasizes the usefulness of assessment data collected using rubrics as being easily reported and understood by stakeholders.18 Many of these studies are valuable because they examine complex student works to paint a “big picture” of IL on campus.
Oakleaf’s work on authentic assessment and rubrics formed the basis for our snapshot approach.19 We gathered individual student papers from classes spanning the curriculum and modified the IL VALUE rubric to score the papers.20 The VALUE rubrics were created in 2007 by the Association of American Colleges and Universities. Fifteen teams of faculty and academic professionals created rubrics for the 15 Essential Learning Outcomes, which include lifelong learning, creative thinking and information literacy, to name a few. The goal was to create a “broadly shared understanding of what student learning in each of the 15 outcome areas should look like at progressively more complex and sophisticated levels of performance…”21 Modifications of the VALUE rubrics are often necessary to “accurately reflect actual learning as it is framed on a particular campus.”22 The IL VALUE rubric gave us a solid start to determine how a student’s skills might progress in this area, relating to five key categories. As encour-aged by the developers of these rubrics, we revised it as needed to suit the particular needs of our students and institution.
Assessors using rubrics are also encouraged to participate in “calibration” or training to reach agreement on scores.23 Published IL studies that have used rubrics or “scor-ing sheets” mention that training scorers to reach agreement is an important part of this process that cannot be overemphasized.24 Ultimately, once agreement is achieved through calibration, librarians only have to score select papers, saving them valuable time. For a large portion of our sample, we calibrated our team of scorers to allow us to avoid having every scorer read every paper.
MethodsIdeally, a longitudinal assessment can track the individual progress of students as they move through the university curriculum. After discussing the possibilities of a longitudinal study with our institutional research office, we decided against this ap-proach for practical reasons. Following individual students would take considerable time, given that a large percentage of our student population takes a two-year leave of absence in the middle of their undergraduate degree to pursue a religious mission. Second, we did not have any benchmark data or established measures for comparison over time. Rubric-based assessments require consistent scoring and agreement, and we needed to establish a sound baseline of consensus in the library and on campus of what different levels of IL performance look like across the curriculum.
We therefore decided to conduct a “snapshot” assessment. We wanted to see, in a given 12- to 18-month period, how students performed at four key stages in the curricu-lum: an introductory writing course, an intermediate writing course, an introductory research methods class in a major, and a capstone course. We did not assess the same student at each level; instead, we assessed different students in four selected courses.

174 College & Research Libraries March 2015
While students take these courses at different times and in different sequences, these courses generally progress from the freshman year (the introductory writing course) through the senior year (the capstone course).
SampleIn total, we scored 884 student papers using the VALUE rubric. We collected a total of 488 papers from 32 (out of a total of 56) sections of ENGL 1010 in fall 2010. The goal was to capture as many students who were taking ENGL 1010 as freshmen during their first semester of study as possible. Three of six online sections participated. Some sections of ENGL 1010, especially those online, do not consistently include a research component, so some sections did not have assignments that met our criteria. We randomly selected eight papers from each of the 32 sections that provided more than eight papers. Four sections provided fewer than eight papers, and we included all of these in the sample. We chose eight as our sample number from each section because it provided a strong, large sample and all but the four mentioned sections had at least eight papers to contribute. The total enrollment for the course was 1,932 in fall 2010, and we had a final usable sample of 270 (14% of the total enrollment). In spring 2011 we collected papers from 56 of 57 ENGL 2010 sections, including eight distance sec-tions. Participation was much higher for this course, because the English department was conducting its own assessment of student work and we piggybacked on their data collection. We collected 20–23 papers from each section and randomly selected eight papers from each section, for a total usable sample of 468 papers, representing 27 percent of the total enrollment. For the psychology and history classes, we decided not to sample the papers because of much smaller enrollments. We collected papers from all students willing to participate in the study. Participation rates ranged from a low of 0 percent in two sections of PSY 3500 to a high of 100 percent in a HIST 4990 section (capstone course). For PSY 3500 (mid-level, required, discipline course), we obtained 101 usable papers, or 49 percent of the total enrollment in fall 2010 and spring 2011. We collected a total of 45 papers, or 83 percent of the total enrollment for HIST 4990 between 2009 and 2011.25
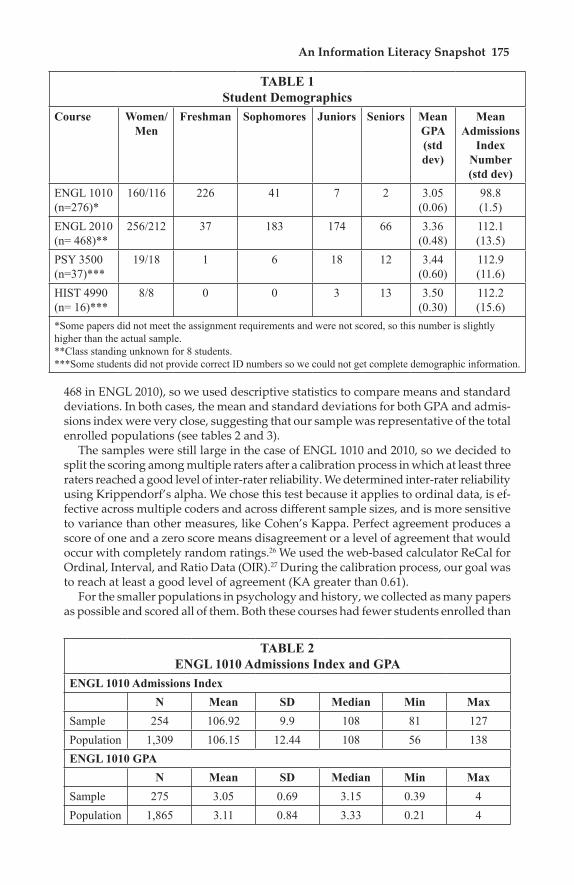
We stripped identifying information from the papers and attached a numeric code so that we could track papers by section. We sent the student ID numbers to our in-stitutional research office to collect demographic data. (See table 1 for an overview of student demographics.)
Rating ProceduresWe used two different rating procedures, given the different population and sample sizes for each course. We went through a norming process, determined by inter-rater reliability tests, with the composition papers and then split the scoring between rat-ers. Multiple raters read the psychology and history papers and reached consensus scores through discussion. The ENGL 1010 and 2010 courses have large enrollments, so we drew a random sample because it was not feasible to score all of the papers. We compared demographic data for the samples to the entire population of students enrolled in each course, including gender, class standing, GPA, and admissions in-dex (a combination of high school GPA and ACT score). The percentage of men and women in both ENGL 1010 and 2010 samples were nearly identical in the sample and total enrolled population. We had unreported data on class standing for a large number of students (especially in ENGL 1010) because of a high number of first-time and provisionally admitted freshmen, so we could not compare our samples based on class standing. We used both GPA and admissions index as proxies for academic achievement or performance. The sample sizes were large (270 in ENGL 1010 and
An Information Literacy Snapshot 175
468 in ENGL 2010), so we used descriptive statistics to compare means and standard deviations. In both cases, the mean and standard deviations for both GPA and admis-sions index were very close, suggesting that our sample was representative of the total enrolled populations (see tables 2 and 3).
The samples were still large in the case of ENGL 1010 and 2010, so we decided to split the scoring among multiple raters after a calibration process in which at least three raters reached a good level of inter-rater reliability. We determined inter-rater reliability using Krippendorf’s alpha. We chose this test because it applies to ordinal data, is ef-fective across multiple coders and across different sample sizes, and is more sensitive to variance than other measures, like Cohen’s Kappa. Perfect agreement produces a score of one and a zero score means disagreement or a level of agreement that would occur with completely random ratings.26 We used the web-based calculator ReCal for Ordinal, Interval, and Ratio Data (OIR).27 During the calibration process, our goal was to reach at least a good level of agreement (KA greater than 0.61).
For the smaller populations in psychology and history, we collected as many papers as possible and scored all of them. Both these courses had fewer students enrolled than
TABLE 1Student Demographics
Course Women/Men
Freshman Sophomores Juniors Seniors Mean GPA (std dev)
Mean Admissions
Index Number (std dev)
ENGL 1010 (n=276)*
160/116 226 41 7 2 3.05 (0.06)
98.8 (1.5)
ENGL 2010 (n= 468)**
256/212 37 183 174 66 3.36 (0.48)
112.1 (13.5)
PSY 3500 (n=37)***
19/18 1 6 18 12 3.44 (0.60)
112.9 (11.6)
HIST 4990 (n= 16)***
8/8 0 0 3 13 3.50 (0.30)
112.2 (15.6)
*Some papers did not meet the assignment requirements and were not scored, so this number is slightly higher than the actual sample.**Class standing unknown for 8 students.***Some students did not provide correct ID numbers so we could not get complete demographic information.
TABLE 2ENGL 1010 Admissions Index and GPA
ENGL 1010 Admissions Index N Mean SD Median Min MaxSample 254 106.92 9.9 108 81 127Population 1,309 106.15 12.44 108 56 138ENGL 1010 GPA N Mean SD Median Min MaxSample 275 3.05 0.69 3.15 0.39 4Population 1,865 3.11 0.84 3.33 0.21 4

176 College & Research Libraries March 2015
the composition courses; so, to have a larger set of papers, we used every paper sub-mitted for the study from the two discipline courses. We reached agreement through a consensus process, with multiple raters scoring most or all of the papers. We did not have extra papers for calibration, as we did with the English courses. One rater scored ENGL 1010, PSY 3500, and HIST 4990 papers and one rater scored both the ENGL 1010 and ENGL 2010 papers, to provide continuity across the four samples.
For ENGL 1010, four raters initially scored six papers drawn randomly from the papers not chosen for the sample. We wanted to, in essence, practice on papers that were not part of the actual assessment. The raters compared scores, especially in areas with low rates of inter-rater reliability. They discussed their interpretations of the rubric, using examples from the papers themselves, and modified the rubric to address areas of confusion. They also added additional scores on the lower end of the scale because the performance categories did not capture the differences that raters were seeing in the examples of student work. The scorers of the ENGL 2010, psychology, and history papers used this revised rubric. (See Appendix A.)
For the ENGL 1010 papers, the raters scored four additional rounds of six papers. During these shorter calibration rounds, they continued to clarify their understand-ing of the rubric. By the end of the fourth round, three raters reached good levels of agreement across all categories. These three raters then scored 30 additional papers, reached good to very good levels of inter-rater reliability, and then scored a subset of the actual sample papers (see table 4).
Five coders, including one of the final ENGL 1010 raters, engaged in a similar process for the ENGL 2010 papers, requiring four rounds of calibration. Three coders achieved good levels of inter-rater reliability by round three (n=30 papers) for categories 2, 3, and 4, but they conducted a fourth round of calibration (n=9 papers) to reach good
levels of agreement for Categories 1 and 5 (see table 5).
Three librarians with subject re-sponsibility in psychology or human development rated the PSY 3500 papers. They conducted iterative rounds of calibration, scoring five papers in each round, discussing areas of strong and weak agreement. After three rounds of calibration, scorers felt they could reach a fair to good level of agreement across most categories. Each rater scored the
TABLE 3ENGL 2010 Admissions Index and GPA
ENGL 2010 Admissions Index N Mean SD Median Min MaxSample 376 112.19 13.98 113 69 140Population 1,301 110.71 13.74 112 63 140ENGL 2010 GPA N Mean SD Median Min MaxSample 466 3.36 0.61 3.5 0.83 4Population 1,597 3.23 0.72 3.42 0.09 4
TABLE 4ENGL 1010 Inter-rater Reliability
(n=30 Papers)Category Level of Agreement One 0.61Two 0.63Three 0.62Four 0.64Five 0.74

An Information Literacy Snapshot 177
remaining papers and reached fair to good agreement across all categories (see table 6). We then determined the final scores through an iterative process of consensus building. We discussed scores that differed substantially across all three scorers, comparing these to “exemplar” papers in each category. We completed a second round of scoring for papers with high rates of disagreement, checked inter-rater reliability, and the two scor-ers with the highest rates of agreement reached a consensus on the final scores through discussion (see table 7).
Three scorers did a similar calibration exercise for the history papers. All of the raters had a background in or liaison responsibility for history. One of these raters also read the ENGL 1010 and PSY 3500 papers. Each scorer read three papers initially and discussed their scores and the rubric. Given the length of the papers (sometimes more than 20 pages), the raters read two more papers and then calculated inter-rater agreement across these five initial papers. Two scorers reached good to excellent levels of agreement. Then one rater scored all of the remaining papers, and a second scorer rated one-third (15) of the papers to check agreement. The level of agreement was good to very good, so we agreed to use the scores of the primary rater as the final scores (see table 8).
TABLE 5ENGL 2010 Inter-rater Reliability
(n=30 Papers or * n=9 Papers)Category Level of Agreement One* 0.60Two 0.84Three 0.62Four 0.61Five* 0.75*Required second round of norming with 9 papers to reach good level of agreement.
TABLE 6PSY 3500 Inter-rater Reliability
PSY 3500 Papers Category One
Category Two
Category Three
Category Four
Category Five
After initial scoring (three raters)
0.434 0.509 0.44 0.412 0.503
After 2nd round scoring (two raters)
0.581 0.953 0.682 0.521 0.623
TABLE 7PSY 3500 Levels of Agreement
PSY 3500 Initial Scores Category One
Category Two
Category Three
Category Four
Category Five
Papers with same score 18% 17% 12% 17% 26%Two scorers the same and other within 0.5 point
28% 49% 41% 34% 0%
Two scorers the same and other within one point
43% 31% 35% 43% 74%
Two scorers the same and other more than one point different
1% 1% 7% 4% 0%
All different scores 9% 3% 6% 3% 0%

178 College & Research Libraries March 2015
Findings Overall, student scores improved in each category between the freshman composi-tion and the junior- and senior-level courses. The improvement of these scores from freshmen to upper-level undergraduates was encouraging. While the improvement cannot directly be attributed to library instruction efforts, it does give a good guide-line for where we might need to focus future efforts. Other factors contributing to the improvement likely include writing instruction quality, research assignment details, student motivation, and student achievement, to name a few. Students had higher scores in the areas of finding and accessing information and using information le-gally. Students struggled most in categories that required critical thinking, including evaluating information, synthesizing information, and using information effectively in their writing. There was more variation in the history students’ scores, but they still showed overall improvement from the lower-level courses. Major variations in student scores, especially in the smaller, discipline-specific samples, are addressed within related categories below.
Category 1: Defines the Extent of Information Needed Students who received low scores in this category tended to have very broad theses and difficulty identifying and defining key concepts. This was especially true in ENGL 1010, resulting in a mode score of one. No ENGL 1010 students scored a three or four in this category, which is to be expected for first-year freshmen (mode = 1). ENGL 2010 students improved in this area (mode = 2) and we could see more students begin to narrow their topics. The key deficiencies were not identifying key concepts and citing information not directly related to their claims (see table 9).
Psychology students did fairly well in this category, with most students scoring between a 2 and 3.5 (mode = 2). The types of sources used were appropriate and key concepts were usually identified, if not always well defined. Students had to write a research proposal, and the scope of their research questions were generally good; but some students still wrote unfocused papers with overly broad theses. The students
TABLE 8HIST 4990 Inter-rater Reliability
HIST 4990 Category One
Category Two
Category Three
Category Four
Category Five
After initial scoring (two raters and four papers)
0.79 0.85 0.72 1.0 0.73
After 2nd round scoring (two raters and 15 papers)
0.74 0.87 0.80 0.89 0.89
TABLE 9Category One (Define Information Need): Percentage of Scores in Each
CourseCategory One
0–0.5 1–1.5 2–2.5 3–3.5 4
ENGL 1010 0.0% 85.6% 14.4% 0.0% 0.0%ENGL 2010 0.2% 28.1% 60.5% 10.8% 0.6%PSY 3500 0.0% 9.9% 68.3% 19.8% 2.0%HIST 4990 0.0% 35.6% 35.6% 28.9% 0.0%
An Information Literacy Snapshot 179
in these cases were not able to identify a problem or question that was answerable in the format of the assignment.
Overall, there was a much wider range of scores for the capstone course, HIST 4990, than was seen in the other courses (the standard deviation for Category 1 was 0.8, on a 4-point scale). There was a possible instructor or class effect, with some sections scoring very high or very low. One section had a mode score of 3 for Category 1 while another had a mode score of 1 (average mode = 2). The students in the high-scoring class, for example, were able to articulate a clear and narrowly focused thesis, grounded in the existing historical literature on the topic. Students scoring at the low end of scale tended to have overly broad theses and were more narrative (in other words, “this is what happened…”) than interpretive and analytical. Like the other courses, low-scoring students identified a broad “topic” and summarized general information they found about that topic (see table 9).
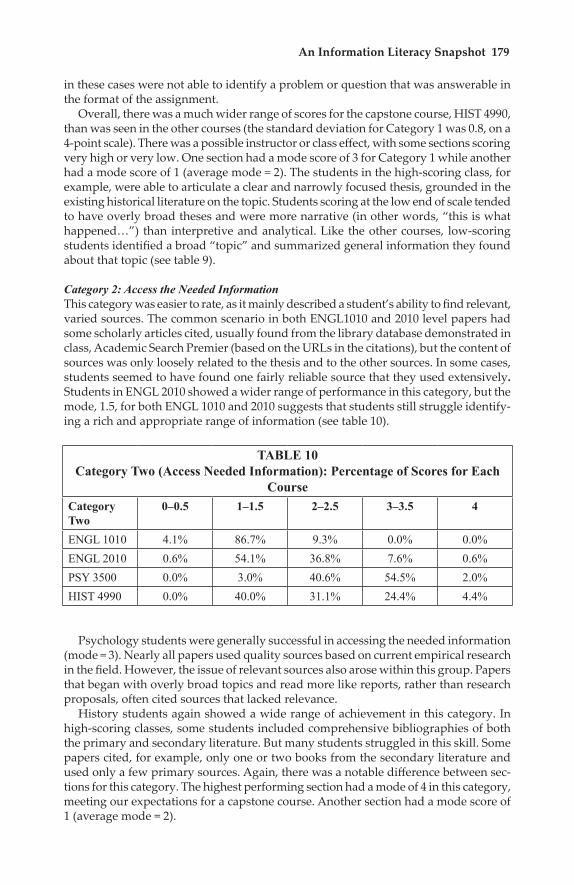
Category 2: Access the Needed Information This category was easier to rate, as it mainly described a student’s ability to find relevant, varied sources. The common scenario in both ENGL1010 and 2010 level papers had some scholarly articles cited, usually found from the library database demonstrated in class, Academic Search Premier (based on the URLs in the citations), but the content of sources was only loosely related to the thesis and to the other sources. In some cases, students seemed to have found one fairly reliable source that they used extensively. Students in ENGL 2010 showed a wider range of performance in this category, but the mode, 1.5, for both ENGL 1010 and 2010 suggests that students still struggle identify-ing a rich and appropriate range of information (see table 10).
Psychology students were generally successful in accessing the needed information (mode = 3). Nearly all papers used quality sources based on current empirical research in the field. However, the issue of relevant sources also arose within this group. Papers that began with overly broad topics and read more like reports, rather than research proposals, often cited sources that lacked relevance.
History students again showed a wide range of achievement in this category. In high-scoring classes, some students included comprehensive bibliographies of both the primary and secondary literature. But many students struggled in this skill. Some papers cited, for example, only one or two books from the secondary literature and used only a few primary sources. Again, there was a notable difference between sec-tions for this category. The highest performing section had a mode of 4 in this category, meeting our expectations for a capstone course. Another section had a mode score of 1 (average mode = 2).
TABLE 10Category Two (Access Needed Information): Percentage of Scores for Each
CourseCategory Two
0–0.5 1–1.5 2–2.5 3–3.5 4
ENGL 1010 4.1% 86.7% 9.3% 0.0% 0.0%ENGL 2010 0.6% 54.1% 36.8% 7.6% 0.6%PSY 3500 0.0% 3.0% 40.6% 54.5% 2.0%HIST 4990 0.0% 40.0% 31.1% 24.4% 4.4%
180 College & Research Libraries March 2015
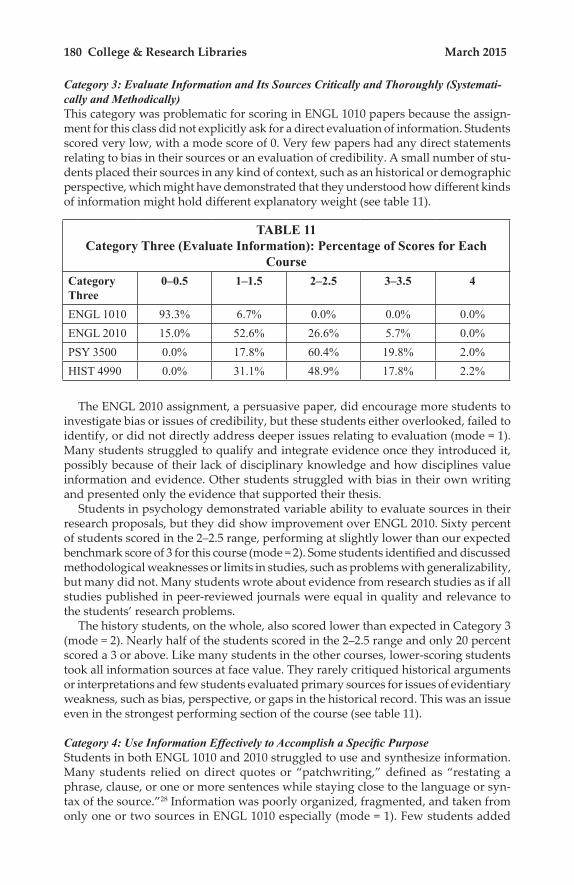
Category 3: Evaluate Information and Its Sources Critically and Thoroughly (Systemati-cally and Methodically) This category was problematic for scoring in ENGL 1010 papers because the assign-ment for this class did not explicitly ask for a direct evaluation of information. Students scored very low, with a mode score of 0. Very few papers had any direct statements relating to bias in their sources or an evaluation of credibility. A small number of stu-dents placed their sources in any kind of context, such as an historical or demographic perspective, which might have demonstrated that they understood how different kinds of information might hold different explanatory weight (see table 11).
The ENGL 2010 assignment, a persuasive paper, did encourage more students to investigate bias or issues of credibility, but these students either overlooked, failed to identify, or did not directly address deeper issues relating to evaluation (mode = 1). Many students struggled to qualify and integrate evidence once they introduced it, possibly because of their lack of disciplinary knowledge and how disciplines value information and evidence. Other students struggled with bias in their own writing and presented only the evidence that supported their thesis.
Students in psychology demonstrated variable ability to evaluate sources in their research proposals, but they did show improvement over ENGL 2010. Sixty percent of students scored in the 2–2.5 range, performing at slightly lower than our expected benchmark score of 3 for this course (mode = 2). Some students identified and discussed methodological weaknesses or limits in studies, such as problems with generalizability, but many did not. Many students wrote about evidence from research studies as if all studies published in peer-reviewed journals were equal in quality and relevance to the students’ research problems.
The history students, on the whole, also scored lower than expected in Category 3 (mode = 2). Nearly half of the students scored in the 2–2.5 range and only 20 percent scored a 3 or above. Like many students in the other courses, lower-scoring students took all information sources at face value. They rarely critiqued historical arguments or interpretations and few students evaluated primary sources for issues of evidentiary weakness, such as bias, perspective, or gaps in the historical record. This was an issue even in the strongest performing section of the course (see table 11).
Category 4: Use Information Effectively to Accomplish a Specific Purpose Students in both ENGL 1010 and 2010 struggled to use and synthesize information. Many students relied on direct quotes or “patchwriting,” defined as “restating a phrase, clause, or one or more sentences while staying close to the language or syn-tax of the source.”28 Information was poorly organized, fragmented, and taken from only one or two sources in ENGL 1010 especially (mode = 1). Few students added
TABLE 11Category Three (Evaluate Information): Percentage of Scores for Each
CourseCategory Three
0–0.5 1–1.5 2–2.5 3–3.5 4
ENGL 1010 93.3% 6.7% 0.0% 0.0% 0.0%ENGL 2010 15.0% 52.6% 26.6% 5.7% 0.0%PSY 3500 0.0% 17.8% 60.4% 19.8% 2.0%HIST 4990 0.0% 31.1% 48.9% 17.8% 2.2%

An Information Literacy Snapshot 181
their own voices to the conversation or made connections between the sources they cited (see table 12).
Students in ENGL 2010 showed improvement (mode = 2) but still failed to make clear connections between sources. They often cited one research study or source per paragraph, for example. Many papers showed no evidence of synthesizing ideas from sources, but used quotation or patchwritten sentences to “back up” an individual claim or the topic sentence of a paragraph.
Students in psychology had varied success in their use of information (mode = 2). Many of the papers were well written and at a level that matched what we expected of third-year students. They showed improvement over the English composition papers (76% of students scoring in the 2–2.5 range and 16% scoring in the 3–3.5 range). The PSY 3500 students wrote more thorough and detailed summaries of their sources than the ENGL 1010 and 2010 students did, but information synthesis was a common area of difficulty for students. Many of the papers were organized by source rather than by topic or idea. Irrelevant details from research studies sometimes distracted from the discussion, and some students did not present information logically and in a way that built a rationale for their research question.
The history papers reflected similar issues. Only 20 percent of papers received a score of 3 or above, and scores were consistently low across sections (mode = 2). Some students overused large block quotations or included irrelevant quotations. Some stu-dents did not effectively summarize the arguments from secondary historical sources; instead, they used these sources to “back up” the historical facts related to a topic. Low performing students constructed a general historical narrative on a topic, rather than an analysis, by quoting or paraphrasing from secondary sources (see table 12).
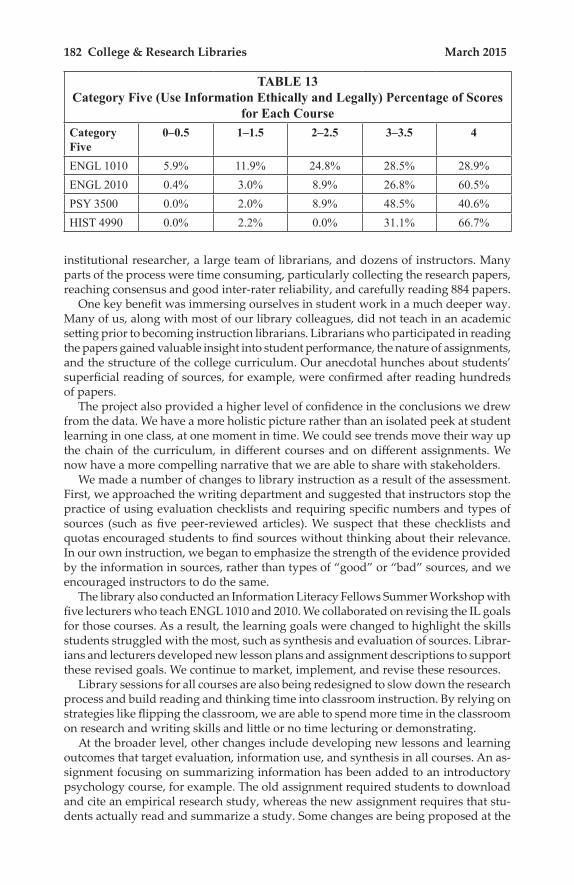
Category 5: Access and Use Information Ethically and Legally This category was the easiest to score because it was more easily measured numerically. Papers that attributed most or all of the information used received a 3 or 4, respectively; papers that attributed half of their sources received a 2; and papers that attributed none or few of their sources received a 0 or 1, respectively. In general, scores for this category were fairly similar for all levels of students. Most papers had a few ambiguous attributions, but students in all courses scored highest in this category, with a mode of 4 for all courses with the exception of psychology (mode = 3, with 40.6% scoring a 4). (See table 13.)
DiscussionThe process of conducting a comprehensive assessment was difficult but worthwhile. It required the collaboration and participation of many people, including the university’s
TABLE 12Category Four (Use Information Effectively): Percentage of Scores in Each
CourseCategory Four
0–0.5 1–1.5 2–2.5 3–3.5 4
ENGL 1010 7.4% 79.3% 13.0% 0.4% 0.0%ENGL 2010 3.2% 39.1% 47.1% 10.5% 0.4%PSY 3500 0.0% 7.0% 76.0% 16.0% 1.0%HIST 4990 0.0% 33.3% 46.7% 17.8% 2.2%
182 College & Research Libraries March 2015
institutional researcher, a large team of librarians, and dozens of instructors. Many parts of the process were time consuming, particularly collecting the research papers, reaching consensus and good inter-rater reliability, and carefully reading 884 papers.
One key benefit was immersing ourselves in student work in a much deeper way. Many of us, along with most of our library colleagues, did not teach in an academic setting prior to becoming instruction librarians. Librarians who participated in reading the papers gained valuable insight into student performance, the nature of assignments, and the structure of the college curriculum. Our anecdotal hunches about students’ superficial reading of sources, for example, were confirmed after reading hundreds of papers.
The project also provided a higher level of confidence in the conclusions we drew from the data. We have a more holistic picture rather than an isolated peek at student learning in one class, at one moment in time. We could see trends move their way up the chain of the curriculum, in different courses and on different assignments. We now have a more compelling narrative that we are able to share with stakeholders.
We made a number of changes to library instruction as a result of the assessment. First, we approached the writing department and suggested that instructors stop the practice of using evaluation checklists and requiring specific numbers and types of sources (such as five peer-reviewed articles). We suspect that these checklists and quotas encouraged students to find sources without thinking about their relevance. In our own instruction, we began to emphasize the strength of the evidence provided by the information in sources, rather than types of “good” or “bad” sources, and we encouraged instructors to do the same.
The library also conducted an Information Literacy Fellows Summer Workshop with five lecturers who teach ENGL 1010 and 2010. We collaborated on revising the IL goals for those courses. As a result, the learning goals were changed to highlight the skills students struggled with the most, such as synthesis and evaluation of sources. Librar-ians and lecturers developed new lesson plans and assignment descriptions to support these revised goals. We continue to market, implement, and revise these resources.
Library sessions for all courses are also being redesigned to slow down the research process and build reading and thinking time into classroom instruction. By relying on strategies like flipping the classroom, we are able to spend more time in the classroom on research and writing skills and little or no time lecturing or demonstrating.
At the broader level, other changes include developing new lessons and learning outcomes that target evaluation, information use, and synthesis in all courses. An as-signment focusing on summarizing information has been added to an introductory psychology course, for example. The old assignment required students to download and cite an empirical research study, whereas the new assignment requires that stu-dents actually read and summarize a study. Some changes are being proposed at the
TABLE 13Category Five (Use Information Ethically and Legally) Percentage of Scores
for Each CourseCategory Five
0–0.5 1–1.5 2–2.5 3–3.5 4
ENGL 1010 5.9% 11.9% 24.8% 28.5% 28.9%ENGL 2010 0.4% 3.0% 8.9% 26.8% 60.5%PSY 3500 0.0% 2.0% 8.9% 48.5% 40.6%HIST 4990 0.0% 2.2% 0.0% 31.1% 66.7%

An Information Literacy Snapshot 183
curricular level. The history department is currently discussing a new curriculum so that students engage in some basic research processes before they reach the research methods and capstone courses. Our assessment was one piece of evidence that prompted this discussion.
In the future, we plan to use this assessment process for smaller-scale application within new subject areas. This will help us as we design targeted learning outcomes within disciplines that ensure students are receiving effective IL instruction that ad-dresses their actual learning needs across the curriculum.
ConclusionLibraries must continue to explore authentic ways to assess student learning and ensure that we are supporting our institutions’ student learning goals. Our experience shows that the Information Literacy VALUE rubric is a useful tool for articulating how students measure up to IL learning goals. Furthermore, it can help librarians and faculty target specific areas to refocus IL instruction across the curriculum. Many faculty assume that IL skills can be taught in a single session in a basic composition course. Focused on their discipline, they do not always have access to a wider view of how students attain general writing, IL, and critical thinking skills across the curriculum—or even within their own major. While the process is time consuming, it gives librarians a stronger sense of how information literacy manifests in student works and provides strong evidence for improving IL instruction and developing IL across the curriculum. The librarians who participated in this study now have expertise in scoring and using rubrics, which we can use in smaller samples in specific subject areas to continue to gauge our students’ abilities. While we don’t currently have plans to conduct this as-sessment again, we are working on other assessments that help answer other questions that arose as a result of this study. For example, our study does not take into account how many sessions of IL instruction a student received. One question we hope to an-swer in the next assessment is how the sequence and number of instruction sessions a student receives throughout a program contributes to overall success, such as grade point average and retention. This may help us provide a stronger connection between library instruction and IL proficiency.
Overall, “snapshot” approaches to assessment, like the one in this study, help to generate extensive discussions with faculty that take the entire curriculum, rather than a single library session or course, into account. When visualizing the common peaks and valleys in student achievement, faculty more clearly comprehend the shared responsibility that we all have to better address the essential learning outcomes of information literacy on our campuses.

Appendix A: Revised RubricCategory Capstone 4 Milestone 3 Milestone 2 Benchmark 1.5 Benchmark 1 Benchmark 1/2 0Defines the extent of information needed
Effectively defines the scope of the research question or thesis. Effectively determines key concepts. Types of information (sources) selected directly relate to concepts or answer research questions.
Defines the scope of the research question or thesis completely. Can determine most relevant key concepts. Types of information (sources) selected relate to concepts or answer research questions, but maybe not directly.
Defines the scope of the research question or thesis incompletely (parts are missing, somewhat too broad or too narrow, etc.). Can determine some key concepts. Types of information (sources) selected partially relate to concepts or answer research questions.
Has difficulty defining the scope of the research question or thesis. More focused or narrower than score for 1, but has difficulty determining key concepts. Types of information (sources) do not relate to concepts or answer questions.
Has difficulty defining the scope of the research question or thesis (especially too broad). Has difficulty determining key concepts. Types of information (sources) do not relate to concepts or answer questions.
Access the needed information.
Accesses information using effective, well-designed search strategies and most appropriate information sources.
Accesses information using variety of search strategies and some relevant information sources. Demonstrates ability to refine search through mainly relevant sources and variety of sources, when appropriate.
Accesses information using simple search strategies, retrieves information from limited sources but most are relevant and include variety, such as books or a good background source.
Accesses information using simple search strategies, retrieves information from limited and similar sources. Example: uses only first hits from Academic Search Premier so some results not relevant.
Accesses information randomly, retrieves information that lacks relevance and quality. A lot of web sources or other superficial sources.
Accesses poor quality information in terms of depth, relevance, and accuracy.
Evaluate Information and its Sources Critically Thoroughly (systematically and methodically)
Thoroughly (systematically and methodically) analyzes own and others' assumptions and carefully evaluates the relevance of contexts when presenting a position. (e.g. understands epistemological assumptions of disciplines, controversies in a discipline, and types of evidence valued by a discipline and explain own interpretation of evidence based on these understandings.)
Identifies own and others' assumptions and several relevant contexts when presenting a position. Not able to thoroughly articulate value of evidence or ways of knowing in a discipline.
Questions some assumptions. Identifies several relevant contexts when presenting a position. May be more aware of others' assumptions than one's own (or vice versa). Does not yet understand value of different kinds of evidence or ways of knowing by discipline. (e.g. able to acknowledge some sense of context or assumptions based on personal, political, or historical situation, but does not fully explore or evaluate information based on sense of context).
Identifies several relevant contexts when presenting a position. Does not yet understand value of different kinds of evidence or ways of knowing by discipline. (e.g. able to acknowledge some sense of context or assumptions based on personal, political, or historical situation, but does not address or evaluate information based on sense of context).
Shows an emerging awareness of present assumptions (sometimes labels assertions as assumptions). Begins to identify some contexts when presenting a position.
Simplistic, black and white thinking. (e.g. us versus them). Does not identify contexts when presenting a position or piece of evidence.
Presents no hint of context or assumptions at all. (e.g. this is just the way it is)

Appendix A: Revised RubricCategory Capstone 4 Milestone 3 Milestone 2 Benchmark 1.5 Benchmark 1 Benchmark 1/2 0Use Information Effectively to Accomplish a Specific Purpose
Communicates, organizes and synthesizes information from sources to fully achieve a specific purpose, with clarity and depth.
Communicates, organizes and synthesizes information from sources. Intended purpose is achieved, but not with complete clarity or depth.
Communicates and organizes information from sources. The information is not yet synthesized, so the intended purpose is not fully achieved.
Communicates information from sources but tends to rely heavily on one source, so information not synthesized and integrated. Tends to overuse quotation, summary, paraphrase, etc.
Communicates information from sources. The information is fragmented and/or used inappropriately (misquoted, taken out of context, or incorrectly paraphrased; includes irrelevant information just to include a source; writes with "claim then quote" style, etc.), so the intended purpose is not achieved.
Includes sources in bibliography but writing does not come from sources.
Writing from assumptions about common knowledge or own experience. Does not use sources at all.
Access and Use Information Ethically and Legally
Students use correctly all of the following information use strategies (use of citations and references; using information in ways that are true to original context; distinguishing between common knowledge and ideas requiring attribution) and demonstrate a full understanding of the ethical and legal restrictions on the use of published, confidential, and/or proprietary information. All ideas, concepts and quotations by others are clearly attributed with a note or in-text citation and a complete citation in a list of works cited, if applicable.
Students use correctly all of the following information use strategies (use of citations and references; using information in ways that are true to original context; distinguishing between common knowledge and ideas requiring attribution) and demonstrate a full understanding of the ethical and legal restrictions on the use of published, confidential, and/or proprietary information. Nearly all ideas, concepts and quotations by others are clearly attributed with a note or in-text citation and a complete citation in a list of works cited, if applicable. There might be one or two ambiguous citations (e.g. an in-text citation that should have been at the end of a paragraph instead of the beginning or a missing citation in the list of works cited.)
Students use correctly all of the following information use strategies (use of citations and references; using information in ways that are true to original context; distinguishing between common knowledge and ideas requiring attribution) and demonstrate a full understanding of the ethical and legal restrictions on the use of published, confidential, and/or proprietary information. Some of ideas, concepts and quotations by others are clearly attributed with a note or in-text citation and a complete citation in a list of works cited, if applicable. But there are a significant number of ambiguous or missing citations (1/3 to 1/2).
Most of ideas, concepts and quotations by others are NOT clearly attributed with a note or in-text citation and a complete citation in a list of works cited, if applicable. (e.g. quotes individual people but no citation to attribute source). Might be missing list of works cited but include in-text citations.
No attribution of sources.

186 College & Research Libraries March 2015
Notes
1. Beckie Supiano, “Employers Want Broadly Educated New Hires, Survey Finds,” The Chronicle of Higher Education (April 10, 2013), available online at http://chronicle.com/article/Employers-Want-Broadly/138453/ [accessed 28 June 2013]; Richard Arum, Academically Adrift: Limited Learning on College Campuses (Chicago: University of Chicago Press, 2011).
2. Amy Laitinen, Cracking the Credit Hour (New America Foundation), available online at http://newamerica.net/publications/policy/cracking_the_credit_hour [accessed 10 September 2013].
3. Megan Oakleaf, Value of Academic Libraries Report (ACRL), available online at www.acrl.ala.org/value/?page_id=21 [accessed 10 September 2013].
4. “Project Information Literacy: A Large-Scale Study about Early Adults and Their Research Habits,” available online at http://projectinfolit.org/ [accessed 28 June 2013]; “The Citation Project,” available online at http://site.citationproject.net/ [accessed 28 June 28, 2013].
5. “AAC&U Information Literacy VALUE Rubric,” available online at www.aacu.org/value/rubrics/InformationLiteracy.cfm [accessed 18 January 2013].
6. Davida Scharf et al., “Direct Assessment of Information Literacy Using Writing Portfolios,” Journal of Academic Librarianship 33, no. 4 (July 2007): 462–77, doi:10.1016/j.acalib.2007.03.005.
7. Katherine Schilling and Rachel Applegate, “Best Methods for Evaluating Educational Im-pact: A Comparison of the Efficacy of Commonly Used Measures of Library Instruction,” Journal of the Medical Library Association 100, no. 4 (Oct. 2012): 258–69.
8. Scharf et al., “Direct Assessment of Information Literacy Using Writing Portfolios,” 2. 9. Megan Oakleaf, “Are They Learning? Are We? Learning Outcomes and the Academic
Library,” Library Quarterly 81, no. 1 (Jan. 2011): 61–82. 10. Judith T.M. Gulikers, Theo J. Bastiaens, and Paul A. Kirschner, “A Five-Dimensional
Framework for Authentic Assessment,” Educational Technology Research and Development 52, no. 3 (Sept. 1, 2004): 73, doi:10.1007/BF02504676.
11. Jon Mueller, “The Authentic Assessment Toolbox: Enhancing Student Learning through Online Faculty Development,” Journal of Online Learning and Teaching 1, no. 1: 2 (n.d.).
12. Brandy Whitlock and Julie Nanavati, “A Systematic Approach to Performative and Au-thentic Assessment,” Reference Services Review 41, no. 1 (Feb. 15, 2013): 35.
13. Ibid.14. Barbara J. D’Angelo, “More Than Mere Collections: Portfolios as Direct and Authentic
Assessment of Information Literacy Outcomes,” IFLA Conference Proceedings (Nov. 2008): 1–12; Scharf et al., “Direct Assessment of Information Literacy Using Writing Portfolios”; Karen R. Diller and Sue F. Phelps, “Learning Outcomes, Portfolios, and Rubrics, Oh My! Authentic Assessment of an Information Literacy Program,” portal: Libraries & the Academy 8, no. 1 (Jan. 2008): 75–89; Elizabeth Choinski, Amy E. Mark, and Missy Murphey, “Assessment with Rubrics: An Efficient and Objective Means of Assessing Student Outcomes in an Information Resources Class,” portal: Libraries and the Academy 3, no. 4 (2003): 563–75, doi:10.1353/pla.2003.0078; Lorrie A. Knight, “Using Rubrics to Assess Information Literacy,” Reference Services Review 34, no. 1 (Jan. 1, 2006): 43–55, doi:10.1108/00907320610640752; Mark Emmons and Wanda Martin, “Engaging Conversation: Evaluating the Contribution of Library Instruction to the Quality of Student Research,” College & Research Libraries 63, no. 6 (Nov. 1, 2002): 545–60.\\uc0\\u8221{} \\i IFLA Conference Proceed-ings\\i0{} (November 2008
15. Diller and Phelps, “Learning Outcomes, Portfolios, and Rubrics, Oh My!” 84.16. Mark Emmons and Wanda Martin, “Engaging Conversation: Evaluating the Contribution
of Library Instruction to the Quality of Student Research,” College & Research Libraries 63, no. 6 (Nov. 1, 2002): 559.
17. Elizabeth Choinski, Amy E. Mark, and Missy Murphey, “Assessment with Rubrics: An Ef-ficient and Objective Means of Assessing Student Outcomes in an Information Resources Class,” portal: Libraries and the Academy 3, no. 4 (2003): 573.two librarians independent of the librarian-instructor\nscored student reflection papers using a 5-point scale. Rubric items\nwere considered successful if 75 percent of the students received an\naverage score of three or higher. The results showed that weak areas\nof comprehension are those that require higher level thinking, such as\nthe ability to distinguish between the popular and academic press. The\nlibrarian-instructor will place more emphasis on these topics in future\nclasses and reword rubric items of questionable design.”,”DOI”:”10.1353/pla.2003.0078”,”ISSN”:”1530-7131”,”note”:”<p>Volume 3, Number 4, October 2003</p>”,”shortTitle”:”Assessment with Rubrics”,”author”:[{“family”:”Choinski”,”given”:”Elizabeth”},{“family”:”Mark”,”given”:”Amy E.”},{“family”:”Murphey”,”given”:”Missy”}],”issued”:{“date-parts”:[[“2003”]]},”accessed”:{“date-parts”:[[“2013”,7,25]]}}}],”schema”:”https://github.com/citation-style-language/schema/raw/master/csl-citation.json”}
An Information Literacy Snapshot 187
18. Lorrie A. Knight, “Using Rubrics to Assess Information Literacy,” Reference Services Review 34, no. 1 (Feb. 2006): 52.
19. Megan Oakleaf, “Using Rubrics to Assess Information Literacy: An Examination of Methodology and Interrater Reliability,” Journal of the American Society for Information Science & Technology 60, no. 5 (May 2009): 969–83.
20. “AAC&U Information Literacy VALUE Rubric.”21. Terrel L. Rhodes, “Show Me the Learning: Value, Accreditation, and the Quality of the
Degree,” Planning for Higher Education 40, no. 3 (Apr. 2012): 39.”ISSN”:”07360983”,”shortTitle”:”Show Me the Learning”,”journalAbbreviation”:”Planning for Higher Education”,”author”:[{“family”:”Rhodes”,”given”:”Terrel L.1”}],”issued”:{“date-parts”:[[“2012”,4]]},”accessed”:{“date-parts”:[[“2014”,2,10]]}}}],”schema”:”https://github.com/citation-style-language/schema/raw/master/csl-citation.json”}
22. Terrel L. Rhodes and Ashley Finley, Using the VALUE Rubrics for Improvement of Learning and Authentic Assessment (Washington, D.C.: Association of American Colleges and Universities, 2013): 17.
23. Oakleaf, “Using Rubrics to Assess Information Literacy”; Rhodes and Finley, Using the VALUE Rubrics for Improvement of Learning and Authentic Assessment.
24. Diller and Phelps, “Learning Outcomes, Portfolios, and Rubrics, Oh My!”; Scharf et al., “Direct Assessment of Information Literacy Using Writing Portfolios.”
25. The History Department conducted an assessment of HIST 4990 papers during the 2009--2010 academic year, and we obtained copies of all of these papers. We also collected papers in the two sections of the course offered in spring 2011.
26. Andrew F. Hayes and Klaus Krippendorff, “Answering the Call for a Standard Reli-ability Measure for Coding Data,” Communication Methods and Measures 1, no. 1 (2007): 77–89, doi:10.1080/19312450709336664.
27. “ReCal for Ordinal, Interval, and Ratio Data (OIR),” available online at http://dfreelon.org/utils/recalfront/recal-oir/ [accessed 12 June 2013].
28. “The Citation Project.”