An inductive gap measurement method for An inductive gap...
79
PhD Thesis Production Technology 2019 No. 30 An inductive gap measurement method for square butt joints Edvard Svenman
Transcript of An inductive gap measurement method for An inductive gap...

An inductive gap measurement method for square butt jointsWith increased demand for automation of production, there is a need for sensors to con-trol the laser welding process. A narrow gap between the pieces to be welded is difficult to detect with available methods, with the risk of welding in the wrong position. This thesis proposes an inductive sensor with coils on both sides of the gap that can detect even gaps that are not visible. Using the complex response of each coil separately to measure the distance and height on both sides of the gap allows measurement of posi-tion, as well as gap width and alignment in a working range around the gap. The behavior of the method, including tolerance to non-ideal conditions, has been investigated.
Edvard Svenman graduated as MSc in Engineering Physics from Umeå Universitet. After spending the last 8 years in the Aerospace industry, he started his PhD education in 2014. His research interest is in measurement and production technology.
PhD ThesisProduction Technology2019 No. 30
An inductive gap measurement method for square butt joints
Edvard Svenman
AN IN
DUCTIVE G
AP MEASU
REMEN
T METH
OD FO
R SQUARE BU
TT JOIN
TSEDVARD SVENM
AN2019 NO.30ISBN 978-91-88847-33-1 (Printed version)
ISBN 978-91-88847-32-4 (Electronic version)
117773_HV_Edvard_Svenman_omslag.indd 1 2019-04-17 09:16:23


Tryck: BrandFactory, april 2019.

PhD ThesisProduction Technology2019 No. 30
An inductive gap measurement method for square butt joints
Edvard Svenman

University West SE-46186 Trollhättan Sweden +46 52022 30 00 www.hv.se © Edvard Svenman 2019 ISBN 978-91-88847-33-1 (printed) 978-91-88847-32-4 (electronic)

iii
Acknowledgements
After years of collaboration, I am grateful to all of my friends and colleagues. To Anna-Karin Christiansson, my main supervisor, for encouragement, endless support, for reading and re-reading and improving my work. To Anna Runnemalm, my second supervisor, for asking questions, for answering and pointing the right way. I am grateful to Per Henrikson, my supervisor at GKN Aerospace, for the opportunity, and for his suggestions, ideas and support whenever I needed. To Eva Bränneby and Victoria Sjöstedt, for good company and conversations. Everyone at the Department of Engineering sciences, and at GKN Aerospace, for helping without hesitation. And finally, to everyone who would discuss, argue, and disagree with me during lunches and breaks, to make me think twice.
Edvard Svenman
23rd of April 2019


v
Populärvetenskaplig Sammanfattning
Nyckelord: Spalt; Mätning; Induktiv; Svetsning
Lasersvetsning ger möjlighet till smala fogar med liten värmetillförsel, men kräver hög precision. För att kunna automatisera svetsningen behöver fogspalten mätas. Induktiv mätning har attraktiva egenskaper; en beröringsfri metod som använder elektriska spolar för att inducera högfrekventa strömmar i själva materialet. När dessa strömmar bryts av spalten som ska svetsas påverkas magnetfält och ström i spolarna så att rörelser som ändrar avståndet till spalten, och rörelser som ändrar höjden till plåten, ger olika utslag som kan särskiljas i spolens impedans. Den metod som föreslås i avhandlingen använder en spole på vardera sidan av spalten och kan därför uppskatta både spaltens läge och bredd, förutom höjd över plåten och höjdskillnad mellan plåtarna. Det är en skillnad mot tidigare induktiva metoder som kopplade ihop spolarna eller inte tog hänsyn till impedansens komponenter. Metoden ger ett mätområde på omkring en millimeter runt spalten, vilket är användbart vid robotiserad svetsning.
Metodens egenskaper har studerats genom experiment med individuella spolar, med spolar kombinerade till en prob, och genom numeriska simuleringar för att hitta lämpliga utformningar. Inflytandet av olika störningar som kan förväntas vid industriell användning har undersökts experimentellt. Resultaten ger vägledning till valet av utformning och frekvens, och vilken noggrannhet som kan förväntas.
Metoden har visat förmåga att mäta både läge och spaltbredd med tillräcklig prestanda för lasersvetsning, men om både spaltbredd och höjdskillnad förekommer samtidigt reduceras framförallt noggrannheten i mätning av spaltbredd. Jämfört med befintliga optiska metoder har metoden förmåga att mäta även mycket smala gap.

vi
Abstract
Title: An inductive gap measurement method for square butt joints
Keywords: Eddy current; Seam tracking; Measurement; Laser beam welding; gap geometry
ISBN, Printed: 978-91-88847-33-1, Electronic: 978-91-88847-32-4
A recent method in aero engine production is to fabricate components from smaller pieces, rather than machining them from large castings. This has made laser beam welding popular, offering high precision with low heat input and distortion, but also high productivity. At the same time, the demand for automation of production has increased, to ensure high quality and consistent results. In turn, the need for sensors to monitor and control the laser welding process is increasing. In laser beam welding without filler material, the gap between the parts to be joined must be narrow. Optical sensors are often used to measure the gap, but with precise machining, it may become so narrow that it is difficult to detect, with the risk of welding in the wrong position. This thesis proposes the use of an inductive sensor with coils on either side of the gap. Inducing currents into the metal, such a sensor can detect even gaps that are not visible. The new feature of the proposal is based on using the complex response of each coil separately to measure the distance and height on both sides of the gap, rather than an imbalance from the absolute voltage of each coil related to gap position. This extra information allows measurement of gap width and alignment as well as position in a working range of about 1 mm around the gap, and decreases the influence from variation in gap alignment to the position measurement. The sensor needs to be calibrated with a certain gap width and height alignment. In real use, these will vary, causing the sensor to be less accurate. Using initial estimates of the gap parameters from the basic sensor, a model of the response can be used to estimate the measurement error of each coil, which in turn can be used for compensation to improve the measurement of the gap properties.
The properties of the new method have been examined experimentally, using a precise traverse mechanism to record single coil responses in a working range around a variable dimension gap, and then using these responses to simulate a two coil probe. In most cases errors in the measurement of weld gap position and dimensions are within 0.1 mm. Different coil orientations were studied using numerical simulation, and validated in experiments using a two coil probe. The influence of scratches, chamfers and variation in plate thickness was investigated at different frequencies.

vii
Appended Publications
Paper A. A complex response inductive method for improved gap measurement in laser welding
Published in “International journal of advanced manufacturing”, January 2017 – Authors: E. Svenman, A. Runnemalm
Paper B. Evaluation of non-contact methods for joint tracking in a laser beam welding application
Presented at the Swedish Production Symposium, SPS, in Lund, Sweden, October 2016 – Authors: F. Sikström, A. Runnemalm, P. Broberg, M. Nilsen, E. Svenman
Paper C. Model based compensation of systematic errors in an inductive gap measurement method
Published in “Measurement”, July 2017 – Authors: E. Svenman, A. Runnemalm
Paper D. Modeling of inductive coil geometry for gap position measurement
Presented at the 8th Swedish Production Symposium SPS, in Stockholm, Sweden, May 2018 – Authors: E. Svenman
Published in “Procedia Manufacturing”, 2018
Paper E. Experimental validation of an inductive probe for narrow gap measurement based on numerical modelling
Submitted for publication in an international journal – Authors: E. Svenman, A.-K.. Christiansson, A. Runnemalm
Paper F. Investigation of effects from realistic influences on inductive gap measurement
Submitted for publication in an international journal – Authors: E. Svenman, A.-K.. Christiansson


Table of Contents
Acknowledgements ......................................................................... iii Populärvetenskaplig Sammanfattning .............................................. v
Abstract .......................................................................................... vi Appended Publications .................................................................. vii Table of Contents ........................................................................... ix
1 Introduction .................................................................... 1
1.1 Laser welding ....................................................................... 1
1.2 Automated welding .............................................................. 2
1.3 Gap measurement in laser welding ...................................... 3
1.4 On-line tracking .................................................................... 4
1.5 Objectives and research question ........................................ 5
1.6 Limitations ............................................................................ 6
2 Existing gap measurement methods ............................ 7
3 Proposed inductive method ........................................ 13
3.1 Brief theory of inductive methods ....................................... 13
3.2 Dual coil complex inductive method ................................... 16
3.3 Method of investigation ...................................................... 20
3.4 Instruments for impedance measurements ........................ 20
3.5 Experimental setup ............................................................ 21
3.6 Single and dual coil responses ........................................... 23
3.7 Comparison to three other methods ................................... 26
3.8 Systematic errors ............................................................... 27
3.9 Model based compensation ............................................... 29
3.10 Compensated results ......................................................... 32
3.11 Selection of coil orientation and length using numeric method .......................................................................................... 33
3.12 Uncertainty of measurement .............................................. 38
3.13 Non-ideal conditions .......................................................... 40

x
4 Usefulness and future improvements ........................ 45
5 Conclusions and contributions ................................... 49
6 References .................................................................... 51
7 Summaries of appended papers ................................. 57
Appended Publications
Paper A. A complex response inductive method for improved gap measurement in laser welding
Paper B. Evaluation of non-contact methods for joint tracking in a laser beam welding application
Paper C. Model based compensation of systematic errors in an inductive gap measurement method
Paper D. Modeling of inductive coil geometry for gap position measurement Paper E. Experimental validation of an inductive probe for narrow gap measurement based on numerical modelling
Paper F. Investigation of effects from realistic influences on inductive gap measurement

1 Introduction
Automated production is a process that repeats to give the same result each time. Either by ensuring the same conditions and the same process each time, or by carefully adapting the process to the conditions. With development stretching the limits of performance and economy, trade-offs are needed between conditions, process and result. With laser beam welding, tolerances between the pieces to be welded need to be small and well controlled, and the narrow laser beam must be in the right place to weld. When joining machined surfaces, the weld gap is sometimes clearly visible, but can become so small and well aligned that it cannot be identified with conventional optical sensors. The topic of this thesis is a sensor that can measure these gaps. If the gap is very narrow and well aligned, the position must still be measured. If it is not, the weld process may need to be adapted or aborted.
1.1 Laser welding In laser keyhole welding, the laser beam is focused so that the radiation intensity is high enough to melt, and partly vaporize, the material. The pressure of the vapour displaces the molten metal, forming a deep and narrow hole into the material [1]. Welding in the keyhole mode delivers energy deep into the material, where it is needed to melt metal and form a joint, without excessive spreading that would affect the properties of the material or cause deformation. This also allows high welding speed and productivity. Because of its low heat input and small heat affected zone, laser keyhole welding is well suited to production with high demands on precision and material properties [2].
On the other hand, laser keyhole welding is also a demanding application, where it can be difficult to find good welding parameters. Small disturbances can cause defects that lower productivity, ruin the product, or worse go unnoticed to cause an in service failure or an accident. Some defects that can affect static strength, fatigue life, or cosmetic appearance of a weld are illustrated in Figure 1. The effect of a particular weld flaw will depend on the circumstances of the application, but in general any defect that reduces the solid cross section of a weld may affect static strength, while small cracks or stress concentration from unfavourable weld geometry may decrease fatigue life. Spatter can affect corrosion properties [3, 4], and weld appearance may sometimes render a product commercially unacceptable. Welding to the side of the gap can cause lack of penetration [5]. Lack of fusion defects, also caused by welding to the side of the gap, can be

2
especially difficult to find when the weld bead is wider on the top and root side than it is inside the metal. In these cases, there may be a weaker part of the weld that cannot be found by visual inspection, and is so narrow that it is also difficult to detect in x-ray inspection.
a
c
d
b
e
Figure 1 Examples of welding defects and errors. Weld torch misalignment (a), lack of
fusion error from torch misalignment (b), lack of penetration (c), pores, spatter and centreline crack (d), under fill and root drop (e).
1.2 Automated welding Modern production increasingly demands predictable and consistent quality, and at the same time increasing productivity. Production management development from scientific management and forward has used inspection and control of processes to find quality problems, to improve the process [6], and to prevent problems [7]. These demands are carried forward to the automation of the welding process. Some processes are very predictable, and can be automated by repeating a predefined procedure, while others need some feedback from sensors that measure the performance and can detect events that influence the result [8-10]. High precision and robustness in processes like laser welding call for accurate and reliable sensors and control [10-12].
When a component has been laser welded, an inspection for defects determines if it can be approved. Figure 2 illustrates the consequences to production of three different concepts for finding defects at different stages. If defects are found in the final inspection, the component must be repaired, losing time and money. If defects can be found in the welding cell instead of the final inspection, so that it can be repaired early, unnecessary inspection can be avoided. Better still, if the process can be controlled well enough so that no defects are produced, both unnecessary inspection and repair can be avoided. These tasks of control of pre-

INTRODUCTION
3
existing conditions, of inspection, and of monitoring, require different sensors and measurement methods.
a
b
c
Figure 2 Three different inspection strategies, with different impact on productivity. Finding defects in final inspection (a), in fixture (b) or avoiding to produce them (c).
1.3 Gap measurement in laser welding Seam finding means to find the position of the weld gap before the welding process begins. This allows the nominal weld path to be adjusted to take account of any differences in dimensions, or fixturing, of a component compared to the nominal dimensions. Seam tracking means that a robot or manipulator has the ability to detect and follow the weld gap automatically during welding, rather than following a pre-programmed path were the gap is expected to be. This makes production more flexible and further reduces the risk of producing defects, because the process can adapt also to problems like variation from heat induced distortion, and still produce good welds.
From the welding point of view, accurate knowledge of the position of the gap is arguably the most important, because lack of fusion can be so difficult to find in inspection and is a serious defect. An often used rule of thumb for the error in position that can be tolerated is smaller than half the width of the laser beam, and smaller than half the width of the fusion zone [13, 14]. The width of the fusion zone, that is the melted zone, depends on both laser power, weld speed and material [15]. Gap width is also important, because in autogenous welding (without filler material) wide gaps cannot be tolerated, though sometimes changing weld parameters or addition of filler material may help. For autogenous

4
welding, the melted material must be enough to fill the gap volume with an acceptable geometry after the cooling and contraction of the work pieces [13, 16]. The gap width must also be small enough so that the laser beam is absorbed, half the width of the laser beam is stated by Steen and Mazumder [16], but Dawes [15] points out that there is also an influence from the thickness of the work pieces and the convergence of the laser beam. Poor alignment in height of the work pieces can cause problems with weld geometry that can be avoided with tuning of process parameters, but can also cause a reduced weld cross section and static strength of the finished piece. Measurement of height and alignment of the plates is useful for example to allow control of laser focus.
The exact requirements on gap measurement vary between applications, with work piece thickness, with beam parameters (spot size, focus distance and depth of focus) and other conditions. Recommendations for joint fit-up before welding can also give an indication of requirements. Different suggestions can be found, but for example Mazumder and Bass [14] recommend that the work pieces should be arranged so that the gap width is less than 15% of the thickness of the work piece, and alignment in height within 25%. While capable of measuring zero-width gaps then, it is also desired that the method is able to measure gaps that are wider, and less well aligned, to be more useful. No strict limit on accuracy can be decided, but results presented here are compared to a 0.1 mm guideline that is assumed to be useful for measurement of position and gap width as well as misalignment.
1.4 On-line tracking Robot control and seam tracking is of interest to robotic welding for several reasons, for example to achieve flexible and autonomous production [17]. Especially in laser welding, the requirement for high accuracy movement control at high speed has been recognized [18-21]. Seam measurement sensors provide the feedback necessary for accurate positioning. Knowledge of gap width and plate alignment may allow the welding parameters to be adapted [22]
Several factors can affect the ability to determine the position of the welding gap [18]. Variation in production of parts, or fixturing, could cause the weld gap to deviate from the nominal path. During welding, thermal distortion could change the path. Inconsistencies in the robot movements could cause differences in measurement that cannot be accounted for correctly. How well these problems are handled depends on how the seam tracking system is implemented.

INTRODUCTION
5
Depending on the level of robot control available, different setups are used. With only high level control, the robot is often required to follow a pre-programmed nominal path, while the laser weld head and the gap sensor are mounted on a separate tracking actuator on the end of the robot [18]. In this case changes in gap position are detected, but the tracking can be affected by unknown changes in robot speed along the path, or in lateral position. An innovative solution is the use of image correlation techniques to determine the actual position of the welding laser relative the work piece, rather than relying only on nominal path values and gap sensor readings [18].
With a low level robot interface, more information about, and control over, the robot movement is available. This allows the weld laser and sensor to be mounted directly to the robot without a separate actuator [19]. This also allows control strategies that position the sensor over the weld gap to follow path curvature.
Since measurement can be affected by environmental conditions, such as surface properties, reflections or scratches [18, 23, 24], measures to avoid costly mistakes and potentially dangerous situations are in order. For example, there could be a requirement not to weld too far from the nominal path, or if the nominal path is out of range of the tracking sensor [18].
In industrial practice, combinations of robot teaching and real time seam tracking may be more practical than fully autonomous methods [20].
1.5 Objectives and research question To improve the production and the resulting quality of laser welding in aerospace manufacturing, new and improved sensors and measurement methods for various phenomena are needed. The overall objective addressed in this thesis is to find measurement methods and sensors that can increase productivity and quality in laser beam welding.
Considerable research efforts have already been directed to both post-process, in process monitoring, and measurement of gap position. Still, with high precision machined components used in aero engine fabrication, seam tracking of narrow gaps for square butt welds is a relevant problem. From industrial experience, these gaps can be difficult to detect and, using optical sensors, there is a risk of confusion from scratches.
Welding in the right place is the first requisite of a good result. Knowing the gap dimensions can help decide if welding can be performed, or if the fixture or
6
welding parameters need to be adjusted. Better accuracy in measurement of gap position means less risk of lack of fusion defects and a more predictable result. Therefore, this thesis is concerned with better methods of sensing the position and properties of the gap to be welded, suitable for future automation of the welding process. The research question then is:
“How to detect and measure position and dimensions of even a very narrow and well aligned gap in laser beam square butt welding of non-ferromagnetic alloys in order to weld correctly and in the right place?”
1.6 Limitations The investigation is focused on the needs of fabrication of aero engines. The goal is to find a method to measure very narrow or zero width gaps in order to allow automation of high precision laser keyhole welding. To be practically useful, the method needs to work not only for very narrow gaps, but also for wider gaps, and for gaps that are less well aligned. The study is limited to inductive sensing methods.
The following limitations are observed: The materials considered are non-ferromagnetic metals, such as Alloy 718, titanium or Hastelloy-X, and the joints are square butt joints, typically used in aerospace components. The integration and use of the sensor in a system, for example on a robot, will not be considered, except that the method should be suitable for such industrial use. Methods and data processing suitable for real-time use are preferred. Only 2D-applications, that is plane plates, are studied. The thickness of the plates will vary from 3 to 8 mm. Existing instruments will be used to develop the method.

2 Existing gap measurement methods
Many different methods of seam tracking have been developed that are suitable for conventional arc welding, where the demands on precise joint preparation are usually less strict than in laser welding, accounts are given by Nomura and others [25-27]. Tactile mechanical sensors follow the edge of a plate, or the grove between two plates, with a probe. They are simple and often used e.g. for fillet welds, or for V-grooves used in arc welding, but they are not useful for precision square butt welds where the gap is too small for the probe. In arc welding, the voltage between the electrode and the work piece surface is related to distance, offering a convenient method for seam tracking [25]. This is often used in a weaving patter to fill a grove or a fillet in a corner weld. With laser welding of course, this is not an option. Ultrasonic transmitters and receivers can be used to detect the reflection from a gap through air, and have been demonstrated for narrow V-groves [28], but with uncertainties that are not sufficient for precise laser welding.
One investigation reported in [29] describes a method using ultrasonic waves within the work piece, reflecting on the gap to allow a distance to be measured from each side. Using EMAT transducers, this is a non-contact method that detects position and gap width, also with potential zero-gap capability, but without measurement of height or plate alignment.
Optical methods have seen much attention from researchers [30]. These sensors use the visual appearance of the gap, and of the plates’ surfaces, to find the position of the weld gap. Triangulating laser stripe sensors [31, 32] are often used for less well aligned or wider gaps. They are well established and can measure position as well as gap width and alignment. The principle is based on projecting a line of laser light onto the work pieces. Usually, the line is projected from a direction normal to the surface, and the diffuse reflection from the surfaces is then registered by a 2D-camera. At the gap, the reflection of the line will be missing, indicating the position and the gap width. The height of each work piece can be calculated from position of the reflection on the camera sensor. With shiny surfaces, diffuse reflections can be difficult to detect, and direct reflections can disturb the measurement. Recent investigations [33] use computer vision methods with uniform illumination and image processing to detect gaps as narrow as 0.2 mm, in combination with crossed laser lines to estimate surface orientation. Using a shallow focus length and image processing, detection of narrow gaps as well as surface orientation has been described [34]. With differences in surface

8
properties or illumination on either side of the gap [35], even zero width gaps can be detected from grey scale images. Considering also imperfect surfaces, an image processing method with stereo reconstruction is tolerant to rust, mill scales and scratches [24]. Other vision methods use grey scale images with structured illumination [31, 36-38]. Vision methods combined with Kalman filtering may help distinguish the gap from scratches and surface defects [39]. From observation of the melt pool, the influence of the gap on the temperature distribution can be used to find the position with a camera sensitive to infra-red radiation [40]. Most often, vision based methods do not measure plate alignment and orientation without addition of triangulation methods.
In laser welding, there is a possibility to use cameras and optical sensors through the same optics that is used to focus the welding laser beam. This way, measurements can be added with no physical intrusion. For example [41] describes how a camera can be used to both measure the shape of the melt pool, and to find the position of the gap using vision methods based on grey scale image values. A method based on optical coherence tomography and a scanner has been described by Dupriez and Truckenbrodt [42]. The ability to measure the distance to the plate allows reflections that might confuse a triangulating line method, to be supressed.
A magneto-optic method, [43], has also been proposed. Here, a sensor reacts to the vertical component of the magnetic flux leakage from the gap, to create a contrast transition over the width of the gap. The position is then found using image processing. This investigation does not consider height or alignment of the plates.
Inductive seam tracking has not received the same interest from researchers. Some cases, like a fillet weld in the corner between two plates for example, can use inductive proximity sensors, but square butt joints are more complicated. There are patents though [44, 45], and some reports in literature about development. You and Kim present an inductive system [46] using one single coil to both generate an alternating field and sense the response. It measures the gap position by weaving across the gap and recording the AC-voltage magnitude. This investigation mentions the possibility to measure height, but does not discuss gap width or alignment. Kim and Shin report an inductive system [47] where one coil is used to generate the alternating field, while two more coils are used for sensing. The probe is placed across the weld gap so that each of the sensing coils reacts to the distance to the gap with a change in AC-voltage magnitude. The difference in voltage between the two coils is then zero if the probe is centred over the gap, and changes proportionally to the offset if the probe is moved to either side. The sensitivity is affected by the height of the probe above the plates but, the signal remains zero as long as the probe is centred. Plate dimensions and gap width are

EXISTING GAP MEASUREMENT METHODS
9
not reported, but increasing height is said to affect the result adversely because of reduced sensitivity, while a misalignment in height is said to have no effect for this set-up. Peng et al [48] used two gradient coils with windings of gradually increasing size across the gap. The study was intended to detect cracks, but is also of interest here. Forming the sum and the difference of the inductive response, the position and width of the crack was estimated from second order curve fits. Height or height difference was not investigated. In another investigation by Bae and Park [49], three sensing coils are used, one on each side of the gap, and one more centred on the gap, and one exciting coil. The difference in AC-voltage magnitude between the left and right sensing coil is used to centre the probe above the gap, and the relation of the voltage between the centre coil and one of the sensing coils is used to calculate also the height of the probe above the plates, and the width of the gap. A tendency to overestimate the gap width is reported. Misalignment in height is not considered. Yet another investigation by Henry [50] considers a tracking system intended for electron beam welding, where high precision is required. Here, again, a centre coil is used to induce the alternating magnetic field, while two sensing coils each react to the distance to the gap. In this case however the sensing coils are electrically connected, in opposing sense. A phase sensitive amplifier is then used to create a signal where the magnitude is proportional to the probe offset in relation to the gap, and the sign is related to the direction of the offset depending on the phase of the combined sensing coils in relation to the driving coil. This means that the sensing coil complex responses are added with respect to both resistive and inductive components. The signal is then rectified with respect to the reference signal, which is different from the previously described investigations. The sensitivity to misalignment in height between plates is investigated and found to be considerable in this application, but results are somewhat improved by increasing the height of the probe above the plate surfaces. Gap width, height or alignment is not measured.
In summary, previous methods, where the coils were connected [50], or where only the amplitude was used [47], did not have enough information to measure all parameters; only the balance was used to determine position. Using one extra coil, Bae [49] estimated also width and height. Further, there was no way of telling the difference between a change in alignment and position, which is a problem for high accuracy measurement. Henry reported that an increase in height above 2 mm reduced sensitivity to misalignment in position measurement, while Kim et al. [47], measuring at 3 mm height, did not find a sensitivity to misalignment. The investigations by Bae [49] and Henry [50] also used a separate feeding coil to generate the alternating field, rather than two separate coils, each generating its own magnetic field.
An overview of the different studies are given in Table 1.

10
Table 1 Overview of methods and sensors in literature.
Author Method Capability Comment Mahajan and Figueroa, 1997. [28]
Ultrasonic Through the air, V-groves
Stevens et al., 2000. [29]
Ultrasonic Patent. EMAT in material, potential zero-gap
Wu et al. 2009. [31]
Triangulating laser +vision
width>0.05-0.1 mm
Surface orientation. No treatment of surface defects. Planar surface, no misalignment.
Gu et al. 2013. [32]
Triangulating laser
V-grove
Zeng et al. 2016. [33]
Triangulating laser+Vision
Width>0.2 Orientation from laser line
Wang et al. 2016. [34]
Vision “narrow” Shallow focus length, surface orientation
Krämer et al. 2014. [35]
Vision Zero gap Depending on surface properties
Dinham and Fang, 2013. [24]
Vision Not stated Stereo reconstruction, tolerant to surface defects, arc-welding accuracy 1 mm
Kim et al. 2008. [36]
Vision Gap width 0.2-1.0 mm
Accuracy position<0.2 mm
Kim and Bae, 2005. [37]
Vision Gap width>0.07
Arc welding, Butt joint, accuracy <0.4
Shao et al. 2018. [38]
Triangulation +Vision
Gap width<0.1 mm
Accuracy, position and gap width, <0.005 mm, normal vector<3°, height<0.12mm. Alignment not discussed
Nilsen et al. 2018. [39]
Vision Technically zero gap
Co-axial vision. Considers scratches using Kalman filters. Accuracy <0.56
Gao et al. 2012. [40]
Vision Gap width not stated
Melt pool observation, accuracy position<0.12
Regaard et al. 2009. [41]
Vision Gap width not stated
Co-axial measurement close to melt pool.
Dupriez and Truckenbrodt [42]
Interferometric
Gap width 0.3-0.5 mm is claimed
Scanning optical coherence. Coaxial. Surface profile.
Gao and Chen, 2014. [43]
Inductive Gap width <0.05 mm
Vision methods on a magneto-optical 2D-sensor. Static magnetic

EXISTING GAP MEASUREMENT METHODS
11
field induced in ferromagnetic plates. Accuracy position<0.13 mm. Influence of misalignment not discussed.
Wofsey, 1969. [44]
Inductive Patent. Separate pairs of coils for position and height. Linear combination of magnitude of each coil to form servo signals to control position, height and wire feed rate.
Varacins, 1980. [45]
Inductive Patent. Separate pairs of coils for position and alignment, phase sensitive demodulation of combined signal to form servo control signal for position.
You and Kim, 2002. [46]
Inductive Gap width 0
Single coil, weaving across gap. Accuracy<0.2 mm, Alignment not considered.
Kim and Shin, 2003. [47]
Inductive Gap width not stated
Arc welding. One generating coil, two sensing coils using change in AC-voltage magnitude. Accuracy operated in servo control position 0.3 mm.
Peng et al. 2010 [48]
Inductive gap width>2 mm
Inductive response from two gradient coils. Accuracy position 2 mm (91% of working range for -30<position<30, 2<width<6)
Bae and Park, 2006. [49]
Inductive Gap width 1.5-4 mm
One generating coil, one sensing coil on each side of the gap, and one centre coil on the gap. Accuracy operated in servo control position<0.4 mm, height 0.4 mm, gap width 0.6 mm. Misalignment is not considered.
Henry, 1973. [50]
Inductive Gap width not stated
For electron beam welding. Phase sensitive detection, operated in servo control. Accuracy position 0.08 mm for well aligned plates, sensitivity to alignment 0.8 mm/mm.


3 Proposed inductive method
With the objective of measuring gaps that are not visible with current methods, there are two options. Either the current methods could be improved, or some other method must be found. Much research has been directed at improving optical methods that are arguably the most popular today. Here, instead the less common inductive method is revisited. Inductive sensors have an advantage in that they actually sense inside the material to be welded, rather than just on the surface. This means that they can be sensitive also to very narrow gaps. Indeed, sensors of this type are used to detect thin cracks in non-destructive testing. They should also be less sensitive to shallow surface defects, like scratches, that may confuse optical sensors.
3.1 Brief theory of inductive methods Inductive sensing works by applying a high frequency alternating magnetic field into a conductive material. According to Lenz’ law, currents will be induced in the material to generate an opposing field. This change in the field can be measured, conveniently by comparing the response in current and voltage on the same coil generating the field. Maxwell’s equations govern electric and magnetic field behaviour, and the relationships that govern inductive sensing can be found in for example textbooks and articles on eddy current testing [51, 52], or on electromagnetism [53].
For a conductor loop with constant area 𝑺𝑺 (note that in this section, the established symbol 𝑺𝑺 is used, but it should not be confused with the use of S for coil separation in other sections), such as in an inductive coil, the magnetic flux Φ𝐵𝐵 through the area can be expressed as
Φ𝐵𝐵 = � 𝑩𝑩 ∙ 𝑑𝑑𝑺𝑺𝑠𝑠
( 1 )
where 𝑩𝑩 is the magnetic flux density. By Faraday’s law, a change in magnetic flux Φ𝐵𝐵 will induce a voltage 𝑉𝑉 on the conductor loop.
𝑉𝑉 = −𝑑𝑑Φ𝐵𝐵
𝑑𝑑𝑑𝑑 ( 2 )
14
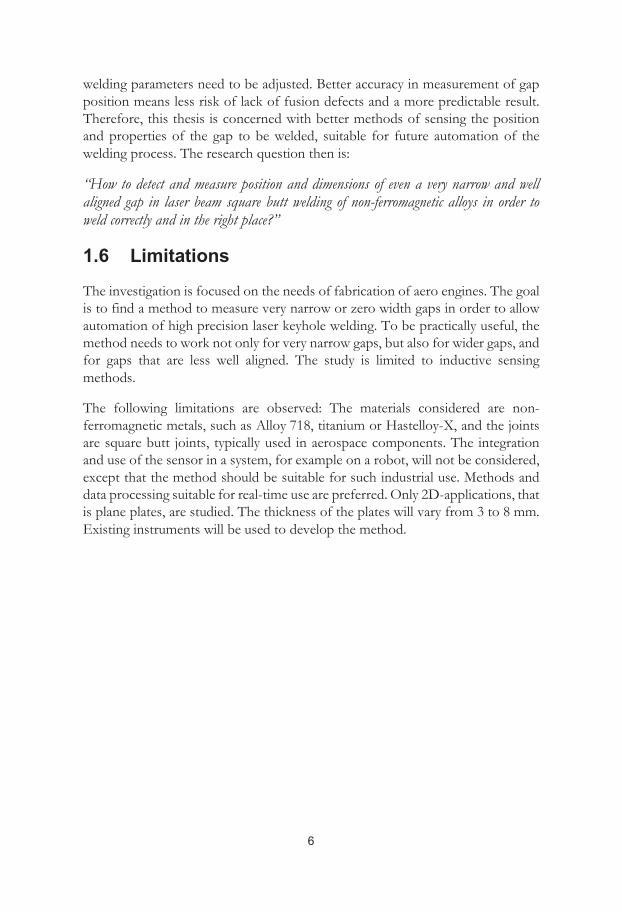
This can be compared, if the loop 𝑙𝑙 is constant, to the Maxwell-Faraday equation, in integral form
� 𝑬𝑬 ∙ 𝑑𝑑𝒍𝒍𝑙𝑙
= −�𝜕𝜕𝑩𝑩𝜕𝜕𝑑𝑑
∙ 𝑑𝑑𝑺𝑺𝑠𝑠
= −𝜕𝜕𝜕𝜕𝑑𝑑� 𝑩𝑩 ∙ 𝑑𝑑𝑺𝑺𝑠𝑠
= −𝑑𝑑Φ𝐵𝐵
𝑑𝑑𝑑𝑑 ( 3 )
where 𝑬𝑬 is the electric field. If a coil is driven by a current 𝐈𝐈, a field 𝑩𝑩 will be generated according to the Biot-Savart’s law. If the current changes, the field will also change, and a voltage will then be generated on the coil according to Faraday’s law. The voltage 𝑽𝑽 from self-inductance is described by
𝑽𝑽 = 𝐿𝐿𝑑𝑑𝐈𝐈𝑑𝑑𝑑𝑑
( 4 )
where the inductance, 𝐿𝐿, describes the linkage between the magnetic field and the current (note that in this section, the established symbol 𝐿𝐿 is used, but it should not be confused with the use of L for lift-off in other sections),
Φ = 𝐿𝐿𝑰𝑰 ( 5 ) With a sinusoidal current 𝑰𝑰, with frequency 𝑓𝑓 and amplitude 𝐼𝐼0:
𝑰𝑰 = 𝐼𝐼0𝑒𝑒𝑗𝑗2𝜋𝜋𝜋𝜋𝜋𝜋 𝒅𝒅𝐈𝐈𝒅𝒅𝒅𝒅
= 𝑗𝑗2𝜋𝜋𝑓𝑓𝐈𝐈 ( 6 )
and
𝑽𝑽 = 𝑗𝑗2𝜋𝜋𝑓𝑓𝐿𝐿𝐈𝐈 ( 7 ) This means that self-inductance for an ideal inductor causes the voltage to lead the current by 90 degrees. If a coil is placed close to a test piece of conducting material, currents will also be generated in the test piece when the field changes, and the resulting field will generate a voltage on the coil, by mutual inductance. The voltage on the coil resulting from the generated and the induced fields will have a resistive and an inductive component, depending on both the coil, the resistivity and permeability of the test piece, and the distance between the coil and the piece. This can be described as a transformer model, see Placko and Dufour [54] for details. The complex impedance 𝒁𝒁 of the coil and test piece can be calculated from the voltage and the current on the coil, and can be expressed as
𝒁𝒁 =𝑽𝑽𝑰𝑰
= 𝑅𝑅 + 𝑗𝑗𝑗𝑗 = 𝑅𝑅 + 𝑗𝑗2𝜋𝜋𝑓𝑓𝐿𝐿 ( 8 )
where 𝑅𝑅 is the resistance, 𝑗𝑗 the reactance. Capacitive influence is not considered here. This is the basis for eddy current inspection instruments.
Using a plane wave approximation and Maxwell’s equations, the currents 𝐽𝐽 induced in the test piece at depth 𝑥𝑥 can be estimated as described by Shull [52]

PROPOSED INDUCTIVE METHOD
15
where 𝑓𝑓 is the frequency, 𝜇𝜇 is the permeability and 𝜎𝜎 is the conductivity of the material
𝐽𝐽(𝑥𝑥) = 𝐽𝐽0𝑒𝑒−�𝑥𝑥 𝛿𝛿� �𝑒𝑒−𝑗𝑗�
𝑥𝑥𝛿𝛿� �𝑒𝑒𝑗𝑗2𝜋𝜋𝜋𝜋𝜋𝜋 ( 9 )
With
𝛿𝛿 = �1
𝜋𝜋𝑓𝑓𝜇𝜇𝜎𝜎
𝜃𝜃 = 𝑥𝑥�𝜋𝜋𝑓𝑓𝜇𝜇𝜎𝜎 =𝑥𝑥𝛿𝛿
( 10 )
The amplitude and the phase lag can be plotted, Figure 3, to show how the induced currents decrease and the phase lag increases with depth. One 𝛿𝛿 is defined as the standard depth of penetration. This is the depth where the magnetic fields, and the induced currents, are reduced to 37%. The fields are further reduced at an exponential rate with increasing depth, so that the fields at two and three times the standard depth of penetration are reduced to 14% and 5% respectively. A high frequency will induce currents only in the surface of a conducting material, while lower frequencies can penetrate deeper. In materials with lower resistivity, the depth of penetration is smaller than in materials with higher resistivity.
a
b
Figure 3 Change in density (a) and phase lag (b) with depth x for induced current in a
conductor.
0
0,2
0,4
0,6
0,8
1
-1 1 3 5
J/J0
x/δ
0
1
2
3
4
5
-1 1 3 5
θ
x/δ

16
Often the forward problem of finding the response to a certain geometry, and the inverse problem of describing the geometry matching a measured response are treated separately [51, 55]. Analytical solutions describing the field from a coil and a conductor are available for simple cases. Such a solution was derived by Dodd [56, 57], using Bessel functions to describe the magnetic vector potential 𝑨𝑨 (note that in this section, the established symbol 𝑨𝑨 is used, but it should not be confused with the use of A and a for alignment in other sections).
𝑩𝑩 = ∇ × 𝑨𝑨 ( 11 ) Solutions were found for axially symmetric cases with circular coils over plates with finite thickness and infinite extension, and for coils encircling cylindrical rods. Some analytical solutions exist for simplified geometry semi-infinite plates [58, 59] and a long slot in [60, 61] or between plates [62] of equal height. These solutions do not come in closed form equations though, and not for combinations of plates in different alignments. Instead numerical methods, for example finite element calculations, are often used to analyse this kind of problems [55].
For more complex cases, such as plates at different height, no analytical solutions have been developed, and instead numerical methods such as finite element methods can be used [63]. These also usually solve the magnetic vector formulation of Ampères law, but using vector elements to describe the fields allowing complex geometries. With approximations for low frequency, the equation is
∇ ×1𝜇𝜇0∇ × 𝑨𝑨 + 𝜎𝜎 �
𝛿𝛿𝑨𝑨𝛿𝛿𝑑𝑑
+ ∇𝜑𝜑� = 𝑱𝑱𝑆𝑆 ( 12 )
where 𝜑𝜑 is the electric potential, 𝑱𝑱𝑆𝑆 is typically the current in the coil. Different implementations can make different choices for 𝜑𝜑, the gauge condition, for displacement currents, or omitting magnetization and polarisation.
3.2 Dual coil complex inductive method A weld gap between two plates would disturb the induced current in the material, and therefore change the response. Commercial instruments used for inspection of material defects are designed to measure both the phase and the amplitude of the response, using for example a phase sensitive amplifier. This measurement, at a certain frequency, is also less sensitive to noise and disturbing signals [64]. With inductive sensing as a promising candidate for zero-gap sensing, retrieving more information from the sensors should allow for better measurements, and measurement of more gap parameters. Paper A describes a proposed method to use this information.

PROPOSED INDUCTIVE METHOD
17
The concept of the improved gap measurement method borrows from non-destructive testing with eddy current methods, where the complex response of an inductive coil is used to better understand flaw signatures [52]. That is, not only the amplitude of the coil signal is used, but the resistive and inductive components of the response are separated. When measuring the weld gap, these components would be used to measure both the height of the coil above the plate, and the distance to the edge of the plate. Doing this with one coil on each side of the gap forming a probe, the measurements can be combined for both position of the gap and gap width, for both height above the plates and the difference in height, or alignment, see Figure 4 for the definitions used. Upper case letters will be used for true values, or values from a reference system, while lower case letters will be used for values measured, or estimated, by the proposed measurement system. Index figures 1 and 2 are used to indicate the two sides. The gap dimensions are the gap width, , and alignment, , which is the difference in height between the plates. Plates that are not aligned to =0 are misaligned. The lift-off, , of each coil is zero when the coil is in contact with the plate. The probe height is the smallest of the two lift-off values. The distance to gap, or just distance, is measured from the centre of the coil to the edge of the plate. The probe position
is given relative the mid of the gap. The coil separation is measured between the centres of the two coils. Figure 5 shows the principle of how measurements from the individual coils are combined.
Figure 4 Illustration of the dimensions of the probe and work piece for defining the measurements of the probe and the gap.
L1 D1 L2 D2
W/2
A
P
LH,
S/2 S/2
Plate 1 Plate 2
Coil 1 Coil 2
2 W/2

18
Figure 5 Principle of a probe from combination of coils. Calibration functions and the combination of coil measurements into probe results are indicated.
Looking to non-destructive eddy current testing using commercial instruments, the complex result is conveniently presented on a chart with resistive response on the horizontal axis, and inductive response on the vertical axis, as in Figure 6. Placing a single coil on the plate, far from the gap at the “material point”, and lifting it to an “air point” will draw a trace on the screen called the lift-off curve. Instead approaching the gap will draw another curve [51, 65]. Repeating the measurements at different height and distance to the gap, these non-linear responses will form a calibration and linearization function that captures the behaviour of the individual coil, at a certain frequency and with a certain plate material and thickness. Usually, the instrument is used to rotate the response for convenient reading, like in the right hand part of Figure 6. The output of the instrument will then be displayed as Instrument-X and Instrument-Y.
2
Lift-off 2
Distance 2
Distance 1
Lift-off 1 Alignment
Position
Height
Width Height
Distance
1
2 1
Calibration

PROPOSED INDUCTIVE METHOD
19
a
b
Figure 6 Calibration grid formed by traversing coil, on the complex plane (a) and as presented on the instrument (b).
Figure 7 shows an example of an actual calibration grid, where the values for distance and lift-off are shown on the grid, together with arrows indicating the direction of increasing values.
Figure 7 Example of calibration grid with values for distance to gap (d) and lift-off (l) in [mm].
Air point
Material point MaLift-off response
Gap response
Resistance
Ap
Indu
ctan
ce
Inst
rum
ent-Y
Instrument-X
Constant distance curves
X
Constantlift-off curves
-4 -3 -2 -1 0 1
Instrument-X [V]
-1.4
-1.2
-1
-0.8
-0.6
-0.4
-0.2
Inst
rum
ent-Y
[V]
0.5
0.5
1
1
1
1.5 1.5
1.5
2
222.5
2.52.5
3
33
0.1
0.1
0.20.30.4
0.5
0.6
0.7
0.8
0.91
1.1

20
3.3 Method of investigation To understand the behaviour of a combined probe, the behaviour of individual coils in response to the gap, that is the resistive and inductive response to distance to gap and height above plate, must be investigated. Further, not only the response to a zero gap width, but to different gap dimensions should be investigated to learn how different working conditions affect the method. The working range, that is the extent of the coil distance to the gap and height above the plates, must also be investigated to understand what changes in measurement performance that can be expected. This could be done in several ways. One idea would be to use an analytical description of the physical phenomena. Unfortunately, this is not straight forward. To simulate all conditions would instead require modelling and several numerical simulations. It would be possible to set up the corresponding geometry and simulate the response to an ideal coil. Eventually though, these solutions would have to be compared to, and calibrated by, real world measurements. The investigations in this thesis were mainly experimental, using recordings of the actual response from a real coil and plates. These recordings were then used as calibrations to interpolate the gap geometry corresponding to a coil reading. Some parts, involving several different coils and configurations, were done using simulations rather than manufacturing the physical components.
3.4 Instruments for impedance measurements Impedance measurement instruments come in different versions depending on needs for accuracy, measurement speed, cost etc. An accurate instrument capable of absolute measurement [66] could use an auto-balancing bridge with a separate phase sensitive demodulator to constantly track and measure both the resistive and reactive components of the complex impedance of a component driven by a signal generator at different frequencies. An eddy current inspection instrument on the other hand [51] would usually measure a change in impedance rather than absolute values. Some sort of auto-balancing circuit would usually allow adjustments to use the best range of the instrument, but it would null the bridge at a certain operating point rather than tracking the impedance changes [67]. A phase sensitive quadrature demodulator then separates the resistive and reactive components, allowing fast changes to be recorded while for example scanning a work piece for defects using a probe with an inductive coil. The instruments used in this work, one Rohmann Elotest B1 and one Rohmann Elotest B300 can measure at frequencies up to 10 MHz, and have a bandwidth of 10 kHz [68, 69]. This kind of instrument, with mixing phase demodulators, is illustrated in Figure 8. The inspection instrument also offers a phase rotation that can be used to align the display of responses in a certain direction. For the purposes in this

PROPOSED INDUCTIVE METHOD
21
investigation, it is expected that reference values can be recorded before a measurement, and that the changes relative this reference will be used. Then the inspection instrument is both sufficient and likely well suited for the intended industrial application.
Figure 8 Principle of eddy current inspection instrument
3.5 Experimental setup Two plates were square cut and mounted end to end so that one was fixed, and one adjustable by two micrometer screws. This allowed the gap between the plates to be adjusted from close contact at the same level, to a gap width, 𝑊𝑊, and alignment, 𝐴𝐴, of up to 0.8 mm, using micrometer screws for adjustment within ±10 µm. The surfaces facing the gap were milled to a surface roughness Rz of 6 µm. An eddy current coil was mounted perpendicular to the plates on a traverse system, so that it could be adjusted in the Y-direction for height above the plates, 𝐻𝐻, and in X direction for distance to gap, 𝐷𝐷, see Figure 9. The coil used in Papers A, B and C was a commercial ferrite core absolute probe intended for non-destructive inspection, with a nominal sensing area of 1.5 mm diameter. The instrument used with the coil was a commercial eddy current inspection instrument, with voltage output for the resistive and inductive response respectively. These outputs are presented as a rotated response as explained in Section 3.2.
Low pass filter
90°
Rotation
Low pass filter
Instrument-X
Instrument-Y
Coil Balance
Source
Phase demodulators

22
Figure 9 Principle of the experimental setup with one fixed (left) and one adjustable plate (right), the traversing eddy current coil and corresponding gap dimensions width, W and alignment A.
In Paper A, two plates of 6.8 mm Alloy 718 (a nickel based alloy) were used, and the frequency selected, 3.2 MHz, gave an effective penetration depth of 1.5 mm, which is much smaller than the thickness of the plates. At this depth, the current density is less than 1% of the density at the surface, while at 0.3 mm, which is the standard depth of penetration, the influence is 37%. See more on penetration depth in Section 3.1 and also in Section 3.13.
In Paper B, plates of 4 mm Hastelloy-X were used instead. This is also a non-ferromagnetic nickel based alloy, but with different resistivity. The frequency was adjusted to 2.9 MHz to give the same penetration depth as in Paper A. The same traverse and recording system was used for both Paper A and B.
While the proposed final probe will have two coils, experiments to understand the behaviour of the system can be made using just one coil. Measurements from both sides of the gap can then be combined into a virtual coil. The coil was traversed several times across the gap at different heights to collect sets of data from a reasonable working range. Each set was recorded with different settings of the plates to investigate the influence of different combinations of gap width
and alignment , while one set with zero gap and no misalignment was intended for linearization. A computer was used to synchronize the recordings of both instrument signals and probe position and height . Further details on instrumentation and procedure can be found in Paper A.
With the reference data recorded for the case of a zero width, zero misalignment gap, each adjustment of lift-off and distance to gap now gives a certain value of Instrument-X and Instrument-Y, i.e. each combination of the two instrument
X
A W
Y

PROPOSED INDUCTIVE METHOD
23
values can be uniquely associated with a lift-off value, and with a distance value. These data can then be organized as two tables where instrument outputs can be used to find distance to gap value and lift-off from simple interpolation.
Since the data is recorded in a traverse pattern, it can easily be organized in a regular grid, suitable for interpolation see Figure 10. Each corner of a triangle, defined by values of Instrument-X and Instrument-Y, has corresponding values for distance, D, and lift-off, L. The sizes of the triangles are adapted to the sensitivity in distance, from 0.1 mm steps close to the gap, to 1 mm furthest from the gap. Only the area corresponding to the traverse pattern is ordered (solid), triangles outside the traverse area (dashed) produce poor results that are not used.
Figure 10 Pattern for the interpolation grid for distances to gap from 8.0 to 0.2 mm, and lift-off from 0 to1.5 mm.
3.6 Single and dual coil responses Having recorded the single coil response to the zero width, zero misalignment gap as a nominal calibration, the measurement principle of the combined virtual

24
probe can be better understood. In Figure 11, the calibration grid is illustrated for the working area. Starting with the virtual probe in a nominal position, centered above the gap at a height of 0.5 mm, a blue and red cross (overlapping) can be drawn on the grid for the left side and the right side, see Figure 11(a). Moving the probe to the right, the right coil indication will move down along the lines to the red circle, reflecting a larger distance to the gap, while the left coil indication will move up to the blue circle reflecting a smaller distance, see Figure 11 (a). Instead lifting the probe from the nominal position, both coil indications (overlapping crosses) will move to the left along the lines of the grid, indicating a larger distance to the plates (overlapping circles), see Figure 11 (b).
a b
Figure 11 Response grid from zero-width, zero alignment gap, showing changes in coil readings for a change of 0.40 mm in probe position toward the adjusted side (a), and an increase of 0.40 mm in height (b). The inset picture shows the nominal (solid)
and changed (dotted) position of each coil.
If instead the gap dimensions are changed, the response is indicated with the same symbols in Figure 12. For an increase in gap width, both coils indicate a smaller distance, see Figure 12 (a), while misalignment moves the indication of the lowered plate to the left, see Figure 12 (b). It can be seen that the response deviates a little from the ideal, which will affect the measurement.

PROPOSED INDUCTIVE METHOD
25
a b
Figure 12 Response grid from zero-width, zero misalignment gap, showing changes in coil readings for a change of 0.40 mm in gap width (a), and in alignment (b). The
inset picture shows the changed position of the adjusted plate.
The principle of how the results from each coil can be combined into a gap measurement probe can be seen in Figure 5, where index 1 refers to the fixed side and index 2 to the adjusted side.
The position, P, of the combined probe is found from half the difference in distance between the coils and the plate edges. This can be seen from Figure 4, where the measurements add up on both sides of the gap centre so that = 2 + 2= 2 + 2
2 =
( 13 )
The width, W, of the gap is found from the separation distance, S, between the coils, and from the distance, D, from each coil to the plate edge. The alignment, A, with index to indicate side, is found from the difference in lift-off, L, between the probes. The formulae are then given by ( 14 ). The corresponding formulae for values measured by the coils can be written in lower case letters.
26
𝑃𝑃 =12
(𝐷𝐷2 − 𝐷𝐷1)
𝑊𝑊 = 𝑆𝑆 − (𝐷𝐷1 + 𝐷𝐷2) −𝐴𝐴 = 𝐴𝐴1 = 𝐿𝐿1 − 𝐿𝐿2 𝐴𝐴 = 𝐴𝐴2 = 𝐿𝐿2 − 𝐿𝐿1 𝐻𝐻 = min (𝐿𝐿1, 𝐿𝐿2)
( 14 )
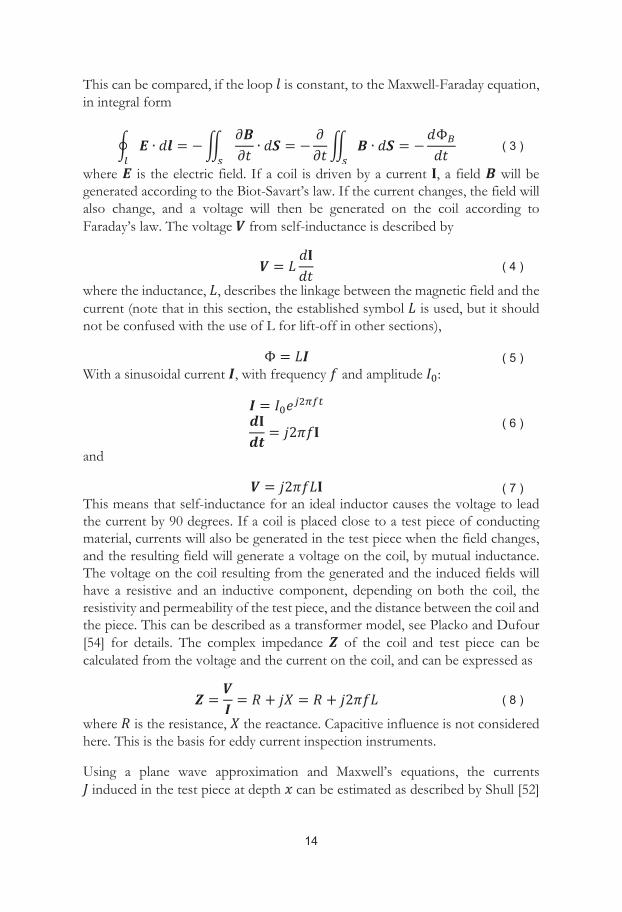
3.7 Comparison to three other methods To understand more about the alternative ways of gap measurement, a first comparison between four different methods, under the same conditions, was performed in Paper B. In addition to the inductive method, a laser line sensor, a vision based method and a novel thermographic method were examined with a set of Hastelloy-X plates, which are also non ferromagnetic and nickel based. The edges of the plates were machined to allow a narrow gap.
All methods were used for different combinations of gap width and alignment to understand their capability. All methods should be able to measure gap width and position, but the thermographic and the vision method use just a single camera and cannot be expected to measure height information or alignment.
In the investigation of a gap with both misalignment and gap width increasing from zero to 0.2 mm in step of 0.05 mm, the inductive, vision and thermographic methods measure the zero gap, while the laser line method need a gap of at least 0.05 mm. Both the inductive and the laser line methods show ability to measure alignment from 0 mm. So, the line scanner can measure everything but narrow gaps. The investigated vision method handles narrow gaps but not alignment. Note that the figure and description of the vision method in Paper B are somewhat confusing, but that the conclusion holds. The thermographic method detects narrow gaps, but measuring width is difficult and alignment or height is not measured. The inductive method measures all parameters starting at zero gaps, but again the systematic errors can be seen. The results are summarised in Table 2
Table 2 Results from comparison of four different methods
Capability Inductive Thermographic Vision Laser line Zero-gap Yes Yes Yes Alignment Yes Yes
PROPOSED INDUCTIVE METHOD
27
The study in Paper B motivated further studies on the inductive method, both regarding sensitivity, errors and possible improvements, which is described in the remainder of this thesis.
3.8 Systematic errors If the gap width and alignment is changed, the conditions are no longer the same as in the calibration set-up. Figure 13 shows how the response grids are deformed with a change in gap width 𝑊𝑊 from 0-0.6 mm, and in alignment 𝐴𝐴 from 0-0.8 mm. The deformation of the calibration grid shows systematic errors in response to variation in gap dimension; ideally, the grid shape should stay the same even when the gap dimensions change. The deformation of the grid from a change in gap width is symmetric with respect to the centre of the gap, while the deformation from a change in alignment tends to tilt the grid in different ways. A change in alignment also displaces the adjusted side grid to higher lift-off values as can be expected. It can be seen that most of the identified measurement problems are systematic. That means that they are repeatable, and if they are understood, they can be solved or compensated.
Systematic errors will contribute in different ways depending on how each result is calculated. For position estimates 𝑝𝑝, according to equation ( 14 ), the result is effectively half the difference of two values. Therefore, if the errors in the measurement are about the same size and same sign, as in Figure 13 (a) and (b), they will tend to cancel. For gap width estimates w, on the other hand, errors of the same sign will add up. For height estimates h, the error will be the same as that of the closest coil, (c) in Figure 13 (usually, unless the differences are small or for some gap dimensions with larger errors). For alignment, errors of the same sign will tend to cancel, compare Figure 13 (c) and (d) where errors tend to different signs.

28
a b
c d
Figure 13 Result of a change in gap width for coils over either side (a and b), and of alignment from a coil over the fixed side (c), and from the coil over the adjusted side
(d). The inset pictures show the plate and coil arrangement.
It is clear that the inductive principle does not produce a linear response to either distance or lift-off. The calibration handles that, but only for the same zero gap conditions. Looking at the results after applying the calibration, the errors introduced by changes in gap dimensions are not necessarily linear. Further, there is a cross influence, where a change in distance will influence the error in alignment, and the other way around.
To improve the results, these systematic errors need to be compensated. That means that a way to estimate the size of the error must be found, for various conditions. Several different approaches could be attempted to do that. To describe the error, a model is needed. For example, the non-linear full calibrations could be taken for different gap dimensions, or otherwise the error could be described by a set of equations, to be derived empirically or analytically. To then find the actual size of the error, the ideal way would be to measure the disturbance and compensate for it using the model. Unfortunately, that is not possible here, since the sensors available for measuring disturbances are the same that are to be

PROPOSED INDUCTIVE METHOD
29
compensated. What would be needed then is a way to solve for the best compensation, analytically or numerically, using the model and available sensor output.
For a transducer that is close enough to having linear and independent responses, such as a well-designed load cell, this is a straight forward operation of constructing the response matrix of cross sensitivities from calibration, and then inverse it for individual contributions. But for an inductive transducer, in a setup that is not expected to be linear nor independent, it is not necessarily straightforward.
Analytical solutions have not been found for these geometries, and numerical solutions based compensations would not be suitable for real-time applications. Neural networks could be useful, but requires training data from more gap dimensions. If other parameters were changed, such as plate thickness or probe frequency, it would need complete re-training. It can also be difficult to guarantee the behaviour of a neural network according to [70].
3.9 Model based compensation For an industrial solution, a simple method is preferred, with reasonable demands on calibration effort and simple calculations that can be implemented in a real time instrument. In Paper C therefore a model based compensation is proposed, where a set of simple equations are determined from a systematic investigation of the combined probe. These equations are then adjusted with actual values from a small number of calibration measurements.
A pragmatic approach to modelling is taken, where model equations are derived from empirical data, and then fitted to specific values for a few points in the working range and a few sample gap dimensions. The equations used are not based on electromagnetic models, nor are they the best possible description of the error. Rather, the ambition is to find a description that is good enough to reduce errors to a reasonable level.
The model is designed to describe errors as a function of the recorded values, which is what will be available when the system is in use. The true values, as found from the traverse system in calibration, will of course not be available in the measurement situation.
A number of data sets, covering the working range, were recorded with systematic variation of gap width and alignment. The corresponding error, that is the difference between measured and true values, is plotted as surfaces in Figure 14. They show that the behaviour in distance to gap error is somewhat complicated,
30
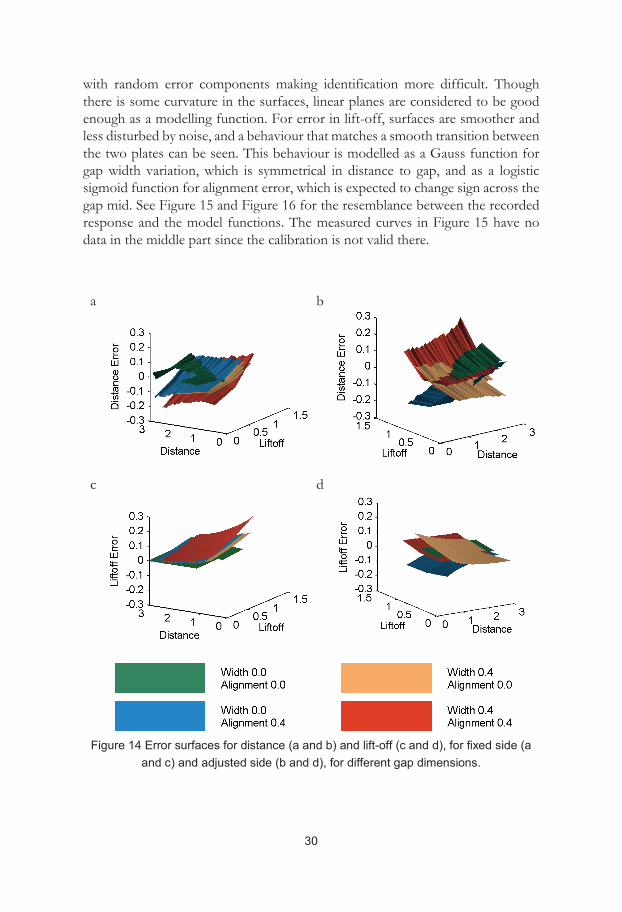
with random error components making identification more difficult. Though there is some curvature in the surfaces, linear planes are considered to be good enough as a modelling function. For error in lift-off, surfaces are smoother and less disturbed by noise, and a behaviour that matches a smooth transition between the two plates can be seen. This behaviour is modelled as a Gauss function for gap width variation, which is symmetrical in distance to gap, and as a logistic sigmoid function for alignment error, which is expected to change sign across the gap mid. See Figure 15 and Figure 16 for the resemblance between the recorded response and the model functions. The measured curves in Figure 15 have no data in the middle part since the calibration is not valid there.
a
b
c
d
Figure 14 Error surfaces for distance (a and b) and lift-off (c and d), for fixed side (a
and c) and adjusted side (b and d), for different gap dimensions.

PROPOSED INDUCTIVE METHOD
31
a
b
Figure 15 Measured individual coil lift-off response to 0.40 mm gap width (a) and
0.40 mm alignment (b).
a
b
Figure 16 (a) Gauss function for modelling gap width error; (b) logistic sigmoid
function for lift-off error.
These model functions are then adapted to a few calibration points, selected at nominal values, to give a good representation across the working range. Two points are taken in the mid of the lift-off working range but at the ends of the position working range, and two more points are taken in the middle of the position working range but at different lift-off values. These calibration values are measured both for a width-only gap, and for an alignment-only gap.

32
The principle for the complete signal processing, with the compensation of systematic error in place, can be seen in Figure 17. The values from the original linearization function are used to calculate first estimates of gap dimensions, and . These are then used in the error model to calculate a compensation in lift-off and distance, and , that, when applied to the original coil values and , allows a more precise estimate of the gap dimensions , , and .
Figure 17 Signal processing scheme for the error compensation. Coil measurements are linearized and combined into first estimates of gap dimensions. The model is then used to estimate a compensation to the coil measurements, which are combined into
the final probe results.
3.10 Compensated results In Table 3 and Table 4, the results for all cases can be compared without and with the model correction. The working field coverage value corresponds to the proportion of the working range of ±1 mm in position , and 0-1 mm in height
where the error is within +/- 0.1 mm for the respective measure , , , .
2 L
D
Probe
1
l2
1
l d 1
2
1
2
1
2
l
d
Ê(w,a,d
1
l
d
Error
2

PROPOSED INDUCTIVE METHOD
33
Table 3 Working field coverage, C, of error within ±0.1 mm, for uncorrected and corrected results.
Gap [mm]
No correction Model correction CP [%]
CW [%]
CA [%]
CH [%]
CP [%] CW [%]
CA [%]
CH [%]
W=0.40 A=0.00 100 56 100 100 100 94 100 100
W=0.40 A=0.40 100 37 77 80 80 42 100 100
W=0.00 A=0.40 99 23 45 100 100 99 100 100
Table 4 Maximum absolute error, ε, within working range, for uncorrected and corrected results.
Gap [mm]
No correction Model correction εP [mm]
εW [mm]
εA [mm]
εH [mm]
εP [mm]
εW [mm]
εA [mm]
εH [mm]
W=0.40 A=0.00 0.04 0.21 0.09 0.05 0.04 0.16 0.08 0.02
W=0.40 A=0.40 0.09 0.23 0.20 0.20 0.18 0.37 0.07 0.07
W=0.00 A=0.40 0.10 0.26 0.16 0.10 0.04 0.10 0.09 0.02
It can be seen that the compensated results are improved to within the 0.1 mm limit for both height and alignment, for the whole working range. For gap width, results are improved to within the limit for nearly the whole working range, but only for cases with just gap width, or just misalignment. For the mixed case, that is the case with both gap width and misalignment, the working range is not improved, and the maximum error is actually worse. The results for position are also worse for the mixed case, and are not substantially improved for the other cases.
3.11 Selection of coil orientation and length using numeric method
For the preliminary investigations, a commercial eddy current probe was used. It is interesting to know if there are better alternatives. One thing to notice in the

34
results is that the response is more significant to a change in coil lift-off than to a change in distance to gap, see Figure 18, where the response grid is shown with equal units on the horizontal and vertical axes. In general, the results for height measurement has correspondingly lower errors. If the sensitivity to distance to gap could be increased, or if the relation between sensitivity to gap and sensitivity to lift-off could be increased, that could lead to more reliable results for position and gap width measurement.
Figure 18 Response grid with equal proportions between lift-off and distance to gap.
To investigate the possibilities, a number of different coil configurations were identified. First, the coil could be oriented in three ways with the axis in relation to the plates and the gap; normal to the plate (Norm), along the gap and plates (Para), and along the plates but across the gap (Perp). Each would induce currents in different ways into the plates, and be affected by the gap in different ways. Second, a short and a long coil could be expected to have different properties. The long coils would naturally have more turns, and therefore a higher impedance, but here the normalised results are the more interesting, to see the relationship between lift-off and distance to gap. The length of the coil would also influence the induced current distribution, perhaps most in the Para case, where there would be more turns along the gap.
Analytical solutions are available for some cases, for example a Norm coil close to a gap [62], or similar cases like a loop conductor close to a narrow surface crack [71], but not for all combinations. An experimental investigation would need several coils to be manufactured with different mounting possibilities. Instead, in Paper D a numerical investigation was performed using a commercial FEM-package, Comsol, which provided the AC/DC module with a Coil-feature to simplify the task. Two plates were modelled with a nominal 0.1 mm gap between them, with conditions similar to previous experiments. One active coil was
-5 -4 -3 -2 -1 0 1 2
Instrument-X [V]
-2
-1
0
1
Inst
rum
ent-Y
[V]

PROPOSED INDUCTIVE METHOD
35
modelled in different positions over one of the plates to produce results corresponding to the response grids from the experimental investigations. Over the other plate, one passive coil was modelled to investigate the possibility of cross talk between coils, that is the amount of induced currents from one coil that would disturb the measurement on the second coil. To ensure the accuracy of the numerical results, the calculation grid was refined and the responses were compared to available analytical solutions for a Norm coil over a large plate.
The numerical approach also allows a better understanding of the distribution of the induced currents in the different cases. Figure 19 shows the three different coil orientations investigated. In (a), the gap and the Norm coil is arranged much like a crack and an inspection coil, where the currents cannot pass the gap. Moving the coil toward the gap, more of the currents are affected. In (b), the Para coil drives induced currents toward the gap where they again cannot pass. With the Perp coil (c), the induced currents for a coil at long distance are parallel to the gap, with closer distance an increasing portion cannot pass across the gap, but if the coil is moved even closer, the induced currents become parallel to the gap again so that the response decreases. The two first cases give useful responses, but the Perp arrangement gives a much smaller useful range.
a
b
c
d
e
f
Figure 19 Induced currents for three different coil orientations Norm (a), Para (b) and
Perp (c) in the top row. Corresponding coil configurations (d-f), with active and passive coil, and current direction.
The Norm configuration with a long coil, similar to the commercial probe used for the first experiments in Papers A-C, had the overall best sensitivity and linearity and in Paper E, a set of coils were manufactured for validation. The

36
experimental results after normalization for easy comparison, are very similar to the numerical results for the two coils used, see Figure 20.
a
b
Figure 20 Normalised sensitivity to distance to gap for the FE-model, and for the coils 1 and 2 at low (L=0) and high (L=1.5) lift-off. The shaded area in (a) shows the ±1 mm working range at highest sensitivity, and in (b) shows the range used in experiments.
The results of a validation measurement on a realistic gap with both gap width and varying alignment are shown in Figure 21, as error maps for the range of ±0.8 mm in position, and 0-1.0 mm in height. The errors in measurement of position and gap width are affected by some of the choices in the experimental set-up. First, the coil separation decides how the range of sensitivity is used. From Figure 20 it can be seen that the highest sensitivity is found for coil to gap distances of about 1.2±1 mm corresponding to a coil separation of 2.4 mm, but the actual coil separation used was 4.1 mm. Therefore the lower sensitivity from the range between 2.2 and 3.2 mm was always used by one of the coils, with the associated larger uncertainty. Secondly, the full scan of the working range took about half an hour to perform, which allows a greater influence from instrument drift. The set-up did not allow a lift-off calibration to be performed, so that the full uncertainty applies to all parts of the working range.

PROPOSED INDUCTIVE METHOD
37
a
b
c
d
Figure 21 Errors in (a) position p, (b) height h, (c) gap width w, and (d) alignment a measurements.
It should be noted that there are other ways to improve the sensitivity to distance to gap. From measurements at different frequencies, it can be seen that decreasing frequency changes the grid shape, to give better sensitivity to distance. The grids in Figure 22 show the calibration response at 1, 3 and 10 MHz aligned to the same lift-off response. The 1 MHz grid has a much larger response to distance to gap in relation to the lift-off response than the 10 MHz grid. There are other parameters that influence the measurement uncertainty though, see Section 3.12 and Section 4 for further discussion.

38
Figure 22 Response grids at 3 different frequencies, with aligned lift-off response, for 3.2 mm Alloy 718, using a 4 mm long, 2 mm diameter coil with 44 turns.
3.12 Uncertainty of measurement The measurement uncertainty of the experiments in Paper F was assessed by noting the variation in a small measurement series under calibration conditions, thus capturing the natural variation of the measurement process and the instruments. With the coils used in this investigation, the best performance was noted at a frequency of 3 MHz, with larger uncertainties at both 1 and 10 MHz. This result depends on properties of both the instrument and the coil used. A larger coil would have higher impedance and should perform better at low frequencies. A larger impedance in relation to the resistance also helps to reduce effects of self-heating that was noticed in some experiments. When the impedance changes in different parts of the working range, the current through the coil can change, affecting the coil temperature and thereby the resistivity. Thermal management or instrument design can help in avoiding the problem. The resulting maps of uncertainty, with results available over a range of 1.4 mm to each side and 1.4 mm above the plates, can be seen in Figure 23.
-4 -3 -2 -1 0 1
Instrument-X [V]
-1.2
-1
-0.8
-0.6
-0.4
-0.2
0
Inst
rum
ent-Y
[V]
1 MHz
3 MHz
10 MHz

PROPOSED INDUCTIVE METHOD
39
a
b
Figure 23 Expanded uncertainty in position (a) and gap width (b) from statistical
assessment in Paper F
Instead of a statistical assessment as above, the method of propagation of uncertainty allows to study the contribution of each source of uncertainty on the final result. The GUM [72], Guide to uncertainty in measurement, describes the process in detail. In short, the standard contribution from each source is multiplied with a factor of sensitivity derived from the relations between the source and the result, and finally the square root of the sum of the squared contributions is multiplied by a coverage factor to expand the combined standard uncertainty to a 95% probability. The contributions to the uncertainty are the electrical noise and drift in each channel from the instrument, and the non-linearity and resolution of the traverse system. The uncertainty in the resulting lift-off and distance to gap from each coil is estimated using the recorded responses to estimate the sensitivity to each error source. These uncertainties where then combined using the relations in equation ( 14 ) as model equations. As before, the contributions from both calibration and measurement were considered corresponding to the situation in the experiment in Paper F. When the same traverse is used for both the calibration and the measurement, and the position of the plates is held fixed, the contributions from traverse nonlinearity is correlated and cancels. Since the same coil and instrument is used for both sides, with only a few seconds between the measurements, the drift is also correlated between the two coils. This tends to reduce the uncertainty in the position measurement, but increase the uncertainty in gap width measurement. The contributions do not cancel entirely in the position measurement, since the sensitivity changes with the position of the probe; when one coil is close to the gap, the other is far away, and the contributions are different. The resulting maps of expanded uncertainty for position and gap width are given in Figure 24. The results compare well to the corresponding results from the statistical assessment in Figure 23, with similar distribution and size of uncertainty. Using the method of propagation of uncertainty, it is now possible to investigate the effect of for example a change in the size of electrical drift resulting from an improved instrumentation. If the electrical drift, which is the dominating contribution, is halved, the estimated uncertainty in position measurement would be reduced

40
from 0.1 mm to 0.05, and the uncertainty in gap width measurement would be reduced from 0.25 to 0.15. It would also be possible to predict the result of changing equipment between calibration and measurement, such as in industrial use, by considering new sources of uncertainty and changes in correlations between sources. It should be noted that these evaluations were made under calibration conditions, and do not include the systematic effects from changing gap width and alignment.
a
b
Figure 24 Expanded uncertainty in position (a) and gap width (b) from propagation of
uncertainty
3.13 Non-ideal conditions In an industrial application, conditions cannot always be controlled as in a laboratory experiment. It is useful to know something about how the method will perform in the presence of disturbances, and this is the subject of Paper F. Using an inductive method, components that may influence the results are the instrument used, the sensor used, and the plates forming the gap to be measured. The instrument will not be discussed here, except to note that it should be chosen and operated taking the application into account regarding factors such as stability, range, speed and cost. The sensor, a coil in this case, once selected will be affected by proximity to conductors, temperature and temperature balance with compensating coils, and the angle relative the work pieces. The material in the plates may be affected by non-homogeneity causing deviations from calibration conditions, by changes in permeability and resistivity caused by temperature and stress, and by geometrical deviations from a flat plate with a square edge. Alloy 718 has small changes in resistivity from temperature and strain, and is also non-ferromagnetic, which reduces the possibility for magnetic inhomogeneity.
Some remaining factors that can influence the measurements, and that can be expected in an industrial environment, are changes in plate thickness, chamfers on the plate edge, and scratches on the plate surface. Such an investigation is

PROPOSED INDUCTIVE METHOD
41
presented in Paper F, and the measurements are summarized in Table 5 and Table 6. Here, the significant error εmax, that is the maximum absolute error larger than the estimated uncertainty, found in the working range of ±1 mm in position 𝑃𝑃, and 0-1 mm in height 𝐻𝐻, is given. A colour coding representing the error weighted by the proportion of the working range that is affected more than by random fluctuations is used to take account of the performance across the working range. See section 3.12 for assessment of the uncertainty. This gives an overview of how the results change with size and location of scratch or chamfer and with frequency.
Table 5 Significant error in position measurement, with weighted colour coding where green is better and red worse.
Frequency
(MHz) 1 3 10
εmax (mm) εmax (mm) εmax (mm)
Thickness (mm)
4,6 0,2 0,17 0,17
6,2 0,25 0,19 0,15
7,8 0,26 0,16 0,31
Chamfer width (mm)
0,1 0,06 0,09 0,07
0,3 0,06 0,07 0,17
0,5 0,09 0,07 0,19 Narrow scratch location
(mm)
0,5 0,05 0,08
1 0,09
2 0,07 Wide
scratch location
(mm)
0,5 0,06 0,05 0,1
1 0,1
2 0,05 0,12 0,12

42
Table 6 Significant error in gap width measurement measurement, with weighted color coding where green is better and red worse.
Frequency (MHz) 1 3 10
εmax (mm) εmax (mm) εmax (mm)
Thickness (mm)
4,6 0,55 0,21 0,61
6,2 0,59 0,59 0,70
7,8 0,81 0,92 0,62
Chamfer width (mm)
0,1 0,17
0,3 0,15 0,24
0,5 0,24 Narrow scratch location
(mm)
0,5 0,28
1
2 0,24 Wide
scratch location
(mm)
0,5 0,24
1 0,12 0,25
2 0,20
The standard depth of penetration in Alloy 718 is 0.56 mm at 1 MHz, which is much smaller than the smallest plate thickness, 3 mm, used in the investigations in this thesis. If a coil is then placed in the middle of a large plate there will be no influence from an increase in plate thickness. With measurements close to the gap on the other hand, there is a possibility for magnetic fields in the gap, and for currents on the edge of the plates that will cause an influence from plate thickness. This can be illustrated for example by the simulations in Figure 19. Some analytical results for plates [59], and through slots in plates [62] are available. This means that if the change in plate thickness is too large, it might be necessary to perform a new calibration for accurate results. The symmetry of the results can be seen in the error maps in Figure 25 showing how the position is underestimated to both sides, and in Figure 26 showing how the gap width is underestimated.

PROPOSED INDUCTIVE METHOD
43
Figure 25 Position errors in the working range for the 7.8 mm plate at 10 MHz, with a 3.0 mm plate used for calibration.
Figure 26 Gap width errors in the
working range for the 7.8 mm plate at 3 MHz, with a 3.0 mm plate used for
calibration.
In the case of surface defects on one of the plates, a non-symmetric response can be expected. It can be illustrative to look at the geometry of these cases. In Figure 27, a scratch of the same size as the narrow scratch in the investigation in Paper F is shown together with the contour of the standard depth of penetration in Alloy 718, which is 0.56 mm at 1 MHz and 0.18 mm at 10 MHz. At the higher frequency, the induced currents will be more affected by the missing volume of metal in the scratch, in a similar way as the gap, and the measurement on that side will underestimate the distance to the gap. This will cause the probe to indicate the position of the gap to the side of the plate with the scratch, while the measurement of gap width will be overestimated. The influence of the scratch will also be affected by the location of the scratch relative the position of the coil. Figure 28 shows the same situation for a 0.5 mm chamfer. Here, the results are different. At 1 MHz, the influence is much the same as from a scratch, and the distance to gap is underestimated. But at 10 MHz, the distance to gap measured on the unmodified side is instead overestimated, as if the gap was further away. Now the position of the gap is still indicated to the side of the modified plate, and the error in the measurement of gap widht will tend to cancel with the error in the other coil. The reason why this happens has not been investigated, but one hypothesis could be that the larger surface area exposed by the chamfer becomes more important than the missing volume when the standard depth of penetration decreases with frequency.
The consequences of this behaviour is that, whith a chamfer present, there are advantages both to chosing a higher and a lower frequency, to prioritise either the measurement of position or of gap width. For measurements with scratches, the influence is smaller with a lower frequency for both the position and the gap width measurement.

44
Figure 27 Scratch with standard depth of penetration (shaded) at 1 MHz (left) and at 10 MHz (right)
Figure 28 0.5 mm chamfer with standard depth of penetration (shaded) at 1 MHz (left) and at 10 MHz (right)
0.56 mm
0.18 mm
0.56 mm 0.18 mm
4 Usefulness and future improvements
While no strict rules can be given for the required accuracy in laser beam welding, the investigations provided here can help in assessing the possibility of a useful measurement under different conditions. In cases where it is known that there is either a gap width or a misalignment, but not both with corresponding larger combined effects, the inductive method proposed might be used as single sensor. If there is a possibility for both gap width and misalignment, the performance of especially gap width measurement will be poor. If better accuracy is needed, the complement of a laser line sensor, which does not necessarily need to be calibrated for accurate position measurement relative the welding tool, could then provide gap width measurement in cases where a misalignment is indicated by either the inductive probe or the laser scanner.
The proposed sensor is intended to be used on a robot moving along the weld gap, or held fixed with automated movement of the work pieces. The position of the sensor relative the welding beam will have to be calibrated. The method could be used either in a pre-welding step, to teach the correct gap geometry to a weld robot, or during welding to control the position. The data processing required is the interpolation of two values from each coil, and is not expected to be a problem. The environment of the welding zone will likely require some sort of thermal management of the probe, such as for example including a thermal mass in the assembly or temperature compensation of changes in coil resistance. The temperature influence on resistivity for Alloy 718 is small, and the temperature change of the work piece in front of the weld is moderate. The method has yet to be tested in real-time, and during actual welding.
There are still some conditions that would be interesting to investigate, for example the influence of probe wobble, that is the deviation from perpendicular between the probe and the plate, which would influence both the coil coupling to the plate and the reading of coil lift-off. Other factors include weld gap in-plane radius, which would affect coils differently on the concave and convex side, and the possibility of strong forces from fixtures or tack welds affecting conductivity in the gap.
From the series of calibration measurements used to assess variation it is clear that there would be a benefit from reducing the uncertainty. This could be done in the calibration by using an average of several calibration scans. The time needed to make a new calibration would of course increase. It may also be possible to

46
improve the performance of the instrumentation, by adapting a solution to the specific measurement rather than the broad range of situations an inspection instrument must handle. If the range of impedance and frequencies needed is known, it could for example be possible to adjust the drive circuits and gain of amplifiers to avoid range switching; some indications of such behaviour has been observed during experiments. Drift caused by temperature induced changes to coil resistivity could be compensated. An improvement in sensitivity and reduction of drift could also improve the chances of building a better correction model for systematic errors. The calibration of an actual measurement system would also need consideration. The influence of the traverse system would become important, unlike in experiments designed for fixed plate positions between calibration and measurement.
In inspection applications, a ferrite core is often used to concentrate the magnetic field, to give stronger and more concentrated induced currents when searching for a small defect. In the application of gap measurement, the geometric feature is large, and there is an interest in a larger range of influence rather than a concentrated field. On the other hand there is a trade off with the possibility of influence of weld path geometry, since a small radius curvature would affect coils on either side of the path differently. A ferrite cup with a core inside the coil and a ring outside might be an option to give both field concentration and range. With the results from scratched surfaces and chamfers, for most cases there is a benefit to using lower frequencies. To do this successfully, the coil design should be revised. A coil with more turns and a higher impedance would have a larger size, but would perform better at lower frequencies. The influence of a disturbance from a chamfer observed in Section 3.13 should also be noted. The chamfer caused an overestimate of the distance to gap at high frequency, but not at low. This behaviour might help reducing the influence of misalignment to measurement of gap width and position if lower frequencies are used. While the performance of gap width measurement in the presence of chamfers was shown to be worse at lower frequencies in Paper F, the behaviour at even lower frequencies, were the depth of penetration could become large compared to the chamfer size, would have to be investigated. The measurement properties in the case of scratches should also be improved at lower frequencies.
Different performance at different frequencies obviously opens to the possibility of a multi-frequency measurement system to have the advantages of both low and high frequencies. The choice of coil would then be a compromise for the best properties.
The complete system of both the coil and the cable used to connect to the instrument will have both an intended coil inductance and a parasitic inductance and capacitance of the coil and cable. Estimates of coil and cable parameters used,

USEFULNESS AND FUTURE IMPROVEMENTS
47
from data sheets and simple formulas, puts the LC-resonance around 16 MHz. Even though the actual measurement performed is that of a change in impedance, this is likely to have an influence on response when measuring at the highest frequency, 10 MHz, since the change in coil impedance with distance to gap and with lift-off above the plate will affect the resonance frequency of the measurement circuit. Measurements at frequencies close to this resonance can be affected in both the magnitude and the phase response. This is an effect that can be advantageous in for example the detection of small defects [73, 74] and in dedicated crack detectors [67], but the possibility to use it in the complex gap measurement method has not been investigated.

5 Conclusions and contributions
Automation of laser welding benefits from sensors providing feedback on process results. Accurate gap measurement, for finding the gap before welding or as part of a seam tracking system used during welding, facilitates improved efficiency and quality. The focus of this thesis is the measurement of butt-joints for laser beam welding, to measure the position of very narrow and well aligned gaps that other methods cannot handle. Further, there is interest in using the method also when the gaps are not narrow or well aligned, and then to measure the width of the gap, and height and alignment of the plates.
In Paper A, the complex inductive gap measurement was introduced, based on the resistive and reactive response from one coil on each side of the gap. From experiments using a single coil, it was found that the proposed method has advantages compared to previously described inductive methods, such as a working range, and measurement of gap width and plate height. However, the performance for gaps with a width and misalignment was poor.
In Paper B, four different measurement principles were compared under the same conditions, one of them the inductive method of this thesis. It was found that inductive, vision and thermographic methods were capable of detecting a technical zero-gap, while laser line triangulation performed well on measurement of gap width and position once the gap was wider than approximately 0.1 mm or different alignment was introduced. Laser triangulation and the complex inductive method both supplied height measurement.
In Paper C, a compensation model to correct the influence of gap width and alignment was introduced. It was found to perform well when there was only a gap width, or only alignment, but poor when there was both a gap width and an alignment at the same time.
In Paper D, numerical modelling was used to investigate the sensitivity of three different coil configurations and two different coil lengths, to understand which would perform better. The long coil with its axis normal to the plate surface had the strongest response and best linearity.
In Paper E, coils and a probe were manufactured using the findings from paper D and investigated experimentally. The measured results were compared to the numerical simulation with good agreement, and a realistic sample weld gap was

50
measured with model corrections for gap width and alignment applied as described in Paper C.
In Paper F, the influence of realistic conditions was investigated. Different plate thickness, different chamfer width and scratches of different dimensions and in different locations were investigated for three different frequencies. It was found that all tested thicknesses had a clear influence on measurement of both position and gap width. For chamfers, even the smallest width had an influence on position, but gap width was unaffected at higher frequency. For the scratch, the narrow one had no influence on measurements at the lower frequency. The deep scratch showed an influence that increased with frequency.
Returning again to the research question in Section 1.5:
“How to detect and measure position and dimensions of even a very narrow and well aligned gap in laser beam square butt welding of non-ferromagnetic alloys in order to weld correctly and in the right place?”
The proposed method has been investigated in different aspects to allow an understanding of the principles of measurement, of the conditions under which it will work, and how well. The investigation shows that the proposed concept of dual inductive coils with phase sensitive detection and a calibrated compensation model can be useful in applications with high demands on gap measurement for both narrow and ordinary gaps. The method has capability to measure gap dimensions that allows to direct the laser beam correctly, to adapt welding parameters to gap width and alignment, and to adjust laser focus, with an accuracy that is believed sufficient for many practical laser welding applications. Different probe configurations were investigated to better understand their properties. The influence of realistic conditions that can affect the measurement was investigated.
To summarise; the contributions of the work are some steps towards a solution for automation of laser beam welding.

6 References
[1] W. W. Duley, Laser welding: Wiley, 1999. [2] S. Katayama, Handbook of laser welding technologies: Woodhead Publishing,
2013. [3] F. Molleda, J. Mora, J. R. Molleda, E. Mora, and y. B. G. Mellor, "The
importance of spatter formed in shielded metal arc welding," Materials Characterization, vol. 58, pp. 936-940, 10// 2007.
[4] E. M. Westin and A. Fellman, "Effect of laser and laser hybrid welding on the corrosion performance of a lean duplex stainless steel," Journal of laser applications, vol. 22, pp. 150-158, 2010.
[5] Y.-X. Zhang, S.-W. Han, J. Cheon, S.-J. Na, and X.-D. Gao, "Effect of joint gap on bead formation in laser butt welding of stainless steel," Journal of Materials Processing Technology, vol. 249, pp. 274-284, 2017.
[6] G. K. Kanji, "Total quality management: the second industrial revolution," Total Quality Management, vol. 1, pp. 3-12, 1990.
[7] S. Shingo, Zero quality control: Source inspection and the poka-yoke system: CRC Press, 1986.
[8] D. Y. You, X. D. Gao, and S. Katayama, "Review of laser welding monitoring," Science and Technology of Welding and Joining, vol. 19, pp. 181-201, 2014/04/01 2014.
[9] A. Sun, E. Kannatey-Asibu, and M. Gartner, "Sensor systems for real-time monitoring of laser weld quality," Journal of Laser Applications, vol. 11, pp. 153-168, 1999.
[10] J. Stavridis, A. Papacharalampopoulos, and P. Stavropoulos, "Quality assessment in laser welding: a critical review," The International Journal of Advanced Manufacturing Technology, vol. 94, pp. 1825-1847, February 01 2018.
[11] G. Bolmsjö, M. Olsson, and P. Cederberg, "Robotic arc welding-trends and developments for higher autonomy," Industrial Robot: An International Journal, vol. 29, pp. 98-104, 2002.
[12] J. Ogbemhe and K. Mpofu, "Towards achieving a fully intelligent robotic arc welding: a review," The Industrial Robot, vol. 42, pp. 475-484, 2015.
[13] R. Crafer and P. J. Oakley, Laser processing in manufacturing: Springer, 2013.
[14] M. Bass, Laser materials processing vol. 3: Elsevier, 2012. [15] C. Dawes, Laser welding: a practical guide: Woodhead Publishing, 1992.

52
[16] W. M. Steen and J. Mazumder, Laser material processing: Springer Science & Business Media, 2010.
[17] P. Cederberg, "On Sensor-Controlled Robotized One-off Manufacturing," PhD Thesis, Department of Mechanical Engineering, Lund University, Lund, 2004.
[18] B. Regaard, S. Kaierle, and R. Poprawe, "Seam-tracking for high precision laser welding applications—Methods, restrictions and enhanced concepts," Journal of Laser Applications, vol. 21, p. 1, 2009.
[19] M. de Graaf, R. Aarts, B. Jonker, and J. Meijer, "Real-time seam tracking for robotic laser welding using trajectory-based control," Control Engineering Practice, vol. 18, pp. 944-953, 2010.
[20] Z. Luo, J. S. Dai, C. Wang, F. Wang, Y. Tian, and M. Zhao, "Predictive seam tracking with iteratively learned feedforward compensation for high-precision robotic laser welding," Journal of Manufacturing Systems, vol. 31, pp. 2-7, 1// 2012.
[21] J. P. Huissoon, "Robotic laser welding: seam sensor and laser focal frame registration," Robotica, vol. 20, pp. 261-268, 2002/05/01 2002.
[22] Z. Chen, Y. Song, J. Zhang, W. Zhang, L. Jiang, and X. Xia, "Laser vision sensing based on adaptive welding for aluminum alloy," Frontiers of Mechanical Engineering in China, vol. 2, pp. 218-223, 2007.
[23] A. De and D. Parle, "Real time seam tracking system for automated fusion arc welding," Science and Technology of Welding and Joining, vol. 8, pp. 340-346, 2003.
[24] M. Dinham and G. Fang, "Autonomous weld seam identification and localisation using eye-in-hand stereo vision for robotic arc welding," Robotics and Computer-Integrated Manufacturing, vol. 29, pp. 288-301, 10// 2013.
[25] H. Nomura, Sensors and Control Systems in Arc Welding. London: Chapman & Hall, 1994.
[26] P. Kah, M. Shrestha, E. Hiltunen, and J. Martikainen, "Robotic arc welding sensors and programming in industrial applications," International Journal of Mechanical and Materials Engineering, vol. 10, pp. 1-16, 2015.
[27] A. Rout, B. Deepak, and B. Biswal, "Advances in weld seam tracking techniques for robotic welding: A review," Robotics and Computer-Integrated Manufacturing, vol. 56, pp. 12-37, 2019.
[28] A. Mahajan and F. Figueroa, "Intelligent seam tracking using ultrasonic sensors for robotic welding," Robotica, vol. 15, pp. 275-281, 1997.
[29] D. M. Stevens, D. T. MacLauchlan, and P. J. Berbakov, "Edge detection and seam tracking with EMATs," USA Patent 6155117, 2000.
[30] J. Muhammad, H. Altun, and E. Abo-Serie, "Welding seam profiling techniques based on active vision sensing for intelligent robotic welding," The International Journal of Advanced Manufacturing Technology, pp. 1-19, 2016.

REFERENCES
53
[31] J. Wu, P. Wang, X. Fu, B. Liu, and J. Chen, "A novel seam measuring method of complex tight butt joint for laser welding," in Mechatronics and Automation, 2009. ICMA 2009. International Conference on, 2009, pp. 2548-2553.
[32] W. P. Gu, Z. Y. Xiong, and W. Wan, "Autonomous seam acquisition and tracking system for multi-pass welding based on vision sensor," The International Journal of Advanced Manufacturing Technology, vol. 69, pp. 451-460, 2013.
[33] J. Zeng, B. Chang, D. Du, Y. Hong, S. Chang, and Y. Zou, "A Precise Visual Method for Narrow Butt Detection in Specular Reflection Workpiece Welding," Sensors, vol. 16, p. 1480, 2016.
[34] P. J. Wang, W. J. Shao, S. H. Gong, P. J. Jia, and G. Li, "High-precision measurement of weld seam based on narrow depth of field lens in laser welding," Science and Technology of Welding and Joining, vol. 21, pp. 267-274, 2016/05/18 2016.
[35] S. Krämer, W. Fiedler, A. Drenker, and P. Abels, "Seam tracking with texture based image processing for laser materials processing," in Society of Photo-Optical Instrumentation Engineers (SPIE) Conference Series, 2014, pp. 89630P-89630P-9.
[36] C.-H. Kim, T.-Y. Choi, J.-J. Lee, J. Suh, K.-T. Park, H.-S. Kang, et al., "Sensor Guided Laser Welding Robot System," in World Congress, 2008, pp. 4324-4329.
[37] J. W. Kim and H. S. Bae, "A study on a vision sensor system for tracking the I-butt weld joints," Journal of Mechanical Science and Technology, vol. 19, pp. 1856-1863, Oct 2005.
[38] W. J. Shao, Y. Huang, and Y. Zhang, "A novel weld seam detection method for space weld seam of narrow butt joint in laser welding," Optics & Laser Technology, vol. 99, pp. 39-51, 2018/02/01/ 2018.
[39] M. Nilsen, F. Sikström, A.-K. Christiansson, and A. Ancona, "Robust vision-based joint tracking for laser welding of curved closed-square-butt joints," The International Journal of Advanced Manufacturing Technology, pp. 1-12, 2018.
[40] X. Gao, D. You, and S. Katayama, "Infrared image recognition for seam tracking monitoring during fiber laser welding," Mechatronics, vol. 22, pp. 370-380, 6// 2012.
[41] B. Regaard, S. Kaierle, S. Heinemann, R. Patwa, and J. P. Steinbrecher, "Welding Head for ‘Self Guided’Laser Welding," in Proceedings of ICALEO, 2009.
[42] N. D. Dupriez and C. Truckenbrodt, "OCT for Efficient High Quality Laser Welding: High‐speed, high‐resolution online seam tracking, monitoring and quality control," Laser Technik Journal, vol. 13, pp. 37-41, 2016.

54
[43] X. Gao and Y. Chen, "Detection of micro gap weld using magneto-optical imaging during laser welding," The International Journal of Advanced Manufacturing Technology, vol. 73, pp. 23-33, 2014.
[44] D. Wofsey, "Eddy current seam tracker and servo control responsive thereto," USA Patent 3484667, 1969.
[45] A. J. Varacins, "Apparatus for tracking a seam," USA Patent 4206391, 1980.
[46] B.-H. You and J.-W. Kim, "A study on an automatic seam tracking system by using an electromagnetic sensor for sheet metal arc welding of butt joints," Proceedings of the Institution of Mechanical Engineers, Part B: Journal of Engineering Manufacture, vol. 216, pp. 911-920, June 1, 2002 2002.
[47] J. Kim and J. Shin, "A study of a dual-electromagnetic sensor system for weld seam tracking of I-butt joints," Proceedings of the Institution of Mechanical Engineers, Part B: Journal of Engineering Manufacture, vol. 217, pp. 1305-1313, 2003.
[48] P. Xu, S. Huang, and W. Zhao, "Differential eddy current testing sensor composed of double gradient winding coils for crack detection," in 2010 IEEE Sensors Applications Symposium (SAS), 2010, pp. 59-63.
[49] K.-Y. Bae and J.-H. Park, "A study on development of inductive sensor for automatic weld seam tracking," Journal of Materials Processing Technology, vol. 176, pp. 111-116, 2006.
[50] J. J. Henry, "Eddy-current seam tracker for electron-beam welders," Y-1884 United States 10.2172/4429600 Dep. NTIS TIC English, 1973.
[51] J. García-Martín, J. Gómez-Gil, and E. Vázquez-Sánchez, "Non-destructive techniques based on eddy current testing," Sensors, vol. 11, pp. 2525-2565, 2011.
[52] P. J. Shull, Nondestructive evaluation: theory, techniques, and applications: Marcel Dekker, 2002.
[53] D. K. Cheng, "Field and wave electromagnetics.," 2nd ed. Reading, MA: Addison-Wesley Publishing, 1989.
[54] D. Placko and I. Dufour, "Eddy current sensors for nondestructive inspection of graphite composite materials," in Conference Record of the 1992 IEEE Industry Applications Society Annual Meeting, 1992, pp. 1676-1682.
[55] B. A. Auld and J. C. Moulder, "Review of Advances in Quantitative Eddy Current Nondestructive Evaluation," Journal of Nondestructive Evaluation, vol. 18, pp. 3-36, 1999/03/01 1999.
[56] C. V. Dodd and W. E. Deeds, "Analytical solutions to eddy-current probe coil problems,"; Oak Ridge National Lab., Tenn. ORNL-TM--1987 United States 10.2172/4499902 Dep. CFSTI. ORNL English, 1967.
REFERENCES
55
[57] C. V. Dodd and W. E. Deeds, "Analytical Solutions to Eddy‐Current Probe‐Coil Problems," Journal of Applied Physics, vol. 39, pp. 2829-2838, 1968.
[58] T. P. Theodoulidis and J. R. Bowler, "Eddy current coil interaction with a right-angled conductive wedge," Proceedings of the Royal Society of London A: Mathematical, Physical and Engineering Sciences, vol. 461, pp. 3123-3139, 2005.
[59] J. R. Bowler and T. P. Theodoulidis, "Coil impedance variation due to induced current at the edge of a conductive plate," Journal of Physics D: Applied Physics, vol. 39, p. 2862, 2006.
[60] M. H. Ostovarzadeh, S. H. H. Sadeghi, and R. Moini, "Field Distributions Around a Long Opening in a Metallic Half Space Excited by Arbitrary-Frequency Alternating Current-Carrying Wires of Arbitrary Shape," IEEE Transactions on Magnetics, vol. 47, pp. 4600-4610, 2011.
[61] M. Ostovarzadeh, S. Sadeghi, and R. Moini, "Field distribution around a long crack in a conductive half space excited by an arbitrary-frequency alternating-current-carrying coil of arbitrary shape," IET Science, Measurement & Technology, vol. 6, pp. 29-42, 2012.
[62] F. Fu, J. R. Bowler, and T. P. Theodoulidis, "The Effect of Opening on Eddy Current Probe Response for an Idealized through Crack," AIP Conference Proceedings, vol. 820, pp. 330-336, 2006.
[63] T. Rylander, P. Ingelström, and A. Bondeson, Computational electromagnetics: Springer Science & Business Media, 2012.
[64] C. A. Stutt, "Low-frequency spectrum of lock-in amplifiers," C. A. Stutt, Ed., ed: Massachusetts Institute of Technology, Research Laboratory of Electronics, 1949.
[65] S. Burke, "Eddy Current Induction by a Coil near a Conducting Edge in 2D," in Review of Progress in Quantitative Nondestructive Evaluation, ed: Springer, 1987, pp. 169-175.
[66] Impedance measurement handbook, A guide to measurement technology and techniques, 6th Edition - Application Note, 6 ed.: Keysight Technologies.
[67] IAEA, Eddy Current Testing at Level 2: manual for the Syllabi Contained in IAEA-TECDOC-628. Rev. 2" Training Guidelines for Non Destructive Testing Techniques vol. 48. Vienna: International Atomic Energy Agency, 2011.
[68] Rohmann, "Operators manual Elotest B1 V4," ed. [69] Rohmann, "Operator's Manual Elotest B300," ed. [70] B. J. Taylor, M. A. Darrah, and C. D. Moats, "Verification and
validation of neural networks: a sampling of research in progress," in AeroSense 2003, 2003, pp. 8-16.
[71] M. Ostovarzadeh, "Analytical Solution for Interaction of Arbitrary Frequency Finite Inducer with Long Cracks in Ferromagnetic Metals," Iranian Journal of Electrical and Computer Engineering, vol. 12, pp. 23-32, 2013.

56
[72] I. BIPM, I. IFCC, I. ISO, and O. IUPAP, "Evaluation of measurement data—guide to the expression of uncertainty in measurement. Joint Committee for Guides in Metrology (JCGM 100: 2008, GUM 1995 with minor corrections)," ed, 2008.
[73] R. Hughes, Y. Fan, and S. Dixon, "Near electrical resonance signal enhancement (NERSE) in eddy-current crack detection," NDT & E International, vol. 66, pp. 82-89, 2014.
[74] R. R. Hughes, "High-sensitivity eddy-current testing technology for defect detection in aerospace superalloys," University of Warwick, 2015.

7 Summaries of appended papers
7.1 Paper A. A complex response inductive method for improved gap measurement in laser welding
Laser welding needs precise measurement of weld gap position to avoid weld defects. Most often, optical measurement methods are used, but well-aligned narrow gaps can be difficult to detect. An improved inductive method capable of detecting zero gaps in square butt joints is proposed. The new method uses two eddy current coils, one on each side of the gap, and measures the complex response of the individual coils, i.e. both the inductive and resistive response. By combining the coil responses, both the position and the dimensions of the weld gap can be estimated. The method was experimentally investigated by traversing a single coil over an adjustable gap between two plates and combining the measured coil responses into a simulated two-coil probe. The gap was adjusted in both alignment and gap width up to 0.40 mm. Comparing the results to known settings and positions shows that gap position is measured to within 0.1 mm, if the probe is within a working area of 1 mm from the gap in both position and height. Results from the new method were compared to simulations, from the same experimental data, of a previously reported method where the coils were electrically combined by wiring them together. The previous method can give accurate results but has a much smaller working area and depends on servo actuation to position the probe above the gap. The improved method gives better tolerance to varying misalignment and gap width, which is an advantage over previous inductive methods.
The author planned and performed the experiments, planned and performed data processing and led the writing.
7.2 Paper B. Evaluation of non-contact methods for joint tracking in a laser beam welding application
The use of automated laser welding is a key enabler for resource efficient manufacturing in several industrial sectors. One disadvantage with laser welding is the narrow tolerance requirements in the joint fit-up. This is the main reason for the importance of joint tracking systems. This paper describes an evaluation

58
of four non-contact measurement methods to measure the position, gap width and alignment between super alloy plates. The evaluation was carried out for increased knowledge about the possibilities and limitations with the different methods. The methods are vision-, laser-line-, thermography- and inductive probe systems, which are compared in an experimental setup representing a relevant industrial application. Vision is based on a CMOS camera, where the image information is used directly for the measurements. Laser-line is based on triangulation between a camera and a projected laser line. Thermography detects the heat increase in the gap width due to external heat excitation. Inductive probe uses two eddy current coils, and by a complex response method possibilities to narrow gap measurement is achieved. The results, evaluated by comparing the data from the different systems, clearly highlights possibilities and limitations with respective method and serves as a guide in the development of laser beam welding.
The author participated in planning of experiments and writing, performed experiments and data processing for the inductive method and wrote corresponding sections of the paper.
7.3 Paper C. Model based compensation of systematic errors in an inductive gap measurement method
A previously reported inductive method for measurement of weld gap in high precision applications, such as laser beam welding of square butt joints, demonstrated improved results for gap position, width and alignment over previous inductive methods. To further improve that method by reducing systematic errors that affected results, a compensation scheme based on a model of the error behaviour is proposed in this paper. The model is designed from observation of experimental data, and adjusted from a small set of typical calibration measurements. The combined information about gap properties from the two coils in the probe is used to estimate a correction for each of the coils, and a more accurate result can then be calculated. Comparing the compensated results to the uncompensated, most parameters are improved to within 0.1 mm in the working range. Gap width measurement still suffers from combined gap width and misalignment.
The author planned the paper, performed the data processing and led the writing.

SUMMARIES OF APPENDED PAPERS
59
7.4 Paper D. Modeling of inductive coil geometry for gap position measurement
Numerical modelling was used to study the sensitivity and linearity of three different coil orientations relative the gap and plates, and of two different coil lengths. A mesh study was performed to find a model size that produced useful results in a reasonable time. The results for the case of a coil far from the plate edge were verified by comparison with an analytical model. The response in a working range around the gap was mapped by several model calculations to produce a response grid comparable to experimental results. A long coil with the axis directed into the plate was found to have a stronger response than the other configurations and comparable linearity to the configuration with the coil axis parallel to the gap direction. Coil orientation with the axis perpendicular to the gap direction was found to be unsuitable for the gap measurement method.
The author planned and performed the modelling, planned and performed the experiments, planned and performed data processing and wrote the paper.
7.5 Paper E. Experimental validation of an inductive probe for narrow gap measurement based on numerical modelling
Coils corresponding to the configuration from Paper D were manufactured and validated experimentally. The normalised response from the coil to an actual gap was found to compare closely to the numerical results from a coil with the same dimensions. A gap measurement probe according to the proposed method was assembled from two active coils and two compensation coils and used to measure a realistic gap between two plates.
The author planned and performed the experiments, planned and performed data processing and led the writing.
7.6 Paper F. Investigation of effects from realistic influences on inductive gap measurement
The influence from some non-ideal conditions likely to occur in industrial use was investigated experimentally at three different frequencies to understand their influence on the measurement of the gap position and geometry. Variation in plate thickness was studied between 3.0 and 7.8 mm. Influence of a chamfer on one plate edge up to 0.5 mm was studied on a 3.2 mm plate. Influence of two different sizes of scratches was studied at different locations close to the gap. The
60
results were compared to the uncertainty of the method at the different frequencies. The results indicate the effect on accuracy from the different conditions, and at the different frequencies. This is useful when selecting, adapting and developing the gap measurement system.
The author planned and performed the experiments, planned and performed data processing and led the writing.


Tidigare avhandlingar – Produktionsteknik
PEIGANG LI Cold Lap Formation in Gas Metal Arc Welding of Steel An Experimental Study of Micro-lack of Fusion Defects, 2013:2.
NICHOLAS CURRY Design of Thermal Barrier Coatings, 2014:3.
JEROEN DE BACKER Feedback Control of Robotic Friction Stir Welding, 2014:4.
MOHIT KUMAR GUPTA Design of Thermal Barrier Coatings A modelling approach, 2014:5.
PER LINDSTRÖM Improved CWM Platform for Modelling Welding Procedures and their Effects on Structural Behavior, 2015:6.
ERIK ÅSTRAND A Framework for Optimised Welding of Fatigue Loaded Structures Applied to Gas Metal Arc Welding of Fillet Welds, 2016:7.
EMILE GLORIEUX Multi-Robot Motion Planning Optimisation for Handling Sheet Metal Parts, 2017:10.
EBRAHIM HARATI Improving fatigue properties of welded high strength steels, 2017:11.
ANDREAS SEGERSTARK Laser Metal Deposition using Alloy 718 Powder Influence of Process Parameters on Material Characteristics, 2017:12.
ANA ESTHER BONILLA HERNÁNDES On Cutting Tool Resource Management, 2018:16.

SATYAPAL MAHADE Functional Performance of Gadolinium Zirconate/YSZ Multi-layered Thermal Barrier Coatings, 2018:18.
ASHISH GANVIR Design of suspension plasma sprayed thermal barrier coatings, 2018:20.
AMIR PARSIAN Regenerative Chatter Vibrations in Indexable Drills: Modeling and Simulation, 2018:21.
ESMAEIL SADEGHIMERESHT High Temperature Corrosion of Ni-based Coatings, 2018:23.
VAHID HOSSEINI Super Duplex Stainless Steels. Microstructure and Properties of Physically Simulated Base and Weld Metal, 2018:24.
MORGAN NILSEN Monitoring and control of laser beam butt joint welding, 2019:27.
ARBAB REHAN Effect of heat treatment on microstructure and mechanical properties of a 5 wt.% Cr cold work tool steel, 2019:28. [Kommande]
KARL FAHLSTRÖM Laser welding of ultra-high strength steel and a cast magnesium alloy for light-weight design, 2019:29. [Kommande]

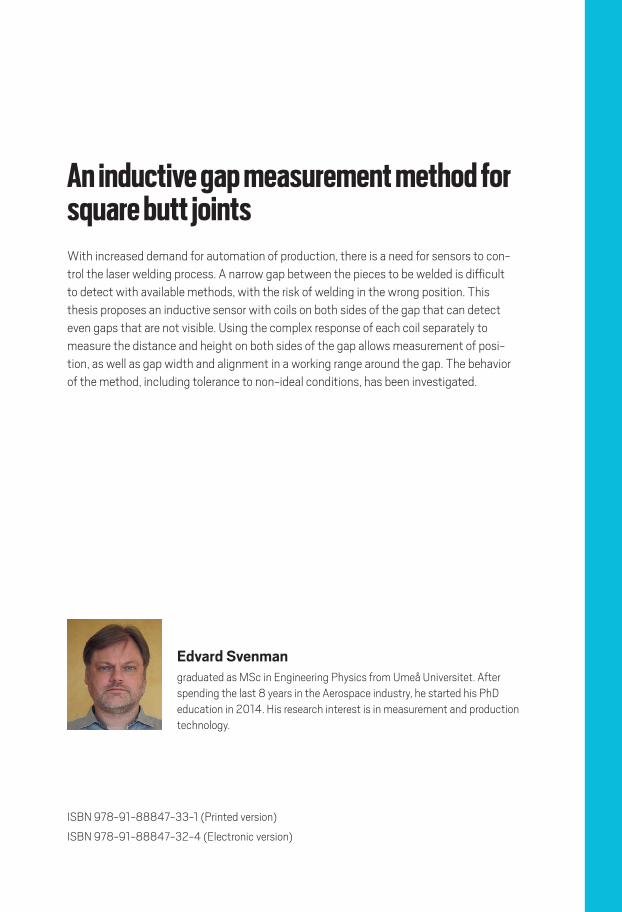
An inductive gap measurement method for square butt jointsWith increased demand for automation of production, there is a need for sensors to con-trol the laser welding process. A narrow gap between the pieces to be welded is difficult to detect with available methods, with the risk of welding in the wrong position. This thesis proposes an inductive sensor with coils on both sides of the gap that can detect even gaps that are not visible. Using the complex response of each coil separately to measure the distance and height on both sides of the gap allows measurement of posi-tion, as well as gap width and alignment in a working range around the gap. The behavior of the method, including tolerance to non-ideal conditions, has been investigated.
Edvard Svenman graduated as MSc in Engineering Physics from Umeå Universitet. After spending the last 8 years in the Aerospace industry, he started his PhD education in 2014. His research interest is in measurement and production technology.
PhD ThesisProduction Technology2019 No. 30
An inductive gap measurement method for square butt joints
Edvard Svenman
AN IN
DUCTIVE G
AP MEASU
REMEN
T METH
OD FO
R SQUARE BU
TT JOIN
TSEDVARD SVENM
AN2019 NO.30ISBN 978-91-88847-33-1 (Printed version)
ISBN 978-91-88847-32-4 (Electronic version)
117773_HV_Edvard_Svenman_omslag.indd 1 2019-04-17 09:16:23