An Indoor Positioning and Prewarning System Based on ...
12
Research Article An Indoor Positioning and Prewarning System Based on Wireless Sensor Network Routing Algorithm Yanghua Gao , Weidong Lou , and Hailiang Lu Information Center, China Tobacco Zhejiang Industrial Co., Ltd., Hangzhou 310008, China Correspondence should be addressed to Yanghua Gao; [email protected] Received 1 September 2021; Revised 27 September 2021; Accepted 12 October 2021; Published 5 November 2021 Academic Editor: Gengxin Sun Copyright © 2021 Yanghua Gao et al. This is an open access article distributed under the Creative Commons Attribution License, which permits unrestricted use, distribution, and reproduction in any medium, provided the original work is properly cited. One of the most important means to position abnormal devices is to efficiently utilize the resources of wireless sensor network (WSN) and make proper analysis of the relevant data. Therefore, this paper constructs an indoor positioning and prewarning system that utilizes energy efficiently and achieves a long lifecycle. Firstly, the adjacent round iteration load balancing (ARILB) routing algorithm was proposed, which elects the cluster heads (CHs) by the adjacent round strategy. In this way, the random components were eliminated in CH election. Next, a short-distance multifrequency routing strategy was constructed between CHs to transmit the information to the sink, and a positioning algorithm was designed called ARILB-received signal strength (RSS). The ARILB-RSS positioning algorithm traverses the triangles formed by anchor nodes, forming multiple sets of ranging points; then, the optimal anchor node is recorded, and the path loss factor is iterated to reduce the positioning error. Simulation shows that the network survives 54.5% longer using ARILB than using the distributed energy-efficient clustering (DEEC) algorithm; the packet delivery rate using ARILB was about 139% higher than that of low energy adaptive clustering hierarchy (LEACH) algorithm and 35% higher than that of uneven clustering routing algorithm based on chain-cluster type (URCC) algorithm; ARILB-RSS reduced the ranging error by 14.31% and then the positioning error by 26.79%. 1. Introduction Since its entry to the World Trade Organization (WTO) in 2001, China has maintained a rapid growth of economy for a long time, with its gross domestic product (GDP) growing at the rate of about 1,000% [1]. Meanwhile, there has been a significant increase in the fiscal revenue and eco- nomic capacity of the Chinese government and the hard power of the country. Against this backdrop, the Chinese people pursue long-term and better living standards [2]. Infrastructure, as an important carrier of living standards, has attracted more and more attention and policy support from the government [3]. In recent years, China has stepped up the construction of infrastructure, and completed numer- ous stations, stadiums, and shopping malls. Airports and residential communities are among these dense and complex buildings. The new airports are usually built together with transport facilities like high-speed rail and subway such as Hartsfield-Jackson Atlanta International Airport (Atlanta, USA), Heathrow Airport (London, UK), Frankfurt Interna- tional Airport (Frankfurt, Germany), Narita International Airport (Narita, Japan), and Shanghai Pudong International Airport (Shanghai, China), making the building structure even more complicated. With the advancement of urbaniza- tion in China, newly built residential quarters in cities gener- ally have a high floor area ratio. While improving people’s living standards, the above infrastructure adds difficulty to building maintenance and risk prewarning. The monitoring and positioning of person- nel and equipment in buildings are essential to building maintenance and risk prewarning. For example, the building infrastructure in Europe is becoming older. Steel structures in industrial facilities and plant constructions are also affected by this ageing process. America needs to spend more than a quarter of a trillion dollars to bring its PreK- 12 public school buildings up to working order, because these buildings lack building maintenance and risk prewarn- ing. The health of building maintenance can be measured by Hindawi Journal of Sensors Volume 2021, Article ID 7213595, 12 pages https://doi.org/10.1155/2021/7213595
Transcript of An Indoor Positioning and Prewarning System Based on ...

Research ArticleAn Indoor Positioning and Prewarning System Based on WirelessSensor Network Routing Algorithm
Yanghua Gao , Weidong Lou , and Hailiang Lu
Information Center, China Tobacco Zhejiang Industrial Co., Ltd., Hangzhou 310008, China
Correspondence should be addressed to Yanghua Gao; [email protected]
Received 1 September 2021; Revised 27 September 2021; Accepted 12 October 2021; Published 5 November 2021
Academic Editor: Gengxin Sun
Copyright © 2021 Yanghua Gao et al. This is an open access article distributed under the Creative Commons Attribution License,which permits unrestricted use, distribution, and reproduction in any medium, provided the original work is properly cited.
One of the most important means to position abnormal devices is to efficiently utilize the resources of wireless sensornetwork (WSN) and make proper analysis of the relevant data. Therefore, this paper constructs an indoor positioning andprewarning system that utilizes energy efficiently and achieves a long lifecycle. Firstly, the adjacent round iteration loadbalancing (ARILB) routing algorithm was proposed, which elects the cluster heads (CHs) by the adjacent round strategy.In this way, the random components were eliminated in CH election. Next, a short-distance multifrequency routingstrategy was constructed between CHs to transmit the information to the sink, and a positioning algorithm was designedcalled ARILB-received signal strength (RSS). The ARILB-RSS positioning algorithm traverses the triangles formed byanchor nodes, forming multiple sets of ranging points; then, the optimal anchor node is recorded, and the path loss factoris iterated to reduce the positioning error. Simulation shows that the network survives 54.5% longer using ARILB thanusing the distributed energy-efficient clustering (DEEC) algorithm; the packet delivery rate using ARILB was about 139%higher than that of low energy adaptive clustering hierarchy (LEACH) algorithm and 35% higher than that of unevenclustering routing algorithm based on chain-cluster type (URCC) algorithm; ARILB-RSS reduced the ranging error by14.31% and then the positioning error by 26.79%.
1. Introduction
Since its entry to the World Trade Organization (WTO) in2001, China has maintained a rapid growth of economyfor a long time, with its gross domestic product (GDP)growing at the rate of about 1,000% [1]. Meanwhile, therehas been a significant increase in the fiscal revenue and eco-nomic capacity of the Chinese government and the hardpower of the country. Against this backdrop, the Chinesepeople pursue long-term and better living standards [2].Infrastructure, as an important carrier of living standards,has attracted more and more attention and policy supportfrom the government [3]. In recent years, China has steppedup the construction of infrastructure, and completed numer-ous stations, stadiums, and shopping malls. Airports andresidential communities are among these dense and complexbuildings. The new airports are usually built together withtransport facilities like high-speed rail and subway such asHartsfield-Jackson Atlanta International Airport (Atlanta,
USA), Heathrow Airport (London, UK), Frankfurt Interna-tional Airport (Frankfurt, Germany), Narita InternationalAirport (Narita, Japan), and Shanghai Pudong InternationalAirport (Shanghai, China), making the building structureeven more complicated. With the advancement of urbaniza-tion in China, newly built residential quarters in cities gener-ally have a high floor area ratio.
While improving people’s living standards, the aboveinfrastructure adds difficulty to building maintenance andrisk prewarning. The monitoring and positioning of person-nel and equipment in buildings are essential to buildingmaintenance and risk prewarning. For example, the buildinginfrastructure in Europe is becoming older. Steel structuresin industrial facilities and plant constructions are alsoaffected by this ageing process. America needs to spendmore than a quarter of a trillion dollars to bring its PreK-12 public school buildings up to working order, becausethese buildings lack building maintenance and risk prewarn-ing. The health of building maintenance can be measured by
HindawiJournal of SensorsVolume 2021, Article ID 7213595, 12 pageshttps://doi.org/10.1155/2021/7213595

flow of people and the operation status of equipment. Thesemetrics require continuous attention from the governmentand enterprises [4]. Nevertheless, it is extremely difficult toinstall, access, or manually maintain equipment in denseand complex buildings. This pushes up the operation andmaintenance costs of buildings and reduces economic bene-fits. Meanwhile, the demand for effective monitoring andpositioning of people in buildings has skyrocketed, owingto the rapid growth in the number of buildings [5]. There-fore, it is significant to realize reliable monitoring and posi-tioning of indoor personnel and equipment.
The monitoring of people and equipment in buildingsmust be objective and consider various random factors.Objectivity is important because different equipment hasdifferent properties [6], which leads to the variation in sen-sor type and location. In order to ensure the improved typeof the monitoring system, the development needs of theimproved space and related instruments should be reservedwhen designing the system. The most significant randomfactor is people flow. The preset monitoring lines mustaccount for the errors induced by the unpredictable peopleflow in the buildings. Hence, it is an inevitable trend in thedevelopment of indoor monitoring and positioning toimprove the adaptability of the monitoring system.
Data is an inaccessible part of the various scientific andtechnological methods for digital indoor monitoring. As akey infrastructure for data acquisition, wireless sensor net-work (WSN) has been increasingly applied to various datacollection tasks. WSN technology brings the data monitor-ing system multiple advantages, such as real-time uninter-rupted monitoring, strong dynamic performance, and easyinstallation of facilities. WSN can effectively acquire dataabout the changes in equipment indices and personnel den-sity in the monitoring range, eliminating the need for large-scale modifications to the original power supply lines.Although the WSN system is still in the test phase, thereare some shortcomings, but it is still related to improve-ments and applied in actual operations. Therefore, our sim-ulation only considers the data preprocessed by sensor chip.Then, it is a crucial issue to send these data to the datacenter.
WSNs can be an integral part of military command, con-trol, communications, computing, intelligence, surveillance,reconnaissance, and targeting systems. The autonomouscoordination capabilities of WSNs are utilized in the realiza-tion of a wide variety of environmental applications. Forexample, the developments in implanted biomedical devicesand smart integrated sensors make the usage of sensor net-works for biomedical applications possible. Smart sensornodes and actuators can be buried in appliances such as vac-uum cleaners, microwave ovens, refrigerators, and DVDplayers as well as water monitoring system. Routing algo-rithm [7–10], as an important means of data transmissionin WSN, has received extensive attention from scholars.Recent years have witnessed a marked progress in routingclustering algorithms at home and abroad. Some of the latestrouting algorithms are reviewed below:
Unequal cluster-based routing protocol (UCRP) is arouting algorithm to improve network throughput, packet
delivery ratio, and energy of cognitive radio ad hoc net-works. The UCRP realizes these goals by processing multi-layer rings and normal nodes with different initial energies.Based on the optimal cluster radius, the UCRP was provedto outperform existing models through experiments [11].Proactive source routing (PSR) protocol [12] is a lightweightrouting algorithm that offers and provides new distance vec-tor (DV) routing, link state (LS), and source routing method.Simulations have shown that PSR yields similar or betterdata transmission performance than other protocols.
The distributed probabilistic routing protocol (ProHet)abstracts a bidirectional route by finding a reverse path forevery asymmetric link and using a probabilistic strategy tochoose forwarding nodes, based on historical local informa-tion for WSN. ProHet realizes better efficiency, delivery rate,message cost, and coverage ratio than classic routing algo-rithms, such as prolong stable election routing (P-SEP) andunequal cluster-based routing protocol (UPRR) [13]. In2013, Jin et al. proposed a practical passive cluster-basednode-disjoint many-to-one multipath routing protocol, withthe aim to enhance energy efficiency and maximize networklifecycle. This protocol searches for the optimal path throughactive clustering. The typical feature of the protocol is anode-disjoint many-to-one multipath routing discovery algo-rithm and the cost minimization on the multiple paths [14].
Centralized energy-efficient clustering routing protocol(CEECR) [15] provides a centralized cluster formation algo-rithm, detached nodes, and a mobile strategy. Compared toother routing protocols, CEECR reduces average energy dis-sipation and improves the packet delivery ratio. Aided effi-cient data gathering (AEDG) [16] is a novel approach tolimit the number of associated nodes with the gatewaynodes, with the aim to minimize network energy consump-tion and prevent gateway overloading. Through thisapproach, it is possible to obtain the suboptimal ellipticaltrajectory between nodes and ensure the duration, stability,and throughput of the network. Saleem et al. proposed anovel biological inspired self-organized secure autonomousrouting protocol (BIOSARP) based on autonomous routingmechanism. The core of the protocol is to optimize thedelay-reducing forwarding decision with the improved antcolony optimization (IACO). BIOSARP offers better resultsthan many other protocols in WSN-based environmentalmonitoring [17].
To reduce the number of routes in conventional routingalgorithms, Weng and Lai noted that the triangle routingalgorithm saves much energy to transmit data between thetransmitter and the receiver, by selecting sensors with a sim-ple triangle rule. Therefore, they designed an enhanced rela-tive identification and direction-based sensor routing(ERIDSR) algorithm, which effectively lowers the totalenergy in near-sensor nodes [18]. Ogundile et al. [19] putforward a clustered WSN that requires a sturdy energy-balanced (EB) and energy-efficient (EE) communicationprotocol. With the aid of the priority table, the protocol isformed by prioritizing the two shortest paths to the clusterhead (CH) or sink, following some simple yet efficient rules.The purpose is to extend the lifecycle of WSN through bal-ancing energy consumption.
2 Journal of Sensors

The routing protocol of the WSN should prolong thelifecycle of the network and excel in data collection. The col-lected data should be analyzed by the server to judgewhether the monitored area is abnormal. If the area isabnormal, it is necessary to locate the abnormality and makeinspection and repair in a timely manner. So far, manyscholars have explored WSN positioning algorithms.Depending on the necessity of node distance, the existingWSN positioning algorithms can be divided into two catego-ries [20]: range-based algorithms and range-free algorithms.The typical range-based algorithms are time of arrival(TOA) algorithm [21], time difference of arrival (TODA)algorithm [22], angle of arrival (AOA) algorithm [23], andreceived signal strength indicator (RSSI) algorithm [24].The range-free algorithms include approximate point-in-triangulation (PIT) test (APIT) [25], distance vector hop(DV-Hop) [26], and centroid algorithm [27]. Among them,the RSSI algorithm is low cost and easy to implement,because most wireless communication modules supportRSSI ranging.
The above review shows that clustering and data trans-mission are the research focus of WSN communication.Therefore, this paper proposes the adjacent round iterationload balancing (ARILB) routing algorithm. Once the net-work is initialized, the number of CHs is optimized basedon adjacent rounds to extend the network lifecycle. Then,the ARILB-received signal strength (RSS) algorithm wasdesigned to enhance positioning accuracy. In the positioningphase, the ARILB-RSS algorithm determines the multilateralcentroid more accurately. Finally, MATLAB simulationswere conducted to demonstrate the performance of the pro-posed ARILB-RSS algorithm, compared with the ARILBalgorithm.
2. Indoor Wireless Monitoring andPositioning System
2.1. Technical Roadmap. Figure 1 shows the technical road-map of our indoor wireless monitoring and positioning sys-tem. There are two parts in the system: a routing algorithmand a positioning algorithm. The routing algorithm is thebasis for running the positioning algorithm. The routingalgorithm is the basis for running the positioning algorithm.First, the routing algorithm obtains various monitoring databased on WSN and sends the data to the server. Then, theserver performs data analysis and discovers the anomalies.Finally, the location algorithm calculates the location of theanomalies.
(1) Routing algorithm
The routing algorithm collects data through sensors reg-ularly arranged in the monitoring area and stores them insensor memories. Then, the data are transmitted to the datacenter by the proposed ARILB algorithm, which is innova-tive in specificity analysis, CH election, and data transmis-sion. Specifically, the sensor nodes are deployed evenly;adjacent rounds are introduced to the threshold equation
to optimize the number of CHs; the optimal relay link isadopted to transmit the acquired data to the base station.
(2) Positioning algorithm (ARILB-RSS)
Firstly, the data obtained by ARILB algorithm are ana-lyzed to find anomalies. Then, the abnormal equipmentand people are located by ARILB-RSS in three phases: rang-ing, positioning, and correction. The ranging is realized witha classic ranging model. The positioning and correction arecompleted by ARILB-RSS, which is extended from theARILB. The positioning is implemented in the followingprocedure: the triangles formed by anchor nodes are tra-versed to form multiple sets of range points. Then, the opti-mal anchor node is recorded by comparing the slope of eachanchor node with that of the equilateral triangle. After that,the correction is made by periodically measuring the RSSIbetween anchor nodes near the unknown node. Then, thepath loss factor of the next iteration is estimated based onmultiple measured values, thereby minimizing the position-ing error.
2.2. Specificity Analysis. With the expansion of applicationfields, WSN is facing more and more challenges. Unlikeother monitoring systems, the indoor monitoring systemdoes not need to focus on signal fluctuations in conventionaldeployment environments. For example, sensor nodes aresometimes arranged in liquid like water, which obstructsthe signal transmission to a certain extent. Because of theuniform density of the liquid, the signal obstruction effectis uniform across the liquid. However, the signal might fluc-tuate due to crowd movement in buildings, as well as otherrandom factors in indoor equipment and personnel moni-toring. Therefore, wireless sensors need to be installed tosuppress data fluctuations.
The indoor environment is different from the environ-ment of classic routing algorithms. In indoor monitoring,the randomness brought by crowd movement is the key con-straint on data transmission. There are many drawbacks oftraditional data transmission methods in indoor monitoring.The WSN can transmit data in multihop mode or single-hopmode. In a single-hop transmission network, energy con-sumption is mainly affected by distance, the signal is dis-persed, and the monitoring threshold is extremely low. Asa result, single-hop transmission should be avoided inindoor monitoring.
In a multihop transmission network, the death of anyCH has an immense impact, which can be mitigated byincreasing the density and energy of CHs. However, increas-ing CH density will delay information transmission, whileincreasing CH energy will increase economic cost. There-fore, both single- and multihop transmission modes shouldbe improved before being used for indoor monitoring andpositioning.
3. Assumptions and Modeling
3.1. Assumptions. It is assumed that the monitoring area is aregular rectangle, all sensors are arranged randomly in this
3Journal of Sensors

area, and all sensors can cover the area effectively withoutsudden failure. The sensors installed by the ARILB algo-rithm have the following features:
(1) Every sensor installed in the network has a uniqueidentification (ID) tag. Once a sensor fails, its ID willno longer be used
(2) The position of each sensor does not change afterinstallation
(3) The sink has certain perception capabilities
(4) When the system is running (the main switch is notturned off), the energy of the sensors cannot besupplemented
(5) The sensors communicate via a symmetric two-waychannel, which will never be blocked
Based on the above assumptions, N sensors are ran-domly arranged in an L × L rectangular area and transmitthe acquired data back to the sink. Since the equipmentand people flow are fixed, the sink (data center) should beinstalled in the geometric center to ensure the symmetry ofdata collection. Once the wireless monitoring system entersinto operation, the network nodes will aggregate aroundCHs into clusters, and the data collected by the nodes inthe same cluster will be sent collectively to the sink. Then,a clustering method should be adopted to mitigate theimpact from the constantly changing network structure.
3.2. Energy Consumption Model. WSN mainly consumesenergy in data sending and reception (Figure 2). By the
transmission distance of nodes, the data sending energycan be described by two models. The energy consumed bya sensor to send each M-bit of data can be calculated by
ER Mð Þ =MEelec,
ET M, dð Þ =MEelec + MEmdτ,
ð1Þ
where MEelec is the energy consumed to support equipmentoperation; MEfsd
2 is the energy consumed by the radio fre-quency power amplifier, which accounts for a large portionof the energy consumption of the sensor node, within a com-munication distance (if the energy consumption surpassesMEfsd
2, it will nosedive to MEampd4); Em is dependent on
the transmission distance; τ = 2 if d < dth (dth is the thresh-old of the transmission distance), and τ = 4 if d > dth.
3.3. Protocol Matching by Classical Algorithm. Low energyadaptive clustering hierarchy (LEACH) algorithm [28] isthe most classic routing algorithm, which effectively reducesenergy consumption through clustering. However, its clus-tering rules have many defects in the matching of wirelessrouting protocols.
(1) CH election
LEACH generates CHs randomly by formula (2). In theinitial state, each sensor node produces a number randomlyin [0, 1] and uses this random number to influence CH elec-tion. Specifically, the random number is compared againstthe threshold TðnÞ. If the random number is smaller than
Monitoring data
Link
Network control
Data analysis
Sensors
Clusters
Softwaresimulation
Sink
CH election
Routing
Ranging phase
Positioningphase
Modificationphase
Routing algorithm
Positioning algorithm
Figure 1: Technical roadmap.
4 Journal of Sensors

TðnÞ, the node becomes the CH in this round.
T nð Þ = p1 − p r mod 1/pð Þð Þ , ð2Þ
where p is the percentage of the expected number of CHsamong all nodes; r is the number of election rounds; and rmod ð1/pÞ is the number of nodes elected as CHs before thisround. The nodes not elected as CH in this round are allo-cated to a set G.
Formula (2) ensures that every network node could beelected as CH and balances the energy consumption of allCHs. However, if this scheme is applied to a short-distancemultifrequency scenario, the network nodes might clusterunevenly. To make matters worse, the heterogeneity ofequipment properties determines that sensors differ greatlyin adjustment. In other words, there is a huge difference inthe data output in different areas. Therefore, formula (2)cannot be adopted for clustering alone.
(2) Data transmission
In LEACH, after a CH receives the requests from allnon-CH nodes, it will create a scheduling table based onthe number of sensors in its cluster and establish a schedul-ing sequence. Then, the CH sends the data directly to thesink. Nevertheless, in our monitoring scenario, some sensorsmight fail suddenly due to sudden changes in the monitor-ing area. Besides, the local data transmission is not smoothin the monitoring system. Therefore, it is necessary toenhance the degree of redundancy by improving the datatransmission rules.
4. ARILB Routing Algorithm
In ARILB algorithm, CH election is usually implemented inthe following stages. Before the algorithm starts, all sensorsare fully charged, and the current state is by default the ini-
tial energy state of each sensor:
S ið Þ =RP φ
dP EC
!, ð3Þ
where i is the unique ID of the sensor, RP ∈ 0, 1 is the ratio ofthe current round number to the total time, φ is an indicatorof CH status (if φ = 0, the sensor is not a CH; if φ = 1, thesensor is a CH), EC is the percentage of the remaining energyof the current node, and dP is the relative distance betweenthe node and the base station (%). Therefore, the initial stateof sensor i can be denoted as SðiÞINIT.
In WSN, the health of sensors can be largely measuredby energy. Let ln ðjSðiÞj/jSðiÞINITjÞ be the health of a sensorat a certain moment, i.e., the energy factor. Obviously, theenergy factor decreases continuously with the progressionof data collection. The value of this factor falls in −∞, 1. Ifln ðjSðiÞj/jSðiÞINITjÞ = 1, the sensor is in the healthiest state.If ln ðjSðiÞj/jSðiÞINITjÞ keeps dropping, the energy loss ofthe sensor is on the rise.
4.1. Structure of Monitoring Area. As suggested by signalcharacteristics [29] and Section 2.2, the monitoring areamust be preprocessed to improve the monitoring effect.Considering the cost of sensors, the best preprocessing strat-egy is to optimize the spatial distribution rules. Therefore,this paper derives a suitable space model in the followingprocess.
As mentioned before, the study area is an L × L square,with the sink at the geometric center. According to theequipment locations and mean speed of people flow [30],the interval of the sensors deployed in the network is smallerthan the threshold mentioned in Section 2.2. The monitor-ing area could be divided into q square subareas with a sidelength shorter than dth.The side length is related to varioustransmission paths and monitoring thresholds: li = fl1, l2,⋯,lqg. In addition, a circular area with a radius of dth isplanned near the sink and monitored directly by the basestation (Figure 3). The purpose of this circular area is to
Distance: d
M bit
ET
ER
Transmissiondevice
Poweramplifier
Receiving device
M bit
M bit
Figure 2: Energy consumption model.
5Journal of Sensors

prevent energy holes [31] and reduce path loss. Energy holeis a phenomenon in the traditional multihop mechanism:the nodes close to the sink are overloaded by data transmis-sion tasks and thereby die prematurely. If the nodes close tothe sink reduce or cancel the data transmission tasks, theenergy consumed by them will be mostly utilized to transfertheir own data. If d < dth, the energy consumption will begreatly reduced.
4.2. CH Generation. CHs are constantly updated in the rout-ing algorithm. In the beginning, the sink sends an initial sig-nal to the entire monitoring area in a radiant manner. Then,each sensor starts to prepare for CH election. The proposedARILB algorithm combines the classic routing algorithmwith application scenarios into a CH generation schemesuitable for wireless monitoring of indoor equipment andpersonnel. The specific process is as follows:
Firstly, the sink broadcasts a “Hello” to the entire net-work. Upon receiving this information, each sensor waitsto enter the working state. When all sensors are activated,the ARILB algorithm enters the CH generation phase. Whena CH is elected, every network sensor will spontaneouslygenerate a random number, rand, in the interval of (0, 1)and compare this number with a threshold function to final-ize the CH election.
Specifically, the rand is contrasted with the new thresh-old function Tnew for the following reasons: environmentalfactors (temperature, humidity, and wind speed) on thespeed of crowd movement exert a combined effect on equip-ment monitoring, making it hard to balance the operation ofthe routing algorithm. In other words, the sensors are trig-gered at nonperiodic frequency.
ARILB has different requirements for CHs in differentadjacent rounds. Therefore, this paper proposes a newthreshold function Tnew based on adjacent rounds. Thefunction uses the energy factor defined above and introduces
the iteration parameter AdðkÞ:
Tnew = T nð Þ × 1 + Ad kð Þð Þ, ð4Þ
where AdðkÞ can be calculated by
Ad kð Þ =RP × ln
S ið Þj jS ið ÞINIT�� �� r = 2k + 1,
−RP × lnS ið Þj j
S ið ÞINIT�� �� r = 2k k > 0ð Þ,
8>>><>>>:
ð5Þ
where RP ∈ ð0, 1� is the ratio of the current number of roundsto the total time. Formula (5) shows that clusters of differentsizes can better match the frequency of a sensor triggered byrandom factors and make the CH election and cluster mem-bers more reasonable.
4.3. Routing Strategy. Energy consumption is the most press-ing problem in the data transmission. As mentioned before,network data can be transmitted in single-hop mode or mul-tihop mode. Under single-hop mode, each CH directly sendsthe collected data to the base station. Despite being simple toimplement, single-hop mode has obvious shortcomings.Since the CH directly communicates with the sink, distancehas a great impact on energy consumption. Differentamounts of energy are consumed to transmit the same dataover different distances. In the monitoring area, the sensorsnear the boundaries need to consume the greatest amountof energy. The excessive energy consumption of boundarysensors can be effectively prevented by the multihop mode.However, the multihop mode can hardly realize the continu-ity of data relay, which should not be interrupted. Whenmultiple areas need to be monitored simultaneously, themultihop transmission links must meet higher requirements.
Through the above analysis, this section proposes ashort-distance multifrequency routing scheme. It is assumedthat, under multihop mode, each CH for data relay only for-wards the information from the previous CH, without per-forming other relay tasks. Then, the problem of datatransmission from boundary sensors to the sink can be con-verted into the selection of relay links.
To choose the right link, the CH Cnðn <mÞ in the CH setC = fC1, C2 ⋯ , Cmg needs to find the next-level relay CHsCn+1, Cn+2,⋯, Cm. During data transmission, at least onerelay CH needs to be found. Then, the total transmissiondistance of data in the link can be shown as
∀ECi≤ 〠
m
j=i+1ECj
,
∃dsum = 〠i+h
j=id2 Cj, Cj+1� �
,
8>>>>><>>>>>:
ð6Þ
where ECiis the energy of CH; dsum is the total transmission
distance; d2½Cj, Cj+1� is the transmission distance of a relayinterval; and h is the number of relays.
ę ę
ęę
d0
Sink
li < d0
li
li
L
L
Figure 3: Schematic diagram of monitoring area.
6 Journal of Sensors

To transmit data, ARILB uses a partition-based multi-hop mode (Figure 4). Each CH can only transmit informa-tion once in a round. After receiving a piece ofinformation, a CH will no longer receive any other informa-tion. At this time, the CH needs to forward the informationto another CH that has not received the information in thesubarea. If all CHs in the subarea have received the informa-tion, the CH will jump to another subarea, looking for a suit-able CH. If the energy of the current CH is below the meanenergy of the candidate CHs for next-level relay, the currentCH will choose the closest CH as the next-level relay. Thisprocess will be repeated in turn, until the remaining energyof the current CH is greater than the mean energy of theremaining candidate CHs. In the latter case, the CH willdirectly send the data to the sink.
4.4. Positioning Algorithm. The distance-based positioningalgorithms position nodes by the principle of space geome-try, using the bases of distance and angle. Among them,the RSSI algorithm is simple, energy-efficient, and power-efficient, providing a suitable tool for the design of a low-power WSN. That is why this section presents the ARILB-RSS positioning algorithm. There are three stages of theRSSI-based positioning [32]: ranging, positioning, andcorrection.
4.4.1. Phase 1: Ranging. The distance between each anchornode and the unknown node is calculated based on theintensity of the transmitted signal to the unknown node.The most popular RSSI model can be expressed as
PL dð Þ = A − 10n lg ddt
� �+ X, ð7Þ
where d is the distance of the source; dt = 1m is the referencedistance; n is the path loss factor; and A is the signal strengthat dt = 1m. X represents the zero mean Gaussian variable.Then, a target can be positioned based on the location andsignal strengths between two points. Formula (7) shows thatthe signal attenuates very quickly over a short distance.Therefore, the positioning error using RSSI signal attenua-tion is small in a short distance. This meets the short-range multifrequency requirements of the routing strategyin Section 4.3.
4.4.2. Phase 2: Positioning. The unknown node calculates thedistance from an anchor node and locates its position. Thegreater the RSSI received by the unknown node, the smallerthe signal attenuation, and the shorter the distance betweenthe known node and the anchor node. Therefore, a highRSSI received by the unknown node means the environmentand obstacles have a limited impact on positioning. It is pos-sible to locate any object based on the positions of 3 sensornodes, which are not in a straight line. Therefore, this paperproposes an improved positioning method (Figure 5).
In WSN, each anchor node sends RSSI signals to anyunknown node. Then, the unknown node sorts the RSSI sig-nals in a descending order by signal strength: PL + : PL −1, PL − 2,⋯, PL −N , with N being the number of received
RSSI signals, i.e., the number of anchor nodes within thecommunication range. Since the corresponding anchor nodeposition is known, the unknown node selects the three larg-est values: RSSI 1-3, namely, (x1, y1), (x2, y2), and (x3, y3).Then, the slope of the straight line connecting any twoanchor nodes can be calculated by
f12 =y2 − y1x2 − x1
,
f23 =y3 − y2x3 − x2
:
ð8Þ
We can define the value of the error g, when the actualerror is smaller than g; the ARILB-RSS considers that thethree anchor nodes are close to an equilateral triangle andtends to locate unknown nodes as the optimal anchor node.Otherwise, the three anchor nodes that meet the conditionsare selected, or the anchor nodes that meet the conditionsare deemed as unqualified.
g =f12 − f Ej j + f23 − f Ej j
2: ð9Þ
4.4.3. Phase 3: Correction. To reduce the positioning errorand improve positioning accuracy, the coordinates of theunknown node, which are estimated in the positioningphase, are optimized or corrected. Our algorithm is furtherimproved to reduce the path loss factor n for ranging. Presetn is usually impractical and leads to a large deviation. There-fore, the actual n value should be approximated continu-ously in the actual environment. Our improved algorithmtries to iteratively update n in the following procedure: theRSSI between anchor nodes near the unknown node is mea-sured periodically, and multiple measured values are used toderive the path loss factor of the next iteration, thereby min-imizing the positioning error.
For the nodes in subarea li in the monitoring area, thereare three possible scenarios near the subarea adjacent to li. Inthese three scenarios, there are 3, 5, and 8 square subareas,respectively (Figure 6).
Suppose there are multiple square subareas near theunknown node. Then, there should be at least y anchornodes near this node: y : y1, y2 ⋯⋯. The distance betweenanchor node yp and the other p − 1 nodes can be expressedas fdy1 , dy2 ,⋯dyp−1g. Then, the following can be derived from
formula (7):
PL dy1
� �= A − 10np−1 lg
dy1dt
� �+ X,
⋯⋯
PL dyp−1
� �= A − 10np−1 lg
dyp−1dt
!+ X:
8>>>>>><>>>>>>:
ð10Þ
Formula (9) can be simplified to obtain the np of the nextiteration. The ranging error can be reduced through the con-stant updates of n.
7Journal of Sensors

Y
N
N
NY
Y
End
Start
Whether node isCH?
Whether Ci isCm?
i = i+1
j = i+1
m
Ci → Ci+1
ECi
≤ 𝛴 ECj
?
Stop multi‑hop
Figure 4: Routing process.
The unknown node receives the signalstrength of all anchor nodes PL:
PL (1), PL (2),..., PL (N)
Ascending signal strengthPL+: PL-1, PL-2, …, PL-N
Traverse the anchor node and set theloop parameter K, K = 3i (i > 0)
K > N ?
K-1 values and known points are notrepeatedly taken out from PL+, and
every 3 points form a group of rangingpoints
The slopes f1 and f2 corresponding toany 2 points
Judgment error g Update f1, f2;i = i+1,
Calculate g and record the optimal anchor node
Stop
Y
Y
N
N
Figure 5: Positioning phase.
8 Journal of Sensors

5. Simulation and Result Analysis
5.1. Simulation Parameters. Our simulation was carried outon MATLAB. According to the proposed algorithm, 100nodes were set up, with the sink at the geometric center(50m, 50m) of the monitoring area. Table 1 lists the simu-lation parameters.
5.2. Performance Analysis. This section compares the perfor-mance of our method, ARILB, with three other algorithms,namely, LEACH [33], distributed energy-efficient clustering(DEEC) [34], and uneven clustering routing algorithm basedon chain-cluster type (URCC) [35], using metrics like stabil-ity time of the network, number of data packets received bythe sink, and the total energy consumption of the network.
(1) Stability time
Figure 7 compares the stability time of the four algo-rithms, which is the top consideration in the design of wire-less monitoring system. Only when the routing protocolsurvives long enough could the other performance indicesbe improved. In Figure 7, the stability time is demonstratedby the sensor failure rate in the same period. As shown inFigure 7, our algorithm boasts a rather long lifecycle. Inthe same period, our algorithm controlled the sensor failurerate below 20%, all the sensors in LEACH failed, and morethan 54.5% of the sensors were damaged in DEEC and
URCC. Therefore, our algorithm has an obvious advantageover LEACH, DEEC, and URCC in network lifecycle.
(2) Energy consumption
Energy is another key evaluation metric of WSN perfor-mance and an important consideration of protocol design.This paper quantifies the energy consumed by each protocolwith the total energy consumption of the network in thesame period. Figure 8 compares the energy consumption ofthe four algorithms. In the early stage (within 500 rounds),LEACH, DEEC, and URCC had similar slopes in theirenergy consumption curves. This means the three protocolshave similar energy consumption rates in the early stage. Incontrast, our algorithm had a smoother energy consumptioncurve in this stage, reflecting the good control of early energycost. In addition, the network using our algorithm lastedlonger than that using any other algorithm, under the pre-mise of the same energy consumption. As the network oper-ated, the network energy of LEACH, DEEC, and URCC wasexhausted in 1,384; 1,844; and 2,200 rounds, respectively,while that of our algorithm was not exhausted before 2,500rounds.
(3) Data packets
Apart from stability time and energy consumption, datatransmission capacity is a nonnegligible performance index
(a) (b)
(c)
Figure 6: Scenarios of adjacent subareas.
9Journal of Sensors
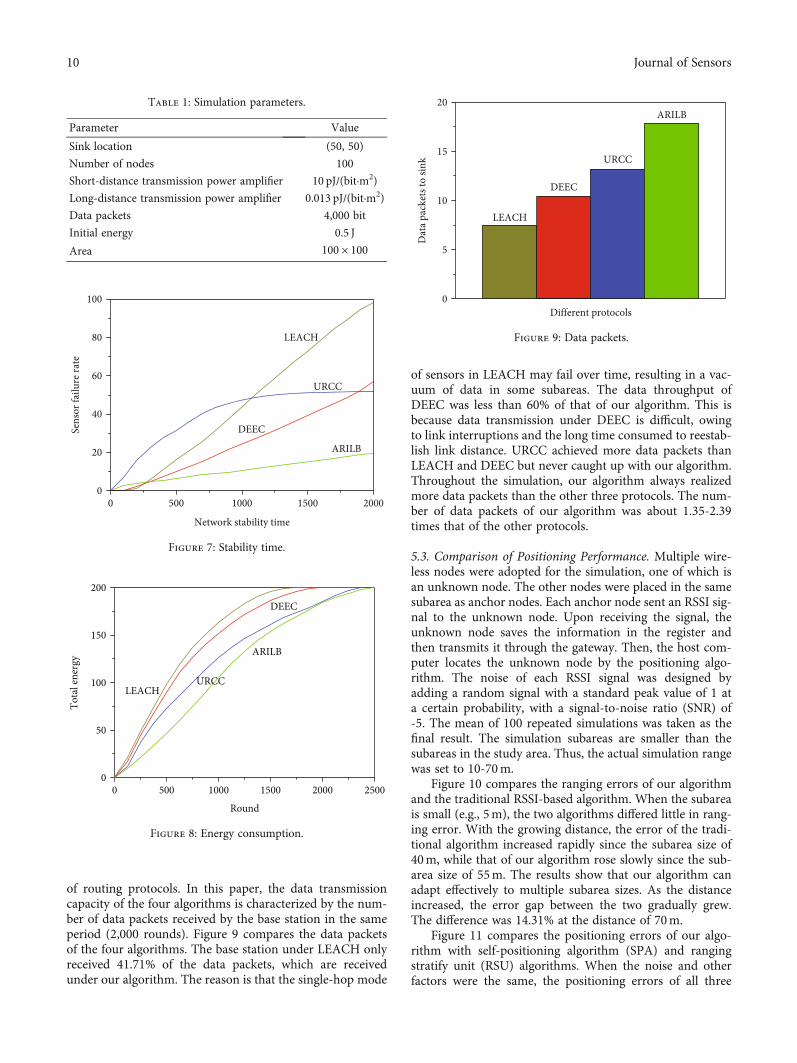
of routing protocols. In this paper, the data transmissioncapacity of the four algorithms is characterized by the num-ber of data packets received by the base station in the sameperiod (2,000 rounds). Figure 9 compares the data packetsof the four algorithms. The base station under LEACH onlyreceived 41.71% of the data packets, which are receivedunder our algorithm. The reason is that the single-hop mode
of sensors in LEACH may fail over time, resulting in a vac-uum of data in some subareas. The data throughput ofDEEC was less than 60% of that of our algorithm. This isbecause data transmission under DEEC is difficult, owingto link interruptions and the long time consumed to reestab-lish link distance. URCC achieved more data packets thanLEACH and DEEC but never caught up with our algorithm.Throughout the simulation, our algorithm always realizedmore data packets than the other three protocols. The num-ber of data packets of our algorithm was about 1.35-2.39times that of the other protocols.
5.3. Comparison of Positioning Performance. Multiple wire-less nodes were adopted for the simulation, one of which isan unknown node. The other nodes were placed in the samesubarea as anchor nodes. Each anchor node sent an RSSI sig-nal to the unknown node. Upon receiving the signal, theunknown node saves the information in the register andthen transmits it through the gateway. Then, the host com-puter locates the unknown node by the positioning algo-rithm. The noise of each RSSI signal was designed byadding a random signal with a standard peak value of 1 ata certain probability, with a signal-to-noise ratio (SNR) of-5. The mean of 100 repeated simulations was taken as thefinal result. The simulation subareas are smaller than thesubareas in the study area. Thus, the actual simulation rangewas set to 10-70m.
Figure 10 compares the ranging errors of our algorithmand the traditional RSSI-based algorithm. When the subareais small (e.g., 5m), the two algorithms differed little in rang-ing error. With the growing distance, the error of the tradi-tional algorithm increased rapidly since the subarea size of40m, while that of our algorithm rose slowly since the sub-area size of 55m. The results show that our algorithm canadapt effectively to multiple subarea sizes. As the distanceincreased, the error gap between the two gradually grew.The difference was 14.31% at the distance of 70m.
Figure 11 compares the positioning errors of our algo-rithm with self-positioning algorithm (SPA) and rangingstratify unit (RSU) algorithms. When the noise and otherfactors were the same, the positioning errors of all three
Table 1: Simulation parameters.
Parameter Value
Sink location (50, 50)
Number of nodes 100
Short-distance transmission power amplifier 10 pJ/(bit·m2)
Long-distance transmission power amplifier 0.013 pJ/(bit·m2)
Data packets 4,000 bit
Initial energy 0.5 J
Area 100 × 100
0 500 1000 1500 20000
20
40
60
80
100
ARILB
URCC
DEECSens
or fa
ilure
rate
Network stability time
LEACH
Figure 7: Stability time.
0 500 1000 1500 2000 25000
50
100
150
200
ARILB
URCC
DEEC
Tota
l ene
rgy
Round
LEACH
Figure 8: Energy consumption.
0
5
10
15
20ARILB
DEEC
URCC
Dat
a pac
kets
to si
nk
Different protocols
LEACH
Figure 9: Data packets.
10 Journal of Sensors

algorithms increased with the subarea size. However, theerror increment of our algorithm was the smallest. Withthe growing distance, the RSSI ranging error also increased.The positioning error of SPA rocketed up, because the algo-rithm cannot effectively eliminate the ranging error. Despiteimproving the positioning results, the RSU could not fullyremove the influence of low-probability yet significant inter-ferences during the processing of RSSI source data and thecalculation of the mean of each data center. As a result, thepositioning error of the RSU grew quickly with the increaseof distance. In our algorithm, the path loss factor n isupdated constantly with the growing number of anchornodes. The updating factor slows down the growth of posi-tioning error induced by the increase of subarea size. Withinthe distance of 40m, the error gap between our algorithmand SPA and RSU was 7.45% and 5.61%, respectively. Whenthe distance was 70m, the difference was 18.54% and26.79%, respectively. Therefore, our algorithm can get closeto the true position, because the ARILB protocol can derivethe accurate value of n, which reduces positioning error andimproves positioning accuracy.
6. Conclusions
Considering the extensive application of WSN in indoormonitoring, this paper analyzes the rules of equipmentinstallation and the features of human movement insidebuildings and demonstrates the possibility and necessity ofestablishing an indoor data monitoring system. Then, theperformance of the data monitoring network was simulated,and the protocol matching by a classic algorithm was dis-cussed on computer software. On this basis, this paper pro-poses a novel adjacent round iterative load balancing routingprotocol (ARILB). Simulation results show that the ARILBcan achieve a good applicability and balance the networkenergy consumption. In addition, the protocol can balancethe data throughput in each phase, delay the appearance ofdead nodes, maximize the lifecycle of the network, andimprove the overall energy efficiency. Furthermore, theARILB was coupled with the division of monitoring area topropose the ARILB-RSS positioning algorithm. This newalgorithm improves the positioning and correction perfor-mance, eliminates the ranging error, and controls the growthof positioning error. However, this research only discussesstatic WSN routing protocols for two-dimensional (2D)data. The future research will investigate the monitoringand positioning of mobile WSN nodes.
Data Availability
The data used to support the findings of this study are avail-able from the corresponding author upon request.
Conflicts of Interest
The authors declare that they have no conflicts of interest.
References
[1] M. Amiti, M. Dai, R. C. Feenstra, and J. Romalis, “How didChina's WTO entry affect U.S. prices?,” Journal of Interna-tional Economics, vol. 126, article 103339, 2020.
[2] X. Li, T. Li, H. Li, J. Qi, and L. Hu, “Research on the online con-sumption effect of China’s urbanization under populationaging background,” Sustainability, vol. 11, no. 16, article4349, 2019.
[3] J. Bai, J. Qu, T. N. Maraseni, J. Wu, L. Xu, and Y. Fan, “Spatialand temporal variations of embodied carbon emissions inChina’s infrastructure,” Sustainability, vol. 11, no. 3, p. 749,2019.
[4] W. Zhang, X. Wang, C. Shao, and X. Wu, “Optimal schedulingfor urban micro integrated energy system considering decen-tralised high-rise buildings heating supply,” IET Generation,Transmission & Distribution, vol. 13, no. 21, pp. 5005–5018,2019.
[5] K. Chen, M. Guo, S. Liu et al., “Fiber-optic photoacoustic sen-sor for remote monitoring of gas micro-leakage,” OpticsExpress, vol. 27, no. 4, pp. 4648–4659, 2019.
[6] L. J. Molofsky, J. A. Connor, C. J. Van De Ven et al., “A reviewof physical, chemical, and hydrogeologic characteristics ofstray gas migration: implications for investigation and remedi-ation,” Science of The Total Environment, vol. 779, article146234, 2021.
10 20 30 40 50 60 700
5
10
15
20
25
Traditional method
RSSI
rang
ing
erro
r (%
)
Monitoring sub‑area size (m)
ARILB‑RSS
Figure 10: Ranging error.
10 20 30 40 50 60 705
10
15
20
25
30
35
Monitoring sub‑area size (m)
ARILB‑RSS
SPA
Posit
ioni
ng er
ror (
%)
RSU
Figure 11: Positioning error.
11Journal of Sensors

[7] M. Saleem, G. A. Di Caro, and M. Farooq, “Swarm intelligencebased routing protocol for wireless sensor networks: surveyand future directions,” Information Sciences, vol. 181, no. 20,pp. 4597–4624, 2011.
[8] F. F. Wang and H. F. Hu, “An energy-efficient unequal cluster-ing routing algorithm for wireless sensor network,” Revue d'In-telligenceArtificielle, vol. 33, no. 3, pp. 249–254, 2019.
[9] F. F. Wang and H. F. Hu, “An improved energy-efficient clus-ter routing protocol for wireless sensor network,” Ingénieriedes Systèmesd’Information, vol. 24, no. 4, pp. 419–424, 2019.
[10] W. Wu, W. Liu, F. N. Zhang, and V. Dixit, “A new flexibleparking reservation scheme for the morning commute underlimited parking supplies,” Networks and Spatial Economics,vol. 21, no. 3, pp. 513–545, 2021.
[11] J. F. Jiang, G. J. Han, L. Liu, X. Jiang, and J. F. Huang, “Anunequal cluster-based routing protocol for wireless heteroge-neous sensor networks,” Journal of Internet Technology,vol. 16, no. 6, pp. 945–955, 2015.
[12] Z. Wang, Y. Chen, and C. Li, “PSR: a lightweight proactivesource routing protocol for mobile ad hoc networks,” IEEETransactions on Vehicular Technology, vol. 63, no. 2,pp. 859–868, 2014.
[13] X. Chen, Z. Dai, W. Li et al., “ProHet: a probabilistic routingprotocol with assured delivery rate in wireless heterogeneoussensor networks,” IEEE Transactions on Wireless Communica-tions, vol. 12, no. 4, pp. 1524–1531, 2013.
[14] R. C. Jin, T. Gao, J. Y. Song, J. Y. Zou, and L. D.Wang, “Passivecluster-based multipath routing protocol for wireless sensornetworks,” Wireless Networks, vol. 19, no. 8, pp. 1851–1866,2013.
[15] J. Zhang and R. Yan, “Centralized energy-efficient clusteringrouting protocol for mobile nodes in wireless sensor net-works,” IEEE Communications Letters, vol. 23, no. 7,pp. 1215–1218, 2019.
[16] N. Javaid, N. Ilyas, A. Ahmad et al., “An efficient data-gathering routing protocol for underwater wireless sensor net-works,” Sensors, vol. 15, no. 11, pp. 29149–29181, 2015.
[17] K. Saleem, N. Fisal, and J. Al-Muhtadi, “Empirical studies ofbio-inspired self-organized secure autonomous routing proto-col,” IEEE Sensors Journal, vol. 14, no. 7, pp. 2232–2239, 2014.
[18] C. E. Weng and T. W. Lai, “An energy-efficient routing algo-rithm based on relative identification and direction for wirelesssensor networks,” Wireless Personal Communications, vol. 69,no. 1, pp. 253–268, 2013.
[19] O. O. Ogundile, M. B. Balogun, O. E. Ijiga, and E. O. Falayi,“Energy‐balanced and energy-efficient clustering routing pro-tocol for wireless sensor networks,” IET Communications,vol. 13, no. 10, pp. 1449–1457, 2019.
[20] J. Ren, S. Y. Huan, W. Son, and J. Han, “A novel indoor posi-tioning algorithm for wireless sensor network based onreceived signal strength indicator filtering and improved Tay-lor series expansion,” Traitement du Signal, vol. 36, no. 1,pp. 103–108, 2019.
[21] N. H. Nguyen and K. Doğançay, “Optimal geometry analysisfor multistatic TOA localization,” IEEE Transactions on SignalProcessing, vol. 64, no. 16, pp. 4180–4193, 2016.
[22] M. R. Gholami, S. Gezici, and E. G. Strom, “TDOA based posi-tioning in the presence of unknown clock skew,” IEEE Trans-actions on Communications, vol. 61, no. 6, pp. 2522–2534,2013.
[23] A. Arafa, S. Dalmiya, R. Klukas, and J. F. Holzman, “Angle-of-arrival reception for optical wireless location technology,”Optics Express, vol. 23, no. 6, pp. 7755–7766, 2015.
[24] Y. G. Shi, T. Yang, S. Zhang, L. Liu, and Y. J. Cui, “A Wi-Fipositioning system for material transport in greenhouses,”Instrumentation MesureMétrologie, vol. 19, no. 1, pp. 65–72,2020.
[25] Z. G. Lin, L. Li, H. Q. Zhang, M. Li, and F. Q. Yao, “An APITalgorithm based on DV-HOP multi-hop,” Advanced MaterialsResearch, vol. 787, pp. 1038–1043, 2013.
[26] S. J. Xie, X. Wang, and H. Shang, “Security analysis on wirelesssensor network in the data center for energy internet ofthings,” International Journal of Safety and Security Engineer-ing, vol. 10, no. 3, pp. 397–402, 2020.
[27] C. Leroux and C. Dainty, “Estimation of centroid positionswith a matched-filter algorithm: relevance for aberrometry ofthe eye,” Optics Express, vol. 18, no. 2, pp. 1197–1206, 2010.
[28] H. Zhou and K. M. Yu, “A novel wireless sensor network dataaggregation algorithm based on self-organizing feature map-ping neutral network,” Ingenierie des Systemesd'Information,vol. 24, no. 1, pp. 119–123, 2019.
[29] L. Yu, Z. Yang, Q. He, R. J. Zeng, Y. Bai, and S. Zhou, “Novelgas diffusion cloth bioanodes for high-performance methane-powered microbial fuel cells,” Environmental Science & Tech-nology, vol. 53, no. 1, pp. 530–538, 2019.
[30] Z. Yuan, S. Zhang, F. Meng, H. Zhang, and K. Zuo, “Investiga-tion of grain radius dependence of sensitivity for porous thinfilm semiconducting metal oxide gas sensor,” IEEE SensorsJournal, vol. 20, no. 8, pp. 4275–4282, 2019.
[31] A. Lipare, D. R. Edla, and R. Dharavath, “Energy efficient rout-ing structure to avoid energy hole problem in multi-layer net-work model,” Wireless Personal Communications, vol. 112,no. 4, pp. 2575–2596, 2020.
[32] R. M. Sandoval, A. J. Garcia-Sanchez, and J. Garcia-Haro,“Improving RSSI-based path-loss models accuracy for criticalinfrastructures: a smart grid substation case-study,” IEEETransactions on Industrial Informatics, vol. 14, no. 5,pp. 2230–2240, 2017.
[33] F. Fanian, M. K. Rafsanjani, and V. K. Bardsiri, “A survey ofadvanced LEACH-based protocols,” International Journal ofEnergy Information and Communications, vol. 7, no. 1,pp. 1–16, 2016.
[34] N. Jiang, H. You, and F. Jiang, “Distributed compressed sens-ing algorithm for cluster architectures ofWSNs,” InternationalJournal of Computers, Communications & Control (IJCCC),vol. 9, no. 4, pp. 430–438, 2014.
[35] O. Olayinka and A. Attahiru, “A survey on an energy-efficientand energy-balanced routing protocol for wireless sensor net-works,” Sensors, vol. 17, no. 5, article 1084, 2017.
12 Journal of Sensors