AN IN DEPTH STUDY OF TEXTURE CHARACTERISTICS
33
AN IN DEPTH STUDY OF TEXTURE CHARACTERISTICS AND THEIR AFFECTS ON TEXTURE PERFORMANCE P. Maniscalchi Mold-Tech Abstract Automotive and material suppliers have struggled for years with trying to produce quality, textured hard plastic parts with correct gloss levels and good mar resistance. Many times suppliers are at the mercy of the textures being chosen by OEM design studios. Some textures that are visually appealing may not perform well for gloss and/or mar. In the past, little was known as to what specific characteristics led to these performance limitations. The purpose of this paper is to identify the specific characteristics of automotive textures and how these characteristics affect mar and gloss on molded plastic parts. By analyzing these characteristics, designers will be able to create, or modify, textures that are both robust and aesthetically pleasing. Topics to be discussed include identifying contributing texture characteristics, discussing how these characters can be manipulated to improve performance and recommendations will be made as to how ideal textures should be developed in the future. Research Summary Plaques were textured with nineteen different textures from three texture families. The plaque’s surfaces were glossed with a dull blast media and they were molded in two different materials, polypropylene and ABS. After molding these plaques, they were then glossed with a mid-level finish and they were again molded in the chosen resins. The molded plaques were then analyzed using three different piece of measuring equipment. A Bryk gloss meter was used to establish the measured gloss level of the textures. A five-finger scratch and mar tester was used to establish each texture’s susceptibility to marring. Finally, a 3 -dimensional scanner was used to analyze each texture’s characteristics. A trained, experienced OEM craftsmanship representative also independently evaluated the molded plaques for mar severity and perceived gloss level and the findings were recorded. Once the contributing texture characteristics were identified, they were analyzed and compared so that recommendations could be made as to how best to develop new textures that not only look good but also pass performance testing. These preliminary findings show how manipulating various texture characteristics can help to reduce visible mar and also help parts achieve desirable gloss levels. Introduction Over the past five years automotive interiors have become increasingly important to both designers and customers. Automobile manufacturers have started to shift their focus from the vehicles exterior to its interior design. The reason for this shift in perspective is the realization that consumers are spending more time in their vehicles than ever before. One of the key paradigm shifts to interior design is in the area of textured surfaces. This drive toward improving the automotive interior environment has led to the creation of more complex and attractive textures. A texture can add to the overall harmony of an interior, it can also distract from the harmony when they do not perform functionally. The two main functionality tests for any textured part are scratch and mar, and gloss level measurement testing. If a textured part fails one or both of these tests, it can have negative ramifications to the vehicles interior harmony. When a textured part fails a scratch and mar susceptibility test, the original equipment manufacturer, or OEM, is open for potential consumer complaints and warranty issues. If a texture fails gloss level measurement testing, the parts can look cheap and ‘plasticy’. The key for designers today is to choose textures that are both aesthetically pleasing and robust.
Transcript of AN IN DEPTH STUDY OF TEXTURE CHARACTERISTICS

AN IN DEPTH STUDY OF TEXTURE CHARACTERISTICS AND THEIR AFFECTS ON TEXTURE PERFORMANCE
P. Maniscalchi
Mold-Tech
Abstract
Automotive and material suppliers have struggled for years with trying to produce quality, textured hard plastic parts with correct gloss levels and good mar resistance. Many times suppliers are at the mercy of the textures being chosen by OEM design studios. Some textures that are visually appealing may not perform well for gloss and/or mar. In the past, little was known as to what specific characteristics led to these performance limitations.
The purpose of this paper is to identify the specific characteristics of automotive textures and how these characteristics affect mar and gloss on molded plastic parts. By analyzing these characteristics, designers will be able to create, or modify, textures that are both robust and aesthetically pleasing. Topics to be discussed include identifying contributing texture characteristics, discussing how these characters can be manipulated to improve performance and recommendations will be made as to how ideal textures should be developed in the future.
Research Summary
Plaques were textured with nineteen different textures from three texture families. The plaque’s surfaces were glossed with a dull blast media and they were molded in two different materials, polypropylene and ABS. After molding these plaques, they were then glossed with a mid-level finish and they were again molded in the chosen resins. The molded plaques were then analyzed using three different piece of measuring equipment. A Bryk gloss meter was used to establish the measured gloss level of the textures. A five-finger scratch and mar tester was used to establish each texture’s susceptibility to marring. Finally, a 3-dimensional scanner was used to analyze each texture’s characteristics. A trained, experienced OEM craftsmanship representative also independently evaluated the molded plaques for mar severity and perceived gloss level and the findings were recorded.
Once the contributing texture characteristics were identified, they were analyzed and compared so that recommendations could be made as to how best to develop new textures that not only look good but also pass performance testing. These preliminary findings show how manipulating various texture characteristics can help to reduce visible mar and also help parts achieve desirable gloss levels.
Introduction
Over the past five years automotive interiors have become increasingly important to both designers and customers. Automobile manufacturers have started to shift their focus from the vehicles exterior to its interior design. The reason for this shift in perspective is the realization that consumers are spending more time in their vehicles than ever before. One of the key paradigm shifts to interior design is in the area of textured surfaces. This drive toward improving the automotive interior environment has led to the creation of more complex and attractive textures. A texture can add to the overall harmony of an interior, it can also distract from the harmony when they do not perform functionally.
The two main functionality tests for any textured part are scratch and mar, and gloss level measurement testing. If a textured part fails one or both of these tests, it can have negative ramifications to the vehicles interior harmony. When a textured part fails a scratch and mar susceptibility test, the original equipment manufacturer, or OEM, is open for potential consumer complaints and warranty issues. If a texture fails gloss level measurement testing, the parts can look cheap and ‘plasticy’. The key for designers today is to choose textures that are both aesthetically pleasing and robust.

In order for interior designers to choose grains that look and perform well, one must understand why textures fail functionality testing. To understand why some textures fail performance testing, research was performed to identify what texture characteristics cause a texture to fail or pass functionality testing. The research will allow the texture designers to develop textures that marry aesthetics with function.
Purpose of the Study
The purpose of this study is to find the characteristics which cause textured plastic parts to pass or fail two main functionality tests, mar susceptibility and gloss level evaluation. The collected data will be used to create new textures, or enhance existing textures, which are both visually appealing and meet the functional requirements for interior automotive parts.
Problem Statement
Automotive designers often choose textures for interior plastic parts based solely on how they look. Many times, however, these textures may fail the functional requirements established by the automotive industry. Textures for hard, plastic, interior automotive parts are not designed to pass performance testing because little is known about the texture characteristics which lead to performance failures.
Research Questions
The following questions were addressed as part of this research study:
1. What, if any, are the characteristics of a texture which will lead to it failing a mar
2. susceptibility test?
3. What, if any, are the characteristics of a texture which will lead to it failing a gloss test?
4. What, if any, are the characteristics of a texture which will lead to it passing a mar susceptibility test?
5. What, if any, are the characteristics of a texture which will lead to it passing a gloss test?
Limitations of the Study
For this study, the characteristics of 19 textures were analyzed. These textures were etched into five flat P20 steel plates, with four textures on four of the plates, and three textures on the fifth plate. Four of the plates have four textures engraved into them from three different texture families, for a total of 16 unique textures. The texture families being analyzed are animal, stipple and geometric. The fifth plate took one texture from each of these families and a secondary application was applied to evaluate how changing the textures structure affects its performance. The surface area of each texture covers approximately 20 square inches.
Upon completion of the texturing process, the plates were set in an injection molding machine and plaques were molded in a Schulman polypropylene. Fifty plaques were molded from each plate with a specified blast media and then the plate was re-glossed with a different gloss treatment and fifty more plaques were run. The first gloss treatment, a low gloss treatment, was a 220 aluminum oxide blast media. The second gloss treatment, a medium gloss treatment, was a special blend of four parts glass bead and one part 220 aluminum oxide blast media. Both media were applied to the plates via a sand blasting unit set to 80 psi. The final result was a total of 500 molded plaques (Fifty plaques from plate number one was molded at the low gloss level. Fifty plaques from plate number one was molded at the medium gloss level, etc). The process was then repeated by re-molding the plaques in a Sabic ABS material.
Plaques were selected at random for evaluation in three categories: 3-dimensional scan, Taber scratch and mar test and gloss level testing. For the 3-dimensional scan, one ABS plaque was selected from each plate to be analyzed. The plaques which were analyzed with the 3-dimensional scanner were molded using only one of the gloss levels, for a total of five plaques. Five plaques of each plate, in each material and with each gloss treatment, were selected randomly to be analyzed for mar testing which resulted in a total of 100 plaques being analyzed for mar performance. One plaque from each plate, with each gloss treatment was used for both measured and perceived gloss level testing, for a total of 20 plaques. The measured gloss level test was performed using a Bryk gloss meter at the 60° angle setting. A total of 125, of the 1,000 molded plaques, were analyzed for this study.

Scratch and Mar Evaluation
The resistance of an injection molded part to scratch and mar is an important characteristic in today’s highly competitive automotive market. Polymers are designed to function based on where they are located in the vehicle. There are materials that have high impact ratings and others that need to feel and look like real leather. Each OEM has criteria for how materials must perform in regards to scratch and mar evaluation. While the scratch and mar terms are often used in relationship to each other, their definitions vary slightly.
Scratching is associated with a deep low density scratch, or scratches, in the material which causes physical damage to the part (1). The severity of the scratch is often related to the ability of the consumer to perceive the scratch (1). Each OEM has their own guidelines as to how materials are scratched as well as what constitutes an acceptable and unacceptable scratch.
Mar differs from scratching in that mar does not cause physical damage to the material. Mar is associated with shallow surface scratches, which are usually distributed over a large area (1). When a part is marred, the result is usually a change in the gloss of the marred area (1). As with scratch testing, each OEM has developed their own criteria for how a material is tested and what constitutes a successful mar test. Although marring does not typically cause damage to the part, it does relate to the overall quality of the part. Some experts feel that marring is more important to avoid than scratching, because consumers expect a hard plastic part to scratch when excess force is applied. However, because mar can occur with little force being applied, the perception is that a part which mars readily is of low quality.
A common tool for testing scratch and mar in the automotive industry is the Taber Multi-Finger Scratch and Mar Tester (2). Most automotive OEM’s use the five finger scratch and mar test, making it the industry standard for these tests (3). To perform a Taber multi-finger scratch test, a flat sample is secured to the testing unit’s flat platform (2). The sample is pneumatically driven across a distance of 100 millimeters, in one minute, while five one millimeter wide tungsten carbide, or stainless steel, ball tips apply even pressure to the sample (4). Each tip applies a different amount of pressure, which is expressed in terms of Newtons (N). A Newton is the unit of force in the meter-kilogram-second system equal to the force required to impart an acceleration of one meter per second per second to a mass of one kilogram. In the automotive industry, pressures of three, seven, ten, fifteen and twenty N are commonly evaluated for the 5-finger scratch test (4). Whether or not a sample passes or fails the Taber test will depend on the amount of visible damage to the sample. According to the automotive industry standard ASTM D7027-05, set by the American Society for Testing and Materials (ASTM), a material typically fails a scratch test when whitening is evident (5). Whitening is defined as a change in the distribution of a wavelength and intensity of reflected or scattered light, enhancing scratch visibility (4). According to the ASTM D7027-05 standard, whitening is undesirable because it is evident to the human eye (5). The scratched area is then perceived as a flaw to the viewer. Each OEM has specific criteria for what is considered an acceptable amount of whitening.
Mar testing is performed in the same way and with the same testing unit as the scratch test (2). However, the ball tips are seven millimeters wide as opposed to one millimeter in width (2). This wider ball tip ensures that the load is distributed over a larger area. Pressures of three, seven, ten, fifteen and twenty N are commonly used for the 5-finger mar test as well (4). Visual evaluation is performed to identify how much or how little the applied forces mar the material. Marring is identified by the differences in gloss on the part due to the topographic changes where the surface was marred (4). Mar acceptability varies between OEM’s.
Gloss Evaluation
Another important performance test for textured, plastic injection parts is gloss evaluation. Gloss is an attribute of a surface which will cause it to have a shiny or matte appearance. A part will appear glossy by the amount of light which reflects off it. In the automotive industry, the gloss of a part is measured by observing specular light (6). Specular light refers to the reflected light that leaves the surface of a part at the opposite angle of the light source (6).

There are two types of gloss evaluations which are typically performed on automotive injection molded parts: measured and perceived. Measured gloss is a quantifiable measurement using a calibrated piece of equipment called a gloss meter. The gloss meter is a calibrated tool which directs a light source at a specific angle onto a test surface, while simultaneously reading the amount of light that is being reflected back (7). In the automotive industry, the light source is generated under controlled conditions in a calibrated light booth. A light booth is a device which has been designed to provide lighting conditions for visual inspections (8). Light booths have the ability to produce several types of lighting conditions (8). In the automotive industry, D65 daylight lighting is the standard (8). D65 lighting simulates idealized daylight (9). Because perceived measurements are subjective and can be influenced by many factors, a measured reading is most accurate (7). Perceived gloss evaluation, however, is the key measurement as it is what the consumer will view as the glossiness of the part.
Most gloss meters read specular light reflection at three different angles. The angles most commonly observed are 20°, 60° and 85°, per the ASTM standard D523. A 20° angle is used for measuring gloss levels above 70 units, while 85° measurements are used for reading units less than ten (7). The 60° measurement is the universally accepted measurement angle for the automotive industry because it reads gloss units in both the low and high range (7).
Many OEM’s specify a textured parts gloss measurement to be 2.0 units. The 2.0 gloss level is preferred because it looks richer than parts with a higher gloss level and is less susceptible to marring than parts with a lower gloss level. Higher gloss parts are generally perceived to be of lower quality than those with a duller finish. Parts with gloss levels less than 2.0, while rich in appearance, tend to mar more readily than parts at or above 2.0.
There are numerous factors which can affect the glossiness of a textured plastic part. The main factors which will affect a part’s gloss level are the molding parameters of the injection molding machine, the type of resin the part is made from, the color of the part, the type of steel the mold is made from and the finish on the steel prior to molding parts (10). The two factors which affect the finish on the steel are the textured surface and the finish applied to the mold’s surface by the texture company (10).
Relating Scratch/Mar and Gloss Evaluation to Textured Parts
The relationship between scratch and mar testing, gloss evaluation and the textured surface is critical to the overall harmony of an automotive interior. Textured plastic parts can enhance and compliment the overall appearance of an automotive interior when properly executed. When textures are visually appealing but fail to perform they can distract from the interior’s harmony. It is typically the OEM craftsmanship professional who is responsible for ensuring that the textured parts meet the original design intent while at the same time meeting the required gloss target and maintaining a minimal susceptibility for. If one of the performance facets fails, the harmony of the interior is compromised.
There are an unlimited amount of textures and texture styles available for automotive designers to choose from. Textures with a fine sandpaper look and feel are called stipples. The depths of stipple textures range from .0005” to .005” deep. Technical textures are geometric in nature and usually have a linear orientation. The depth of technical textures ranges from .001” to .012”. The most common automotive textures are called leather or animal textures. Leather textures resemble animal hides and range from .002” to .007” in depth. Typically, leather textures have a grain direction and distinguishing characteristics, similar to a piece of animal hide. In the past, leather textures were two dimensional in nature which did not resemble a real piece of leather, however, with current technology, texture companies are now producing textures for hard plastic parts which look and feel like real leather.
Each type of texture can be manipulated to produce a new texture with different characteristics. By changing the depth, size or spacing of the texture’s characteristics, the designer can affect the texture’s visual appearance exponentially. Any change to the texture’s characteristics, however visually appealing it may be, can have an impact on the texture’s overall performance.
Data Analysis
Introduction
16 unique textures were engraved into four P20 plates. An additional plate was engraved with three of these textures; however, a secondary application was applied to the textures surface to evaluate how this change would affect the textures performance. The result was the engraving of 19 textures into a total of five P20 plates. After the plates were engraved they were each blasted with a 220 grit aluminum oxide blast media. The purpose of this blasting was to create a low gloss finish, less than 2.0 units, on the plate’s surface. After the plates were glossed they were set into an injection molding machine and fifty plaques of each plate were molded in Schulman polypropylene. Once all of the plaques were molded, the plates were re-glossed with a 4-to-1 blast media. The purpose of this blasting was to produce a medium gloss surface finish of between 2.0 and 3.0 units. Finally, the plates were again set into an injection molding machine and the final 200 plaques were molded in polypropylene material. The process was then repeated by re-molding the plaques in a Sabic ABS material. Each grain was assigned a texture identification number to describe its texture type and gloss level.
The 1,000 plaques were allowed to cool at room temperature for 48 hours before they were handled. After the 48 hour period, a total of thirteen plaques were randomly selected from each plate. Five plaques each were selected from the low and medium gloss levels for mar evaluation. One plaque from each of the medium gloss level plates was selected at random for 3-dimensional scanning. Finally, one of each plaque, from each gloss level, was selected at random for gloss evaluation. The total number of plaques used in this research study was 125.
(Once all of the data was collected, it was determined that the type of material did not have a significant impact on the texture characteristics. Therefore, so as not to complicate the research study, only the Polypropylene material was evaluated for this paper.)
Mar Testing and Evaluation
Five plaques from each plate and gloss level were used in the evaluation of mar on the textured surface. While five plaques from each plate with each gloss level were selected for testing, only one of each category was used in the evaluation. Five plaques were chosen, however, to ensure that the mar testing was accurately performed. The Taber Scratch and Mar Testing unit was used to mar the plaques, which eliminated human error or subjectivity (Figure 1). The plaques were marred using weights of 5, 7, and 10 Newtons. The visual review was performed by evaluating the marring caused by the 10 Newton weight (Figure 2). After the plaques were marred they were visually evaluated and one plaque from each plate and gloss level was selected for further evaluation. The plaques selected were deemed to be average and acceptable samples of mar testing at the specified weights.
Figure 1: Taber Scratch and Mar Tester

Figure 2: Example of marred surface
The plaques which were selected for final mar evaluation were independently evaluated by qualified OEM personnel. The samples were placed in a light booth, under D65 lighting, and the severity of the marred surfaces was observed. The textures were categorized using a 1-5 scale. Textures with severe marring were given a 5, while textures with minimal marring were given a 1 (Figure 3).
Mar Susceptibility
Polypropylene
0
1
2
3
4
5
A1PPA2PP
A3PPA4PP
A5PPA6PP
A7PPA8PP
G1PP
G2PP
G3PP
G4PP
S1PPS2PP
S3PPS4PP
A8PP-2
G3PP-2
S3PP-2
Texture ID
Ma
r R
ati
ng
Low Gloss
Medium Gloss
Figure 3: Chart showing results of visual mar evaluation in Polypropylene
Figure 3 clearly shows that the stipple textures were the worst performers, regardless of the surface gloss
level, with an average of 4.5 for mar susceptibility. The animal textures with the medium surface gloss level performed the best with an average of 1.25 for mar susceptibility. The animal textures with the low gloss level averaged a 2.5 for mar. The geometric textures all rated a 2 for marring, when glossed to the medium level, and averaged a 2.5 when glossed at the low gloss level. Animal texture number 4 showed a one point increase in mar rating when the secondary application was applied to it. Stipple texture number 3 performed the same at the low gloss level with the secondary application, while the medium gloss level performed one point better with the secondary application. Finally, geometric texture number 4 showed no change in mar rating with the secondary application applied to it.
In summary, the stipple textures show significantly more marring, in both gloss levels than the other textures with an overall average of 4.5. The animal textures performed the best with an overall mar rating of 1.875 across both gloss levels. The geometric textures averaged a mar rating of 2.25 across both gloss levels. The secondary application increased the mar susceptibility of animal texture number 4 by an average of 1.0 and decreased the mar rating of stipple number 3 by 1.0, with the medium surface gloss level. Mar ratings for stipple texture number 3, with the low surface gloss, and geometric number 4 with both gloss levels all remained unchanged with the secondary application.
Gloss Evaluation
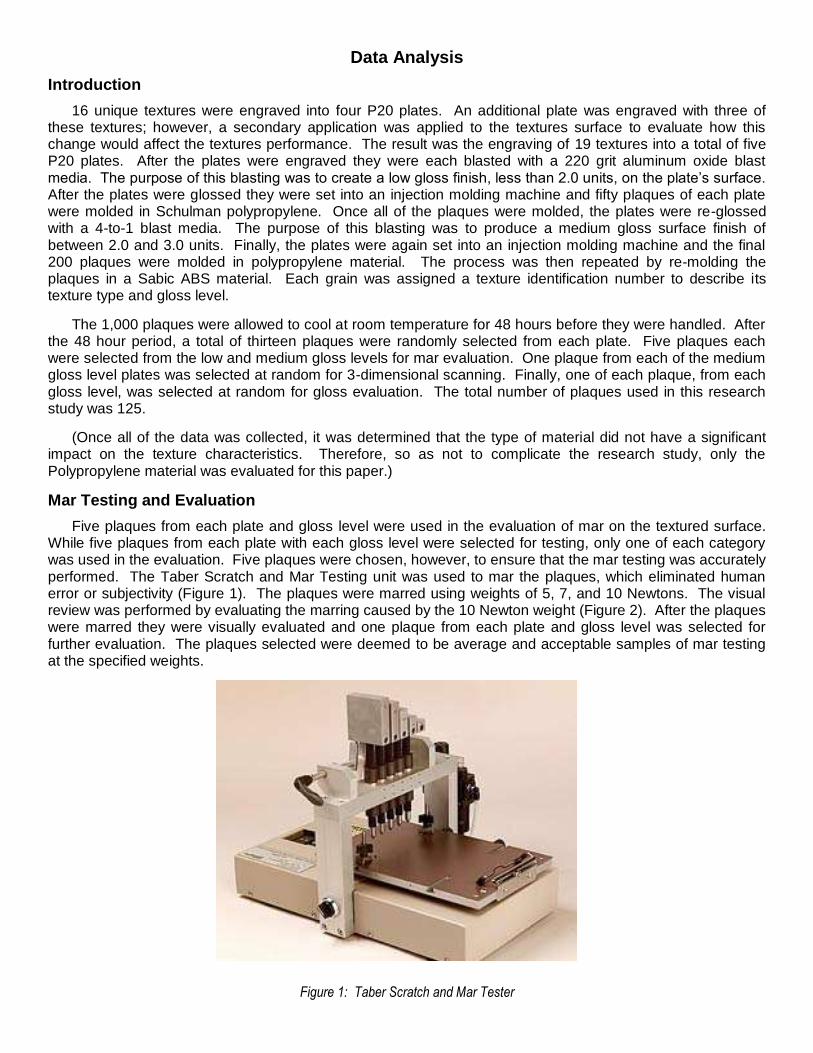
One plaque from each plate, with both gloss levels, was randomly picked for gloss level evaluation. The first gloss evaluation that was performed utilized a Bryk 60° gloss meter. The gloss meter reads the amount of light being reflected from a surface at the specified angle of 60° (Figures 4, http://www.ides.com/property_descriptions/ASTMD523.asp). The other type of gloss evaluation is called perceived. Perceived gloss is considered to be the most important gloss evaluation as it is how the consumer views the gloss level of the textured parts. All of the visual gloss evaluation was performed in a light booth under D65 lighting. The light booth is designed for optimum visual evaluation of interior automotive parts to the SAE J361 specification.
Figure 4: Diagram of how light reflection is read.
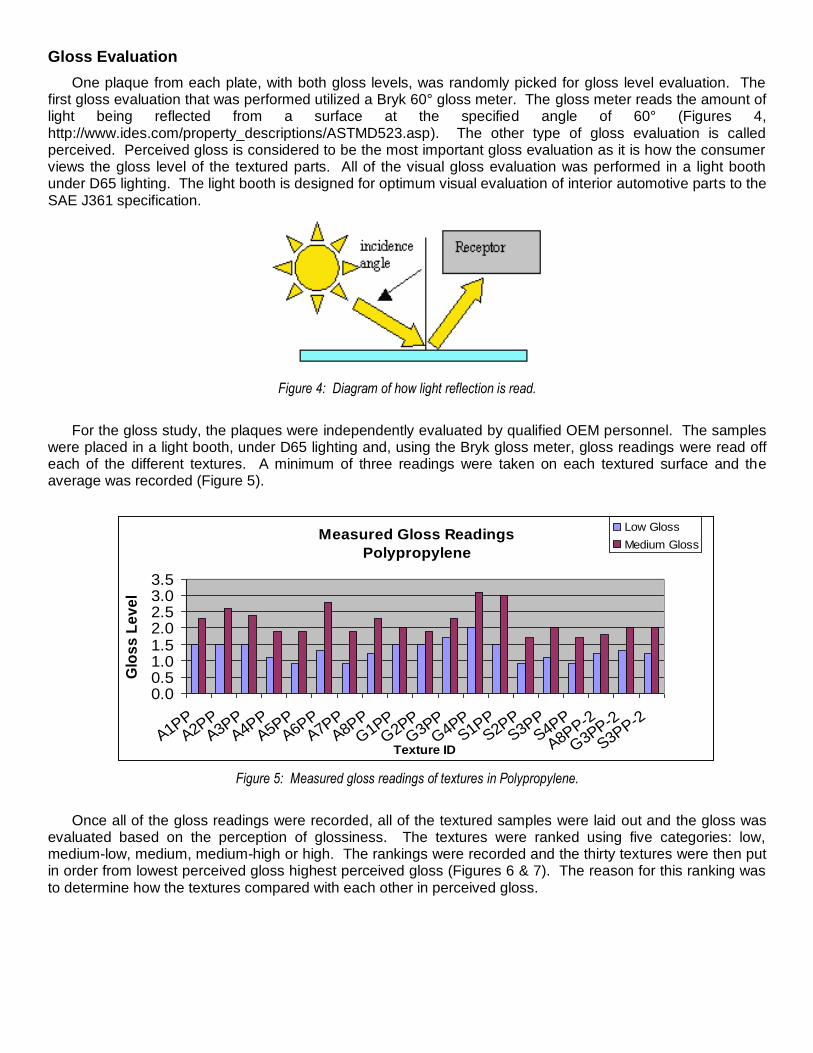
For the gloss study, the plaques were independently evaluated by qualified OEM personnel. The samples
were placed in a light booth, under D65 lighting and, using the Bryk gloss meter, gloss readings were read off each of the different textures. A minimum of three readings were taken on each textured surface and the average was recorded (Figure 5).
Figure 5: Measured gloss readings of textures in Polypropylene.
Once all of the gloss readings were recorded, all of the textured samples were laid out and the gloss was
evaluated based on the perception of glossiness. The textures were ranked using five categories: low, medium-low, medium, medium-high or high. The rankings were recorded and the thirty textures were then put in order from lowest perceived gloss highest perceived gloss (Figures 6 & 7). The reason for this ranking was to determine how the textures compared with each other in perceived gloss.
Measured Gloss Readings
Polypropylene
0.00.51.01.52.02.53.03.5
A1PPA2PP
A3PPA4PP
A5PPA6PP
A7PPA8PP
G1PP
G2PP
G3PP
G4PP
S1PPS2PP
S3PPS4PP
A8PP-2
G3PP-2
S3PP-2
Texture ID
Glo
ss
Le
ve
l
Low Gloss
Medium Gloss

Figure 6: Perceived gloss of textures in Polypropylene.
Figure 7: Ordered ranking of perceived gloss level of textures in Polypropylene.
After comparing the data from the measured and perceived gloss level analysis it becomes apparent as to why the perceived gloss level is the most important. Figure 6 shows that texture S4, molded with a low-gloss, has a gloss measured reading of 0.9 units, the lowest recorded unit in this study. However, Figure 7 shows that perceptually S4L is ranked at number 12. The data shows that even though S4L has the lowest measured gloss reading, it ranks higher for perceived gloss than textures with higher measured gloss levels. This means that it is not reflecting much measurable light, yet it appears to be glossy. Figure 6 also shows that texture S1, molded with a medium-gloss, has one of the highest measured gloss reading at 3.0 units. Its perceived ranking in Figure 7, however, is 22 which put’s it right in the middle for perceived gloss. This shows that even though texture S1M is reflecting a significant amount of light it does not appear to be as glossy as other textures with lower gloss readings.
Perceived Gloss Level
Polypropylene
A1PPA2PP
A3PPA4PP
A5PPA6PP
A7PPA8PP
G1PP
G2PP
G3PP
G4PP
S1PPS2PP
S3PPS4PP
A8PP-2
G3PP-2
S3PP-2
Texture ID
Glo
ss L
evel
Low Gloss
Medium Gloss
High
Med-High
Med
Med-Low
Low
Perceived Gloss Level Ranking
Polypropylene
0
5
10
15
20
25
30
35
40
S3PPL-
2
A8PPL-
2
S2PPL
A5PPL
S3PPL
S1PPL
A7PPL
S2PPM
A8PPL
A4PPL
G3P
PL-2
S4PPL
G1P
PL
A9PPL-
2
A6PPL
A3PPL
A2PPL
G3P
PL
S3PPM
-2
S3PPM
A9PPM
-2
S1PPM
G3P
PM-2
G3P
PM
A1PPL
A7PPM
A8PPM
-2
A4PPM
G1P
PM
A5PPM
S4PPM
G2P
PL
A2PPM
A3PPM
A8PPM
A1PPM
G4P
PL
G2P
PM
A6PPM
G4P
PM
Texture ID
Ran
k

The data clearly shows that many of the texture’s measured gloss readings match their perceived gloss readings as well. The data also shows that many of the texture’s measured and perceived rankings do not match; which is why the perceived gloss level holds precedent over the measured reading.
Texture Characteristics
To evaluate a textures characteristics one plaque was randomly selected from each plate with the medium gloss level for a microscopic evaluation. (As the gloss level of the plate does not alter the texture’s characteristics in a molded plaque, the researcher decided to use only the medium gloss level plaques.) The medium gloss level allowed for the best results when using the 3-dimensional scanner. The texture characteristics which are deemed to be relevant to the textures functionality are, the average depth of the texture, the average number of peaks per 10 linear millimeters (Pc), the shape of the peaks and the randomness of the peaks height and spacing.
Categorizing Texture Characteristics
The first category used to classify a texture is the average depth (Rz). The textures were categorized as shallow (≤.002”), medium (>.002”-.0035”) and deep (>.0035”) (Tables 1-3). Peak-count (Pc) was evaluated using a 3-dimensional scanner. Three main Pc categories were observed: <20 Pc per 10 linear mm, 20-35 Pc per 10 linear mm and >35 Pc per 10 linear mm. The shape of the peaks are categorized as sharp or round. Finally, the textures were categorized by the randomness of the heights and spacing of the textures peaks using two categories: random and non-random. The shape of the texture’s peaks were also evaluated visually using a 3-dimensional topographic profile image produced using a 3-dimensional scanner (Figure 8).
Figure 8: 3-Dimensional scanning unit.
As Tables I-III show, the stipple family of textures all fall into the shallow category for texture depth. The animal family falls into the medium and high categories and the geometric textures fall primarily into the deep category for texture depth. While this information on its own does not give any conclusive information to performance, it does illustrate to which depth category the different texture families typically fall.

Table I: Average texture depth ≤.002”
Texture ID Texture Family Grain Depth Measured Gloss Visual Gloss Level Mar Susceptibility
S1PPL Stipple .0008" 1.5 Low 5
S1PPM Stipple .0008" 3.0 Med-Low 4
S2PPL Stipple .00175" 0.9 Low 5
S2PPM Stipple .00175" 1.7 Med-Low 5
S3PPL Stipple .002" 1.1 Low 4
S3PPM Stipple .002" 2.0 Med-Low 4
Table II: Average texture depth >.002”-.0035”
Texture ID Texture Family Grain Depth Measured Gloss Visual Gloss Level Mar Susceptibility
A1PPL Animal .00325" 1.5 Medium 3
A1PPM Animal .00325" 2.3 Med-High 1
A2PPL Animal .003" 1.5 Med-Low 3
A2PPM Animal .003" 2.6 Med-High 1
A3PPL Animal .0029" 1.5 Med-Low 2
A3PPM Animal .0029" 2.4 Med-High 1
A5PPL Animal .0035" 0.9 Low 2
A5PPM Animal .0035" 1.9 Medium 1
A6PPL Animal .003" 1.3 Med-Low 2
A6PPM Animal .003" 2.8 High 1
A7PPL Animal .0035" 0.9 Low 2
A7PPM Animal .0035" 1.9 Med-High 1
G1PPL Geometric .0035" 1.5 Med-Low 2
G1PPM Geometric .0035" 2.0 Medium 1
S3PPL-2 Stipple .00225" 1.2 Low 4
S3PPM-2 Stipple .00225" 2.0 Low 3
S4PPL Stipple .0034" 0.9 Low 4
S4PPM Stipple .0034" 1.7 Medium 3

Table III: Average texture depth >.0035”.
Texture ID Texture Family Grain Depth Measured Gloss Visual Gloss Level Mar Susceptibility
A4PPL Animal .00375" 1.1 Med-Low 4
A4PPM Animal .00375" 1.9 Medium 2
A8PPL Animal .004" 1.2 Low 2
A8PPL-2 Animal .0045" 1.2 Low 3
A8PPM Animal .004" 2.3 Med-High 1
A8PPM-2 Animal .0045" 1.8 Medium 2
G2PPL Geometric .00575" 1.5 Med-High 2
G2PPM Geometric .00575" 1.9 High 1
G3PPL Geometric .0045" 1.7 Medium 3
G3PPL-2 Geometric .0045" 1.3 Med-Low 3
G3PPM Geometric .0045" 2.3 Medium 2
G3PPM-2 Geometric .0045" 2.0 Medium 2
G4PPL Geometric .004" 2.0 High 2
G4PPM Geometric .004" 3.1 High 1
Tables IV-VI illustrate the peak-count (Pc) of each texture and how the Pc relates to mar and gloss. By
observing the table one can see that when the Pc is high it is more likely that the texture will mar and be low in gloss. Conversely, the lower the Pc is the less likely the texture is to mar and the glossier the part will be.
Table IV: Peak-count <20 Pc per 10 linear mm.
Texture ID Texture Family Measured Gloss Visual Gloss
Level Mar Susceptibility Peak Count
G2PPL Geometric 1.5 Med-High 2 14
G2PPM Geometric 1.9 High 1 14
G3PPL Geometric 1.7 Medium 3 17
G3PPM Geometric 2.3 Medium 2 17
G4PPL Geometric 2.0 High 2 12
G4PPM Geometric 3.1 High 1 12
Table IV illustrates that all of the textures with low Pc’s are geometric textures with primarily higher gloss
levels.

Table V: Peak-count 20-35 Pc per 10 linear mm.
Table V shows that textures in the mid-Pc range generally have good mar ratings and mid to low perceived gloss levels.
Texture ID Texture Family Measured Gloss Visual Gloss
Level Mar Susceptibility Peak Count
A1PPL Animal 1.5 Medium 3 21
A1PPM Animal 2.3 Med-High 1 21
A2PPL Animal 1.5 Med-Low 3 20
A2PPM Animal 2.6 Med-High 1 20
A3PPL Animal 1.5 Med-Low 2 28
A3PPM Animal 2.4 Med-High 1 28
A4PPL Animal 1.1 Med-Low 4 28
A4PPM Animal 1.9 Medium 2 28
A5PPL Animal 0.9 Low 2 30
A5PPM Animal 1.9 Medium 1 30
A6PPL Animal 1.3 Med-Low 2 21
A6PPM Animal 2.8 High 1 21
A7PPL Animal 0.9 Low 2 25
A7PPM Animal 1.9 Med-High 1 25
A8PPL Animal 1.2 Low 2 23
A8PPL-2 Animal 1.2 Low 3 28
A8PPM Animal 2.3 Med-High 1 23
A8PPM-2 Animal 1.8 Medium 2 28
G1PPL Geometric 1.5 Med-Low 2 20
G1PPM Geometric 2.0 Medium 1 20
G3PPL Geometric 1.3 Med-Low 3 20
G3PPM Geometric 2.0 Medium 2 20
S4PPL Stipple 0.9 Low 4 33
S4PPM Stipple 1.7 Medium 3 33

Table VI: Peak-count >35 Pc per 10 linear mm.
Table VI clearly illustrates that textures with high Pc’s typically perform poorly for mar but achieve the lowest gloss levels.
The roundness of a texture’s peaks is an important performance characteristic as well. When a peak is round there is less chance for it to mar (Figure 9). Marring is caused when a texture’s peaks become flattened. Sharp or pointy peaks are more susceptible to damage than a peak that has a rounded top (Figure 10). Tables VII and VIII categorize the characteristics of the texture’s peaks as sharp or rounded.
Figure 9: Profile of a texture with rounded peaks.
Figure 10: Profile of a texture with sharp peaks.
Table VIII illustrates how textures with sharp peak characteristics are the worst performers for marring.
Textures with round peak characteristics are the best performers for mar susceptibility, as seen in Table VII. The tables also illustrate that textures with rounded characters have higher perceived gloss levels, while textures with sharp characteristics have lower gloss levels.
Texture ID Texture Family Measured Gloss Visual Gloss
Level Mar Susceptibility Peak Count
S1PPL Stipple 1.5 Low 5 85
S1PPM Stipple 3.0 Med-Low 4 85
S2PPL Stipple 0.9 Low 5 68
S2PPM Stipple 1.7 Med-Low 5 68
S3PPL Stipple 1.1 Low 4 48
S3PPL-2 Stipple 1.2 Low 4 52
S3PPM Stipple 2.0 Med-Low 4 48
S3PPM-2 Stipple 2.0 Low 3 52

Table VII: Textures with round peak characteristics.
Texture ID Texture Family Measured Gloss Visual Gloss
Level Mar Susceptibility Shape of Peak
A1PPL Animal 1.5 Medium 3 Round
A1PPM Animal 2.3 Med-High 1 Round
A2PPL Animal 1.5 Med-Low 3 Round
A2PPM Animal 2.6 Med-High 1 Round
A3PPL Animal 1.5 Med-Low 2 Round
A3PPM Animal 2.4 Med-High 1 Round
A4PPL Animal 1.1 Med-Low 4 Round
A4PPM Animal 1.9 Medium 2 Round
A5PPL Animal 0.9 Low 2 Round
A5PPM Animal 1.9 Medium 1 Round
A6PPL Animal 1.3 Med-Low 2 Round
A6PPM Animal 2.8 High 1 Round
A7PPL Animal 0.9 Low 2 Round
A7PPM Animal 1.9 Med-High 1 Round
A8PPL Animal 1.2 Low 2 Round
A8PPL-2 Animal 1.2 Low 3 Round
A8PPM Animal 2.3 Med-High 1 Round
A8PPM-2 Animal 1.8 Medium 2 Round
G2PPL Geometric 1.5 Med-High 2 Round
G2PPM Geometric 1.9 High 1 Round
G3PPL Geometric 1.7 Medium 3 Round
G3PPM Geometric 2.3 Medium 2 Round

Table VIII: Textures with sharp peak characteristics.
Texture ID Texture Family Measured Gloss Visual Gloss
Level Mar Susceptibility Shape of Peak
G1PPL Geometric 1.5 Med-Low 2 Sharp
G1PPM Geometric 2.0 Medium 1 Sharp
G3PPL-2 Geometric 1.3 Med-Low 3 Sharp
G3PPM-2 Geometric 2.0 Medium 2 Sharp
G4PPL Geometric 2.0 High 2 Sharp
G4PPM Geometric 3.1 High 1 Sharp
S1PPL Stipple 1.5 Low 5 Sharp
S1PPM Stipple 3.0 Med-Low 4 Sharp
S2PPL Stipple 0.9 Low 5 Sharp
S2PPM Stipple 1.7 Med-Low 5 Sharp
S3PPL Stipple 1.1 Low 4 Sharp
S3PPL-2 Stipple 1.2 Low 4 Sharp
S3PPM Stipple 2.0 Med-Low 4 Sharp
S3PPM-2 Stipple 2.0 Low 3 Sharp
S4PPL Stipple 0.9 Low 4 Sharp
S4PPM Stipple 1.7 Medium 3 Sharp
The final texture characteristic being researched in this study is the randomness of the peaks spacing, size
and height. This characteristic is important because textures with uniform peak height, size and spacing are more likely to be in high in gloss. The reason they are more likely to be higher in gloss is that when peaks are uniform, or non-random, light is reflected off all of the peaks equally, and on the same plane. When peaks are random they tend to trap more light and therefore reflect less light. Tables IX and X categorize the textures as random and non-random.

Table IX: Textures with non-random peak characteristics.
Texture ID Texture Family Measured Gloss Visual Gloss
Level Mar Susceptibility
Randomness of Peaks
G1PPL Geometric 1.5 Med-Low 2 Non-Random
G1PPM Geometric 2.0 Medium 1 Non-Random
G2PPL Geometric 1.5 Med-High 2 Non-Random
G2PPM Geometric 1.9 High 1 Non-Random
G3PPL Geometric 1.7 Medium 3 Non-Random
G3PPL-2 Geometric 1.3 Med-Low 3 Non-Random
G3PPM Geometric 2.3 Medium 2 Non-Random
G3PPM-2 Geometric 2.0 Medium 2 Non-Random
G4PPL Geometric 2.0 High 2 Non-Random
G4PPM Geometric 3.1 High 1 Non-Random

Table X: Textures with random peak characteristics.
Texture ID Texture Family Measured Gloss Visual Gloss
Level Mar Susceptibility
Randomness of Peaks
A1PPL Animal 1.5 Medium 3 Random
A1PPM Animal 2.3 Med-High 1 Random
A2PPL Animal 1.5 Med-Low 3 Random
A2PPM Animal 2.6 Med-High 1 Random
A3PPL Animal 1.5 Med-Low 2 Random
A3PPM Animal 2.4 Med-High 1 Random
A4PPL Animal 1.1 Med-Low 4 Random
A4PPM Animal 1.9 Medium 2 Random
A5PPL Animal 0.9 Low 2 Random
A5PPM Animal 1.9 Medium 1 Random
A6PPL Animal 1.3 Med-Low 2 Random
A6PPM Animal 2.8 High 1 Random
A7PPL Animal 0.9 Low 2 Random
A7PPM Animal 1.9 Med-High 1 Random
A8PPL Animal 1.2 Low 2 Random
A8PPL-2 Animal 1.2 Low 3 Random
A8PPM Animal 2.3 Med-High 1 Random
A8PPM-2 Animal 1.8 Medium 2 Random
S1PPL Stipple 1.5 Low 5 Random
S1PPM Stipple 3.0 Med-Low 4 Random
S2PPL Stipple 0.9 Low 5 Random
S2PPM Stipple 1.7 Med-Low 5 Random
S3PPL Stipple 1.1 Low 4 Random
S3PPL-2 Stipple 1.2 Low 4 Random
S3PPM Stipple 2.0 Med-Low 4 Random
S3PPM-2 Stipple 2.0 Low 3 Random
S4PPL Stipple 0.9 Low 4 Random
S4PPM Stipple 1.7 Medium 3 Random

Tables IX and X clearly illustrate how textures with random peak characteristics have lower gloss levels and non-random peaked textures have higher gloss levels.
Conclusion
The research conducted for this study was done to identify which characteristics of a textured plastic part influences the textures susceptibility toward marring and perceived glossiness. Reviewing all of the collected data exposed which texture characteristics were the biggest contributors to the performance failures and successes of a textured plastic part. Identifying these character flaws will help designers to develop textures which perform well and are aesthetically appealing. The data will also allow designers to understand that the textures they choose may need to be altered so that they have a greater opportunity to perform well in the vehicle.
Interpretation of Data
Summary
Currently, many automotive designers choose textures for interior plastic parts solely for their aesthetic appeal. Unfortunately, a texture that may look nice may also have inherent character flaws which may cause it to fail performance testing. With textures becoming more important to a vehicles overall harmony, it is important for designers and engineers to understand that they can have both performance and aesthetics in textured plastic parts. In order to achieve this marriage of performance and aesthetics, texture characteristics will have to first be identified to establish if the texture will have a propensity toward failing performance testing.
The purpose of this study was to identify the basic characteristics of various textures and texture families in order to find the characteristics which lead to a texture failing performance testing. The main objective of this study was to understand these characteristics so that new textures could be developed which look and perform to the customer’s satisfaction.
The data analysis in this study shows decisively which texture types are prone to marring and which types were prone to being low or high in gloss. Stipple textures were the poorest performers for marring, however, they achieved the low gloss levels that many automotive designers desire. Animal textures varied as to their performance overall. They tended to perform well in mar testing, however, their gloss levels varied greatly. Geometric textures consistently performed well for marring, however, their gloss levels were higher on average than the other texture families. Finally, the textures which received the secondary application had little or no impact on marring; however, the application did help the textures to achieve a lower gloss level.
The research for this study was performed using only one type of plastic material, polypropylene. There are many other types of materials available for designers and engineers to use for automotive interior parts. These materials have a significant affect to the overall performance of the texture. Softer materials will mar more readily, however, they will have lower gloss levels. Hard materials will be less susceptible to marring, however, they tend to be glossier. It is because there are so many materials that the researcher chose polypropylene, the most commonly used material, and focused only on how the texture’s characteristics will affect mar and gloss regardless of the material.
Conclusions
The research focused on which texture characteristics affected marring and gloss on a textured plastic part. There are two parts to both the marring and gloss questions. The two parts to the marring questions are: which characteristics of a texture will lead to the texture passing a mar susceptibility test and which characteristics of a texture will lead to the texture failing a mar susceptibility test. The two parts to the gloss questions are: which characteristics of a texture will lead to the texture passing a gloss level test and which characteristics of a texture will lead to the texture failing a gloss level test. While there were no definitive characteristics which always applied all of the time, there were some characteristics which were evident when the textures passed or failed the various performance tests. Before exploring the answers to these questions it is important to understand how the amount of surface area of a texture affects mar and gloss.

A flat, smooth piece of plastic with a dimension of 10 mm by 10 mm will have a surface area of 100 mm. Because the piece is flat and smooth it will reflect almost one hundred percent of the incidence light, it will also be highly susceptible to marring since there is nothing to hide the marring on the surface. If this same piece of plastic is textured with ten, 1 mm square characters, all of which are 1 mm deep, the surface area of the piece now increases from 100 mm to 150 mm. This increase allows some light to be trapped on the surface of the piece, thus resulting in a part with a lower gloss level that is less susceptible to marring. As more texture peaks are added, the surface area will increase based on the amount, size and shape of the peaks.
Mar appears when damage occurs on the surface of the part. The more surface area that is affected, the worse the mar will appear. The more surface area a part has, within a defined dimension, the lower gloss will be. This occurs because the gloss level of the part is related to the amount of light being reflected. More surface area means more light is being trapped in the texture.
Questions Relating to Marring
The data in Table XI shows which textures performed the worst for marring. By analyzing this data the textures character flaws become evident. Analysis of the data shows that textures with high mar ratings typically have one or more of the following characteristics: high peak counts (>35 Pc per 10 mm, linear), even peak heights (non-random), sharp peaks and/or shallower depths (≤.002”). There are a few reasons these textures tend to fail mar testing more readily than other textures.
Table XI: Textures highly susceptible to marring.
When a textured part is marred the result is an area of damage which affects the part’s gloss and,
therefore, the viewer’s eye is drawn to the damaged area. Textures with high peak counts have more peaks in a given area than do textures with low Pc’s. When textures with high Pc’s are damaged, the result is that more surface area is affected which leads to more visible damage. A texture with sharp peaks shows mar more readily because the damage that occurs due to marring flattens the sharpness of the peak and, therefore, the damage is more pronounced. Finally, shallower textures do not hide mar as readily as deeper textures. The reason shallow textures do not hide marring is because damage affects not only the top most surface but also, depending on the amount of pressure being applied, the damage also gets down into the texture. Therefore, when marring occurs the impact is greater on shallow textures because a larger surface area is being affected. If a texture is .002” deep and the marring is .001” deep, the result is that 50% of the surface depth in the marred area is damaged. Conversely, when a texture that is .004” deep is damaged by a .001” deep mar, the result is that only 25% of the surface depth is affected. Stipple textures are typically the textures which fall into this shallow category (Figure 11).
Texture ID Texture Family Measured
Gloss
Visual Gloss Level
Mar Susceptibility
Peak Count Randomness
of Peaks Shape of Peak
A4PPL Animal 1.1 Med-Low 4 28 Random Round
S1PPL Stipple 1.5 Low 5 85 Random Sharp
S1PPM Stipple 3.0 Med-Low 4 85 Random Sharp
S2PPL Stipple 0.9 Low 5 68 Random Sharp
S2PPM Stipple 1.7 Med-Low 5 68 Random Sharp
S3PPL Stipple 1.1 Low 4 48 Random Sharp
S3PPL-2 Stipple 1.2 Low 4 52 Random Sharp
S3PPM Stipple 2.0 Med-Low 4 48 Random Sharp
S4PPL Stipple 0.9 Low 4 33 Random Sharp

Figure 11: Profile of a Stipple texture
The data in Table XII shows which textures performed the best for marring. By analyzing this data, the attributes which help the texture to perform well for marring become clear. Analyzing the data shows that textures with low mar ratings typically have one or more of the following characteristics: round peaks, mid-range peak counts (20-35 Pc per 10 mm, linear), random peak heights and/or deeper depths (>.002”). There are a few reasons these textures tend to pass mar testing more readily than other textures.

Table XII: Textures with a low propensity toward marring.
As discussed earlier, mar occurs due to damage occurring on a part which causes light to reflect more in
the damaged area. Mar is defined as a change in the glossiness in the area affected, not physical damage. When a texture has a low Pc, there are less characters being damaged and therefore the mar is less evident. Textures with round peaks are also less affected by mar because marring tends to round the peaks in the area affected. If the peaks are already rounded the result is little, if any, visible damage. Finally, the deeper the grain is the, less overall surface area is affected by marring.
Texture ID Texture Family
Measured Gloss Visual Gloss Level
Mar Susceptibility
Peak Count Randomness
of Peaks Shape of Peak
A1PPM Animal 2.3 Med-High 1 21 Random Round
A2PPM Animal 2.6 Med-High 1 20 Random Round
A3PPL Animal 1.5 Med-Low 2 28 Random Round
A3PPM Animal 2.4 Med-High 1 28 Random Round
A4PPM Animal 1.9 Medium 2 28 Random Round
A5PPL Animal 0.9 Low 2 30 Random Round
A5PPM Animal 1.9 Medium 1 30 Random Round
A6PPL Animal 1.3 Med-Low 2 21 Random Round
A6PPM Animal 2.8 High 1 21 Random Round
A7PPL Animal 0.9 Low 2 25 Random Round
A7PPM Animal 1.9 Med-High 1 25 Random Round
A8PPL Animal 1.2 Low 2 23 Random Round
A8PPM Animal 2.3 Med-High 1 23 Random Round
A8PPM-2 Animal 1.8 Medium 2 28 Random Round
G1PPL Geometric 1.5 Med-Low 2 20 Non-Random Sharp
G1PPM Geometric 2.0 Medium 1 20 Non-Random Sharp
G2PPL Geometric 1.5 Med-High 2 14 Non-Random Round
G2PPM Geometric 1.9 High 1 14 Non-Random Round
G3PPM Geometric 2.3 Medium 2 17 Non-Random Round
G3PPM-2 Geometric 2.0 Medium 2 20 Non-Random Sharp
G4PPL Geometric 2.0 High 2 12 Non-Random Sharp
G4PPM Geometric 3.1 High 1 12 Non-Random Sharp

Questions Relating to Gloss
The second set of research questions dealt with gloss level performance. The data in Table XIII shows which textures had the highest perceived gloss levels. Analysis of this data reveals the characteristics of textures with high perceived gloss levels. Textures with high gloss levels typically have one or more of the following characteristics: round peaks, low peak counts (≤20 Pc per 10 mm, linear), deeper depths (>.002”) and or non-random peak variations. There are a few reasons these textures tend to high gloss levels.
Table XIII: Textures with high gloss levels.
Texture ID Texture Family
Measured Gloss Visual Gloss Level
Mar Susceptibility
Peak Count Randomness
of Peaks Shape of Peak
A1PPM Animal 2.3 Med-High 1 21 Random Round
A2PPM Animal 2.6 Med-High 1 20 Random Round
A3PPM Animal 2.4 Med-High 1 28 Random Round
A6PPM Animal 2.8 High 1 21 Random Round
A7PPM Animal 1.9 Med-High 1 25 Random Round
A8PPM Animal 2.3 Med-High 1 23 Random Round
G2PPL Geometric 1.5 Med-High 2 14 Non-Random Round
G2PPM Geometric 1.9 High 1 14 Non-Random Round
G4PPL Geometric 2.0 High 2 12 Non-Random Sharp
G4PPM Geometric 3.1 High 1 12 Non-Random Sharp
One reason these textures had high gloss levels was due to their low Pc. Gloss is a measure of how much
light is being reflected off a surface. When textures have high Pc’s they trap more light, thus limiting the amount of light being reflected. Textures with low Pc’s naturally reflect more light then they trap. Another reason these textures fail gloss level testing is their round, non-random peaks. Round peaks have a wider surface area which reflects more light than a peak that is sharp. Peaks that are non-random tend to have characters which fall on the same plane. Textures that have both round and non-random peaks create a situation where not only does the light reflect due to the surface area of the peak, it actually reflects more light due to the characters of the texture falling on the same plane. This round, non-random peak condition occurs primarily in geometric textures (Figure 12).
Figure 12: Profile of a Geometric texture.

The final question for this research study relates to textures that have low gloss levels. The data in Table XIV illustrates which textures had the lowest perceived gloss levels. Analysis of this data reveals the characteristics of textures with low perceived gloss levels. Textures with low gloss levels typically have one or more of the following characteristics: sharp peaks, random peak heights, high peak-counts (>35 Pc per 10 mm, linear) with shallower depths (<.002”) or mid-level peak-counts (20-35 Pc per 10 linear mm) with deep depths (>.0035”). There are a few reasons these textures tend to have low gloss levels. First, textures with random peak heights reflect light at different levels and angles. This leads to more light being trapped in the textures surface which results in a lower gloss reading. Textures with sharp peak characteristics have less surface area in which light can be reflected. This combination of random peak heights and sharp characters appears to be the optimum condition for achieving loss gloss textures.
Table XIV: Textures with low gloss levels.
Texture ID Texture Family
Measured Gloss Visual Gloss Level
Mar Susceptibility
Peak Count Randomness
of Peaks Shape of Peak
A2PPL Animal 1.5 Med-Low 3 20 Random Round
A3PPL Animal 1.5 Med-Low 2 28 Random Round
A4PPL Animal 1.1 Med-Low 4 28 Random Round
A5PPL Animal 0.9 Low 2 30 Random Round
A6PPL Animal 1.3 Med-Low 2 21 Random Round
A7PPL Animal 0.9 Low 2 25 Random Round
A8PPL Animal 1.2 Low 2 23 Random Round
A8PPL-2 Animal 1.2 Low 3 28 Random Round
G3PPL-2 Geometric 1.3 Med-Low 3 20 Non-Random Sharp
S1PPL Stipple 1.5 Low 5 85 Random Sharp
S1PPM Stipple 3.0 Med-Low 4 85 Random Sharp
S2PPL Stipple 0.9 Low 5 68 Random Sharp
S2PPM Stipple 1.7 Med-Low 5 68 Random Sharp
S3PPL Stipple 1.1 Low 4 48 Random Sharp
S3PPL-2 Stipple 1.2 Low 4 52 Random Sharp
S3PPM Stipple 2.0 Med-Low 4 48 Random Sharp
S3PPM-2 Stipple 2.0 Low 3 52 Random Sharp
S4PPL Stipple 0.9 Low 4 33 Random Sharp

Next, textures with mid-level Pc’s, 20-35 Pc per 10 linear mm, have less surface area in which to trap light than textures with high Pc’s, >35 Pc per 10 linear mm. In order for these mid-level Pc textures to have lower gloss levels their depths must be deep enough to trap more light. These deeper depths also add more surface area which aids in trapping light on the parts surface. As Table XIV shows, textures with high Pc’s can have shallower depths and still maintain low gloss levels because the large number of peaks creates more surface area in which to trap light. However, in order for textures with low or mid-level Pc’s to achieve low gloss levels they must have deep texture depths.
Recommendations
According to the data collected, in order for a texture to pass both mar and gloss testing it must incorporate at least some of the unique texture characteristics identified in this study. First, the ideal texture will have to have random peaks. Random peaks will allow the texture to reflect light at different angles, resulting in lower gloss levels. Random peaks will also result in less marring on the parts surface due to less surface area being affected. Another characteristic of an ideal texture is a mid-level Pc. Textures with low Pc’s are less susceptible to marring but reflect more light. Textures with high Pc’s are lower in gloss, however, they are highly susceptible to marring. It is for these reasons that the mid-level Pc is recommended.
The ideal texture should also have character depths in the mid to deep range. Shallow textures, while good for gloss, are highly susceptible to marring. Textures are less susceptible to marring at deeper depths as they trap more light due to their increased surface area. This increased surface area results in a texture low in gloss with good mar resistance. Finally, the ideal texture should have rounded peaks. Round peaks allow the texture to resist marring and, when coupled with the other ideal characteristics, they can still achieve low gloss levels.
Textures are usually picked for their aesthetic qualities. When a designer picks a texture, analysis should be performed to identify the characteristics of that texture to show how the texture is likely to perform in the vehicle. This does not mean that because a texture looks nice but has character flaws it should not be used in a vehicle. It simply means that the texture may need to have some slight modifications done to it in order for it to perform well in its environment. If a designer or engineer is adamant about using a texture with character flaws, they should be made aware of the potential consequences for using that texture. Textures with performance flaws should be used in areas of the vehicle that are in low impact areas or as accent pieces. This will reduce the likelihood that the part will get marred and minimize its visibility in the vehicle.
In order for the ideal texture to be designed some compromises may need to be made. As the data shows, there is no perfect texture; however, any texture can be designed to perform better. For example, texture G4PP with medium-gloss(G4PPM) (Figure 13), performed well in mar testing, however, it failed gloss level testing (Table XV). Applying a secondary application, such as MicroMatte, to this texture allowed it to achieve an acceptable gloss level and still maintain its mar resistance (Figure 14). Figure 15 clearly shows the additional surface area created by the secondary micro-etching on texture G4PPM-2. The secondary application not only increased the Pc, it also increased the depth of the texture as well. Both of these changes helped texture G4PPM to pass both performance tests.
Figure 13: Texture G4PPM without secondary application.

Figure 14: Texture G4PPM with secondary application.
Table XV: Improvement to texture G4PPM by adding a secondary application.
Texture ID Texture Family
Grain Depth
Measured Gloss
Visual Gloss Level
Mar Susceptibility
Peak Count Randomness
of Peaks Shape of Peak
G3PPM Geometric .0045" 2.3 Medium 2 17 Non-Random Round
G3PPM-2 Geometric .0045" 2.0 Medium 2 20 Non-Random Sharp
Conclusion
The data gathered in this study should not be considered as absolute. There are many other variables that must be evaluated when considering a textures mar resistance and perceived gloss appearance, such as the parts material and its color. However, if a texture’s characteristics are considered early on in its development, the chances of success are much greater.
This research study was designed to identify the characteristics which may lead to a texture’s passing or failing performance testing and is meant to serve as a tool to help designers and engineers make effective texture choices. The researcher recommends that the choice to use, or modify, a texture should be based not only on the aesthetics of the texture, but on the research data as well.
Bibliography
1. VanLandingham, M. R. (). Scratch and Mar Resistance of Polymeric Materials. National Institute of Standards and Technology, pp. 1-36.
2. Taber Industries (n.d.). Surface Finish Testing. Retrieved January 28, 2008, from http://www.ccsi-inc.com/taberscratchmar_710.pdf.
3. Omnexus (2008). Scratch Resistance. Retrieved January 28, 2008, from http://www.omnexus.com/sds/Scratch-resistance-automotive/index.aspx.
4. Lau, E. (2008, January 16). Scratch and Mar Resistant Engineering Blends. Retrieved January 28, 2008, from http://slp.nist.gov/pic/Workshop08/lau.pdf.
5. American Society for Testing and Materials (2007). ASTM D7027-05 Standard Test Method for Evaluation of Scratch Resistance of Polymeric Coatings and Plastics Using an Instrumented Scratch Machine. Retrieved January 28, 2008, from http://www.astm.org/cgi-bin/SoftCart.exe/DATABASE.CART/REDLINE_PAGES/D7027.htm?E+mystore.
6. Arino, I., Kleist, U., Mattsson, L., & Rigdahl, M. (2005, October 01). On the Relation Between Surface Texture and Gloss of Injection-Molded Pigmented Plastics. Polymer Engineering and Science, pp. 1-2.
7. Glossmeters (2006). Gloss Introduction. Retrieved January 28, 2008, from http://www.gloss-meters.com/GlossIntro.html#1.
8. Tailored Lighting Inc. (2003, December 23). Lightbooth Tutorial. Retrieved January 30, 2008, from http://solux.net/edu7.htm.
9. Fraser, B. (2001, April 25). Out of Gamut: Why Is Color. Creative Pro, , . Retrieved January 30, 2008, from http://www.creativepro.com/printerfriendly/story/13036.html.
10. Mold-Tech (2008). Texture Process Information. Retrieved January 30, 2008, from http://www.mold-tech.com/texturing/gloss.php.

Appendix A
Study Definitions
220 Aluminum Oxide- Refers to the size of the aluminum oxide blast media; the larger the number the larger the
media is and the duller the surface gloss will be
3-Dimensional Scanner- Measures a surfaces profile, roughness, topography and thickness
4-to-1 Mix- A blast media used for glossing injection molds to a 3.0 surface gloss finish; the media is made up of 4-
parts glass bead and 1 part 220 aluminum oxide
ABS (Acrylonitrile Butadiene Styrene)- Thermoplastic used to make light, rigid, molded products
Aluminum Oxide- An abrasive material made of aluminum; used in the cleaning and glossing of textured injection
molds; produces a dull, matte surface finish
D65 Light- An artificial light source used to evaluate plastic parts; corresponds roughly to a midday sun
Glass Bead- Made from lead-free, soda lime-type glass, which is made into preformed ball shapes; produces a
bright, smooth surface finish.
Gloss Media- Material used on the finished textured surface of the mold to achieve the optimum gloss level
Gloss Meter- Device used to measure the amount of light reflecting off of a surface
Gloss- The amount of light reflected off of a surface
Injection Molded- A manufacturing technique for making parts from both thermoplastic and thermosetting plastic
materials in production
Light Booth- standardized source of light for performing visual evaluations of automotive parts
Mar- A disfiguring mark; a blemish
Mar Testing- Method used to test a textures propensity for marring; a visually subjective test.
Scratch and Mar Tester (Taber 710 Scratch and Mar Tester) - Machine used to measure the susceptibility of
material surfaces to scratching, marring and gouging
OEM (Original Equipment Manufacturer) – An automobile manufacturer (i.e. Chrysler, General Motors, etc.)
P20 Steel- A pre hardened, high tensile tool steel; automotive industry standard for injection molded plastic parts
Peak- The highest area of the texture character
Peak Count (Pc)- The number of texture characters in a specified area
Perceived Gloss Level- The perception of the glossiness of a part, regardless of its measured reading; strictly visual
and subjective
Polypropylene- A thermoplastic polymer; the most commonly used polymer in injection molding interior automotive
parts
Profilometer- A device that measures the roughness of a surface
SAE J361- Procedure for Visual Evaluation of Interior and Exterior Automotive Trim
Texture- The visual and tactile quality of a surface
Topography- The configuration of a surface including its physical features
Valley- The lowest area of the texture character

Appendix B

Appendix C
SAE J361 Procedure for Visual Evaluation of Interior Automotive Parts

Appendix D
3-D Image of Animal Texture Family
Appendix E
3-D Image of Stipple Texture Family

Appendix F
3-D Image of Geometric Texture Family

Appendix G
Images of Animal Textures Used In This Study
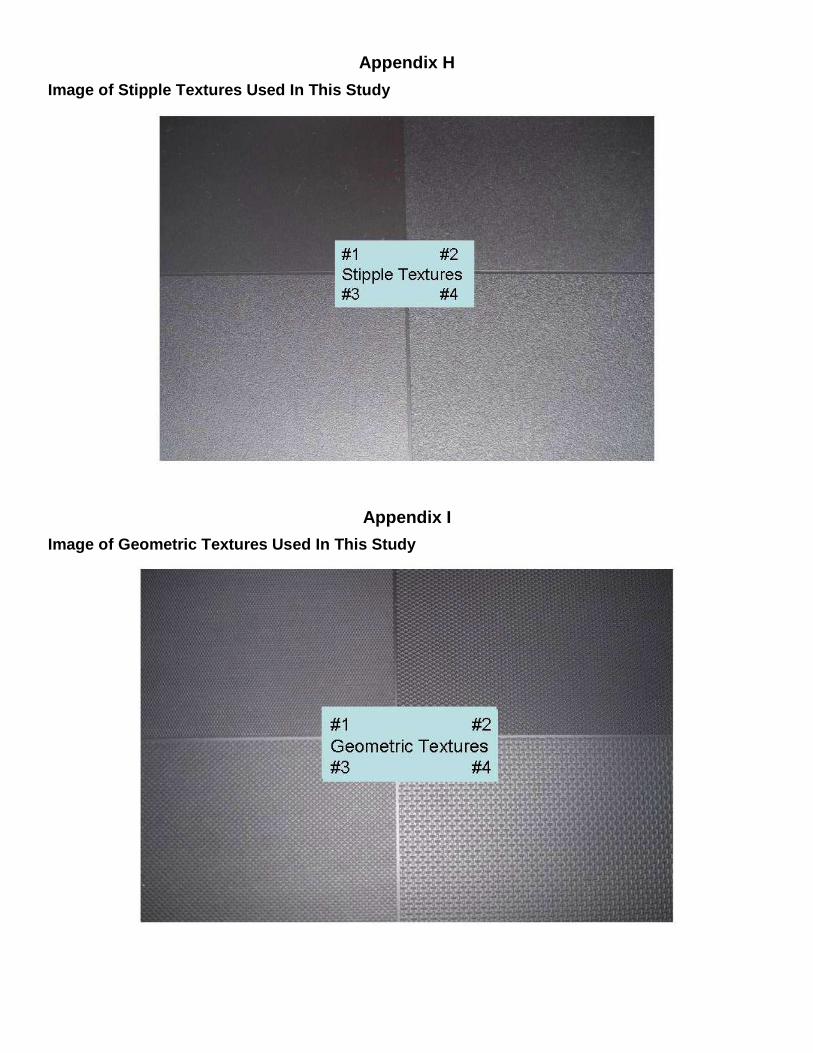
Appendix H
Image of Stipple Textures Used In This Study
Appendix I
Image of Geometric Textures Used In This Study
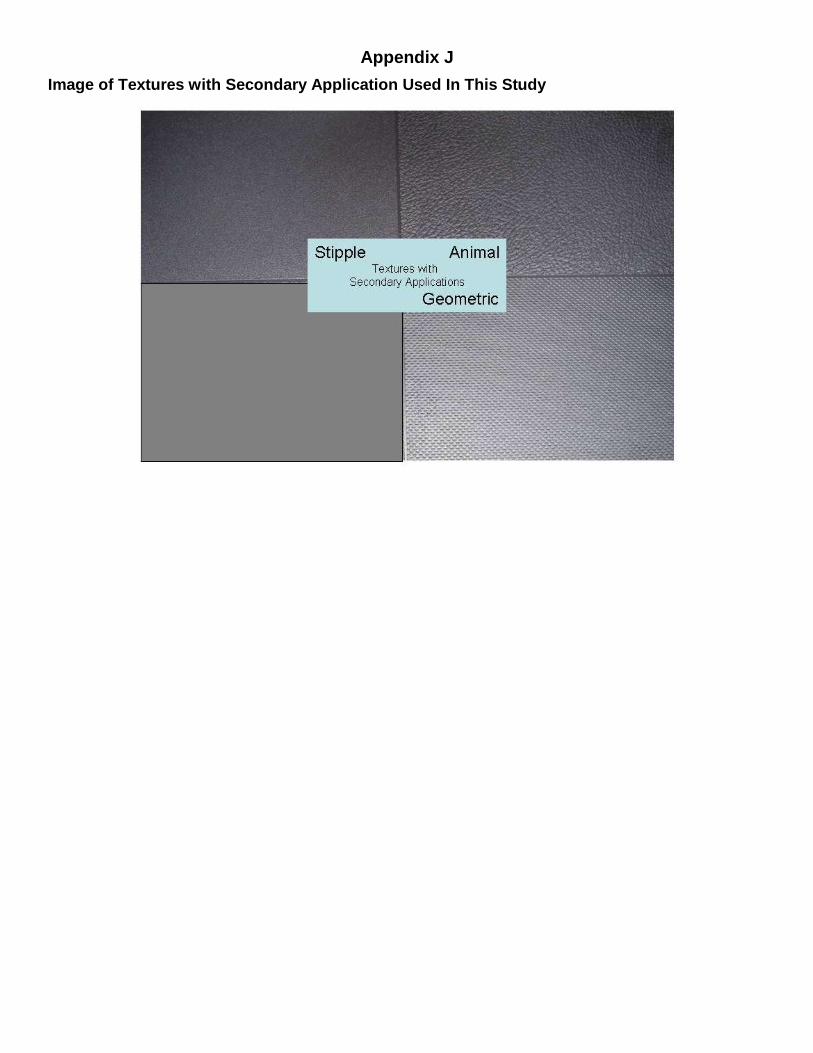
Appendix J
Image of Textures with Secondary Application Used In This Study


![Joint Texture and Depth Map Video Coding Based on the ...moncef/publications/Joint-Texture-ISCAS-2009.pdf · traditional 2D video applications, ... TV [1]. When transmitting 3D content](https://static.fdocuments.us/doc/165x107/5aa2324c7f8b9a80378cae05/joint-texture-and-depth-map-video-coding-based-on-the-moncefpublicationsjoint-texture-iscas-2009pdftraditional.jpg)

