AN IMPORTANT FUTURE SAND SOURCE FOR SOUTHEAST FLORIDA BEACHES - Florida Shore …€¦ · PORT...
23
PORT EVERGLADES SAND BYPASS PROJECT AN IMPORTANT FUTURE SAND SOURCE FOR SOUTHEAST FLORIDA BEACHES Christopher G. Creed, P.E. e-mail: [email protected] Steven C. Howard, P.E. e-mail: [email protected] Nicole S. Sharp, P.E. e-mail: [email protected] 28 th Annual National Conference on Beach Preservation Technology February 4, 2015 Clearwater Beach, FL
Transcript of AN IMPORTANT FUTURE SAND SOURCE FOR SOUTHEAST FLORIDA BEACHES - Florida Shore …€¦ · PORT...
PORT EVERGLADESSAND BYPASS PROJECT
AN IMPORTANT FUTURE SAND SOURCE FOR SOUTHEAST FLORIDA BEACHES
Christopher G. Creed, P.E.e-mail: [email protected]
Steven C. Howard, P.E.e-mail: [email protected]
Nicole S. Sharp, P.E.e-mail: [email protected]
28th Annual National Conference on Beach Preservation TechnologyFebruary 4, 2015Clearwater Beach, FL

FloridaClearwater Beach
PORT EVERGLADES INLET

Presentation Overview
Government Cut
Bakers Haulover
Port Everglades
Hillsboro Inlet
MIAMI-DADE COUNTY
BROWARD COUNTY
• Sand Requirements in Southeast Florida
• Known, Available Sand Sources
• Port Everglades Sand Bypass Project
• Physical and Economic Benefits of Port Everglades Sand Bypass Project

Government Cut
Bakers Haulover
Port Everglades
MIAMI-DADE COUNTY
BROWARD COUNTY
1,110,000 cy
900,000 cy
Hillsboro Inlet
650,000 cy
500,000 cy
2,050,000 cy
560,000 cy
550,000 cy
Current Sand Requirement

Future Sand Requirement
Government Cut
Bakers Haulover
Port Everglades
Hillsboro Inlet
255,000 cy/yr
210,000 cy/yr
130,000 cy/yr
40,000 cy/yr
40,000 cy/yr
205,000 cy/yr
50,000 cy/yr
MIAMI-DADE COUNTY
BROWARD COUNTY
Ref: Southeast Florida Sediment Assessment and NeedsDetermination (SAND) Study (FDEP and USACE, 2012)
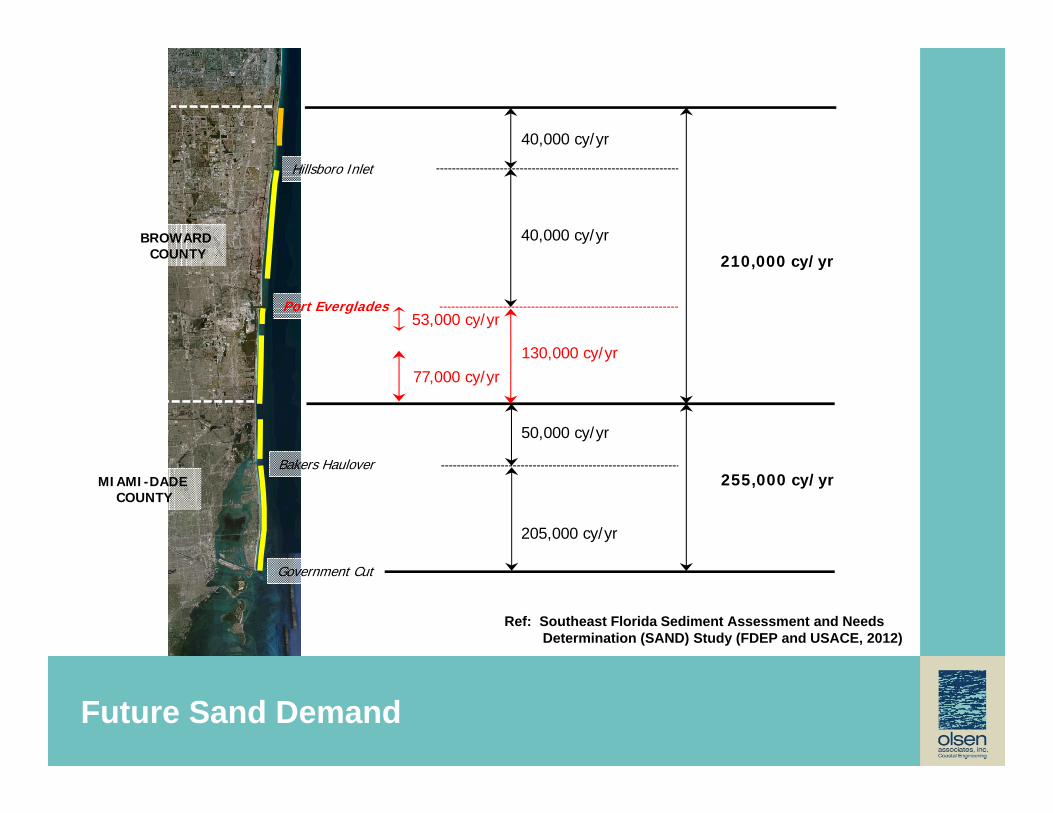
Future Sand Demand
Government Cut
Bakers Haulover
Port Everglades
Hillsboro Inlet
255,000 cy/yr
210,000 cy/yr
130,000 cy/yr
40,000 cy/yr
40,000 cy/yr
205,000 cy/yr
50,000 cy/yr
Ref: Southeast Florida Sediment Assessment and NeedsDetermination (SAND) Study (FDEP and USACE, 2012)
MIAMI-DADE COUNTY
BROWARD COUNTY
77,000 cy/yr
53,000 cy/yr

Government Cut
Bakers Haulover
Port Everglades
MIAMI-DADE COUNTY
BROWARD COUNTY
13,860,000 cy
7,400,000 cy
Hillsboro Inlet
2,650,000 cy
2,500,000 cy
12,550,000 cy
10,810,000 cy
3,050,000 cy
50-yr Requirement
3,850,000 cy/yr
2,650,000 cy/yr
Local = ~ 2.7 to 3.9 Mcy
Regional = ~ 26.4 Mcy
Lee
Martin
St.Lucie
ATLANTIC OCEAN
GULF OFMEXICO
FLORIDA
TAMPA
NAPLES
KEY WEST
Little Bahama Bank
GreatBahama
Bank
Broward
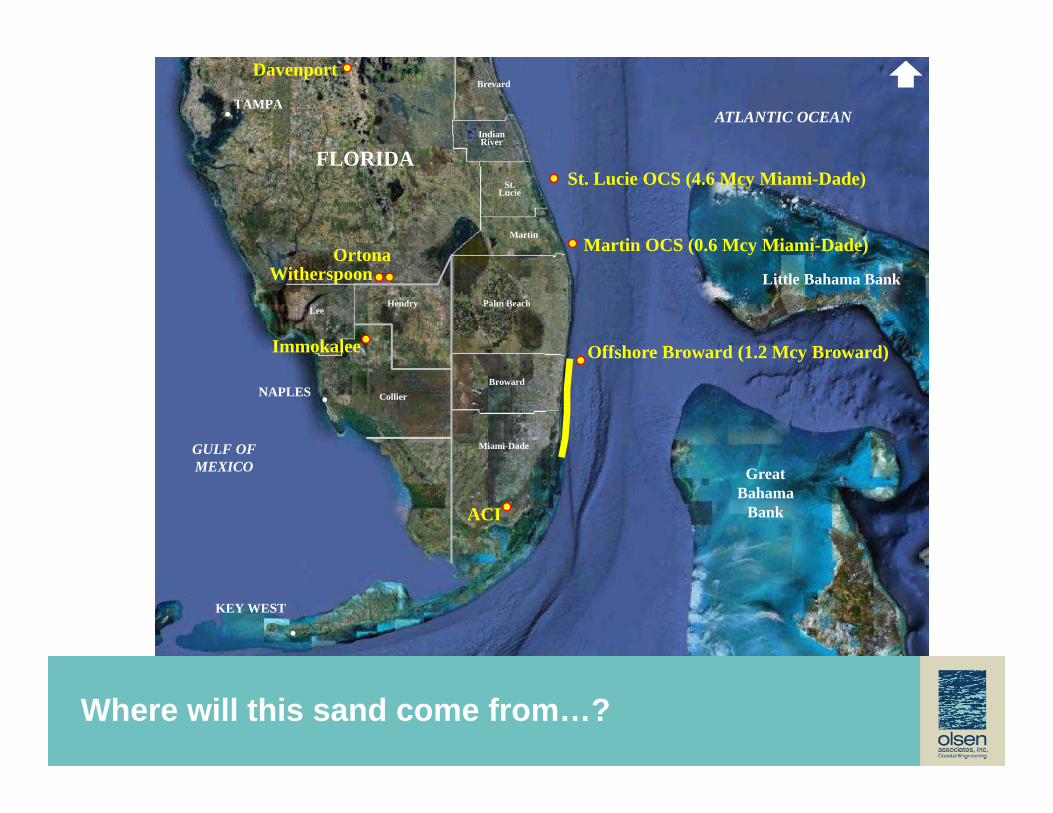
Where will this sand come from…?
Palm Beach
Miami-Dade
IndianRiver
Offshore Broward (1.2 Mcy Broward)
Collier
Hendry
Brevard
St. Lucie OCS (4.6 Mcy Miami-Dade)
Martin OCS (0.6 Mcy Miami-Dade)Witherspoon
Davenport
Ortona
Immokalee
ACI
Government Cut
Bakers Haulover
Port Everglades
MIAMI-DADE COUNTY
BROWARD COUNTY
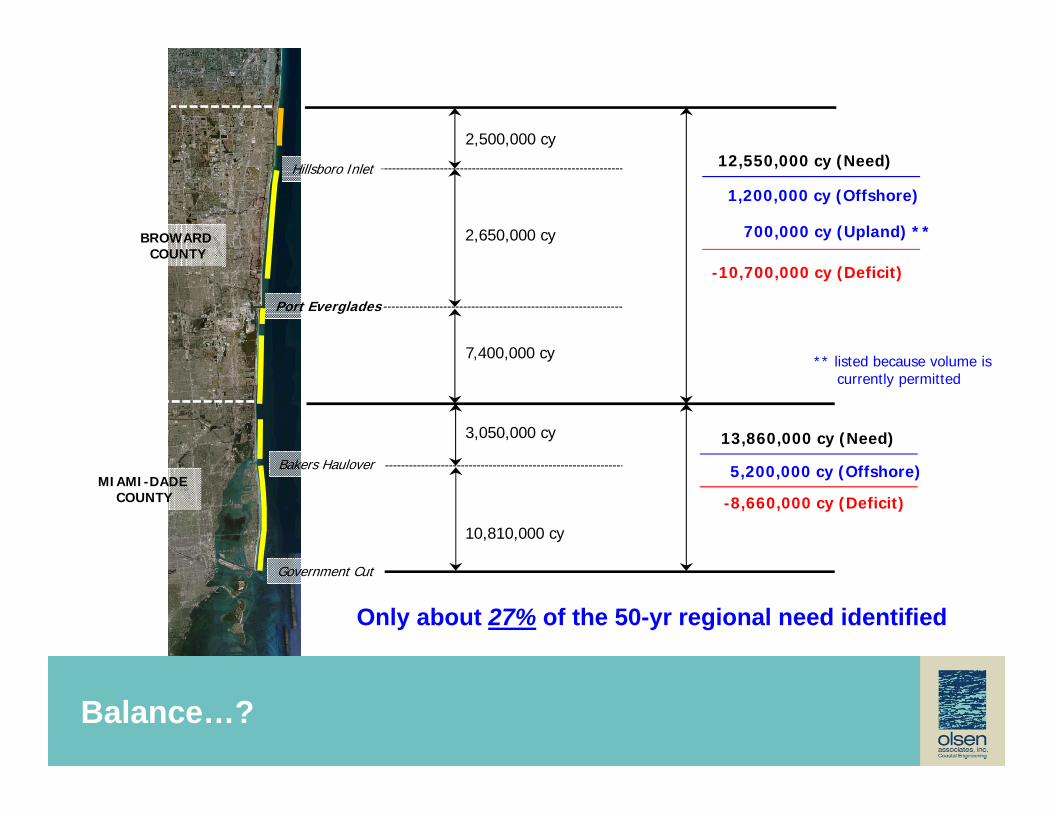
13,860,000 cy (Need)
7,400,000 cy
Hillsboro Inlet
2,650,000 cy
2,500,000 cy12,550,000 cy (Need)
10,810,000 cy
3,050,000 cy
Balance…?
1,200,000 cy (Offshore)
-10,700,000 cy (Deficit)
5,200,000 cy (Offshore)
-8,660,000 cy (Deficit)
Only about 27% of the 50-yr regional need identified
700,000 cy (Upland) **
** listed because volume iscurrently permitted

Lee
Martin
St.Lucie
ATLANTIC OCEAN
GULF OFMEXICO
FLORIDA
TAMPA
NAPLES
KEY WEST
Little Bahama Bank
GreatBahama
Bank
Broward
How will deficit be made up…?
Port Everglades
Ocean Cay
Palm Beach
Miami-Dade
IndianRiver
Collier
Hendry
Brevard
Witherspoon
Davenport
Ortona
Immokalee
ACI

• Inlet established in 1926
• Federal Navigation Project 1930
• Major Expansions in 1962 and 1980
• No Natural or Artificial Sand Bypassing
• Complete Barrier to Littoral Drift
• Highly Accretional North Shoreline
• Chronically Erosional South Shoreline
• Low, Porous North Jetty
• Persistent Shoaling in Federal Channel
PORT EVERGLADES INLET
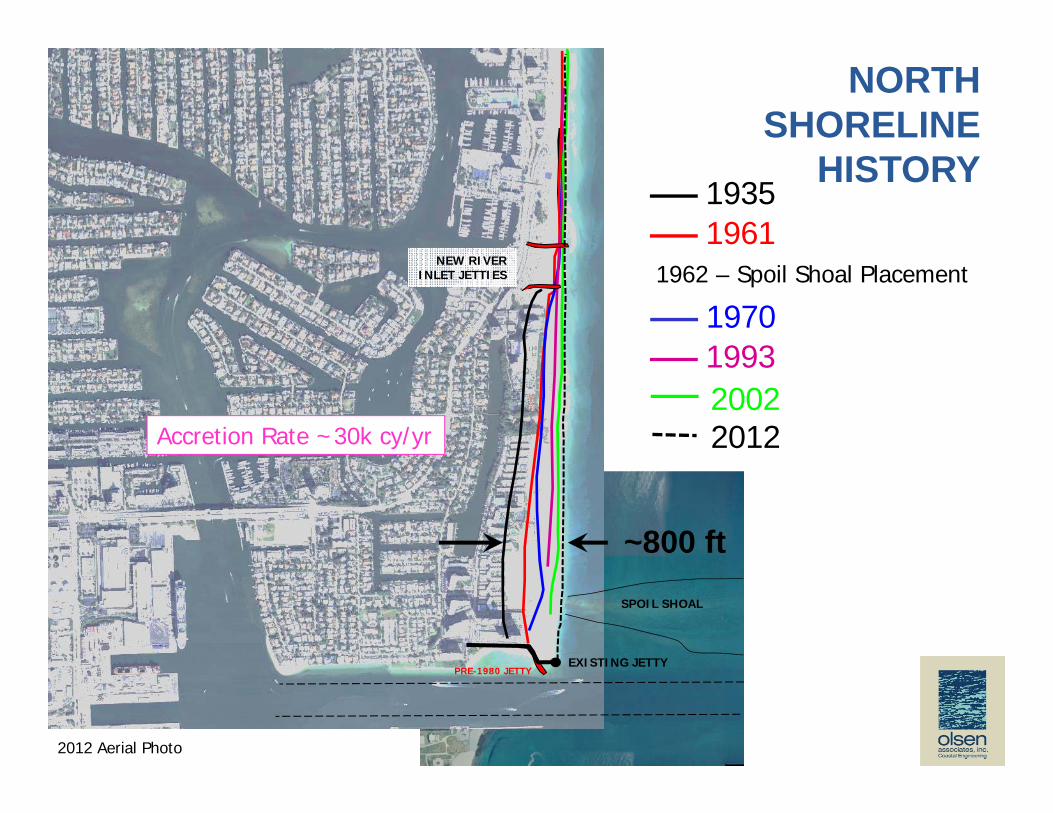
19351961
197019932002
NORTH SHORELINE
HISTORY
NEW RIVERINLET JETTIES
PRE-1980 JETTY
~800 ft
2012 Aerial Photo
EXISTING JETTY
1962 – Spoil Shoal Placement
2012
SPOIL SHOAL
Accretion Rate ~30k cy/yr

INLET SHOALING(Sand Transport Over, Through, and Around North Jetty)

INLET SHOALING(Sand Transport Over, Through, and Around North Jetty)
-15
640,
000
640,
500
641,
000
641,
500
642,
000
Nor
thin
g (ft
, NAD
83)
Erosion Accretion
South Jetty
Port Everglades
Federal ChannelLimits (typ.)
Port Everglades Entrance Channel
Ft. LauderdaleNorth Jetty
JUL BeachState Park
Shoaling Rate ~20k+ cy/yr

Apparent landwardlimit of uprush (typ.)
Storm-related sand deposition(Evidence of significant sand transportover and through low, leaky north jetty)
October 29, 2012Post-Hurricane Sandy
Fort Lauderdale
POA II
Inlet system captures between 40k and 60k cy/yr(~90% of the net southerly sand transport)
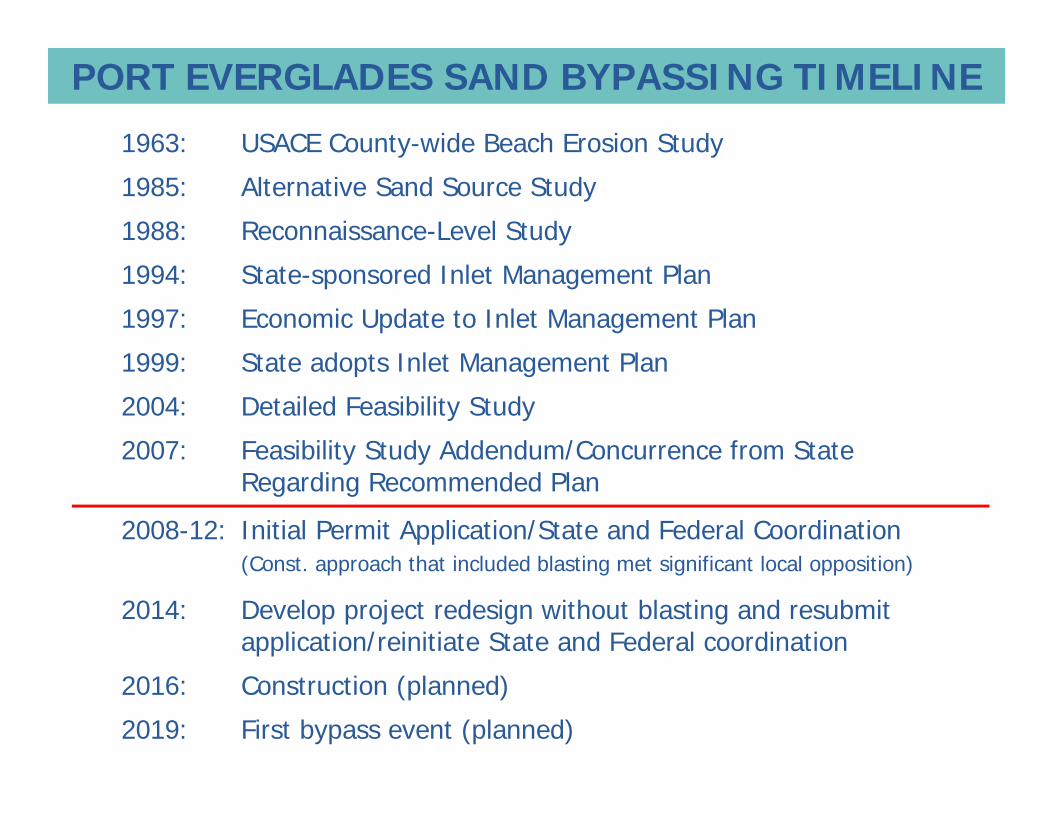
PORT EVERGLADES SAND BYPASSING TIMELINE
1963: USACE County-wide Beach Erosion Study
1985: Alternative Sand Source Study
1988: Reconnaissance-Level Study
1994: State-sponsored Inlet Management Plan
1997: Economic Update to Inlet Management Plan
1999: State adopts Inlet Management Plan
2004: Detailed Feasibility Study
2007: Feasibility Study Addendum/Concurrence from StateRegarding Recommended Plan
2008-12: Initial Permit Application/State and Federal Coordination(Const. approach that included blasting met significant local opposition)
2014: Develop project redesign without blasting and resubmitapplication/reinitiate State and Federal coordination
2016: Construction (planned)
2019: First bypass event (planned)
PROJECT NEED AND PURPOSE
• Reestablish a significant portion of the sand-sharing system across Port Everglades Inlet
• Reduce the need for sand from remote sources
• Reduce the long-term beach management costs
• Reduce/eliminate shoaling of the Federal channel

Improve North Jetty(Heighten/Tighten/Extend)
PRINCIPAL INITIAL PROJECT ELEMENTS
Sand Trap
Modify Rubble Shoal
40,000 to 60,000 cy/yr
Federal ChannelLimits (typ.) Port Everglades Entrance Channel
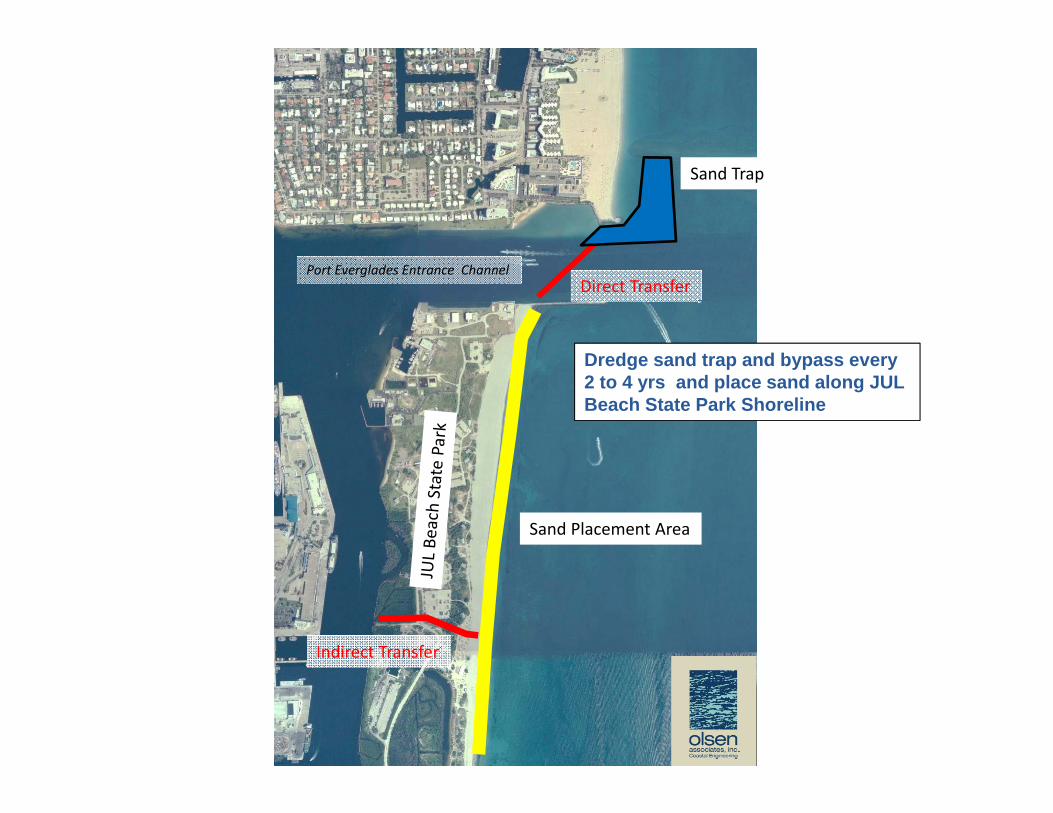
Dredge sand trap and bypass every 2 to 4 yrs and place sand along JUL Beach State Park Shoreline
Sand Trap
Sand Placement Area
Port Everglades Entrance Channel
Indirect Transfer
Direct Transfer
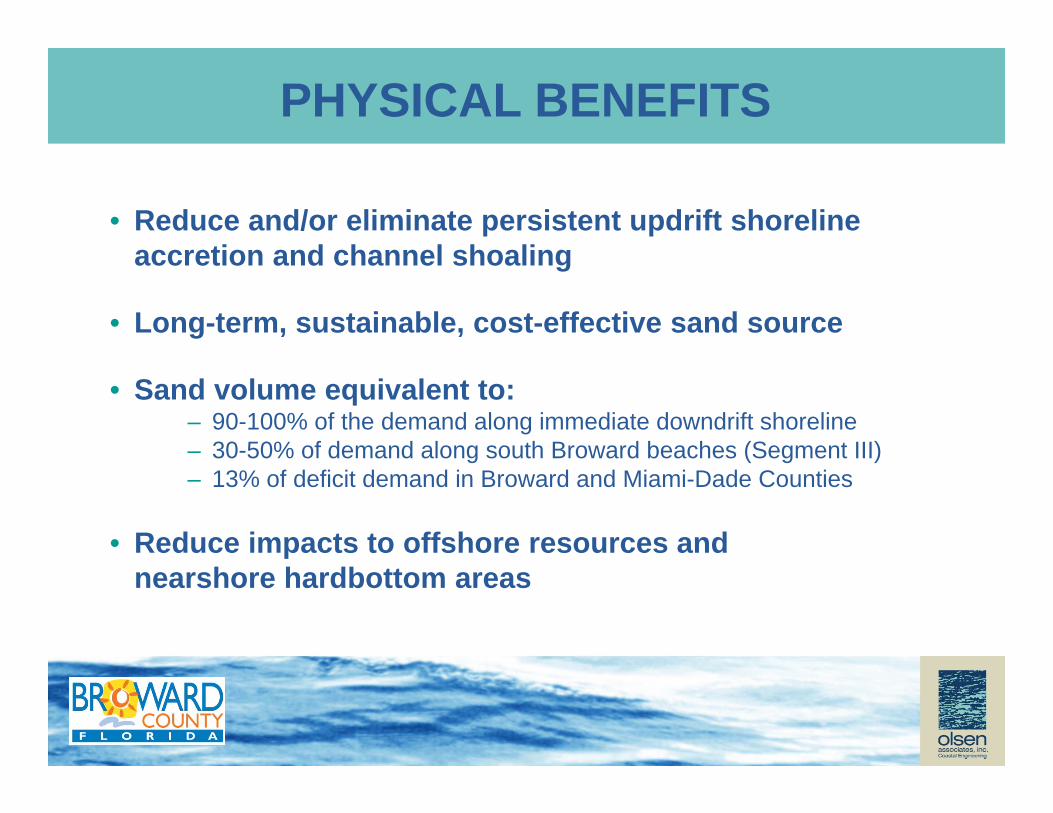
• Reduce and/or eliminate persistent updrift shoreline accretion and channel shoaling
• Long-term, sustainable, cost-effective sand source
• Sand volume equivalent to:– 90-100% of the demand along immediate downdrift shoreline– 30-50% of demand along south Broward beaches (Segment III)– 13% of deficit demand in Broward and Miami-Dade Counties
• Reduce impacts to offshore resources and nearshore hardbottom areas
PHYSICAL BENEFITS
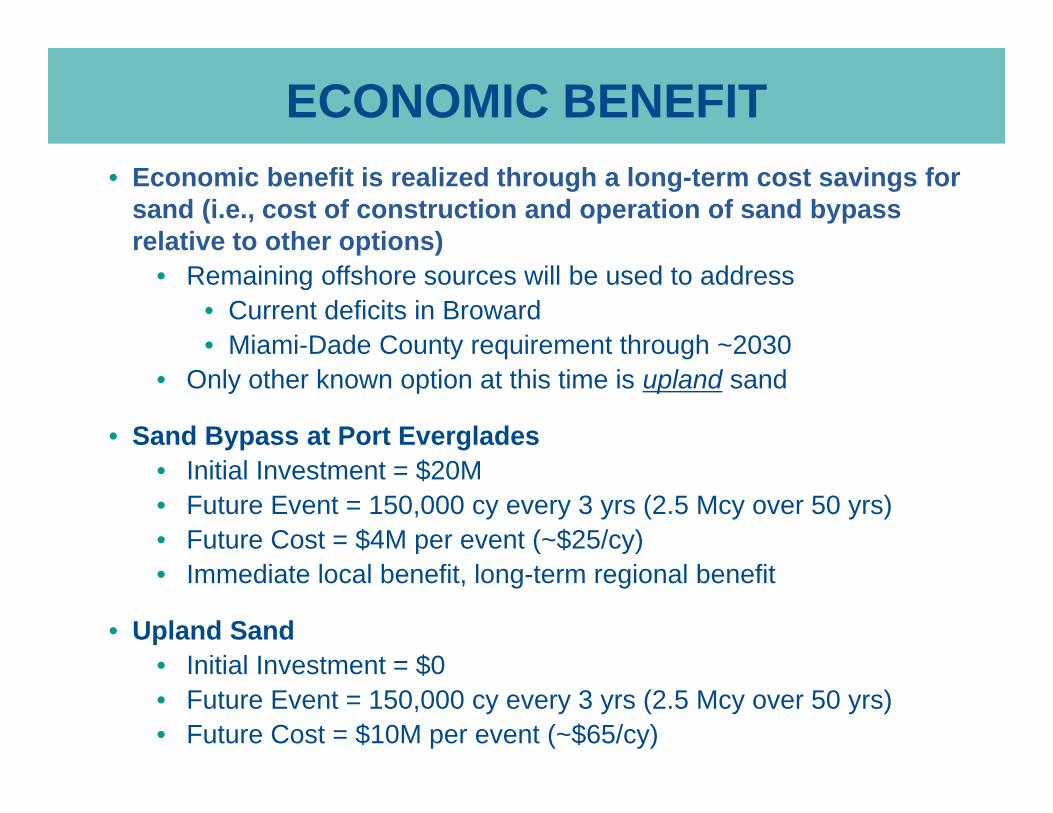
ECONOMIC BENEFIT• Economic benefit is realized through a long-term cost savings for
sand (i.e., cost of construction and operation of sand bypass relative to other options)
• Remaining offshore sources will be used to address• Current deficits in Broward• Miami-Dade County requirement through ~2030
• Only other known option at this time is upland sand
• Sand Bypass at Port Everglades• Initial Investment = $20M• Future Event = 150,000 cy every 3 yrs (2.5 Mcy over 50 yrs)• Future Cost = $4M per event (~$25/cy)• Immediate local benefit, long-term regional benefit
• Upland Sand• Initial Investment = $0• Future Event = 150,000 cy every 3 yrs (2.5 Mcy over 50 yrs)• Future Cost = $10M per event (~$65/cy)

Relative to upland sand, the bypass project is expected to save ~1.3M annually, or about $30M over a 50-year period.
14
ECONOMIC BENEFIT
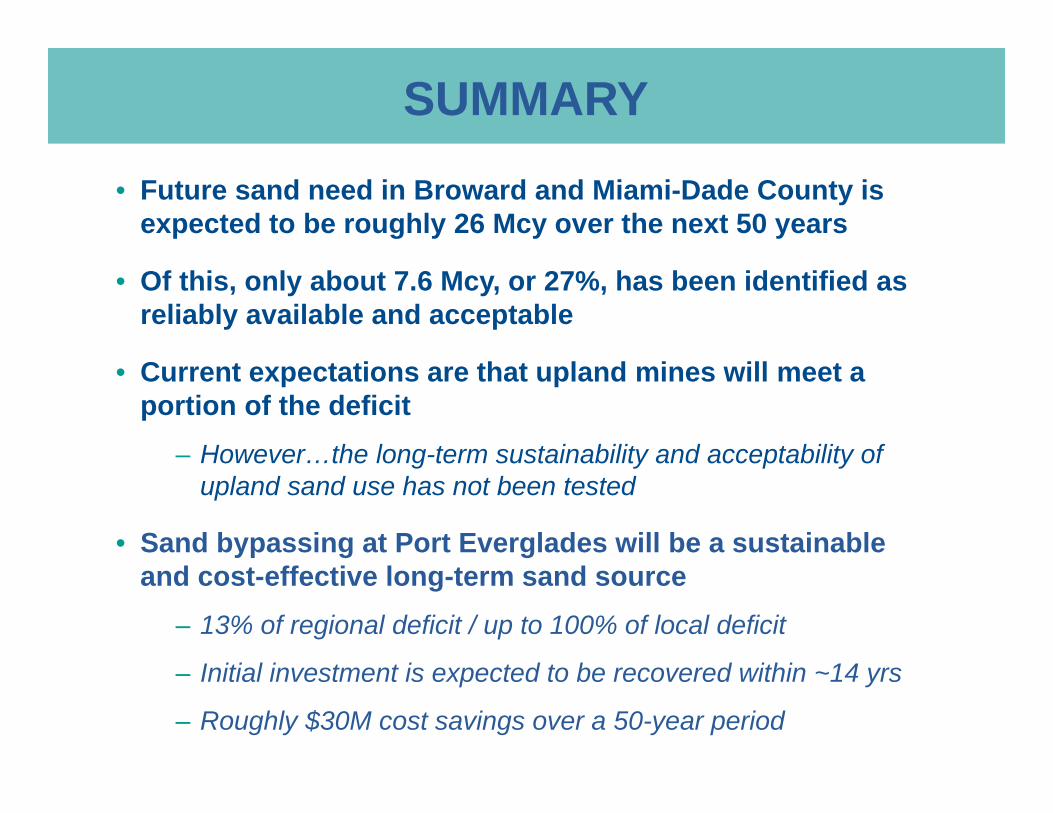
SUMMARY
• Future sand need in Broward and Miami-Dade County is expected to be roughly 26 Mcy over the next 50 years
• Of this, only about 7.6 Mcy, or 27%, has been identified as reliably available and acceptable
• Current expectations are that upland mines will meet a portion of the deficit
– However…the long-term sustainability and acceptability of upland sand use has not been tested
• Sand bypassing at Port Everglades will be a sustainable and cost-effective long-term sand source
– 13% of regional deficit / up to 100% of local deficit
– Initial investment is expected to be recovered within ~14 yrs
– Roughly $30M cost savings over a 50-year period