An Implementation Strategy for the California Ocean ... · An Implementation Strategy . for the ....
28
An Implementation Strategy for the California Ocean Protection Council Resolution to Reduce and Prevent Ocean Litter Prepared by: California Ocean Protection Council in consultation with California Marine Debris Steering Committee and Gordon Environmental Consulting November 20, 2008
Transcript of An Implementation Strategy for the California Ocean ... · An Implementation Strategy . for the ....

An Implementation Strategy
for the California Ocean Protection Council
Resolution to Reduce and Prevent Ocean Litter
Prepared by: California Ocean Protection Council
in consultation with
California Marine Debris Steering Committee and
Gordon Environmental Consulting
November 20, 2008
An Implementation Strategy to Reduce and Prevent Ocean Litter
TABLE OF CONTENTS Section Page Number Introduction
Ocean Litter: Quantity, Impacts, and Costs 3 OPC Resolution to Prevent and Reduce Ocean Litter 5 Overview of the Implementation Strategy 5 Three Priority Actions for Measurable Success 6
• Priority Action #1 – Implement a producer take-back (EPR) program for convenience food packaging 6
• Priority Action #2 – Prohibit single-use products that pose significant ocean litter impacts where a feasible less damaging alternative is available
7
• Priority Action #3 – Assess fees on commonly littered items 9 Measuring Success 9
Objective 1: Reduce Single-Use Packaging and Promote Sustainable Alternatives – Change Producer Behavior 10
Table of Actions to Implement Objective #1 16 Objective 2: Prevent and Control Litter and Plastic Debris –
Change Individual Behavior 17
Table of Actions to Implement Objective #2 20 Objective 3: Cleanup and Remove Ocean Litter –
Engage Communities 21
Table of Actions to Implement Objective #3 23 Objective 4: Coordinate with Other Jurisdictions in the Pacific Region- Engage Other Regions 24
Table of Actions to Implement Objective #4 24 Front page photo credits: Derelict fishing net in Pacific Ocean – Algalita Marine Research Foundation Pinniped trapped in fishing gear – National Oceanic and Atmospheric Administration Ballona Creek trash removal – Bill MacDonald, Algalita Marine Research Foundation
2
An Implementation Strategy to Reduce and Prevent Ocean Litter
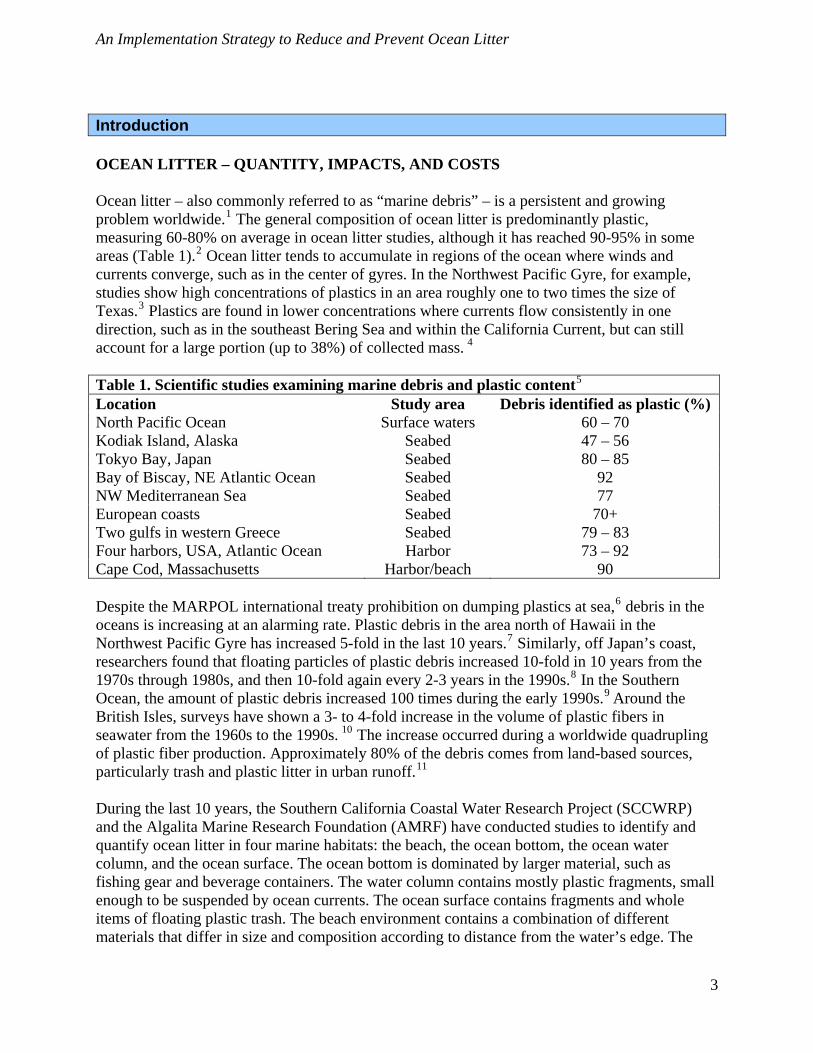
Introduction OCEAN LITTER – QUANTITY, IMPACTS, AND COSTS Ocean litter – also commonly referred to as “marine debris” – is a persistent and growing problem worldwide.1 The general composition of ocean litter is predominantly plastic, measuring 60-80% on average in ocean litter studies, although it has reached 90-95% in some areas (Table 1).2 Ocean litter tends to accumulate in regions of the ocean where winds and currents converge, such as in the center of gyres. In the Northwest Pacific Gyre, for example, studies show high concentrations of plastics in an area roughly one to two times the size of Texas.3 Plastics are found in lower concentrations where currents flow consistently in one direction, such as in the southeast Bering Sea and within the California Current, but can still account for a large portion (up to 4 38%) of collected mass. Table 1. Scientific studies examining marine debris and plastic content5 Location Study area Debris identified as plastic (%) North Pacific Ocean Surface waters 60 – 70 Kodiak Island, Alaska Seabed 47 – 56 Tokyo Bay, Japan Seabed 80 – 85 Bay of Biscay, NE Atlantic Ocean Seabed 92 NW Mediterranean Sea Seabed 77 European coasts Seabed 70+ Two gulfs in western Greece Seabed 79 – 83 Four harbors, USA, Atlantic Ocean Harbor 73 – 92 Cape Cod, Massachusetts Harbor/beach 90 Despite the MARPOL international treaty prohibition on dumping plastics at sea,6 debris in the oceans is increasing at an alarming rate. Plastic debris in the area north of Hawaii in the Northwest Pacific Gyre has increased 5-fold in the last 10 years.7 Similarly, off Japan’s coast, researchers found that floating particles of plastic debris increased 10-fold in 10 years from the 1970s through 1980s, and then 10-fold again every 2-3 years in the 1990s.8 In the Southern Ocean, the amount of plastic debris increased 100 times during the early 1990s.9 Around the British Isles, surveys have shown a 3- to 4-fold increase in the volume of plastic fibers in seawater from the 1960s to the 1990s. 10 The increase occurred during a worldwide quadrupling of plastic fiber production. Approximately 80% of the debris comes from land-based sources, particularly trash and plastic litter in urban runoff.11 During the last 10 years, the Southern California Coastal Water Research Project (SCCWRP) and the Algalita Marine Research Foundation (AMRF) have conducted studies to identify and quantify ocean litter in four marine habitats: the beach, the ocean bottom, the ocean water column, and the ocean surface. The ocean bottom is dominated by larger material, such as fishing gear and beverage containers. The water column contains mostly plastic fragments, small enough to be suspended by ocean currents. The ocean surface contains fragments and whole items of floating plastic trash. The beach environment contains a combination of different materials that differ in size and composition according to distance from the water’s edge. The
3

An Implementation Strategy to Reduce and Prevent Ocean Litter
environmental impacts associated with ocean litter vary by habitat, with aesthetic issues being more important on beaches and threats to the food web being a larger concern for the material found in the water column and on the ocean surface.12 Ocean litter has been shown to affect at least 267 species worldwide, including sea turtles, seabirds and marine mammals. The impacts include fatalities as a result of ingestion, starvation, suffocation, infection, drowning, and entanglement.13 Studies of the impacts of plastic bags have identified the following problems: death of whales by ingestion,14 use by birds as nesting material15 and blockage of sea turtle hatchling migration.16 Seabirds that feed on or near the ocean surface are especially prone to ingesting plastic debris that floats. The laysan albatross, black-footed albatross and northern fulmar frequently ingest a wide array of plastics including bottle caps, cigarette lighters, toys, party balloons, and other fragments of consumer goods. Adults feed these items to their chicks that then often die of starvation because their stomachs become filled with debris.17 One study found approximately 98% of chicks sampled contained plastic and the quantity of plastic being ingested by seabirds was increasing.18 Other species of sea bird – such as phalaropes, shearwaters and auklets – ingest small fragments of plastic consumer products and pre-production industrial plastic pellets.19 Because persistent organic pollutants in the marine environment attach to plastic debris, plastic pellets and fragments have been found to be a transport mechanism for toxic substances in the marine environment.20 Floating and migrating debris has also been found to transport invasive marine species.21 Economic impacts associated with ocean litter are also significant. Public agencies in California spend millions annually on litter cleanup.22 In the 2005-2006 fiscal year, Caltrans spent $55 million to remove litter and debris from roadsides and highways, some of which would have otherwise drained to the ocean. The County of Los Angeles (L.A.) Department of Public Works and the Flood Control District spend $18 million annually on street sweeping, catch basin cleanouts, cleanup programs, and litter prevention and education efforts.23 In addition to cleaning trash out of sewer systems, catch basins and other structures designed to trap trash from storm water, some coastal communities spend considerable funds on beach cleaning. For example, L.A. County collects over 4,000 tons of trash annually on its beaches, and in 1994, spent over $4 million to clean 31 miles of beaches.24 In 2001, the L.A. Regional Water Quality Control Board adopted a trash Total Maximum Daily Load (TMDL) for the Los Angeles River and Ballona Creek that requires municipalities and Caltrans to implement a 10-year plan to reduce the amount of trash discharged to these water-bodies to a level of zero. Caltrans’ projected annual costs for complying with this TMDL for highways is $300 million while the City of L.A. projects that its TMDL compliance costs are $125 million per year.25 To date, Southern California cities have spent in excess of $1.7 billion in meeting TMDLs for trash in impaired waterways.26 The National Ocean Economics Program calculated the value of California’s “ocean-dependent economy” at $46 billion. The largest portion of this figure was attributable to recreation. 27 While California has never assessed the loss of tourism dollars associated with littered beaches and coastal areas, data from other states indicate that these impacts can be significant. A release
4
An Implementation Strategy to Reduce and Prevent Ocean Litter
of trash from New York landfills to the ocean caused major debris incidents on New Jersey beaches and resulted in an estimated revenue loss of $1 billion, primarily due to decreased coastal visitation in 1987 and 1988. This implementation strategy is aimed at all ocean litter, but with a particular focus on plastic litter. First, as the statistics cited show, the majority of ocean litter is made of plastic. Second, while all litter is undesirable, paper is made of wood pulp that naturally biodegrades in the ocean. Plastic, on the other hand, is engineered to resist biodegradation so the problems it causes persist long after the original product served its intended purpose. OPC RESOLUTION TO REDUCE AND PREVENT OCEAN LITTER Recognizing the need for immediate and decisive action, the Ocean Protection Council (OPC) adopted a resolution on “Reducing and Preventing Marine Debris” (hereafter, “the OPC Resolution”) on February 8, 2007. This implementation strategy is designed to provide a pathway to implementing the recommendations in the OPC Resolution. The OPC Resolution recognizes that ocean litter poses serious threats to the health of California’s coastal waters and the ocean, significantly impacts marine wildlife, requires state and local agencies to spend millions of dollars each year to clean beaches, rivers, and storm water, and poses threats to public health and welfare. The OPC Resolution called for the OPC to chair a Marine Debris Steering Committee (hereafter, “Steering Committee”) to prepare a plan to implement the OPC Resolution.28 The Steering Committee, comprised of representatives from state agencies – including the California Coastal Commission (CCC), California Integrated Waste Management Board (CIWMB), Department of Conservation (DOC), Department of Toxic Substances Control (DTSC), State Water Resources Control Board (SWRCB or Water Board), California State Parks, and Department of Transportation (Caltrans) – along with Keep California Beautiful, was charged with reporting back to the OPC on its recommendations. This document is composed of those recommendations.
OVERVIEW OF THE IMPLEMENTATION STRATEGY This Implementation Strategy organizes specific actions to reduce ocean litter into four objectives (Box 1). Each objective is accompanied by specific actions and implementation tasks, as well as the obstacles related to each action. A chart of the actions, implementation tasks and obstacles is provided under each objective. The chart also indicates which section of the OPC Resolution would be addressed by the proposed action. Implementers of the actions contained in this strategy will be asked to report back to the OPC on their progress.
5
An Implementation Strategy to Reduce and Prevent Ocean Litter
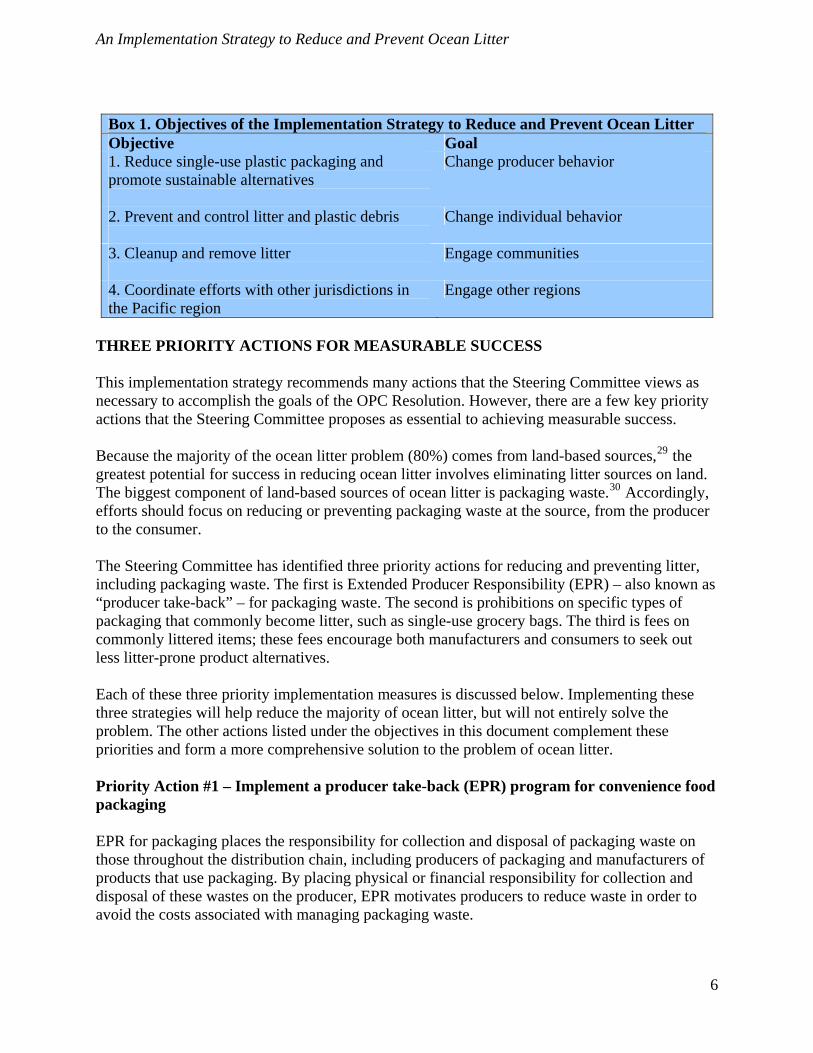
Box 1. Objectives of the Implementation Strategy to Reduce and Prevent Ocean Litter Objective Goal 1. Reduce single-use plastic packaging and promote sustainable alternatives
Change producer behavior
2. Prevent and control litter and plastic debris
Change individual behavior
3. Cleanup and remove litter
Engage communities
4. Coordinate efforts with other jurisdictions in the Pacific region
Engage other regions
THREE PRIORITY ACTIONS FOR MEASURABLE SUCCESS This implementation strategy recommends many actions that the Steering Committee views as necessary to accomplish the goals of the OPC Resolution. However, there are a few key priority actions that the Steering Committee proposes as essential to achieving measurable success. Because the majority of the ocean litter problem (80%) comes from land-based sources,29 the greatest potential for success in reducing ocean litter involves eliminating litter sources on land. The biggest component of land-based sources of ocean litter is packaging waste.30 Accordingly, efforts should focus on reducing or preventing packaging waste at the source, from the producer to the consumer. The Steering Committee has identified three priority actions for reducing and preventing litter, including packaging waste. The first is Extended Producer Responsibility (EPR) – also known as “producer take-back” – for packaging waste. The second is prohibitions on specific types of packaging that commonly become litter, such as single-use grocery bags. The third is fees on commonly littered items; these fees encourage both manufacturers and consumers to seek out less litter-prone product alternatives. Each of these three priority implementation measures is discussed below. Implementing these three strategies will help reduce the majority of ocean litter, but will not entirely solve the problem. The other actions listed under the objectives in this document complement these priorities and form a more comprehensive solution to the problem of ocean litter. Priority Action #1 – Implement a producer take-back (EPR) program for convenience food packaging
EPR for packaging places the responsibility for collection and disposal of packaging waste on those throughout the distribution chain, including producers of packaging and manufacturers of products that use packaging. By placing physical or financial responsibility for collection and disposal of these wastes on the producer, EPR motivates producers to reduce waste in order to avoid the costs associated with managing packaging waste.
6
An Implementation Strategy to Reduce and Prevent Ocean Litter
Producers can finance this increased responsibility as a general cost of doing business, through cost internalization or by recovering costs through arrangements with their distributors and retailers. The first national implementation of EPR for packaging occurred in Germany where a 14% reduction in packaging waste was achieved in the first four years of the program.31 By comparison, the U.S. Environmental Protection Agency (U.S. EPA) reports that from 1960 to 2006 packaging waste generation in the United States increased from 27,000 to 79,000 tons (293%).32 Food containers and packaging are the largest component of the municipal solid waste stream (80 million tons or 31.7 %).33 Although market research shows plastics comprised 17% of all food and beverage packaging in 2006,34 debris studies conducted on Orange County beaches identified plastic food and beverage packaging as the most prevalent items collected after plastic pellets.35 Similar results were found in a year-long study conducted on Santa CCounty beaches in which plastic items were the most numerous items colle 36
ruz cted.
Policies aimed at preventing convenience food packaging waste from being generated will reduce ocean litter, and will also reduce greenhouse gas emissions, resource depletion and fossil fuel dependency. The OPC believes that CIWMB should have the authority to adopt EPR regulations and oversee product-specific stewardship programs. Under such regulations, producers would develop product stewardship programs that have common features such as target-setting and public accountability but which would be tailored to reflect market conditions for that product category. The OPC believes that CIWMB should prioritize EPR for packaging waste, to the extent feasible. Priority Action #2 – Prohibit single-use products that pose significant ocean litter impacts where a feasible less damaging alternative is available (see Objective 1) Single-use plastic bags and other packaging, such as polystyrene food take-out containers, are increasingly being targeted for bans by coastal communities in California and elsewhere as studies show these items to be significant components of litter and beach debris. Plastic bags are also known to pose a significant threat to marine wildlife, as discussed above. Communities that have banned these products often argue that the utility and convenience value of the product are outweighed by its negative environmental impacts. Better, safer alternatives to single-use plastic bags and polystyrene take-out containers are available, including reusable bags and containers, and should be encouraged.
• Polystyrene Food Packaging Prohibition Increasingly, coastal communities in the United States and other countries are prohibiting the free distribution of packaging items made with polystyrene. Polystyrene is a type of plastic frequently used in food packaging such as clear plastic cups, trays and clamshells (commonly used for sandwiches and salads). Foamed plastics, such as expanded polystyrene (EPS) and Styrofoam™ (extruded polystyrene), are also frequently used in food packaging due to their light weight and insulating qualities. According to the CIWMB, Californians use 165,000 tons of polystyrene each year for packaging and food service purposes alone, with no meaningful recycling of food service polystyrene. 37 In 1999, an estimated 300,000 tons of polystyrene (0.8% of total waste) was disposed of in landfills, with a total disposal cost of $30 million.38 Because this material is non-
7
An Implementation Strategy to Reduce and Prevent Ocean Litter
biodegradable, it lasts for hundreds of years and if carried downstream to sea, can float hundreds of miles in the ocean. A 1998–2000 Caltrans study found that polystyrene represented 15% of the total volume of litter recovered from storm drains. 39 Studies have increasingly found that this type of expanded plastic can have detrimental effects on marine wildlife, as discussed above. Prohibitions on both polystyrene and foamed plastic food container packaging have been implemented in many jurisdictions throughout California. The 2008 San Francisco Litter Audit revealed a 36% reduction in polystyrene litter since the material was banned there in 2007. 40 It is clear that prohibitions on polystyrene take-out food packaging are being used increasingly to reduce local litter problems, and that statewide action is necessary to make these local efforts more effective in neighboring cities and unincorporated areas. The OPC believes that a statewide prohibition on polystyrene take-out food packaging should be adopted. As the details of the prohibition are developed, the impacts on jobs and the economy should be considered as the implementation schedules are developed. • Plastic Bag Fee According to the Progressive Bag Alliance and CIWMB, 19 billion plastic grocery bags are distributed in California each year and, as of 2001, fewer than 5% are recycled.41 Even if individuals choose to re-use these bags once or twice, the remainder still becomes either landfill or litter. The 2007 International Coastal Cleanup (ICC) report produced by the Ocean Conservancy found that bags were the fourth most common debris item collected worldwide during the coastal cleanup event behind cigarettes, food wrappers/containers, and caps/lids. 42 However, according to the ICC report, bags were by far the most common dangerous debris item (i.e., capable of harming wildlife and humans) collected worldwide. Another volunteer beach cleanup event organized by the Ocean Conservancy and funded by the U.S. EPA revealed that during the survey period from 2001-2006 the amount of general source items surveyed (including plastic bags, bands, plastic beverage bottles, plastic food bottles, plastic bleach/cleaner bottles, and other plastic bottles) increased 5.4% each year over the five-year period.43 This increase was observed despite results showing no significant change in the amount of other types of beach litter collected. This study examined mostly beaches in rural areas that are not as heavily influenced by urban run-off.
In 2007, Governor Schwarzenegger signed AB 2449 (Levine) that requires grocery stores to offer more recycling opportunities as an incentive to increase the very low recycling rate of plastic bags. The City of San Francisco had poor results with a voluntary bag recycling program and in 2007 prohibited the distribution of single-use plastic bags. The OPC believes that California should require a fee for all single-use plastic and paper bags as a further incentive for people to switch to reusable canvas and other durable bags. If the fee does not result in a significant decrease in the use of plastic bags, other tools, including a ban on plastic bags, ought to be considered.
8
An Implementation Strategy to Reduce and Prevent Ocean Litter
Priority Action #3 – Assess fees on commonly littered items (see Objective 2) In addition to a fee on bags as described above, a litter fee should be imposed on commonly littered items that are unsuitable for an EPR program or a ban. Cigarettes might be a suitable candidate for a litter fee. Cigarette butts constitute a significant percentage of the litter collected from California’s beaches. A ban on these filters would be inappropriate since they perform an important function. However, if an additional cost in the form of a litter fee were assessed on cigarettes and other materials commonly found in marine debris, such as convenience food packaging, consumers would be more aware of the economic, and perhaps environmental, costs associated with them. In addition, fee revenues can be used to clean up litter so that the costs are borne by those who choose to consume the products that contribute most to ocean litter. The funds from litter fees should also be directed to support the following types of activities:
• Increased enforcement of litter laws; • Litter cleanup efforts, including a community service option for convicted litterers; • Cost-effective integrated waste management and storm water pollution program
assistance for local governments; • Market development grants to create recycling opportunities and recycled-content
markets; • Public education and outreach campaigns, including environmental education; • Funding for research on alternative products, safer product additives and product re-
design; and • Hazardous waste source reduction, green chemistry and green engineering design.
MEASURING SUCCESS The Steering Committee views these three priority actions as the primary tools that will be needed to address major sources of ocean litter. Preventing packaging waste from being generated and banning or placing a fee on items that are prevalent in ocean litter are more cost-effective than cleaning up litter. These actions can also reduce resource consumption, greenhouse gas production and other pollution associated with the production of these products. Yet, even with reductions in packaging and specific items that become ocean litter, littering will continue to happen without changes in behavior by litterers. Therefore, it is important to focus also on litter enforcement and education. The other tools described in this document that address litter – including education and outreach and increased litter cleanup – also contribute to the goal of completely eliminating ocean litter. Funds from the litter fee can be directed to these activities. A programmatic solution ought to include the proposed actions and also set forth specific goals, detailed funding plans, timelines for implementing and completing the actions, and appropriate metrics for success.
9

An Implementation Strategy to Reduce and Prevent Ocean Litter
Objective 1: REDUCE SINGLE-USE PACKAGING AND PROMOTE SUSTAINABLE ALTERNATIVES – Change Producer Behavior Litter prevention is a high priority because the alternative – collection and disposal of litter – is costly. In addition, litter is detrimental to human health and the environment. Accordingly, the OPC Resolution seeks to reduce ocean litter by implementing methods to prevent certain wastes (primarily packaging waste) from being generated, which follows an approach to waste described in California’s Integrated Waste Management Act (IWMA, AB 939). The OPC Resolution directs the Steering Committee to consider the following approaches to changing producer behavior in order to accomplish this objective: 1. Reduce the generation of single-use plastic packaging and containers (Resolution item #9) 2. Reduce plastic waste through packaging redesign (Resolution item #3) 3. Prepare a phased ban on toxic additives in packaging (Resolution item #11) 4. Prevent pollution from plastic resin pellets and powders used in manufacturing plastics
(Resolution item #2) The strategy for implementing each of these four elements of this objective is described briefly below and specific actions are outlined in the chart that follows. REDUCING PACKAGING WASTE GENERATION OPC Resolution item #9 directs the Steering Committee to develop a plan for reducing single-use plastic packaging and containers. The focus of this Resolution item is on single-use fast-food and convenience market packaging and containers. These items constitute a large percentage of ocean litter from land-based sources.44 Surveys show that take-out food packaging and food-ware items are the most significant category of roadside litter.45 This objective can be achieved by implementing ways to encourage or require the fast food and convenience store industries to use less packaging and containers or use products that minimize harm to the environment. The Steering Committee recommends two priority actions for reducing packaging waste, as described above: (1) Extended Producer Responsibility (EPR) for convenience food packaging, and (2) prohibiting certain products that contribute extensively to ocean litter. Action: Implement a producer take-back (EPR) program for convenience food packaging
The CIWMB states that “(p)lastics production continues to far outpace plastics recycling, and plastics are displacing some other more recyclable materials. Waste management systems have not been able to keep pace with the rapid increase in plastics use.”46 Generation versus recycling rates for plastics in California are not available but U.S. EPA statistics show that nationwide, plastic packaging generation in the waste stream greatly exceeds recycling (Figure 1).
10

An Implementation Strategy to Reduce and Prevent Ocean Litter
Generation and recovery of plastic packaging
0
2000
4000
6000
8000
10000
12000
1960 1970 1980 1990 2000
Thou
sand
s of
tons
generation recovery
Figure 1. Generation and recovery of plastic packaging in the solid waste stream in the United States showing a large portion of packaging is not recovered. Data from 1999 U.S. EPA report. 47 An Extended Producer Responsibility (EPR) or “take-back” program assigns the costs or physical management of waste to the producer (for packaging in the European Union, “producers” are packaging manufacturers, fillers and distributors). By assuming the costs of a product at the end of that product’s useful life, a producer has an incentive to reduce the amount of product waste it generates. The producer will be encouraged to make design and manufacturing changes that will lead to waste reduction, lower toxics content, increased recycled content, and improved recyclability. Reducing the amount of product waste generated reduces the amount of product waste that has the potential to become ocean litter. Preventing product waste from being generated has many additional benefits. It saves energy and other resources, reduces damage associated with resource extraction, reduces pollution including greenhouse gas production, and reduces waste management costs. EPR for packaging has been implemented effectively in at least 33 countries to date. For example, packaging waste was reduced by 14% in Germany during the first four years of its EPR program (1991-1995) and by 1998, total packaging in Germany was reduced by a volume of 1 million tons.48 Use of composites was reduced by 50% and plastics packaging fell from 40% (by volume) to 27% in favor of paper/carton and tinplate. Plastic packaging moved away from polyvinyl chloride (PVC) to other more easily recycled plastics, such as polyethylene (PE) and polypropylene (PP). Significant design changes were made to reduce the amount of packaging material and quantities of packaging layers. Container shapes and sizes were altered to reduce volume, and thin-walled films and containers were introduced. 49 Germany is not the only EPR country to achieve a reduction in packaging waste: The Netherlands achieved its goal of reducing packaging by 10% from 1986 through 2001.50 Using packaging take back, other EU countries
11

An Implementation Strategy to Reduce and Prevent Ocean Litter
have achieved a slowing in the rate of growth of packaging waste generation. The U.S. EPA notes that per capita waste generation increased from 2.7 to 4.4 pounds per day between 1960 and 2001 and states that “the most effective way to stop this trend is by preventing waste from being generated in the first place.”51 In the United States, producer take-back programs are becoming increasingly popular. Some are voluntary, such as the consortium of producers involved in the Rechargeable Battery Recycling (RBRC) program that takes back batteries and cell phones, and the thermostat mercury recycling program. California has take-back programs for electronic waste and automotive batteries, a program that has achieved a 99% recovery rate.52 Similar programs are being considered for universal waste (waste with a hazardous component). In the state of Washington, a company must be part of a producer-funded take-back program to sell electronics; similar legislation is proposed in 15 U.S. states. Another relevant take-back program is one mandated by AB 2449 (Levine) for plastic carry-out bags. The law, which went into effect in 2007, requires take-back of bags by large grocery stores and pharmacies, as well as other types of bags and films such as dry cleaning bags, newspaper bags, bread bags, and wraps. Recently, the CIWMB approved a Strategic Directive on Producer Responsibility that states that “It is a core value of the CIWMB that producers assume the responsibility for the safe stewardship of their materials in order to promote environmental sustainability.”53 The CIWMB recently adopted an EPR framework as an overall policy priority. Many local governments nationwide have passed EPR resolutions that resolve to have all city or county purchasing encourage producer take-back in contracts, favor leasing over purchasing (one form of take-back), and urge state legislators to pursue statewide EPR policies. In California, 40 jurisdictions have passed EPR resolutions, as well as the California Council of Directors of Environmental Health and the Regional Council of Rural Counties, including: the City of Elk Grove, the City of Fresno, Contra Costa County, Solano County, San Bernardino County, Santa Clara County, the City of Oakland, Sonoma County, Santa Cruz County, Marin County, Morgan Hill, and the City and County of San Francisco, with the latest being the City of San Juan Capistrano on August 5, 2008.54 The OPC believes that CIWMB should have the authority to adopt EPR regulations and that CIWMB should prioritize EPR for packaging waste to the extent feasible. Action: Prohibit single-use products that pose significant ocean litter impacts where a feasible less damaging alternative is available • Polystyrene Food Packaging Prohibition In 2001, researchers from SCCWRP and the Southern California Marine Institute published a study titled “Composition and Distribution of Beach Debris in Orange County, California.” It found that foamed plastics, also known as expanded polystyrene (EPS) and Styrofoam™ (extruded polystyrene), were second only to pre-production plastic pellets as the most abundant debris item on Orange County beaches.55 Expanded polystyrene and Styrofoam are made by
12
An Implementation Strategy to Reduce and Prevent Ocean Litter
applying heat and blowing a chemical agent to turn the polystyrene into foam. These plastics are often used in food packaging for their light weight and insulating qualities; however, their durability and tendency to float have led to negative impacts in marine environments, as discussed above. Prohibitions of polystyrene food containers would not reduce all polystyrene debris on California beaches due to its presence in other types of packaging; however, thousands of pounds would be reduced. In response to these findings, the following communities in California have banned polystyrene food packaging: San Francisco, Los Angeles County, Monterey County, San Mateo County, Santa Cruz County, Sonoma County, and Ventura County. Expanded Polystyrene (EPS) prohibitions have been implemented in the cities of: Calabasas, Capitola, San Francisco, Malibu, Huntington Beach, Aliso Viejo, San Juan Capistrano, Berkeley, Oakland, Emeryville, Ventura, Sonoma, and Freeport. A 2008 audit of San Francisco litter revealed a 36% reduction in polystyrene litter since polystyrene was banned in 2007. 56 A statewide prohibition on polystyrene would likewise reduce the amount of polystyrene littered in streets and swept down storm drains that could litter the ocean surface and negatively impact marine wildlife. The OPC believes that a statewide prohibition on polystyrene take-out food packaging should be adopted. • Plastic Bag Fee California retailers distribute more than 19 billion plastic retail carryout bags annually; of this amount, fewer than 5% are currently recycled in California.57 The 2007 International Coastal Cleanup (ICC) report produced by the Ocean Conservancy reported that bags were the fourth most common debris item collected worldwide during the ICC event, accounting for 8.1% of total coastal litter and 6.2% of underwater litter by weight.58 However, according to the ICC report, bags made up over half the total amount of the ten most common dangerous debris items – or items capable of harming wildlife and humans – such as syringes, rope and fishing gear collected worldwide. In California, where cleanup data are verified by the California Coastal Commission, plastic bags were the fourth most collected item during ICC with 64,355 lbs out of 474,585 lbs, or 13.5% of the litter collected from shoreline activities (land-based litter) and 6% of the total litter (963,024 lbs, which includes ocean litter). A waste characterization study conducted by the City of Los Angeles in June 2004 found that plastic bags made up 25% by weight (and 19% by volume) of litter found in 30 storm drain catch basins.59 Single-use carry-out bags are banned or available for a fee in many countries in response to litter and ocean litter concerns. Taiwan, China, Bangladesh, Tanzania, Kenya, Rwanda, Germany, and Sweden have implemented different types of prohibitions on plastic bags, as have 30 towns in Alaska. Ireland, Denmark, Italy, Belgium, and Switzerland have instituted a fee on plastic carryout bags, with Ireland’s 20 cent (Euro) fee resulting in a more than 90% reduction in the use of plastic bags since the fee was imposed in March 2002.60 In the United States, statewide bans or fees are being considered in Alaska, Massachusetts, New York, New Jersey and Hawaii, though none have yet enacted legislation. In 2007, Governor Schwarzenegger signed AB 2449 (Levine) to require grocery stores to offer increased recycling opportunities as an incentive to increase the very low recycling rate of plastic bags. However, due to a perceived lackluster response in recycling, some California
13
An Implementation Strategy to Reduce and Prevent Ocean Litter
municipalities are beginning to enact prohibitions or phased prohibitions on plastic bags. For example, in 2007 the City of San Francisco implemented a ban on plastic single-use bags by major supermarkets and pharmacies after it failed to achieve a desired voluntary recycling rate. In Southern California, the L.A. County Board of Supervisors voted on January 22, 2008 to prohibit the free distribution of single-use plastic carry-out bags in unincorporated areas of the county if voluntary programs by retailers in those areas do not result in significant decreases.61 Though it is too recent to judge the success of plastic bag prohibitions, the experience in San Francisco shows that voluntary initiatives to reduce waste through recycling alone have not proven successful. The OPC believes that California should require a fee be charged for all single-use plastic and paper bags as a further incentive for people to switch to reusable canvas and other durable bags. If the fee does not result in a significant decrease in the use of plastic bags, other tools, including a ban on plastic bags, ought to be considered.
Life-cycle Analyses: Polystyrene, plastic and paper products One challenge to imposing a prohibition or fee solely on single-use polystyrene food packaging and plastic bags is the likely increase of paper products as a replacement. Comparisons of product life-cycles for polystyrene and plastic versus paper provide varying results on the environmental impacts, although several studies show that production of paper is generally less environmentally harmful than plastics. In one study, plastic bags were found to use 23% less energy, produce 76% less solid waste, contribute 57% less air emissions and 97% less water emissions than paper bags. 62 This contrasts starkly with a more recent study that found paper uses 80% less energy, contributes 52% less to air emissions, and 29% less to water emissions.63 The second study also found that paper had less of an impact on acidification of waterways and toxicity in the aquatic environment. However, paper bag production can also have negative impacts on the ocean. 64 The better solution is a shift towards reusable bags.65 Similarly, a study on polystyrene versus paper packaging found that polystyrene production consumes 90% more resources, produces 30% more NOx and SOx and contributes 15% more air emissions than paper, 66 while another study found the environmental impacts from paper to be greater.67 The focus of this strategy is ocean litter, and it is clear that plastic products are generally more harmful than their paper counterparts.
MINIMIZE TOXICS IN PACKAGING Action: Determine which plastic additives threaten human health and the marine environment, educate the public and prepare a plan for a possible prohibition OPC Resolution item #11 directs the Steering Committee to prepare a plan for the phased ban of the most toxic types of all plastic packaging. In coordination with DTSC, the OPC has begun work on an inventory of all of the chemicals in plastics that are commonly found in the marketplace. When this research is completed in 2009, the Steering Committee and the OPC will
14

An Implementation Strategy to Reduce and Prevent Ocean Litter
be able to rank specific additives in plastic packaging by volume and then follow-up with a review of health risks to humans and to the marine environment. The DOC is supporting investigations into the potential human health impacts of chemicals used as plastic additives. The OPC and DOC also engaged the Office of Environmental Health Hazard Assessment (OEHHA) to develop toxicological profile reports on the health effects on humans, experimental animals and marine organisms of bisphenol-A, nonylphenol and di-2-ethyl hexyl phthalate (DEHP), chemicals commonly used as additives in plastics that enter the ocean. OEHHA will report its findings to the OPC when they become available.
DEVELOP ALTERNATIVE PRODUCTS AND PROMOTE SUSTAINABLE ALTERNATIVES
Action: Develop alternative products and additives Resolution item #3 directs the Steering Committee to seek innovative ways to reduce plastic waste, including investigating packaging alternatives that reduce the amount of plastic debris that ends up in the marine environment and reduce the use of toxic additives. This directive is consistent with the “green chemistry” legislation Governor Schwarzenegger signed into law in September 2008. DOC has taken a lead role in supporting investigations being conducted by DTSC to improve recycling methods for plastics, identify safer formulations of plastic products and assess the impacts of bioplastics options. In addition, the OPC supports product redesign and alternative technologies to reduce the overall number of plastic items reaching the marine environment, such as leashed or tethered bottle caps, lids, and straws. The results of these investigations will help inform the OPC and other agencies on the Marine Debris Steering Committee about product alternatives and formulations that may have less of an impact on the marine environment. INCREASE ENFORCEMENT OF PRE-PRODUCTION PLASTIC LAWS Action: Increase enforcement of laws to eliminate pre-production plastic pellets and powders Pre-production pellets (known as “nurdles”) and powders used to manufacture plastic products present several threats to the marine environment, including most conspicuously, harm to the marine life that eats or gets entangled in them.68 In 2007, Governor Schwarzenegger signed AB 258, a bill to stop the discharge of nurdles into the environment. AB 258 was introduced as a result of the OPC Resolution and requires the State Water Board to focus on stopping the discharge of nurdles from those facilities that use them in the production of plastic products. Though small individually (a nurdle is about the size of a grain of rice), collectively they make up 17% by weight of all ocean litter found on beaches. 69 Removing them from the waste stream will have a significant positive impact in reducing ocean litter. Enforcement efforts should be increased for existing anti-plastic waste laws, such as AB 258. Funding from fines against violators of these laws and litter fees should be used to increase this enforcement effort.
15
An Implementation Strategy to Reduce and Prevent Ocean Litter
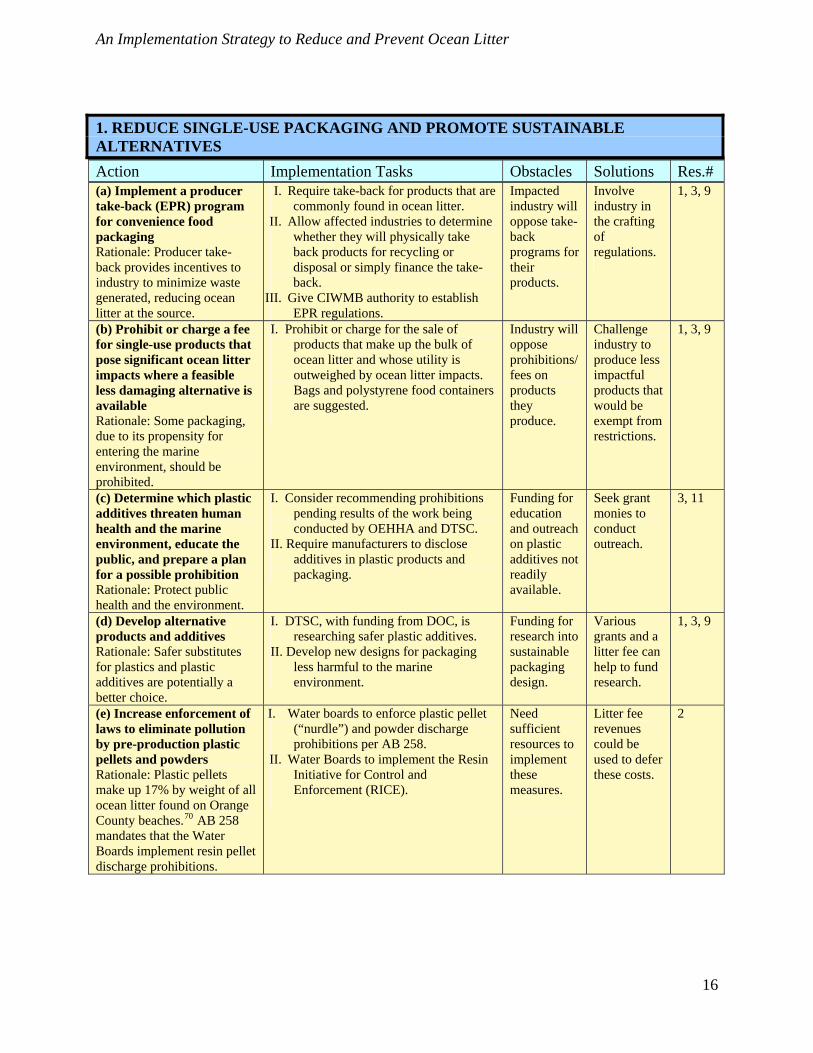
1. REDUCE SINGLE-USE PACKAGING AND PROMOTE SUSTAINABLE ALTERNATIVES Action Implementation Tasks Obstacles Solutions Res.# (a) Implement a producer take-back (EPR) program for convenience food packaging Rationale: Producer take-back provides incentives to industry to minimize waste generated, reducing ocean litter at the source.
I. Require take-back for products that are commonly found in ocean litter.
II. Allow affected industries to determine whether they will physically take back products for recycling or disposal or simply finance the take-back.
III. Give CIWMB authority to establish EPR regulations.
Impacted industry will oppose take-back programs for their products.
Involve industry in the crafting of regulations.
1, 3, 9
(b) Prohibit or charge a fee for single-use products that pose significant ocean litter impacts where a feasible less damaging alternative is available Rationale: Some packaging, due to its propensity for entering the marine environment, should be prohibited.
I. Prohibit or charge for the sale of products that make up the bulk of ocean litter and whose utility is outweighed by ocean litter impacts. Bags and polystyrene food containers are suggested.
Industry will oppose prohibitions/fees on products they produce.
Challenge industry to produce less impactful products that would be exempt from restrictions.
1, 3, 9
(c) Determine which plastic additives threaten human health and the marine environment, educate the public, and prepare a plan for a possible prohibition Rationale: Protect public health and the environment.
I. Consider recommending prohibitions pending results of the work being conducted by OEHHA and DTSC.
II. Require manufacturers to disclose additives in plastic products and packaging.
Funding for education and outreach on plastic additives not readily available.
Seek grant monies to conduct outreach.
3, 11
(d) Develop alternative products and additives Rationale: Safer substitutes for plastics and plastic additives are potentially a better choice.
I. DTSC, with funding from DOC, is researching safer plastic additives.
II. Develop new designs for packaging less harmful to the marine environment.
Funding for research into sustainable packaging design.
Various grants and a litter fee can help to fund research.
1, 3, 9
(e) Increase enforcement of laws to eliminate pollution by pre-production plastic pellets and powders Rationale: Plastic pellets make up 17% by weight of all ocean litter found on Orange County beaches.70 AB 258 mandates that the Water Boards implement resin pellet discharge prohibitions.
I. Water boards to enforce plastic pellet (“nurdle”) and powder discharge prohibitions per AB 258.
II. Water Boards to implement the Resin Initiative for Control and Enforcement (RICE).
Need sufficient resources to implement these measures.
Litter fee revenues could be used to defer these costs.
2
16

An Implementation Strategy to Reduce and Prevent Ocean Litter
Objective 2: PREVENT AND CONTROL LITTER AND PLASTIC DEBRIS – Change Individual Behavior When individuals fail to properly dispose of trash, either intentionally or negligently, the trash becomes litter. Individual behavior change can be motivated through education, law enforcement and economic incentives (e.g., the California Redemption Value (CRV), better known as the “bottle bill”). Very little of the debris found on beaches consists of the bottles and cans included in the bottle bill, as those items have value even as “waste.” Most debris found on beaches has no post-consumer value. There are costs associated with cleaning up litter, but no financial incentive to the litterer to behave differently. LITTER PREVENTION: LITTER FEE AND SMOKING BANS Action: Assess fees on commonly littered items Action: Prohibit smoking on state beaches and provide ash/garbage receptacles at transition points A litter fee similar to the CRV on bottles in California would make consumers more aware of the economic, and perhaps environmental, costs associated with certain commonly littered products (Figure 2). The fee should be assessed at the point of sale so that the consumer is aware of paying more for litter-prone items. Any funds from the litter fee could fund education efforts to inform consumers about the reasons why a litter fee is being imposed, as well as support local litter cleanup and enforcement efforts. A similar fee should be enforced on cigarettes, the most commonly littered item found on beaches and by far the most abundant item recovered during the past 22 years of California’s Coastal Cleanup Day.* 71 In addition to a litter fee on cigarettes, smoking should be prohibited and ash/garbage receptacles placed at transition points on state beaches to reduce the large amount of cigarettes and butts that become littered. Several coastal cities in California have banned smoking, including every coastal city in Los Angeles County except Redondo Beach (a total of 77 miles out of the 80-mile county coastline), due to concerns about higher cleanup costs, public health, and poisoning of wildlife.72 However, state beaches remain open to smoking and cigarette litter. It is time the state took action to prohibit smoking on all beaches and place adequate receptacles in transition areas within California. The funds from litter fees should be directed to support the following types of activities:
• Increased enforcement of litter laws;
* Results of litter studies vary according to the method of debris collection. Beach clean-ups tend to result in the collection of larger, more visible items while scientific studies tend to account for smaller items, such as plastic pre-production pellets and micro-sized debris. For example, the Orange County beach debris study found plastic items accounted for 99% of the total items collected, which contrasts with the volunteer-based ICC data.
17

An Implementation Strategy to Reduce and Prevent Ocean Litter
• Litter cleanup efforts, including a community service option for convicted litterers;
• Cost-effective integrated waste management and storm water pollution program assistance for local governments;
• Market development grants to create recycling opportunities and recycled-content markets;
• Public education and outreach campaigns, including environmental education; • Funding for research on alternative products, safer product additives and product
re-design; and • Hazardous waste source reduction, green chemistry and green engineering design.
Top 10 Items Collected in 2007 International Coastal Cleanup
0%5%
10%15%20%25%30%
Cig
aret
tes/
Filte
rs
Food
Wra
p/C
onta
iner
s
Cap
s/Li
ds
Bags
Plas
tic B
ottle
s
Cut
lery
Gla
ss B
ottle
s
Cig
ar T
ips
Stra
ws/
Stirr
ers
Beve
rage
Can
s
Fish
ing
Line
Per
cent
of t
otal
deb
ris
all debris on land underwater
Figure 2. Top 10 items, in percentage of total items, collected worldwide during the 2007 International Coastal Cleanup overall (green), on land (yellow) and underwater (blue). 73 Fishing line was in the top 10 items found underwater only. LITTER ENFORCEMENT Action: Increase enforcement of anti-litter laws Increased enforcement of existing litter laws should be a high priority in the effort to combat ocean litter; however, enforcement alone will not change general behavior. A combination of higher fines along with increased enforcement and education will deter would-be litterers from throwing trash away in the streets, sidewalks and storm drains which lead to the ocean. State and local enforcement authorities will be encouraged to increase enforcement of anti-littering laws by directing some portion of the monies generated from the litter fee to specifically fund increased local litter law enforcement. California’s Vehicle Code currently imposes a $1,000 fine for
18
An Implementation Strategy to Reduce and Prevent Ocean Litter
littering; that fine should be increased initially and with each subsequent violation (i.e., doubling to $2,000 for the first violation, $5,000 for the second violation, etc.). Enforcement agencies that enforce the litter laws should be allowed to keep some portion of the proceeds from the fines they impose. Litterers should also be required to perform community service in the form of coastal or waterway cleanup activity. PUBLIC EDUCATION Action: Coordinate education and outreach campaigns Action: Direct state funds for litter education to the Environmental Education Initiative (EEI) Along with increased enforcement and economic incentives to discourage littering, environmental education is necessary to prevent the litter problem as well as treat it. Public education efforts can change individual behavior of existing litterers, as well as educate youth to stop littering before they start. The Steering Committee is looking into ways to coordinate existing educational outreach programs that teach the public about the importance of reducing litter and protecting the marine environment. Support for these existing programs should be expanded in local communities to engage the public, including the business community. Additionally, OPC will pursue opportunities and funding to integrate ocean litter education into the Education and the Environment Initiative curriculum that is a part of the basic student education in California. Some of the funds collected from the litter fees should go toward these educational efforts.
19
An Implementation Strategy to Reduce and Prevent Ocean Litter
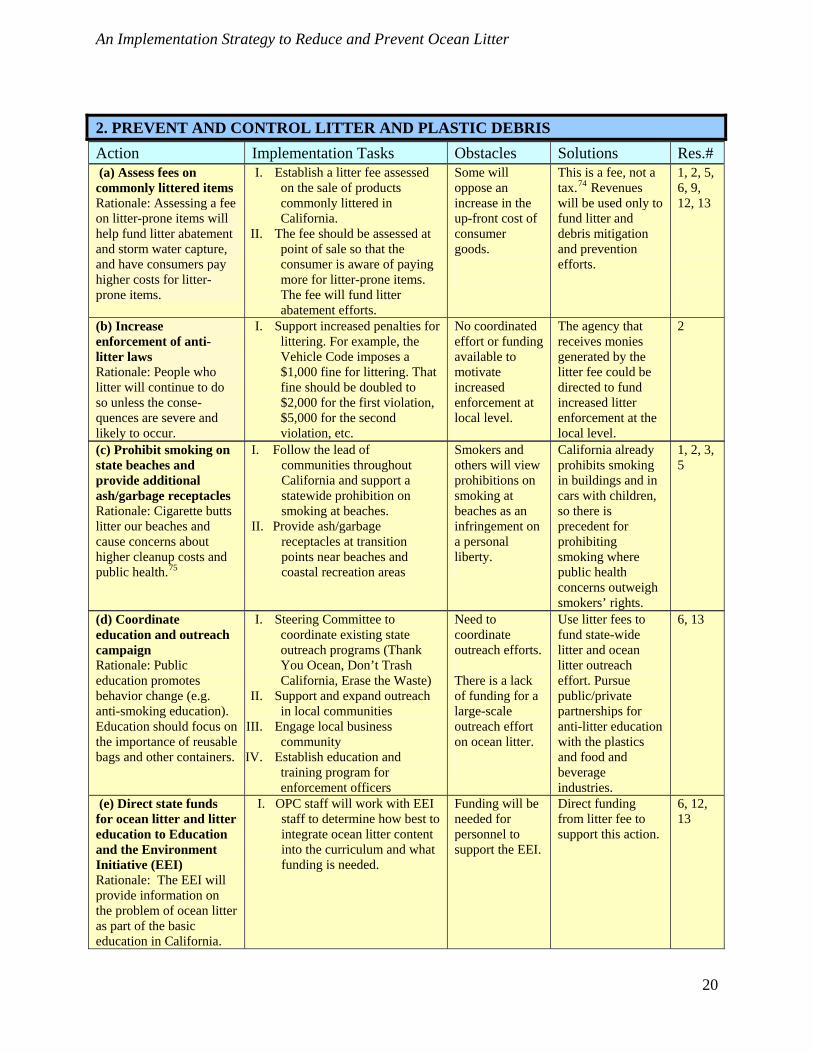
2. PREVENT AND CONTROL LITTER AND PLASTIC DEBRIS
(c) Prohibit smoking on state beaches and provide additional ash/garbage receptacles Rationale: Cigarette butts litter our beaches and cause concerns about higher cleanup costs and public health.75
I. Follow the lead of communities throughout California and support a statewide prohibition on smoking at beaches.
II. Provide ash/garbage receptacles at transition points near beaches and coastal recreation areas
Smokers and others will view prohibitions on smoking at beaches as an infringement on a personal liberty.
California already prohibits smoking in buildings and in cars with children, so there is precedent for prohibiting smoking where public health concerns outweigh smokers’ rights.
1, 2, 3, 5
Action Implementation Tasks Obstacles Solutions Res.# (a) Assess fees on commonly littered items Rationale: Assessing a fee on litter-prone items will help fund litter abatement and storm water capture, and have consumers pay higher costs for litter-prone items.
I. Establish a litter fee assessed on the sale of products commonly littered in California.
II. The fee should be assessed at point of sale so that the consumer is aware of paying more for litter-prone items. The fee will fund litter abatement efforts.
Some will oppose an increase in the up-front cost of consumer goods.
This is a fee, not a tax.74 Revenues will be used only to fund litter and debris mitigation and prevention efforts.
1, 2, 5, 6, 9, 12, 13
(b) Increase enforcement of anti-litter laws Rationale: People who litter will continue to do so unless the conse-quences are severe and likely to occur.
I. Support increased penalties for littering. For example, the Vehicle Code imposes a $1,000 fine for littering. That fine should be doubled to $2,000 for the first violation, $5,000 for the second violation, etc.
No coordinated effort or funding available to motivate increased enforcement at local level.
The agency that receives monies generated by the litter fee could be directed to fund increased litter enforcement at the local level.
2
(d) Coordinate education and outreach campaign Rationale: Public education promotes behavior change (e.g. anti-smoking education). Education should focus on the importance of reusable bags and other containers.
I. Steering Committee to coordinate existing state outreach programs (Thank You Ocean, Don’t Trash California, Erase the Waste)
II. Support and expand outreach in local communities
III. Engage local business community
IV. Establish education and training program for enforcement officers
Need to coordinate outreach efforts. There is a lack of funding for a large-scale outreach effort on ocean litter.
Use litter fees to fund state-wide litter and ocean litter outreach effort. Pursue public/private partnerships for anti-litter education with the plastics and food and beverage industries.
6, 13
(e) Direct state funds for ocean litter and litter education to Education and the Environment Initiative (EEI) Rationale: The EEI will provide information on the problem of ocean litter as part of the basic education in California.
I. OPC staff will work with EEI staff to determine how best to integrate ocean litter content into the curriculum and what funding is needed.
Funding will be needed for personnel to support the EEI.
Direct funding from litter fee to support this action.
6, 12, 13
20
An Implementation Strategy to Reduce and Prevent Ocean Litter
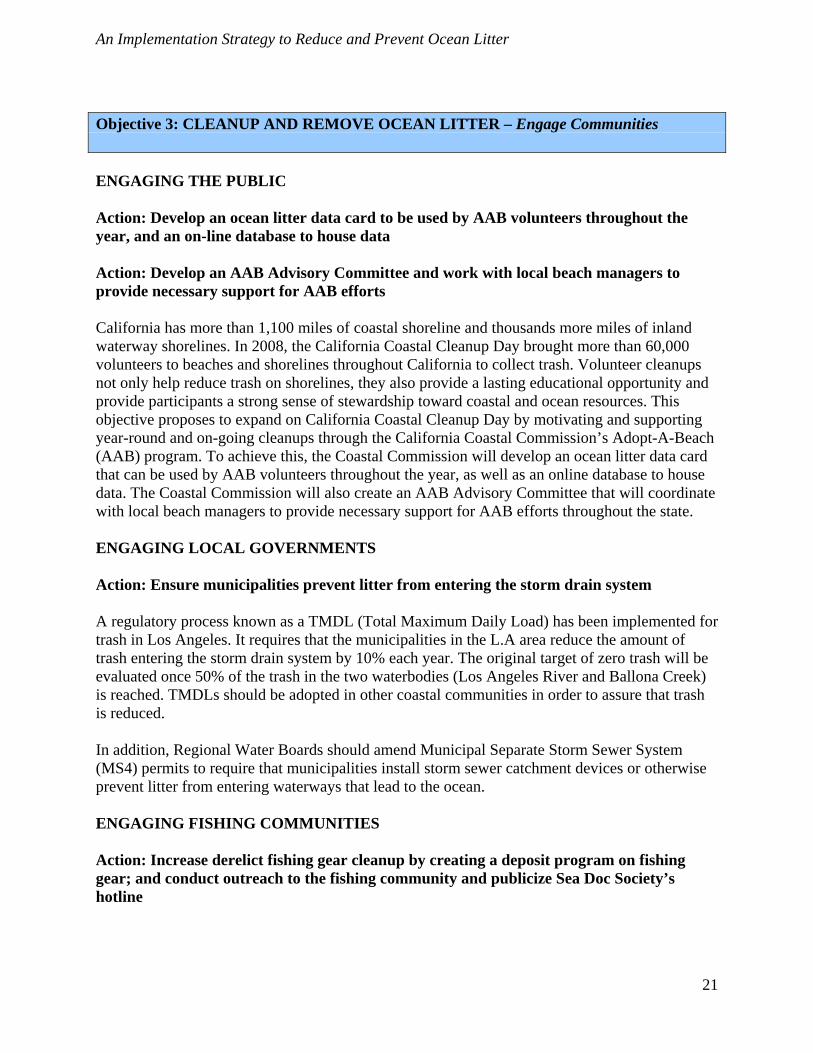
Objective 3: CLEANUP AND REMOVE OCEAN LITTER – Engage Communities ENGAGING THE PUBLIC Action: Develop an ocean litter data card to be used by AAB volunteers throughout the year, and an on-line database to house data Action: Develop an AAB Advisory Committee and work with local beach managers to provide necessary support for AAB efforts California has more than 1,100 miles of coastal shoreline and thousands more miles of inland waterway shorelines. In 2008, the California Coastal Cleanup Day brought more than 60,000 volunteers to beaches and shorelines throughout California to collect trash. Volunteer cleanups not only help reduce trash on shorelines, they also provide a lasting educational opportunity and provide participants a strong sense of stewardship toward coastal and ocean resources. This objective proposes to expand on California Coastal Cleanup Day by motivating and supporting year-round and on-going cleanups through the California Coastal Commission’s Adopt-A-Beach (AAB) program. To achieve this, the Coastal Commission will develop an ocean litter data card that can be used by AAB volunteers throughout the year, as well as an online database to house data. The Coastal Commission will also create an AAB Advisory Committee that will coordinate with local beach managers to provide necessary support for AAB efforts throughout the state. ENGAGING LOCAL GOVERNMENTS Action: Ensure municipalities prevent litter from entering the storm drain system A regulatory process known as a TMDL (Total Maximum Daily Load) has been implemented for trash in Los Angeles. It requires that the municipalities in the L.A area reduce the amount of trash entering the storm drain system by 10% each year. The original target of zero trash will be evaluated once 50% of the trash in the two waterbodies (Los Angeles River and Ballona Creek) is reached. TMDLs should be adopted in other coastal communities in order to assure that trash is reduced. In addition, Regional Water Boards should amend Municipal Separate Storm Sewer System (MS4) permits to require that municipalities install storm sewer catchment devices or otherwise prevent litter from entering waterways that lead to the ocean. ENGAGING FISHING COMMUNITIES Action: Increase derelict fishing gear cleanup by creating a deposit program on fishing gear; and conduct outreach to the fishing community and publicize Sea Doc Society’s hotline
21

An Implementation Strategy to Reduce and Prevent Ocean Litter
Ocean-based discharges of ocean litter represent approximately 20% of ocean litter.76 Item #10 of the Resolution directs the Steering Committee to propose a plan for reducing derelict fishing gear. Although derelict fishing gear comprises a small fraction of ocean litter, it has a disproportionately large negative impact on the marine environment because it is designed to trap and ensnare marine life. 77 Derelict fishing gear includes nets, lines, crab and shrimp traps, and other recreational and commercial harvest equipment that has been lost or abandoned in the marine environment. Lost or abandoned gear can continue to trap or ensnare marine life with the unintended consequence referred to as “ghost fishing.” Most fishing nets are made from synthetic fibers (plastic) that take substantial amounts of time to degrade, and even as degraded material (plastic fragments), it continues to pollute and damage the marine environment. In addition to marine environment impacts, derelict fishing gear can entangle divers and swimmers and foul boat propellers, rudders, anchors, and drive shafts. The proposed actions should substantially reduce the amount of fishing gear that ends up as derelict gear. California is the last of the Pacific states to implement legislation addressing the problem of derelict fishing gear: Washington, Alaska, Oregon, and Hawaii have all instituted derelict fishing gear removal programs.78 The OPC recommends that the existing SeaDoc hotline be used for reporting purposes and to engage participation of the fishing community. In addition, the OPC proposes that a deposit program be placed on new and leased fishing gear to provide an incentive to fishermen to retrieve their gear when the fishing season has ended. These deposits would be priced according to the value of the gear and would be reimbursed upon return of the gear. Uncollected deposits would be used to fund gear recycling and retrieval programs in harbors and areas where fishing activity is concentrated. Fishermen should be engaged to determine how best to set up a deposit program, consistent with Governor Schwarzenegger’s directive in his SB 899 (Simitian) veto message to “encourage the author and stakeholders to work with the Department of Fish and Game to convene a group to develop a workable program that does not rely exclusively on government funds and employees for his effort.”
22

An Implementation Strategy to Reduce and Prevent Ocean Litter
Objective 3. CLEANUP AND REMOVE OCEAN LITTER Action Implementation Tasks Obstacles Solutions Res.# (a) Develop an ocean litter data card to be used by AAB volunteers throughout the year, and an on-line database to house data Rationale: monitoring results of collected data will allow for the measurement of ocean litter efforts.
I. CCC will coordinate this task. Funding is needed for the database.
CCC will seek funding from grant sources and litter fee funds.
10
(b) Develop an AAB Advisory Committee and work with local beach managers to provide necessary support for AAB efforts Rationale: Coordination will help maximize limited resources
I. CCC to coordinate and advise state-wide AAB manager on ways to improve.
II. CCC to develop new materials to help increase participation, and to support volunteers.
Funding for new outreach materials is needed.
Litter fees can provide support for the AAB program.
4
(c) Ensure municipalities prevent litter from entering the storm drain system Rationale: Existing trash Total Maximum Daily Loads (TMDLs) require municipalities to install trash collection devices in storm drains.
I. Urge the development of TMDLs in coastal communities.
II. Support efforts by SWRCB to develop statewide regulations to eliminate liter from urban storm drain systems.
III. Urge Regional Boards to amend MS4 permits in conformity with above regulations.
No mandate that the state achieve a zero discharge of trash in waterways.
Litter fee revenues could be used to help defer these costs.
1, 2, 5
(d) Decrease derelict fishing gear by creating a deposit program on fishing gear Rationale: A deposit system would reduce abandonment and legal support for collaborative retrieval should increase removal rates.
I. Provide incentives, such as a deposit program, to promote better safekeeping of fishing gear.
Some fishermen will oppose deposit fee.
Conduct outreach to fishing groups and involve them in the design of a deposit system.
10
(e) Conduct outreach to fishing community and publicize Sea Doc Society’s reporting hotline Rationale: Engaging participation of the fishing community is essential.
I. The OPC will coordinate an outreach effort.
None known. 10
23

An Implementation Strategy to Reduce and Prevent Ocean Litter
Objective 4: COORDINATE WITH OTHER JURISDICTIONS IN THE PACIFIC REGION – Engage Other Regions Action: Work with the West Coast Governors’ Agreement (WCGA) participants and invite the participation of Alaska, Hawaii, British Columbia, Baja California, and Baja California Sur Ocean litter is a problem that migrates with ocean currents beyond political boundaries. Spending valuable state resources addressing ocean litter without similar measures being implemented in political regions that share the Pacific coast will not be enough to solve the problem. Too many other urban areas and fishing fleets contribute to the deposition of ocean litter in the Pacific Ocean. The state must coordinate efforts with regional partners. Objective 4. COORDINATE WITH OTHER JURISDICTIONS IN THE PACIFIC REGION Action Implementation Tasks Obstacles & Solutions Res.# (a) Work with the WCGA participants and invite the participation of Alaska, Hawaii, British Columbia, Baja California and Baja California Sur Rationale: The WGCA participants have adopted an action plan that includes a section on ocean litter. This presents an opportunity to form a coalition of coastal governments to jointly achieve ocean litter reduction.
I. Establish coast-wide goals for ocean litter reduction that: • Set joint litter target reductions
of plastic single-use fast-food and convenience market packaging and containers
• Set joint derelict fishing gear litter target reductions and site cleanup targets
• Consider relevant European Union approaches to dealing with chemicals in plastics
• Address enforcement regulations for pre-production plastic pellets.
II. Invite the participation of Alaska, Hawaii, British Columbia, Baja California, and Baja California Sur
8
24
An Implementation Strategy to Reduce and Prevent Ocean Litter
25
1 J.G.B. Derraik, The pollution of the marine environment by plastic debris: a review, Marine Pollution Bulletin, 44, 842 – 852, 2002. 2 See note 1. 3 C. J. Moore, S. L. Moore, M. K. Leecaster, S. B. Weisberg, “A comparison of plastic and plankton in the North Pacific Central Gyre”, Marine Pollution Bulletin, 42 (12), 1297 – 1300, 2001. 4 Miriam Doyle, “An investigation of micro-debris in plankton samples collected during NOAA surveys in Southeast Bering Sea and off the U.S. West Coast, 2006-2007, with special attention to plastic particles.” Available at: http://marinedebris.noaa.gov/marinedebris101/documents/Microdebris08.pdf. 5 See note 1. Reproduced from Table 1; see original study for individual study references. 6 MARPOL 73/78 (the International Convention for the Prevention of Pollution by Ships) is the international treaty regulating disposal of wastes generated by vessels. MARPOL 73/78 is implemented in the U.S. by the Act to Prevent Pollution from Ships, under the lead of the U.S> Coast Guard. 161 countries have signed the treaty as of 2001. Annex V of the Treaty addresses the disposal of garbage from ships and prohibits the disposal of plastic at sea. 7 Charles Moore, Algalita Marine Research Foundation, presentation at California District Attorneys Association, Sept. 2006, Trashed: Plastic Plastic Everywhere. 8 H. Ogi, Y. Fukimoto, “A Sorting Method for Small Plastic Debris Floating on the Sea Surface and Stranded on Sandy Beaches”, Bulletin of the Faculty of Fisheries, Hokkaido University 5 (2), 71-93, 2000. 9 S. Copello, F. Quintara, Marine debris ingestion by Southern Giant Petrels and its potential relationships with fisheries in the Southern Ocean, Marine Pollution Bulletin, 46, 1513-1515, 2003. 10 R. C. Thompson, Y. Olsen, R. P. Mitchell, A. Davis, S. J. Rowland, A. W. G. John, S. McGonigle, A. E. Russell, “Lost at Sea: Where is all the plastic?” Science, 304 (May 7, 2004), 838. 11 Re: 80% from land based sources: U.S. Department of Commerce, NOAA, Office of Public and Constituent Affairs, (1999) “Turning to the Sea: America’s Ocean Future,” p.5. Re: most of land-based ocean litter comes from trash in urban runoff: Trash TMDLs for the Los Angeles River Watershed, (September 19, 2001):17. See also: California Coastal Commission and Algalita Marine Research Foundation, (2006) “Eliminating Land-Based Discharges of Marine Debris in California: A Plan of Action from the Plastic Debris Project.” Available at: www.plasticdebris.org. 12 Abstract for presentation provided Stephen B. Weisberg, Southern California Coastal Water Research Project, at the Plastic Debris, Rivers to Sea Conference, September 7-9, 2005. 13 D.W. Laist, “Impacts of marine debris: entanglement of marine life in marine debris including a comprehensive list of species with entanglement and ingestion records,” in Coe, J.M. Rogers, D.B. (eds), Marine Debris: Sources, Impacts, and Solutions: Springer-Verlag, New York, (1997) 99-139. 14 H. Gomeric, M.D. Gomeric, T. Gomeric et al., “Biological aspects of Cuviers’s beaked whale (Ziphuis cavirostris) recorded in the Croatian part of the Adriatic Sea,” European Journal of Wildlife Research, 52, 182-187, 2006. 15 H. G. Ozdilek, S. Yalcin-Ozdilek, F. S. Ozaner, B. Sonmez, “Impact of accumulated beach letter on Chelonia mydas L. 1758 (green turtle) hatchlings of the Samandag coast, Hatay, Turkey,” Fresenius Environmental Bulletin, 15, 95-103, 2006. 16 E. Hartwig, T. Clemens, M. Heckroth, “Plastic debris as nesting material in a Kittiwake-(Rissa tridactyla)-colony at the Jammerbugt, Northwest Denmark,” Marine Pollution Bulletin, 54, 595-597, 2007. 17 H. Nevins, D. Hyrenbach, C. Keiper, J. Stock, M. Hester, J. Harvey, “Seabirds as indicators of plastic pollution in the North Pacific,” presented at the Plastic Debris, Rivers to Sea Conference, Sept. 8, 2005, Redondo Beach, California. Available at: www.plasticdebris.org. 18 H. J. Auman, J. P. Ludwig, J. P.Giesy, T. Colborn, “Plastic ingestion by Laysan Albatross chicks on Sand Island, Midway Atoll, in 1994 and 1995,” Albatross Biology and Conservation, 239-244, 1997. 19 Id.
An Implementation Strategy to Reduce and Prevent Ocean Litter
26
20 Y. Mato, H. Takada, M.P. Zakaria, Y. Kuriyama, H. Kanehiro, “Toxic chemicals contained in plastic resin pellets in the marine environment- spatial difference in pollutant concentrations and the effects of resin type,” Kanyo Kagakukaishi 15, 415-423, 2002; C. Moore, G. Lattin, A. Zellers, “A Brief Analysis of Organic Pollutants Sorbed to Pre- and Post-Production Plastic Particles from the Los Angeles and San Gabriel River Watersheds,” presented at the Plastic Debris, Rivers to Sea Conference, September 2005, Redondo Beach, CA. Available at: www.plasticdebris.org. 21 David Barnes, “Biodiversity: Invasions by Marine Life on Plastic Debris,” Nature, 6883 (April 25, 2002): 808-809. 22 California Department of Transportation, www.donttrashcalifornia.info (July 23, 2008). 23 Los Angeles County Board of Supervisors Staff Report, “An Overview of Carryout Bags in Los Angeles County,” August 2007. 24 Los Angeles Regional Water Quality Control Board, Trash TMDLs for the Los Angeles River Watershed, (September 19, 2001). 25 Currently, the trash TMDL applies to cities and counties within the Los Angeles River and Ballona Creek watersheds and is enforced by Region 4 of the RWQCB. Other regions of the Water Board are considering the implementation of various types of measures to minimize the amount of trash in California waterways. 26 California Integrated Waste Management Board, http://www.zerowaste.ca.gov/PlasticBags/default.htm (July 23, 2008). 27 National Ocean Economics Program, California's Ocean Economy, July 2005, pp. 24-26. In 2000, the total market value of California's Gross State Product (GSP) was $42.9 billion. Tourism and recreation on the coast accounted for 58% of GSP. GSP is a measure of the contribution of the sector to the value of goods and services in the economy. The value-added, or net sales of a sector, minus the cost of inputs, e.g. the net output of a sector. Using this measure eliminates “double counting,” among sectors. 28 In January 2006, in response to the recommendations of the Action Plan to reduce marine debris, published by the CCC and AMRF Plastic Debris Project (www.plasticdebris.org), the CIWMB convened a Statewide Anti-Litter Task Force. The Task Force was focused on developing strategies and concrete plans for ridding California of litter. The Task Force designated a subcommittee in May, 2006 to pursue the writing of a draft strategic plan that would help to direct the work of the Task Force. The Subcommittee began meeting in July 2006 under the leadership of CalTrans. Soon after these initial meetings, the Subcommittee was approached by OPC staff for assistance. The Subcommittee’s work on s strategic plan helped to shape a resolution on marine debris for consideration by the OPC. On February 8, 2007, the OPC passed a version of the resolution after considerable input from the public. The OPC Resolution calls for the creation of the Marine Debris Steering Committee, including members from agencies already represented on the Anti-Litter Task Force. Rather than create an entirely new committee to conduct very similar work, a decision was made to re-focus the work of the Subcommittee of the Anti-Litter Task Force on developing a plan to implement the OPC Resolution. 29 See note 11. 30 California Coastal Commission and Algalita Marine Research Foundation, Eliminating Land-based Discharges of Marine Debris in California: A Plan of Action from the Plastic Debris Project, June 2006, pp. 16-19. Volunteer-based cleanups at California’s Coastal Cleanup Day generally yield data showing that the most numerous type of debris collected is food and beverage packaging when the various categories of these items are added together. For example in 2004 the data showed that 40.4% of debris items were related to food and beverage packaging (food wrappers and containers = 14.1%, caps and lids = 7.4%, cups /plates/forks/knives spoons = 4.9%, beverage bottles/glass = 4.1%, straws and stirrers = 3.8%, plastic beverage bottles = 3.2%, metal beverage cans = 2.9%). Few studies characterize debris in terms of product types. The composition of trash found in a Los Angeles River catch basin cleanout in 2004 found plastic film and bags were the most numerous items (43%).
An Implementation Strategy to Reduce and Prevent Ocean Litter
27
31 B. Thorpe, I. Kruszewska, A. McPherson, Extended Producer Responsibility: A waste management strategy the cuts waste, creates a cleaner environment and saves taxpayers money, Clean Production Action, 2004. 32 Data from US EPA Municipal Waste Characterization Study 2006 at http://www.epa.gov/epaoswer/non-hw/muncpl/pubs/06data.pdf. 33 U.S. EPA, Municipal Solid Waste Generation, Recycling and Disposal in the United States: Facts and Figures for 2006 p. 6, available at: http://www.epa.gov/epaoswer/non-hw/muncpl/pubs/msw06.pdf. 34 Freedonia, “Food Containers: Rigid and Flexible,” Study #2208, The Freedonia Group, 2007. 35 S. Moore, D. Gregorio, S. Weisberg, “Composition and Distribution of beach debris in Orange County, California,” Marine Pollution Bulletin, 42, 241-245,2001. 36 Save Our Shores, 2007-2008 Santa Cruz County beach clean up data, acquired from Aleah Lawrence-Pine, October 2008. 37 California Integrated Waste Management Board, Use and Disposal of Polystyrene in California, 2004. Available at: http://www.ciwmb.ca.gov/Publications/Plastics/43204003.pdf. 38 Id. 39 Id. 40 City of San Francisco Streets Litter Re-Audit 2008. Available at: http://sfenvironment.org/downloads/library/2008_litter_audit.pdf. 41 http://www.ciwmb.ca.gov/LGCentral/Basics/PlasticBag.htm. 42 The Ocean Conservancy, International Coastal Cleanup Report 2007. Available at: http://www.oceanconservancy.org/site/DocServer/ICC_AR07.pdf?docID=3741. 43 National Marine Debris Monitoring Program: Final Program Report, Data & Results, p 32. Available at: http://www.oceanconservancy.org/site/DocServer/NMDMP_Data_Results.pdf?docID=3226. 44 See note 30. 45 D. Styrek, F. Bernheisel, Mississippi Litter 2000, A Baseline Survey of Litter at 113 Street and Highway Locations, 2000. There is no comprehensive baseline survey of litter for California that focuses on identifying litter in terms of product wastes. Caltrans has conducted litter studies of roadside litter, such as the California Department of Transportation (June 2000) District 7 Litter Management Pilot Study, and these studies typically characterize litter in terms of composition, such as, paper, plastic, glass, and wood. 46 CIWMB, Plastics White Paper: Optimizing Plastics Use, Recycling and Disposal in California,” May 2003, p.8. 47 Municipal Solid Waste in the United States 1999, prepared by Franklin and Associates, Ltd., Washington, D.C., 2000. 48 See note 31. 49 OECD, “Extended Producer Responsibility: Case Study on the German Packaging Ordinance” May 1998, p. 25. 50 E. Pira, “Study on the Implementation of Directive 94/62/EC on Packaging and Packaging Waste Options to Strengthen Prevention and Re-use of Packaging,” Final Report, February 2005. 51 US EPA (2003), Municipal Solid Waste in the United States: 2001 Facts and Figures, p. 114. 52 See note 41. 53 http://www.ciwmb.ca.gov/BoardInfo/StrategicPlan/2007/SD05.htm. 54 http://www.caproductstewardship.org/about/participants.html. 55 See note 35. 56 See note 40. 57 http://www.ciwmb.ca.gov/LGCentral/Basics/PlasticBag.htm. 58 See note 42. 59 Friends of the L.A. River and the City of L.A., “L.A. River and Long Beach Waste Characterization Study,” 2004. 60 F. Convery, S. McDonnell, S. Ferreira, “The most popular tax in Europe? Lessons from the Irish plastic bags levy”, Environmental and Resource Economics, 38, 1-11, 2007.
An Implementation Strategy to Reduce and Prevent Ocean Litter
28
61 Bag ban information provided by City Council of Santa Monica report for February 12, 2008. 62 Resource and Environmental Profile Analysis of Polyethylene and Unbleached Paper Grocery Sacks, Franklin Associates, Ltd., 1990. 63 Distribution in Paper Sacks, CIT Ekologik, Chalmers Industriteknik, 2000. 64 C. K. Sommerfield, R. A. Wheatcroft, “Late Holocene sediment accumulation on the northern California shelf: oceanic, fluvial and anthropogenic influences”, GSA Bulletin, 119, 1120-1134, 2007. 65 Nolan-Itu Pty. Ltd. prepared for the Department of the Environment and Heritage, Environment Australia, “Plastic Shopping Bags – Analysis of Levies and Environmental Impacts,” 2002. 66 R. Tan, H. Khoo, “Life Cycle Assessment of EPS and CPB inserts: design considerations and end of life scenarios”, Journal of Environmental Management, 74, 195-205, 2004. 67 The Council for Solid Waste Solutions (now American Plastics Council), Resource and Environmental Profile Analysis of Foam Polystyrene and Bleached Paperboard Containers, prepared by Franklin Associates, Ltd., 1990. Available at: http://www.americanchemistry.com/s_plastics/bin.asp?CID=1211&DID=4602&DOC=FILE.PDF. 68 U.S. Environmental Protection Agency (1992), Plastic Pellets in the Aquatic Environment: Sources and Recommendations. 69 See note 35. 70 See note 35; U.S. Environmental Protection Agency (1992) Plastic Pellets in the Aquatic Environment: Sources and Recommendations. 71 See note 35. 72 Los Angeles County Dept. of Public Health: http://www.lapublichealth.org/tob/reports.htm. 73 See note 42. 74 In Sinclair Paint Co. v. State Bd. of Equalization, 937 P.2d 1350 (Cal. 1997), the court explained that the determination of whether a levy is a fee or a tax is based upon its operation and intent, not upon its label. Taxes raise revenue for the state’s general use, whereas fees are paid into specialized funds associated with a particular state service. Furthermore, fees serve to reimburse the state for specific costs associated with providing some benefit, service, or regulation, and cannot require the collection of more than the amount reasonably necessary to cover the cost of the state’s regulatory activities. 75 January 16, 2008, email communication from Eben Schwartz: recently compiled data by the California Coastal Commission indicates a 43% decrease in smoking litter on L.A. County beaches from 2004-2006. Smoking bans were in effect on a vast majority of L.A. County beaches by 2005. In those same years (2004-06), in areas where smoking was not banned, the presence of smoking litter increased. Similar decreases were found in San Diego and Santa Cruz counties, where smoking is banned on many beaches. 76 See note 11. 77 See note 42. 78 http://www.healthebay.org/news/2008/06_27_marinedebrisleg/default.asp.