An Ideal Observer Analysis of Visual Working Memory Ideal Observer Analysis of Visual Working Memory...
24
An Ideal Observer Analysis of Visual Working Memory Chris R. Sims, Robert A. Jacobs, and David C. Knill University of Rochester Limits in visual working memory (VWM) strongly constrain human performance across many tasks. However, the nature of these limits is not well understood. In this article we develop an ideal observer analysis of human VWM by deriving the expected behavior of an optimally performing but limited- capacity memory system. This analysis is framed around rate– distortion theory, a branch of information theory that provides optimal bounds on the accuracy of information transmission subject to a fixed information capacity. The result of the ideal observer analysis is a theoretical framework that provides a task-independent and quantitative definition of visual memory capacity and yields novel predictions regarding human performance. These predictions are subsequently evaluated and confirmed in 2 empirical studies. Further, the framework is general enough to allow the specification and testing of alternative models of visual memory (e.g., how capacity is distributed across multiple items). We demonstrate that a simple model developed on the basis of the ideal observer analysis— one that allows variability in the number of stored memory representations but does not assume the presence of a fixed item limit—provides an excellent account of the empirical data and further offers a principled reinter- pretation of existing models of VWM. Keywords: visual working memory, ideal observer analysis, information theory, rate– distortion theory Supplemental materials: http://dx.doi.org/10.1037/a0029856.supp Visual working memory (VWM)— defined as the ability to store task-relevant visual information in a rapidly accessible and easily manipulated form (Luck, 2008)—is a central component of nearly all human activities. It plays a critical role in online move- ment control (Brouwer & Knill, 2007, 2009), integration of visual information across eye movements (Irwin, 1991), visual search (Desimone & Duncan, 1995; Oh & Kim, 2004), and gaze correc- tion following saccadic error (Hollingworth, Richard, & Luck, 2008), among other functions. Given its biological importance, it is perhaps surprising that the capacity of this system is severely limited. Many investigations of human performance have revealed that we can accurately store only a surprisingly limited amount of visual information in working memory (for reviews, see Brady, Konkle, & Alvarez, 2011; Luck, 2008). In recent years there have been numerous attempts to define and quantify what is meant by VWM capacity. Until recently, the prevailing view has held that memory capacity is defined by a small, fixed number of discrete “slots” (Awh, Barton, & Vogel, 2007; Cowan, 2001; Lee & Chun, 2001; Luck & Vogel, 1997; Morey, 2011; Olsson & Poom, 2005; Rouder et al., 2008; Vogel, Woodman, & Luck, 2001), each of which can store a single visual object. The origins of this item-limited conception of working memory capacity may be attributed to Sperling (1960), who found that when experimental subjects were asked to recall letters or digits briefly presented in arrays, the subjects were able to report only four to five items correctly, even though it could be ascer- tained that nearly all items were present in iconic memory. Around the same time, George Miller (1956) drew on experimental evi- dence from a variety of sources and proposed that humans possess a limited “span of immediate memory” of around seven items. According to the simplest form of the item-limit model of visual working memory, visual objects can be maintained in memory with accuracy that is independent of the total number of items stored. That is to say, storing additional items does not degrade the quality of each memory representation. Further, this basic model does not posit any constraints on the visual complexity of an individual object stored in memory. For example, Vogel et al. (2001) found that the estimated capacity limit of 3– 4 items did not decrease when subjects were required to simultaneously store the color and orientation of objects, compared to the simpler task of storing only a single visual feature dimension. Although successful in accounting for many aspects of empiri- cal behavior, this basic slot model has been challenged. Several studies have shown that the complexity of visual objects interacts with memory capacity (Alvarez & Cavanagh, 2004; Luria, Sessa, Gotler, Jolicoeur, & Dell’Acqua, 2010) or that memory perfor- mance is higher when objects are taken from a domain of visual This article was published Online First September 3, 2012. Chris R. Sims, Robert A. Jacobs, and David C. Knill, Department of Brain and Cognitive Sciences and Center for Visual Science, University of Rochester. This research was supported by National Institutes of Health Grant R01-EY13319 to David C. Knill and National Science Foundation Grant DRL-0817250 to Robert A. Jacobs. We thank Leslie Chylinski for assis- tance with subject recruitment and data collection. The manuscript was greatly improved thanks to constructive comments from Steven Luck and Jeffrey Rouder. Correspondence concerning this article should be addressed to Chris R. Sims, Department of Brain and Cognitive Sciences and Center for Visual Science, University of Rochester, Rochester, NY 14627. E-mail: csims@ cvs.rochester.edu Psychological Review © 2012 American Psychological Association 2012, Vol. 119, No. 4, 807– 830 0033-295X/12/$12.00 DOI: 10.1037/a0029856 807
Transcript of An Ideal Observer Analysis of Visual Working Memory Ideal Observer Analysis of Visual Working Memory...
An Ideal Observer Analysis of Visual Working Memory
Chris R. Sims, Robert A. Jacobs, and David C. KnillUniversity of Rochester
Limits in visual working memory (VWM) strongly constrain human performance across many tasks.However, the nature of these limits is not well understood. In this article we develop an ideal observeranalysis of human VWM by deriving the expected behavior of an optimally performing but limited-capacity memory system. This analysis is framed around rate–distortion theory, a branch of informationtheory that provides optimal bounds on the accuracy of information transmission subject to a fixedinformation capacity. The result of the ideal observer analysis is a theoretical framework that providesa task-independent and quantitative definition of visual memory capacity and yields novel predictionsregarding human performance. These predictions are subsequently evaluated and confirmed in 2empirical studies. Further, the framework is general enough to allow the specification and testing ofalternative models of visual memory (e.g., how capacity is distributed across multiple items). Wedemonstrate that a simple model developed on the basis of the ideal observer analysis—one that allowsvariability in the number of stored memory representations but does not assume the presence of a fixeditem limit—provides an excellent account of the empirical data and further offers a principled reinter-pretation of existing models of VWM.
Keywords: visual working memory, ideal observer analysis, information theory, rate–distortion theory
Supplemental materials: http://dx.doi.org/10.1037/a0029856.supp
Visual working memory (VWM)—defined as the ability tostore task-relevant visual information in a rapidly accessible andeasily manipulated form (Luck, 2008)—is a central component ofnearly all human activities. It plays a critical role in online move-ment control (Brouwer & Knill, 2007, 2009), integration of visualinformation across eye movements (Irwin, 1991), visual search(Desimone & Duncan, 1995; Oh & Kim, 2004), and gaze correc-tion following saccadic error (Hollingworth, Richard, & Luck,2008), among other functions. Given its biological importance, itis perhaps surprising that the capacity of this system is severelylimited. Many investigations of human performance have revealedthat we can accurately store only a surprisingly limited amount ofvisual information in working memory (for reviews, see Brady,Konkle, & Alvarez, 2011; Luck, 2008).
In recent years there have been numerous attempts to define andquantify what is meant by VWM capacity. Until recently, the
prevailing view has held that memory capacity is defined by asmall, fixed number of discrete “slots” (Awh, Barton, & Vogel,2007; Cowan, 2001; Lee & Chun, 2001; Luck & Vogel, 1997;Morey, 2011; Olsson & Poom, 2005; Rouder et al., 2008; Vogel,Woodman, & Luck, 2001), each of which can store a single visualobject. The origins of this item-limited conception of workingmemory capacity may be attributed to Sperling (1960), who foundthat when experimental subjects were asked to recall letters ordigits briefly presented in arrays, the subjects were able to reportonly four to five items correctly, even though it could be ascer-tained that nearly all items were present in iconic memory. Aroundthe same time, George Miller (1956) drew on experimental evi-dence from a variety of sources and proposed that humans possessa limited “span of immediate memory” of around seven items.
According to the simplest form of the item-limit model of visualworking memory, visual objects can be maintained in memorywith accuracy that is independent of the total number of itemsstored. That is to say, storing additional items does not degrade thequality of each memory representation. Further, this basic modeldoes not posit any constraints on the visual complexity of anindividual object stored in memory. For example, Vogel et al.(2001) found that the estimated capacity limit of 3–4 items did notdecrease when subjects were required to simultaneously store thecolor and orientation of objects, compared to the simpler task ofstoring only a single visual feature dimension.
Although successful in accounting for many aspects of empiri-cal behavior, this basic slot model has been challenged. Severalstudies have shown that the complexity of visual objects interactswith memory capacity (Alvarez & Cavanagh, 2004; Luria, Sessa,Gotler, Jolicoeur, & Dell’Acqua, 2010) or that memory perfor-mance is higher when objects are taken from a domain of visual
This article was published Online First September 3, 2012.Chris R. Sims, Robert A. Jacobs, and David C. Knill, Department of
Brain and Cognitive Sciences and Center for Visual Science, University ofRochester.
This research was supported by National Institutes of Health GrantR01-EY13319 to David C. Knill and National Science Foundation GrantDRL-0817250 to Robert A. Jacobs. We thank Leslie Chylinski for assis-tance with subject recruitment and data collection. The manuscript wasgreatly improved thanks to constructive comments from Steven Luck andJeffrey Rouder.
Correspondence concerning this article should be addressed to Chris R.Sims, Department of Brain and Cognitive Sciences and Center for VisualScience, University of Rochester, Rochester, NY 14627. E-mail: [email protected]
Psychological Review © 2012 American Psychological Association2012, Vol. 119, No. 4, 807–830 0033-295X/12/$12.00 DOI: 10.1037/a0029856
807

expertise (Curby, Glazek, & Gauthier, 2009). However, somestudies have found no effects of familiarity on visual changedetection performance (e.g., Pashler, 1988), and subsequent re-search has suggested that it may be the precision and not numberof representations that is impacted by object complexity or famil-iarity (Awh et al., 2007; Scolari, Vogel, & Awh, 2008). Otherresearchers have explored how the precision of features stored invisual working memory may vary as a function of the number ofitems that are concurrently stored (Bays, Catalao, & Husain, 2009;Bays & Husain, 2008; Bays, Wu, & Husain, 2011; Palmer, 1990;Wilken & Ma, 2004). Based on the finding that memory precisionappears to decrease even when as few as 2 items are stored, it hasbeen proposed (Bays & Husain, 2008; Palmer, 1990; Wilken &Ma, 2004) that VWM capacity does not consist of a set of inde-pendent representations (slots) but is rather defined by a single,continuous pool of resources that is divided among all visualobjects in a scene: When two objects are stored, each receives halfof the available resources. As a result, the precision of memoryrepresentations is not constant but depends on the total number ofitems stored. Countering this hypothesis, a more recent version ofthe item-limit model, known as the “slots�averaging” model(D. E. Anderson, Vogel, & Awh, 2011; Cowan & Rouder, 2009;Zhang & Luck, 2008), holds to the claim that there are a fixed numberof slots (hypothesized to be around 3–4). But when fewer than thelimit are stored, two slots may “double up” by storing the same object,resulting in an increase in memory precision for that object.
Although both item-limit and continuous resource models areable to account for a range of empirical findings, neither has beendefined in enough detail to provide complete theories of humanVWM or to support quantitative predictions of human perfor-mance across a broad range of tasks and conditions. An importantlimitation of both models is that the relationship between hypoth-esized capacity limits and absolute performance has not been fullyspecified. In the case of item-limit models, an open questionconcerns how the precision of representations should be con-strained for items stored in individual slots. Existing item-limitmodels specify one type of capacity limit, on the maximum num-ber of items that can be stored, but offer little or no theoreticalcontribution regarding the capacity limits for individual itemsrepresented in individual slots. The continuous resource modelassumes that performance is constrained not by a discrete itemlimit but rather by a central pool of resources (e.g., encodinginformation via populations of neurons). However, in existingversions of the model there is no task-independent way of quan-tifying the overall capacity of visual memory, and consequentlythe model cannot predict in absolute fashion how memory capacityshould relate to behavioral performance.
In the present paper, we address these shortcomings by devel-oping a theoretical framework for studying and understanding howlimits on memory capacity relate to observed limits on perfor-mance. Rather than proposing theoretical mechanisms a posteriorito the empirical phenomena of visual memory, we instead developpredictions for behavior using the formal framework of informa-tion theory (Shannon & Weaver, 1949). In adopting this approach,the present analysis falls under the family of ideal observer anal-yses (Geisler, 2003, 2011) that have been successfully applied tounderstanding other aspects of the visual system (Knill & Rich-ards, 1996; Najemnik & Geisler, 2005;Pelli, 1990; Sims, Jacobs, &Knill, 2011).
In specifying the optimal performance for a given task, an idealobserver analysis serves as an important benchmark for comparisonwith human behavior. If humans are found to behave in close approx-imation to the ideal observer, their behavior can be explained as arational consequence of the information available in an environmentand known processing constraints on performance. Furthermore, anyperformance limitations predicted by the analysis can be given astrong theoretical, rather than speculative, interpretation. Finally, theframework follows in the spirit of sequential ideal observer analysis(Geisler, 1989), in which information coding constraints imposed atdifferent stages of processing in the human visual system are foldedinto the definition of an ideal observer, allowing one to infer therelative impact of different components of visual processing on per-formance. The framework supports modeling the constraints imposedby different functional architectures for VWM (e.g., continuous re-source vs. slots) on information encoding and hence on psychophys-ical performance in a variety of tasks. This supports “strong infer-ence” comparisons of qualitatively different models of VWM fromempirical data (Platt, 1964).
The starting point of the analysis is the fact that visual workingmemory may productively be studied as an information transmis-sion channel. Unlike that of artificial communication systems, thepurpose of human memory is not, primarily, to transmit informa-tion across large distances but rather to efficiently store andtransmit information across time. Our analysis of VWM havingbeen framed around this basic point, the resulting construct of acapacity limit is quantitative, theoretically grounded, and com-pletely task independent. Memory capacity is formally defined interms of Shannon information, or equivalently, the more familiarunit of bits. Much of the present analysis draws on results from abranch of information theory known as rate–distortion theory(Berger, 1971; Shannon & Weaver, 1949). Rate–distortion theoryprovides the theoretical bounds on performance for any capacity-limited communication system. That is to say, for a given capacitylimit, no physical system (biological or artificial) can exhibitperformance that exceeds the limits defined by the theory. Asapplied to visual working memory, rate–distortion theory predictsthe optimal performance of human memory, when performance isconstrained by a fixed information capacity.
Rather than defining a single, specific model of visual memory,the ideal observer analysis instead serves as the basis for a noveltheoretical framework that can be used for developing and evalu-ating different models of VWM. The common element amongmodels developed using this framework is the quantitative rela-tionship between a fixed memory capacity, specified usinginformation-theoretic constructs, and the absolute levels of humanperformance that can be achieved under the given capacity limit.Different models may entertain different assumptions regardingthe encoding process for visual memory (e.g., whether a fixednumber of items is stored, as hypothesized by discrete item-limitmodels) and how capacity is divided among items stored in mem-ory.1 Interestingly, both discrete slot and continuous resourcemodels can naturally be placed within the resulting theoreticalframework. As a result, existing models are given a strongertheoretical interpretation and, as we demonstrate, can be system-
1 The term encoding is meant throughout to be shorthand for the processof storing information in visual working memory.
808 SIMS, JACOBS, AND KNILL

atically compared and evaluated by adding or removing assump-tions and constraints.
Beyond providing a principled reinterpretation of existing mod-els, the ideal observer analysis yields quantitative predictions forhuman performance, including a novel prediction regarding therelationship between memory precision and the variance of visualfeatures in the environment. In particular, the ideal observer anal-ysis predicts that when performance is constrained by a capacitybottleneck, visual features with low variance in the environmentare fundamentally easier to encode (resulting in higher memoryprecision) than features with high variance. In the present paper,two behavioral experiments are described that are designed to testand ultimately confirm this prediction.
It is then demonstrated that a simple model derived from theideal observer analysis is able to offer a quantitative and parsimo-nious account for the data. We find that human performance acrossboth of our experiments is best characterized not by existingdiscrete slot or continuous resource models. Rather, the resultssuggest that encoding variability plays a large role in accountingfor VWM performance. According to this view, items are proba-bilistically selected to be encoded in visual working memory, suchthat there is trial-to-trial variability in the number of stored items.Unlike the continuous resource model, people may sometimesencode only a small subset of stimulus items in a given display.Previous discussions of item limit theories have allowed for thepossibility of trial-to-trial variability in the number of stored rep-resentations (e.g., Luck, 2008, p. 56; Vogel et al., 2001), but therelative contribution of this variability has not been explicitlytested in item-limit models fit to human data. Our results supportthe hypothesis that memory variability alone, in the absence of anexplicit item limit, can account for much of the empirical proper-ties of VWM performance (for a related model, see Van den Berg,Shin, Chou, George, & Ma, 2012). According to the best interpre-tation of the present data, people may sometimes encode andremember many items with low precision and may sometimesremember a few items precisely.
In the next section we provide a brief background on rate–distortion theory. We then apply the theory to develop the idealobserver analysis of visual working memory, before describingtwo experiments that test the predictions of the analysis.
Background on Rate–Distortion Theory
Claude Shannon noted in his seminal work on informationtheory that “the fundamental problem of communication is that ofreproducing at one point either exactly or approximately a messageselected at another point” (Shannon & Weaver, 1949, p. 31). Bystating the basis of information theory in this completely generalform, Shannon recognized that the results from the theory areapplicable to any domain where information must be conveyedover time or space. Human visual working memory, according tothis understanding, is a communication channel that functions byattempting to accurately transmit visual information from the timethat it is first received by the sensory apparatus to the moment thatit is later recalled or further processed to aid in performing a task.This section first considers the properties of a completely abstractbut optimally performing communication channel. In the nextsection, it is shown how the properties derived for this abstract
channel have direct implications for the performance of humanvisual working memory.
Intuitively, we develop a model of VWM according to whichmemory representations are noise-corrupted versions of incomingsensory signals. The amount of capacity available to memorydetermines the amount of noise that corrupts each representation:If capacity is high, memory representations are accurate andlargely uncorrupted by noise. If memory capacity is low, eachmemory representation consists of a highly noise-corrupted ver-sion of the original sensory signal, and the accuracy of memory isexpected to be poor. The visual working memory system is as-sumed to implement an optimal (Bayesian) decoder for these noisyrepresentations. That is to say, given a particular noisy encoding ofa sensory signal, the memory decoding process attempts to accu-rately reconstruct the original visual feature. This model furtherassumes that memory representations are adapted to the statisticsof features in the environment: The optimal memory reconstruc-tion is defined by a weighted combination of the noisy informationavailable from memory and the prior probability of differentfeature values determined by past experience or context.
The present analysis deals with the case where visual workingmemory must store simple visual features such as line length ororientation. These features are continuous valued and in a partic-ular task or environmental context can be described by a proba-bility density function. For example, if x is the length of a linesegment, then the context of previous trials or past experiencemight establish that x is a sample from some distribution p(x) (suchas a Gaussian distribution with a particular mean and variance).
The task for visual working memory is to store an accuraterepresentation of x over the relevant retention interval. Given thefact that memory is imperfect, the remembered feature value willin general be different from the sensory input. If x is defined as theinput to memory and xout is defined as the remembered featurevalue, then it is meaningful to treat visual working memory as acommunication channel with a conditional channel distributionp(xout|x). The channel distribution specifies the probability distri-bution over possible memory representations for a given visualfeature.
An important quantity that characterizes this channel is itsaverage information rate. Intuitively, if the channel is very noisyor otherwise limited, observing xout will, on average, leave sub-stantial uncertainty regarding the original feature value x; such achannel would be intuited to have a low information rate. Con-versely, a noise-free information channel will be such that it ispossible to accurately estimate x by observing only the channeloutput. More formally, the information rate, R, for a particularchannel and information source is defined as the average mutualinformation of the channel input and output,
R � I (x, xout)
� �� p(xout�x) p(x) log�p (xout�x)
p (xout)�dx dxout. (1)
Mutual information is a mathematical quantity that specifies howmuch the observation of one variable reduces the uncertaintyregarding the value of another variable. This equation thereforecaptures the intuition that a channel with a high information ratewill, on average, reduce much of the uncertainty regarding theinput value x after observing the channel output xout. When the log-
809IDEAL OBSERVER ANALYSIS OF VWM

arithm is taken as base 2, the information rate for a channel ismeasured in units of bits. A channel with an information rate of Rbits allows for perfectly discriminating between 2R different values(assuming all values are equally likely to occur); thus, accuratelyreporting the outcome of rolling an eight-sided die would requirea channel with an information rate of at least 3 bits. The use of theterm rate is due to the fact that information rate measures theaverage amount of information transmitted per event, averagingacross a long sequence of random events (e.g., repeatedly rollinga die). As applied to human VWM, the information rate of mem-ory, as measured in bits, is the average quantity of informationpreserved about visual features over a given retention interval.
One complication that arises for the case of continuous-valuedfeatures such as line length or orientation is that channels withfinite information rate can transmit only an approximation tovalues drawn from continuous distributions. Information theorydictates that in this case, it is guaranteed that on average, someamount of information will be lost in the process of storingfeatures in visual working memory. Given this fundamental limi-tation, an important question arises in designing or understandingany physical communication system. For a channel with a finiteinformation rate R, what is the smallest possible error that can beachieved by the given channel? Or alternatively, for a desired levelof performance, what is the minimum information rate necessaryfor a channel to achieve this criterion performance?
The branch of information theory that addresses these questionsis known as rate–distortion theory ( Berger, 1971; Shannon &Weaver, 1949). Fundamentally, rate–distortion theory providesthe optimal solution to the problem of information storage ortransmission, when performance is constrained by the capacitylimit of a channel. The two central constructs in the theory are theaverage information rate of a channel, defined for continuous-valued information sources in Equation 1, and the channel distor-tion, D. The distortion of a channel is defined by a function d(x,xout) that assigns a numerical cost to the event that an input valuex is reproduced by the communication channel as xout � x. Intu-itively, a perfect communication channel would introduce zerodiscrepancy between the channel input and output and would havezero distortion. The function d(x, xout) therefore defines the crite-rion for performance of the channel. The choice of a specificdistortion function can vary according to the application. However,a common distortion function is the squared error difference be-tween the channel input and output, d(x, xout) � (xout � x)2. Thischoice of distortion function leads to a channel distortion D, givenby averaging over the joint distribution of x and xout:
D � E [d (x, xout)]
� �� (xout � x)2 p(xout�x) p(x) dxout dx. (2)
With an information rate (1) and distortion function (2) in place,it is possible to characterize an optimal communication channel inthe following manner. For a fixed information rate R, one wouldlike to select, out of the space of all possible communicationchannels with the specified rate, the one that achieves the smallestpossible distortion D. Alternatively, one may fix a criterion levelof performance and select the channel that achieves this perfor-mance using the fewest bits, on average, to encode or transmitinformation. Formally, the relationship between these two quanti-ties is characterized by an equation known as a rate–distortion
function (Berger, 1971). This function provides the theoreticalbounds on performance for a fixed information capacity (thesmallest possible D for a given R) and, equivalently, a theoreticalminimum capacity R necessary to achieve a fixed level of perfor-mance D. In particular, in this paper we will consider the casewhere the information source consists of independent randomvariables drawn from a stationary Gaussian distribution, and thedistortion function to be minimized is assumed to be the squarederror. In this case, it can be shown (Berger, 1971) that the optimalrate–distortion function is given by
R(D) �1
2max�0, log
�2
D �, (3)
where �2 refers to the variance of the Gaussian distribution.This function is plotted in Figure 1 for a Gaussian information
source with arbitrary mean and unit variance. The information rateis infinite at zero distortion, implying that perfectly transmittingvalues from a continuous distribution would require an infinitenumber of bits.2 It should be emphasized that the rate–distortioncurve represents a theoretical bound on the performance of anycommunication channel. No physical system can exist thatachieves a performance level D using fewer than R(D) bits, onaverage, to encode or transmit information. This infeasible regionis indicated by the shaded area in Figure 1. As a direct conse-quence of this fact, the rate–distortion curve can also be used as adirect measure of the minimum capacity of any communicationchannel. By measuring the distortion of an information transmis-sion system, one can directly compute the minimum informationrate necessary to achieve this level of performance. If the channelcan be shown to transmit information at an average rate of R bits,then it is also the case that the capacity of the channel must be �Rbits.
All of the properties and results in this section have been derivedfor an abstract communication channel, without regard for thephysical implementation of that channel. However, the resultsobtained hold equally true if the physical channel consists of afiber-optic cable, a pulsed laser, or a population of biologicalneurons. Consequently, these results are equally applicable toquantifying the performance of human visual working memory.The next section explores the specific implications of the rate–distortion framework for studying and understanding human visualworking memory.
An Ideal Observer Analysis of Human Visual WorkingMemory
In this section we develop an ideal observer analysis (Geisler,2003, 2011) of human visual working memory, building upon thetheoretical results presented in the previous section. Ideal observeranalysis is an approach to studying perceptual systems that pro-ceeds by determining the theoretical upper bounds on perfor-
2 More surprisingly, the rate function reaches zero at the point D � �2.This indicates that for a Gaussian random variable, achieving a distortionof �2 does not require transmitting any information. In this case, thereceiver can simply guess that x is equal to the mean of the informationsource p(x) without receiving any information, and this will, on average,achieve a distortion equal to the variance of the source.
810 SIMS, JACOBS, AND KNILL

mance, given uncertainty inherent in the environment, as well asinternal factors that limit information processing.
In the present case, two internal factors contribute to limitinghuman performance. First, external information sources are cor-rupted by sensory noise before entering memory. Second, it isassumed that memory itself has a finite capacity but that memoryperforms optimally subject to this capacity constraint.
A schematic illustration of the basic memory system is given inFigure 2. As a running example, consider the task of comparing thesize of two apples that are sequentially examined. This task in-volves looking at and remembering the size of the first apple andthen looking at a second apple and comparing its visual size to theremembered size of the first apple. Following the notation ofFigure 2, we define the size of the first apple as x. All apples fallinto a typical range of sizes, which can be described by theprobability distribution p(x). For this example, we assume that thesize of apples can be described by a Gaussian distribution withmean �w and variance �w
2 . Before we can store the size of aparticular apple in visual memory, it must be encoded by thesensory system. It is known that the sensory encoding process isboth noisy and imperfect, resulting in a transformed signal xs,which can be described by the conditional distribution p(xs|x) �Normal �x, �s
2�, where �s2 defines the variance of the sensory noise.
This noisy sensory signal defines the input to VWM.Our model assumes that the operation of visual working mem-
ory is defined by two processes: encoding (or storing) visualfeatures in memory and the subsequent retrieval (or decoding) ofthe stored memory representations. The box labeled VWM inFigure 2 corresponds to this encoding and decoding process. Howshould the memory channel be designed in order to performoptimally? Based on the results from rate–distortion theory pre-sented in the previous section, it is known that for a given infor-mation rate, there is a minimum achievable distortion. The idealobserver analysis is therefore designed such that it achieves thistheoretical bound. Specifically, the memory encoding is defined as
xe, with a conditional distribution p(xe|xs) � Normal (xs, �e2). The
magnitude of encoding noise is chosen such that the memorychannel achieves a specified information rate R (given in bits):
�e2 �
�w2 � �s
2
22R � 1. (4)
The supplemental materials provide a full derivation for this equa-tion. Intuitively, when memory capacity is high (corresponding toa large value of R), the magnitude of encoding noise will be small,such that the memory encoding accurately reflects the sensoryrepresentation of the apple’s size; when memory capacity is low,the memory encoding xe will an unreliable indicator of xs.
As seen from Equation 4, for an optimal memory channel theamount of corrupting noise depends not only on the informationrate but also on the variance of features in the environment (�w
2 ),such that visual features with higher variance lead to noisiermemory representations. Intuitively, one can think of this effect asthe result of having to distribute a fixed capacity over a widerrange of possible feature values. Figure 3 plots the standard devi-ation of encoding noise as a function of the information rate ofmemory, for visual features with a low (solid line) or high (dashedline) variance. For a fixed capacity, the amount of encoding noiseis predicted to increase with the variance of visual features in theenvironment.
The decoding process is implemented as a Bayesian decoderthat infers the most probable (maximum a posteriori) estimate ofthe original sensory signal, labeled as xm in Figure 2. As shown inthe supplemental materials, the combination of a Gaussian noiseencoding and Bayesian decoder achieves the theoretical rate–distortion bound, such that no alternative system could achieve alower distortion for a given information rate. In our example, thismeans that memory minimizes the average squared error between
0.0 0.2 0.4 0.6 0.8 1.0
01
23
4
Distortion
Info
rmat
ion
rate
(bi
ts)
x ~ Normal(0, 1)
Figure 1. Rate–distortion curve for a Gaussian information source andsquared error distortion criterion. The curve indicates the theoretical min-imum information rate necessary to achieve a specified level of distortion.The shaded region indicates the infeasible region: No physical system canexist that achieves a performance level D using fewer than R(D) bits, onaverage, to encode information.
Figure 2. A schematic diagram of the ideal observer model of visualworking memory (VWM). The information source is defined by a proba-bility distribution, p(x), samples of which correspond to visual features tobe stored in VWM. Before entering memory, the signal is encoded via thesensory system, resulting in the (noisy) sensory signal xs. This signal isstored and then retrieved from VWM in an optimal manner, subject to acapacity limit. The output of memory, xm, represents the optimal estimateof the incoming sensory signal subject to the capacity constraint. A finaldecoder is then used to infer the optimal estimate of x, labeled as x̂.
811IDEAL OBSERVER ANALYSIS OF VWM

the sensory size of an apple and its remembered size, subject to aconstraint on the information rate. A squared-error cost functionhas previously been found to approximate the biological costfunction on motor error (Körding & Wolpert, 2004) and thereforeis a reasonable first choice for characterizing the biological cost onmemory error. Note that the assumption that memory attempts tominimize squared error is subsequent to the fact that a givenamount of capacity (R) has been allocated to encoding that partic-ular item; the question of how capacity is divided between multipleitems in a visual scene is a separate issue, which we return to later.
So far, it was shown that the output of VWM represents the mostaccurate reconstruction of its sensory input, subject to a finiteinformation rate limit. For an individual performing a particulartask, the true feature value, x, may be of more importance than itsnoisy sensory encoding xs. If the individual possesses knowledgeof the statistics of the information source and the noise character-istics of its sensory system, it is straightforward to extend themodel to compute a minimum mean-square error (MMSE) esti-mate of x given the memory signal xm. In particular, the MMSEestimate x̂ is given by
x̂ ��w�s
2 � xm�w2
�w2 � �s
2 . (5)
This equation can also be interpreted in terms of an optimalBayesian inference: The best estimate of the visual feature is givenby a weighted combination of the prior distribution (with mean�w) and the information available from memory (xm).
Returning to our running example, the value x̂ represents thebest possible estimate of the size of a particular apple, where thesize was stored in a limited-capacity visual working memorysystem. To compare the size of two apples, the individual can sim-ply compare this optimal memory estimate to the (noisy) sensorysignal corresponding to the size of the comparison apple.
As we have shown, the ideal observer analysis generates thedirect prediction that as the variance of features in the environmentincreases, the precision of memory should decrease. However, sofar the analysis has been limited to the case where only a singleitem must be stored in visual working memory. This leaves openthe question of how memory stores multiple visual features simul-taneously. For example, consider the task of remembering the sizesof six apples. In this case, is a single memory capacity dividedamong each apple, such that each is encoded with R/6 bits? Or arethere independent memory capacities for each item stored? Is iteven preferable to encode all six apples, perhaps with decreasedprecision, or should we instead focus our limited resources on asmall subset of items?
There is no universally optimal solution to this trade-off, and itis possible to construct tasks with different performance demandswhere different allocation strategies are optimal. Our approach istherefore to examine a family of related models, all linked by thecommon framework of rate–distortion theory but differing in theirassumptions of how memory capacity is divided and distributedamong multiple items. One of the models considered is optimal forthe particular experiments reported in this paper, but it may besuboptimal in tasks more closely matching the demands of thenatural environment. However, each model is optimally efficientin the sense of minimizing the squared error in memory represen-tations, subject to the constraints of a fixed information rate and aparticular encoding strategy.
In the next section, we report an experimental test of thepredictions derived from different models developed on the basisof the ideal observer analysis. To preview our results, we find thatperformance is best explained not by a fixed item limit, nor by theassumption that subjects encode all stimulus items. Instead, theresults favor a model according to which there is trial-to-trialvariability in the number of items stored in visual working mem-ory, without imposing an upper limit on the number of storeditems.
Experiments
In this section we describe two experiments conducted to eval-uate the predictions of the ideal observer analysis of visual work-ing memory. The two experiments differed in terms of the visualfeature that subjects had to store in VWM. In one experiment,subjects were tested on their memory for the angular orientation ofarrows; in the other experiment, subjects were tested on theirmemory for the length of line segments. In both experiments, wemanipulated the set size (number of items in the display) as well asthe variance of the distribution over features. On the basis of thetheoretical results derived in the previous section, we predict thatin conditions with high variance over features, memory perfor-mance should degrade. However, the ideal observer analysis doesnot uniquely predict how performance should drop, for example,whether subjects will encode fewer items with higher precision ora constant number of items but with lower precision. Thus, afurther purpose in the experiments is to empirically address thisquestion. Because the two experiments used a similar procedure,the experiments are described together.
0 1 2 3 4 5 6
010
2030
40
Information rate (bits)
Enc
odin
g no
ise
SD
Signal SD
1560
Figure 3. Standard deviation (SD) of corrupting noise added to sensorysignals that are stored in VWM, as a function of the information rate ofmemory (measured in bits) and variance of the features in the environment.This figure assumes a constant level of sensory noise, set to SD � 5, closeto the value obtained in fitting the model to empirical data from theorientation experiment (see the Appendix). VWM� visual working mem-ory.
812 SIMS, JACOBS, AND KNILL
Method
Subjects. Twenty-eight volunteers from the University ofRochester participated in the two experiments (14 subjects in eachexperiment). All subjects had normal or corrected-to-normal vi-sion.
Apparatus. Subjects were seated 40 cm from a flat-screen20-in. (diagonal measure) CRT monitor set to a resolution of1,280 � 1,024 pixels. Subjects’ heads were kept in a fixed locationrelative to the monitor using a chin rest. During the experiment,subjects also wore a head-mounted eye tracker (EyeLink II; SRResearch) that recorded gaze position at 250 Hz. The experimentalsoftware was written to ensure that subjects maintained stablefixation on a central cross for the duration of each trial. Trials inwhich eye movements were detected were discarded and repeatedduring the experiment.
Procedure. For the orientation experiment, at the start of eachtrial, subjects were shown a screen containing an array of eightsmall circles evenly spaced and equidistant from a central fixationcross (see Figure 4a). The circles were located 4 cm from thefixation point, resulting in an eccentricity of �5.5 degrees ofvisual angle. Subjects were instructed to maintain steady fixationon the fixation cross for the duration of each trial. After 250 ms, astimulus array was displayed (Figure 4b). This display consisted ofa varying number of colored arrows (length � 1.75 cm), eacharrow presented inside one of the small circles. The arrows wereshown at random angular orientations drawn from a Gaussiandistribution.3 The mean orientation of the arrows was zero degrees(defined as pointing to the top of the display). On different trials,the number of arrows varied, using set sizes of n � 1, 2, 4, or 8items. The trial order of the different set sizes was randomizedsubject to the constraint that each condition was presented an equalnumber of times. The arrows were uniquely colored and presentedagainst a gray background, using the set (red, orange, yellow,green, blue, purple, brown, and white). The mapping of colors tolocations was randomly determined for each subject but remainedconstant across trials. Subjects were instructed to memorize theorientation of each arrow. This stimulus presentation durationlasted for 500 ms, after which the display was blanked for aninterval lasting 500 ms.
After the memory retention interval, subjects were shown adisplay containing just one of the original arrows (see Figure 4c).The orientation of this arrow was always different from its previ-ous orientation and on different trials was perturbed by an amountdrawn from the set {�40, �20, �10, �2.5, �2.5, �10, �20, or�40} degrees, where positive perturbations correspond to rotatingthe arrow clockwise. The task for the subject was to decidewhether the arrow had been rotated clockwise or counterclockwiserelative to its previous orientation. Subjects responded by pressingone of two keys on a standard keyboard, depending on the direc-tion of the perturbation. Subjects were then given feedback regard-ing the correctness of their choice.
The variance of the Gaussian distribution governing the orien-tation of the arrows was manipulated as a within-subject condition.Subjects completed four sessions of the experiment on separatedays. On two consecutive days (either the first two or the last two),the arrows were drawn from a Gaussian distribution with lowvariance (SD � 15 degrees). On the other two sessions the Gauss-ian distribution used a high variance (SD � 60 degrees). The order
of the two variance conditions was counterbalanced across sub-jects.
In a separate experiment, subjects were tested on their memoryfor the length of line segments. In the line length experiment, theinitial display consisted of a single large circle (radius � 5 cm) anda fixation cross located at the center of the screen (see Figure 4d).After 250 ms, a stimulus array was shown. The stimuli consistedof colored line segments of varying lengths (width � 0.5 cm),presented so that the midpoint of each line segment was located onthe circle, and the line segments were oriented in a radial fashion(see Figure 4e). As with the orientation experiment, on differenttrials the set size varied, in the range of n � 1, 2, 4, or 8 items. Ona given trial the locations for the midpoints of the line segmentswere randomly selected from a fixed set of eight possible locationsevenly spaced around the circle. The set of colors for the linesegments was the same as for the orientation experiment.
After a 500-ms presentation interval, the screen was blanked for500 ms. Subjects were then shown a single line segment, chosenrandomly from the original set (see Figure 4f). The length of thisline segment was perturbed, by an amount drawn from the set {�1,�0.5, �0.25, �0.075, �0.075, �0.25, �0.5, or �1} cm. Subjectshad to report whether the line segment was longer or shorterrelative to its original length.
The lengths of the line segments were drawn from a log-normaldistribution. A log-normal distribution is a continuous probabil-ity distribution where the logarithm of its samples follows aGaussian distribution with a given mean and variance. A log-normal distribution was used for this experiment, as it is knownthat perceptual discriminability of line length is proportional tolength (Tudusciuc & Nieder, 2010), indicating a logarithmic rela-tionship between physical and perceived stimulus magnitude (asfollows from the Weber–Fechner law). By defining a log-normaldistribution over stimulus features, the resulting distribution ofperceived line lengths can reasonably be assumed to follow aGaussian distribution, simplifying the model analysis. The meanparameter of the log-normal distribution was 1.18 (log-transformed value; this results in a mean physical line length of�3.3 cm). The standard deviation parameter was manipulated as awithin-subject condition. During two consecutive sessions, thestandard deviation was 0.0748 (low-variance condition), and in theother two sessions the standard deviation was four times as high(high-variance condition, SD � 0.299). The order of the varianceconditions was counterbalanced across subjects.
For both experiments, subjects completed 56 trials in each of 64conditions (4 set sizes � 8 perturbation magnitudes � 2 varianceconditions), for a total of 3,584 trials per subject over the course offour 1-hr sessions conducted on separate days.
Results
Figure 5 plots the proportion of trials answered correctly as afunction of set size and signal variance condition. A 2 � 4
3 For features with a circular distribution, a Von Mises distribution maybe more appropriate in general. However, a Gaussian distribution wasdeliberately used for this experiment to maintain consistency with the idealobserver analysis. An equivalent ideal observer model could instead bederived for the case of Von Mises distributed features, but the resultingmathematics are rather more complicated.
813IDEAL OBSERVER ANALYSIS OF VWM
(variance � set size condition) repeated-measures analysis ofvariance was conducted in order to determine whether perfor-mance varied across different conditions of each experiment. Forthe orientation experiment, analysis of variance indicated a signif-icant main effect of set size (F(3,39) � 171.79, p .001), withperformance decreasing as the set size increased. The main effectof variance condition was also significant (F(1,13) � 162.85, p .001), with performance worse in the high-variance conditions ofexperiment. The interaction effect was also significant (F(3,39) �48.14, p .001), due to the fact that performance decreased morewith increasing set size in the high-variance condition, comparedto the low-variance condition. The results for the line lengthexperiment followed a similar pattern. Both the main effect of setsize (F(3,39) � 60.027, p .001) and that of variance condition(F(1,13) � 88.7, p .001) were found to be significant, as well asthe interaction of set size and variance condition (F(3,39) � 12.081,p .001).
The empirical results support the prediction that performanceshould be worse in the high-variance conditions of the experi-ments. However, in comparing performance in the low- and high-variance conditions, it is necessary to rule out several alternativeexplanations, unrelated to an information-theoretic account, that
may also account for the decrease in performance under high-stimulus variance conditions. In both experiments, stimuli in thehigh-variance condition were farther from the mean value, onaverage, than were those the low-variance condition. For judgmentof line length, it is known that longer stimuli are harder to dis-criminate (Tudusciuc & Nieder, 2010), and the same may hold truefor the orientation experiment if subjects coded the stimuli in termsof their angular distance from the mean orientation. Therefore,performance might be expected to be worse in the high-variancecondition because of poorer sensory discrimination and not be-cause of a limited-capacity memory system.
To address this possible confound, a subset of trials was ex-tracted from the high-variance condition in which the distributionof line lengths or orientations for the tested items was perfectlymatched to the distribution of features in the low-variance condi-tion.4 When performance of the low-variance trials and the sub-sampled high-variance trials is compared, a perceptual discrimi-nation account no longer predicts any performance difference (as
4 This was achieved using a technique known as rejection sampling(Gilks, Richardson, & Spiegelhalter, 1996).
(a)
(b)
(c)
(d)
(e)
(f)
Figure 4. Illustration of the experimental stimuli. (a–c): Orientation experiment. (d–f): Line length experiment.(a) Subjects were shown an array of eight small circles, evenly spaced and equidistant from a central fixationpoint. (b) A varying number of colored oriented arrows were presented for 500 ms. (c) After a 500-ms blankretention interval, subjects were shown a display containing just one of the original arrows. Subjects were askedto decide if the colored arrow had been rotated clockwise or counterclockwise from its previous orientation. Forthe line length experiment (d–f), the task was similar, except subjects memorized the length of colored linesegments and were asked to decide if the probe item had been increased or decreased in length relative to itsprevious size.
814 SIMS, JACOBS, AND KNILL

the two conditions have an identical distribution of feature values).However, the ideal observer analysis still predicts that perfor-mance should be worse on the subsampled high-variance trialsthan in the true low-variance condition. The intuition for this is inadapting the memory system to encoding higher variance features,the same fixed capacity must allow for coding stimuli over a widerrange of values, leaving lower precision for any individual stim-ulus item. As a result, the information-theoretic account predictsthat performance should be worse even when examining a low-variance subsample of the high-variance condition.
The diagonally shaded bars in Figure 5 show the mean propor-tion correct in each set size condition for a low-variance subsamplefrom the high-variance condition. As predicted by the information-theoretic account, performance on these subsampled trials is sig-nificantly worse than in the low-variance condition for the orien-tation experiments (F(1,13) � 51.581, p .001) and line lengthexperiments (F(1,13) � 38.395, p .001). Hence, the lower per-formance in the high-variance condition cannot be attributed toany perceptual properties of the task unique to the high-variancecondition.
In both experiments, the probe items were obtained by addingpositive or negative perturbations to features drawn from proba-bility distributions with fixed variance. Because of this property,subjects could guess at above-chance levels by adopting the fol-lowing strategy: If the orientation or line length of the probe itemis greater than the mean value, report a positive perturbation. Thelogic of this strategy is that probe items with feature values greaterthan the mean are more likely to have been perturbed positivelythan negatively. This strategy would be expected to be moresuccessful in the low-variance condition (although still well belowempirically observed performance), because large positive or neg-ative perturbations would be more distinguishable from randomtrial-to-trial variation in the low-variance condition than the high-variance condition. However, the empirical data render an accountbased solely on this guessing strategy unlikely. Existing item-limitmodels of visual memory generally assume that the limit is atleast two items. Hence, these models predict that it is unlikelythat responses in the low-set-size conditions (one or two items)reflect guesses made by subjects. Therefore, a guessing explana-
tion predicts no performance difference between variance condi-tions at low set sizes, and the information-theoretic account stillpredicts a performance decrement in the high-variance condition.Consistent with the information-theoretic account, performancewas worse in the high-variance condition at set sizes of one andtwo items; statistical test results are given in Table 1.
It remains possible that the difference in performance betweenthe two variance conditions is due to subjects adopting differentresponse strategies in the two conditions. However, the design ofthe present experiments, as well as the results obtained, rendersany explanation for the variance effect based solely on strategydifference in the two conditions unlikely. First, all subjects com-pleted both variance conditions, so if subjects adopted a particularsuboptimal strategy in one session, it would likely carry over totheir performance in subsequent sessions. Second, given that hu-man performance conforms to the predictions of a limited-capacitybut optimal memory system, if subjects in fact adopted suboptimalor heuristic decision strategies in the different variance conditions,it seems inescapable that these strategies would have to at leastapproximate the behavior of a near-optimal memory system.
Figure 6 shows the proportion of test items judged as positivelyperturbed as a function of the perturbation added to the featurevalue. Positive values correspond to clockwise perturbations in the
Orientation experiment Length experiment
0.5
0.6
0.7
0.8
0.9
1.0
Set size
Pro
port
ion
corr
ect
1 2 4 8
Low varianceHigh varianceSubsampled high variance
0.5
0.6
0.7
0.8
0.9
1.0
Set size
1 2 4 8
Low varianceHigh varianceSubsampled high variance
Figure 5. Proportion of trials answered correctly as a function of set size and variance condition. The left plotshows data from the orientation experiment, and the right plot is from the line length experiment. Each plot alsoshows the performance on a randomly selected subset of trials from the high-variance condition (plotted usingdiagonally shaded bars), chosen to exactly match the stimulus distribution of the low-variance condition. (Seetext for details.) Error bars correspond to 95% confidence intervals around the mean proportion correct.
Table 1Statistical Comparison of Proportion of Trials Correct in theLow Versus High Variance Condition of Each Experiment atLow Set Sizes
Experiment and set size Mean difference t p
OrientationN � 1 0.035 3.35** .005N � 2 0.074 7.64*** .001
Line lengthN � 1 0.057 3.9** .002N � 2 0.070 8.32*** .001
Note. All tests reported are two-sided paired t tests with 13 degrees offreedom.** p .01. *** p .001.
815IDEAL OBSERVER ANALYSIS OF VWM

orientation experiment and increases in length for the line lengthexperiment. Data are plotted separately for each set size (varyingacross columns) and signal variance condition (varying acrossrows). As expected, the probability of judging the perturbation tobe positive increased in monotonic fashion with the actual pertur-bation. However, less obvious is how response probability shouldvary with increasing set size or feature variance. To achieve a morefine-grained assessment of human performance, we fit to the datapsychometric functions that assume that the empirical data consistof a mixture of two response types: trials where the probed itemwas stored in memory and response probability is assumed tofollow a cumulative Gaussian function of perturbation magnitudeand trials where the probed item was not stored and responses aremade randomly. The key parameters of the psychometric functionare the proportion of random responses and the slope of the
Gaussian cumulative function evaluated at threshold (wherethreshold is defined as the perturbation magnitude resulting in a50% probability of reporting a positive perturbation).
These parameters of psychometric performance have beenclosely scrutinized for evidence regarding the existence of itemlimits in visual working memory (D. E. Anderson et al., 2011;Bays et al., 2009; Cowan & Rouder, 2009; Thiele, Pratte, &Rouder, 2011; Zhang & Luck, 2008). Changes in the slope of thepsychometric function indicate changes in the precision withwhich items are stored in VWM; therefore, by examining how thepsychometric slope changes across set sizes it is possible to ex-amine the effect of storing more items on the precision of eachmemory representation. Existing item-limit models predict that thepsychometric slope should reach a plateau and remain constantonce the set size exceeds the available number of slots in visual
Figure 6. Proportion of trials judged as perturbed positively as a function of true perturbation, for eachcondition of the experiment. Human data are indicated by black marker points; error bars indicate 95%confidence intervals. The smooth curves show the predictions of the flexible encoding model. (a) Data from theposition experiment. (b) Data from the orientation experiment. Var. � variance.
816 SIMS, JACOBS, AND KNILL
working memory. Beyond the item limit, increasing the set sizeshould not influence the precision with which items are stored butrather only impact the probability that the probe item was encodedduring stimulus presentation. The continuous resource model, onthe other hand, predicts that precision should monotonically de-crease with increasing set size. Further, because all items areassumed to be encoded, the continuous resource model predictsthat the lapse rate should equal zero for all set sizes. However, ithas been demonstrated that estimated lapse rates can be nearly zerowhen the experimental design allows subjects to make educatedguesses, even if not all items were encoded in memory (Thiele etal., 2011). Consequently, finding a low estimated lapse rate doesnot decisively rule out item-limit models.
We estimated parameters of the psychometric function using ahierarchical Bayesian model. Bayesian inference proceeds by plac-ing prior distributions over each parameter and inferring posteriorprobability distributions from the available data. In a typical (non-hierarchical) analysis, each subject is assumed to be independent;therefore, the parameter estimates for one subject do not inform theestimates for other subjects. A hierarchical model extends thisapproach by assuming that the variability between subjects isstructured: The distribution of subject-specific parameters is as-sumed to follow a population-level distribution. This dependencystructure increases statistical power and reduces the influence ofoutliers in parameter estimation (Morey, 2011; Rouder, Sun,Speckman, Lu, & Zhou, 2003) and can be a valuable tool forinvestigating individual differences among subjects (Navarro,Griffiths, Steyvers, & Lee, 2006). A tutorial introduction to hier-archical Bayesian models as applied to psychological research canbe found in Rouder and Lu (2005). Implementation details of thepsychometric function and parameter estimation are provided inthe supplemental materials.
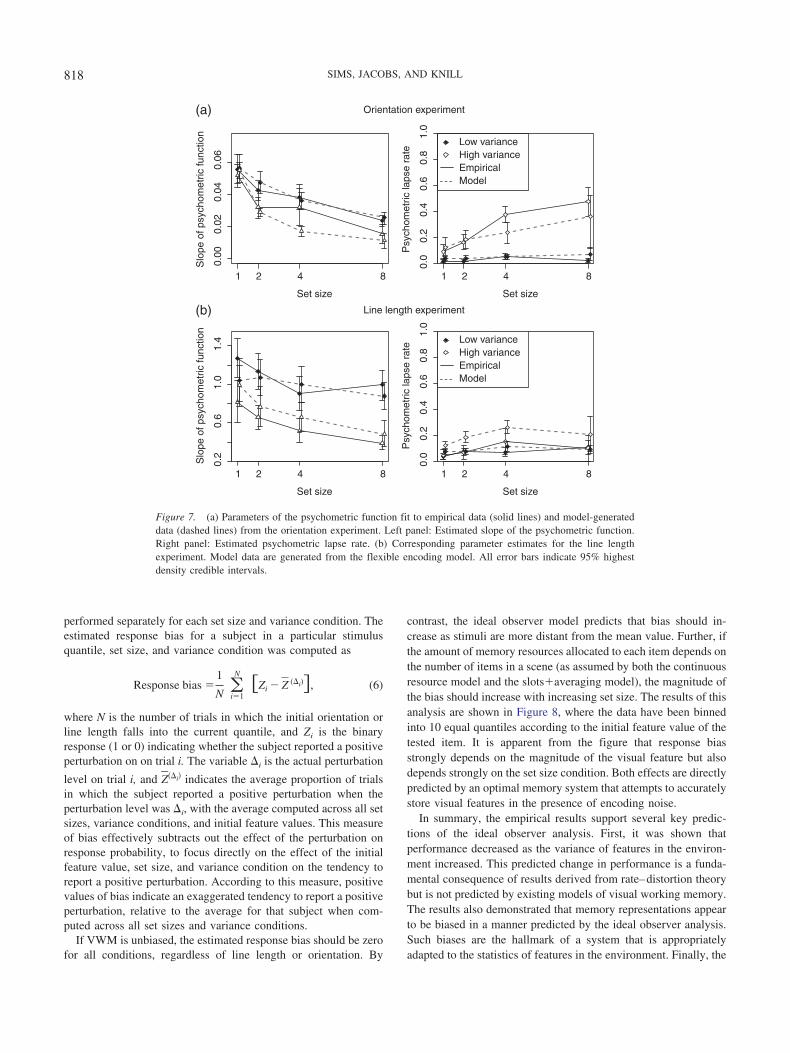
Figure 7 plots the estimated mean psychometric slope and lapserate parameters. For both experiments, the slope is lower in thehigh-variance condition—this indicates that increasing the vari-ance of features in the environment led to a decrease in theprecision of memory representations. Additionally, the precisionof memory representations decreased with increasing set size. It isalso noteworthy that the results contain aspects that are partiallyinconsistent with both continuous resource and item-limit modelsof visual working memory. In the orientation experiment, thepsychometric slope decreased from set size 4 to set size 8 in bothvariance conditions.5 This finding is inconsistent with item-limitmodels that assume that subjects can encode a maximum of 3–4items (the typical item limit reported, though individuals mayexhibit variation in item capacity; Rouder et al., 2008; Vogel &Machizawa, 2004). Increasing the set size beyond the item limitshould have no effect on the precision of memory representationsand should therefore not affect the slope of the psychometricfunction. At the same time, the results are inconsistent with thecontinuous resource model, because the high-variance condition ofthe orientation experiment shows that the psychometric lapse rateincreases at large set sizes. In the line length experiment, there wasno evidence for a decrease in slope beyond a set size of 4 items,and the estimated lapse rate was near zero for all conditions.
For the largest set size and high-variance conditions of bothexperiments, the estimated slope parameters were found to behighly correlated with the corresponding lapse rate parameters. Inother words, when the psychometric function is nearly flat, the
empirical data do not unambiguously resolve both parameters. Forthe line length experiment, the correlation between slope and lapserate was r2 � 0.73 (set size 8, high-variance condition), and in theorientation experiment the correlation was r2 � 0.65. Model-fitting techniques that produce only a single set of best fittingparameters (e.g., the procedure reported in Zhang & Luck, 2008,and D. E. Anderson et al., 2011) fail to account for these correla-tions and may potentially give misleading conclusions. However,as a Bayesian analysis provides a joint posterior distribution overboth parameters, taking into account uncertainty in their values,the conclusions drawn with respect to the decrease in slope remainvalid, regardless of the correlation with the lapse parameter.
A further property of the ideal observer model is that it predictsthat memory representations should be biased. Because memoryretrieval is assumed to be a process of decoding a noise-corruptedrepresentation, the optimal Bayesian solution is to combine thenoisy memory information available on a given trial with priorknowledge of the statistics of the relevant visual feature. As aresult, the ideal observer model predicts that memory representa-tions should be biased toward the mean feature value, and previousexperiments have also demonstrated the existence of biased mem-ory representations (Brady & Alvarez, 2011). However, theamount of bias should also depend on the actual stimulus on agiven trial: Visual features that are outliers (farther from the meanvalue) should be more strongly biased in absolute terms thanfeatures that are more typical (closer to the mean). This impliesthat when tested on a line segment (in the line length experiment)that was initially much longer than average, the subject should bemore likely to report that the probe stimulus was increased inlength rather than decreased.
Additionally, the amount of bias might also depend on thenumber of items that are concurrently stored in memory. Whenmany items are encoded, fewer resources may be allocated to eachitem, and therefore the encoding process would be expected tointroduce more noise into the representation. In this case, theoptimal Bayesian solution is to give more weight to the priordistribution over features. As a result, the ideal observer modelpredicts that memory representations should be more stronglybiased in the high-set-size conditions, where more items are likelyto be encoded simultaneously. The predicted effects of featurevariance on bias are less straightforward: With higher featurevariance, the prior distribution is less informative; on this basis onewould expect a smaller amount of bias. However, memory repre-sentations are also less precise in the high-variance condition,leading to an increased reliance on the prior. These two factorscounterbalance each other, and therefore the model does not makea clear-cut prediction regarding the amount of bias in the twovariance conditions of the experiment (further details are given inthe supplemental materials).
To investigate the extent to which VWM was biased in theexperiments, we binned the response data according to the initialfeature value (orientation or line length) of the to-be-tested stim-ulus item into 10 equal quantiles. This binning procedure was
5 The change in slope was verified by determining the 95% credibleinterval for the difference in slope between conditions: When the credibleinterval for this difference excludes zero, the hypothesis that the slope didnot change is rejected.
817IDEAL OBSERVER ANALYSIS OF VWM
performed separately for each set size and variance condition. Theestimated response bias for a subject in a particular stimulusquantile, set size, and variance condition was computed as
Response bias �1
N �i�1
N
Zi � Z� (�i), (6)
where N is the number of trials in which the initial orientation orline length falls into the current quantile, and Zi is the binaryresponse (1 or 0) indicating whether the subject reported a positiveperturbation on on trial i. The variable i is the actual perturbation
level on trial i, and Z���i� indicates the average proportion of trialsin which the subject reported a positive perturbation when theperturbation level was i, with the average computed across all setsizes, variance conditions, and initial feature values. This measureof bias effectively subtracts out the effect of the perturbation onresponse probability, to focus directly on the effect of the initialfeature value, set size, and variance condition on the tendency toreport a positive perturbation. According to this measure, positivevalues of bias indicate an exaggerated tendency to report a positiveperturbation, relative to the average for that subject when com-puted across all set sizes and variance conditions.
If VWM is unbiased, the estimated response bias should be zerofor all conditions, regardless of line length or orientation. By
contrast, the ideal observer model predicts that bias should in-crease as stimuli are more distant from the mean value. Further, ifthe amount of memory resources allocated to each item depends onthe number of items in a scene (as assumed by both the continuousresource model and the slots�averaging model), the magnitude ofthe bias should increase with increasing set size. The results of thisanalysis are shown in Figure 8, where the data have been binnedinto 10 equal quantiles according to the initial feature value of thetested item. It is apparent from the figure that response biasstrongly depends on the magnitude of the visual feature but alsodepends strongly on the set size condition. Both effects are directlypredicted by an optimal memory system that attempts to accuratelystore visual features in the presence of encoding noise.
In summary, the empirical results support several key predic-tions of the ideal observer analysis. First, it was shown thatperformance decreased as the variance of features in the environ-ment increased. This predicted change in performance is a funda-mental consequence of results derived from rate–distortion theorybut is not predicted by existing models of visual working memory.The results also demonstrated that memory representations appearto be biased in a manner predicted by the ideal observer analysis.Such biases are the hallmark of a system that is appropriatelyadapted to the statistics of features in the environment. Finally, the
(a) Orientation experiment
(b) Line length experiment
0.00
0.02
0.04
0.06
Set size
Slo
pe o
f psy
chom
etric
func
tion
1 2 4 8
0.0
0.2
0.4
0.6
0.8
1.0
Set size
Psy
chom
etric
laps
e ra
te
1 2 4 8
Low varianceHigh varianceEmpiricalModel
0.2
0.6
1.0
1.4
Set size
Slo
pe o
f psy
chom
etric
func
tion
1 2 4 8
0.0
0.2
0.4
0.6
0.8
1.0
Set size
Psy
chom
etric
laps
e ra
te
1 2 4 8
Low varianceHigh varianceEmpiricalModel
Figure 7. (a) Parameters of the psychometric function fit to empirical data (solid lines) and model-generateddata (dashed lines) from the orientation experiment. Left panel: Estimated slope of the psychometric function.Right panel: Estimated psychometric lapse rate. (b) Corresponding parameter estimates for the line lengthexperiment. Model data are generated from the flexible encoding model. All error bars indicate 95% highestdensity credible intervals.
818 SIMS, JACOBS, AND KNILL

estimated parameters of the psychometric function produced re-sults at least partially inconsistent with both item limit and con-tinuous resource models. In the next section, we compare severalmodels developed within the framework of the ideal observeranalysis to determine which most accurately accounts for thespecific pattern of results obtained in the two experiments.
Ideal Observer Analysis Applied to Empirical Data
In order to generate quantitative predictions for the data fromthe experiments, it is necessary to specify how items are selectedto be encoded in visual working memory (for example, whetherthere is a fixed item limit and how capacity is divided amongencoded items). Rather than defining a single model, the idealobserver analysis instead serves as the theoretical foundation for afamily of related models. Each of the models in this family islinked through its use of rate–distortion theory to predict optimalperformance for a given total information capacity and allocationof that capacity among items. In this section, we also consider theability of two non-information-theoretic models—existing ver-sions of the continuous resource (Bays & Husain, 2008; Wilken &Ma, 2004) and slots�averaging (Cowan & Rouder, 2009; Zhang& Luck, 2008) models—to account for the empirical data.
Information-Theoretic Models
For all models considered in this section, the response on eachtrial (assuming the probe item was encoded in memory) is obtained
by comparing the sensory-noise-corrupted probe stimulus to thememory estimate of the original item. If ys is the sensory obser-vation of the probe stimulus, and x̂ is the optimal memory recon-struction computed according to Equation 5, then the decision ruleis simply
Decision ��� , (ys � x̂) 0,
� , (ys � x̂) 0,(7)
where � is a response indicating a positive perturbation (clock-wise in the orientation experiment or longer in the line lengthexperiment). The supplementary materials provide a proof that thisis the optimal decision rule for the psychophysical experiments.Although all models adopt this decision rule, it is possible to definemodels that differ in terms of how many items are encoded andhow memory capacity is divided among encoded items.
Information-theoretic continuous resource model. If mem-ory capacity is given by R bits and there are n items to store inVWM, a simple approach would be to store all n items, encodingeach with an information rate of R/n bits. As is shown later, this isalso the optimal allocation strategy for the particular experimentsreported here. This model predicts that as the number of itemsstored in memory increases, the precision with which each itemis encoded will necessarily decrease. This would correspond to aninformation-theoretic reinterpretation of a continuous resourcemodel (Bays & Husain, 2008; Palmer, 1990; Wilken & Ma, 2004),which evenly distributes a continuous pool of resources among all
−0.
4−
0.2
0.0
0.2
0.4
Initial stimulusorientation (Decile)
Rel
ativ
e re
spon
se b
ias
0.1 0.3 0.5 0.7 0.9
Low varianceHigh varianceEmpiricalModel
0.1 0.3 0.5 0.7 0.9 0.1 0.3 0.5 0.7 0.9 0.1 0.3 0.5 0.7 0.9
−0.
4−
0.2
0.0
0.2
0.4
Initial stimuluslength (Decile)
Rel
ativ
e re
spon
se b
ias
0.1 0.3 0.5 0.7 0.9 0.1 0.3 0.5 0.7 0.9 0.1 0.3 0.5 0.7 0.9 0.1 0.3 0.5 0.7 0.9
Initial stimulusorientation (Decile)
Initial stimuluslength (Decile)
Initial stimulusorientation (Decile)
Initial stimuluslength (Decile)
Initial stimulusorientation (Decile)
Initial stimuluslength (Decile)
Low varianceHigh varianceEmpiricalModel
Set size = 1 Set size = 2 Set size = 4 Set size = 8
Orientation experiment
Set size = 1 Set size = 2 Set size = 4 Set size = 8
Line length experiment
(a)
(b)
Figure 8. Relative response bias, defined as the tendency to report a positive perturbation, as a function of theinitial feature value of the to-be-tested item, set size, and variance condition. Feature values are binned into 10equal quantiles (deciles), and response bias is computed separately for each subject, quantile, and experimentalcondition (set size and feature variance). (a) Data from the orientation experiment. (b) Data from the line lengthexperiment. Error bars indicate 95% confidence intervals, averaging across subjects.
819IDEAL OBSERVER ANALYSIS OF VWM
visual features in a scene. However, rather than being abstractlyspecified, the notion of a shared resource is now precisely definedin terms of bits of capacity. This allows the model to predictabsolute levels of performance, whereas existing instantiations ofthe continuous resource model can only predict relative perfor-mance across different set sizes. Further, the information-theoreticimplementation of the model allows it to directly predict perfor-mance differences between the two variance conditions of theexperiments, whereas existing formulations of this model wouldpredict no effect of feature variance on performance.
Information-theoretic slots�averaging model. An alterna-tive possibility is that the visual working memory system encodesonly a limited subset of items. Many existing theories of visualworking memory assume that there is an upper limit of �3–4items that can be stored simultaneously (e.g., Cowan, 2001). Sucha model can be implemented in the rate–distortion framework byassuming that there are separate distinct slots, each with a capacityof R bits, where R is independent of the number of items stored.Once all the available slots are filled, no additional items areencoded. The slots�averaging model (Cowan & Rouder, 2009;Zhang & Luck, 2008) is a recent theory of visual working memorythat similarly assumes an item limit but allows any unused slots to“double up,” so that multiple slots may encode the same item. Wederived an information-theoretic version of this model by assum-ing that each encoded item receives j � R bits of capacity, wherej is the number of slots assigned to that particular item and R is theinformation capacity of a single slot. For example, if an item isstored in two slots, then it is encoded with 2 � R bits. Accordingto this model, if a scene contains more objects than available slots,each slot encodes a unique object. If the scene contains fewerobjects than available slots, each object is encoded in one slot, andthe remaining slots are randomly assigned to objects, so that thereis a chance that the same object may be encoded in two or moreslots.
The information-theoretic slots�averaging model has two dis-tinct advantages over standard (non-information-theoretic) item-limit models. First, the information-theoretic model is able toquantify, in task-independent fashion, the precision with which asingle slot can represent an object or visual feature. Note thatthough existing discrete slot models are largely silent on the issueof capacity limits for individual slots, rate–distortion theory makestransparent that such limits must necessarily exist and furtherenables a means of estimating this capacity. If human performanceis only weakly constrained by the capacity limits of individualslots, the information-theoretic discrete slot model would be ableto reveal this as well. Second, the information-theoretic implemen-tation predicts that memory precision for stored items should beworse in the high-variance condition, even assuming a constantnumber of slots and fixed storage capacity per slot. To account forthe effects of the variance manipulation, existing item-limit modelswould need to postulate an additional constraint or mechanism.
Stochastic encoding models. Although the slots�averagingmodel allows unused slots to be randomly assigned to objects in ascene, resulting in higher precision encodings of some items, themodel in its simplest form still assumes that the total number ofitems encoded on each trial is fixed and deterministic. Previousdiscussions of item-limit models have raised the possibility thatthere is some amount of trial-to-trial variability in the number ofitems encoded (e.g., Luck, 2008, p. 56; Vogel et al., 2001), but
they have not attempted to estimate the magnitude of variabilitypresent in behavioral data for individual subjects. However, infer-ring the magnitude of this variability is critical in evaluatingwhether there is a strong upper limit on the number of items thatcan be maintained in VWM. For example, it is possible that VWMhas a capacity limit of 8 items, but on each trial individuals encodesome random number of items between 0 and 8, chosen equallyoften. In this case, an item-limit model fit to such a data set wouldlead to an estimated item limit of 4 items (the average numberencoded), when in fact the true item limit is twice as high.Similarly, it is also possible for the average number of encodeditems to be in the range of 3–4, without requiring any upper limitin VWM.
Because of this potential confound, it is necessary to considerencoding models where there is an explicit probability distributionover the number of items encoded in memory, rather than estimat-ing only the average number of items stored. By directly estimat-ing encoding variability, it is possible to assess the strength ofevidence for an upper limit on VWM representations. A simplemodel in this family is one that assumes that there is a constantprobability of encoding each additional item; this leads to a bino-mial distribution over the number of encoded items on a giventrial. In the present implementation, we allow for the possibilitythat this encoding probability differs across set size and varianceconditions of the experiment. This model—referred to as thebinomial encoding model—requires estimating one parameter (theencoding probability) of the binomial distribution in each condi-tion. Although this model allows for trial-to-trial variability inencoding, it does not require an upper limit on the number of itemsthat can simultaneously be stored. On trials where more items areencoded, a central shared capacity is divided more thinly amongeach item.
The binomial encoding model allows considerable variability inthe number of items encoded. However, it still assumes that thedistribution over the number of encoded items follows a particularparametric form (i.e., a binomial distribution). Therefore, we alsoconsider a model in which the distribution over the number ofencoded items is completely unconstrained. That is to say, we treatthe probabilities of encoding 0 . . . n items in each condition as freeparameters to be estimated from the data. This “flexible encoding”model includes as special cases both the discrete item-limit and thecontinuous resource models. For example, a discrete item-limitmodel predicts that subjects always encode 4 items (assuming a setsize � 4 items). This is captured by an encoding distribution thatselects 4 items with probability 1, assigning 0 probability to thepossibility of encoding more or fewer items. Similarly, the con-tinuous resource model predicts that individuals encode all stim-ulus items in the display with probability 1. Thus, both encodingmechanisms are special cases of the flexible encoding model. Byconsidering a model flexible enough to encompass a range ofpossibilities, it is possible to gain insight as to the properties ofVWM by examining the resulting parameter estimates from themodel. For both the binomial model and the flexible encodingmodel, we assume that the capacity is evenly divided among allencoded items, so that if there are n items encoded on a particulartrial and R bits of total capacity, each encoded item receives R/nbits of capacity.
Both the flexible encoding model and the binomial encodingmodel represent possible instantiations of the hypothesis that en-
820 SIMS, JACOBS, AND KNILL
coding variability plays a significant role in human VWM perfor-mance. Further, both models allow for trial-to-trial variability inthe number of encoded items without assuming an upper item limiton storage. It is possible to imagine a number of other plausiblemodels in this family. However, our primary concern lies inestimating the relative magnitude of encoding variability in VWMperformance in comparison to existing item limit and continuousresource models, which assume a comparatively minimal role forencoding variability.
Decision Rule When the Probe Item Was Not Encodedin Memory
For all of the models except the continuous resource model, anadditional detail must be specified regarding how responses aregenerated on trials when the probed item was not encoded duringthe initial stimulus presentation (the continuous resource modelassumes that all items are encoded on each trial). If an item was notencoded in memory, subjects could simply guess if tested on thatitem. However, the design of the experiments allows subjects tomake above-chance guesses based purely on the statistics of theprobe stimulus. To account for this possibility, if tested on an itemnot encoded in memory, the models computed the probability of apositive or negative perturbation based solely on the probe stim-ulus and knowledge of the task (the discrete perturbation levelsand the mean and variance of the feature values). We define P( �0|ys) as the probability that a probe item was perturbed positively,given only the observation of the probe stimulus (the equation forcomputing this is provided in the supplemental materials). The“optimal guessing strategy” is to respond that a positive perturba-tion occurred whenever P( � 0|ys) � 0.5. For the present exper-iments, this occurs whenever ys is perceived to be greater than themean orientation or line length over visual features. This leads tothe optimal guessing strategy
Decision � �� , (ys � �w) 0,
� , (ys � �w) 0.(8)
The similarity between Equations 8 and 7 reveals that the optimalguessing strategy is in fact a limiting case of the ideal observermodel when memory capacity is reduced to zero. In this case, theoptimal memory estimate x̂ is simply the mean of the distributionover features, �w.
Individual subjects in the experiment may differ in terms of theiruse of this guessing strategy. It is also possible that subjects mayprobability match (Myers, 1976): If the probability that the probeitem was perturbed positively is 0.7, a probability matching subjectwill respond with a positive perturbation only 70% of the time. Toaccount for these possibilities, the probability of reporting a pos-itive perturbation on trials when the probe item was not encoded ismodeled as
P(�|ys) �P(� 0�ys)
�
P(� 0�ys)� � [1 � P(� 0�ys)]
� (9)
The parameter � controls the extent to which subjects makeeducated guesses: When � � 0, guesses are made completelyrandomly; when � � 1, probability matches results, and as � ¡ ,the subject approaches optimal guessing performance.
Non-Information-Theoretic Models
We also evaluated non-information-theoretic versions of thecontinuous resource and slots�averaging models. For the non-information-theoretic continuous resource model, memory repre-sentations are corrupted by Gaussian noise, where the standarddeviation of the noise varies as a general power function of the setsize. The exponent of the power function represents an additionalfree parameter in this model, compared to its information-theoreticequivalent. To maintain consistency with the information-theoreticversion, we also included a sensory noise parameter that is con-stant across set sizes (the model described by Bays and Husain,2008, did not explicitly model sensory noise).
For the non-information-theoretic slots�averaging model, eachslot encodes an item with added Gaussian noise where the noisevariance is constant regardless of the number of slots or itemsencoded in memory. If an object is encoded in multiple slots,memory error is minimized by averaging the stored representationin each slot. We also included a sensory noise parameter in thismodel to maintain consistency with its information-theoretic coun-terpart. For both non-information-theoretic models, there is nopredicted performance difference between the low- and high-variance conditions when tested on items that were encoded inmemory. The non-information-theoretic slots�averaging modeldoes allow for a performance difference between the low- andhigh-variance condition due to the predicted poorer performancewhen tested on nonencoded items.
Summary of Models
For all models, we also included a lapse component and overallbias term. On some percentage of trials, given by the lapse parameter,the response is modeled as being generated randomly regardless ofwhether it was encoded in memory. This percentage was included toallow for the possibility that subjects occasionally press the unin-tended response key or exhibit lapses in attention or motivation.Failing to account for the possibility of such lapses can lead to largebiases in the parameters estimated from a model, especially on trialswith small set size or large perturbations (for a more extensivediscussion of this issue, see Morey, 2011; Rouder et al., 2008). Thebias term is included to allow the possibility that subjects incorrectlyestimate the mean of the distribution over feature values in theexperiments or exhibit an overall bias toward reporting positive ornegative perturbations. In evaluating several of the models, we foundthat the model fit was slightly improved by allowing the lapse rate todiffer across variance conditions of the experiment. We consequentlyreport results for all models, allowing separate lapse rates in the low-and high-variance conditions.
To summarize, we have proposed six different models of theallocation of capacity when multiple items must be stored in visualworking memory. Four of the models (continuous resource,slots�averaging, binomial encoding, and flexible encoding) re-flect a range of possible memory systems, but all share the under-lying information-theoretic framework that relates capacity, de-fined in bits, to the precision of memory representations. The lattertwo models, the binomial encoding and flexible encoding models,are two possible instantiations of the idea that accounting forencoding variability is a critical factor in explaining VWM per-formance. We also evaluated two standard (non-information-theoretic) models as a further test of the contribution of the ideal
821IDEAL OBSERVER ANALYSIS OF VWM

observer analysis. In this section, the goal is to evaluate eachmodel in terms of its ability to account for the observed humanperformance.
We estimated the parameters for each model using Bayesianinference (see Kruschke, 2011, for an introduction to Bayesiandata analysis techniques). Complete details regarding the imple-mentation of the models and parameter estimation procedure areprovided in the supplemental materials.
Model Results
To determine which model was best able to account for the em-pirical data, we evaluated each model with the deviance informationcriterion (DIC) score (Gilks, Richardson, & Spiegelhalter, 1996). DICis a technique for selecting between models that balances goodness offit (the mean log-likelihood score for the model) with a penalty termrelated to the model’s complexity. This penalty term prevents theselection of models with many degrees of freedom that overfit theavailable data. Figure 9 shows the calculated DIC score, relative tothe best fitting model in each experiment. Smaller DIC scores indicatemodels that are better able to fit the data after adjusting for modelcomplexity. In both experiments, the best fitting model is the flexibleencoding model, though the binomial encoding model performsnearly as well in comparison to the remaining models.6 It is notablethat the two best fitting models both assume that subjects sometimesencode more items with lower precision and sometimes encode feweritems with greater precision. By contrast, both the item-limit andcontinuous resource models assume that a constant number of itemswill be encoded in VWM on each trial (either the entire array, in thecontinuous resource model, or up to the slot limit in item-limitmodels).
The worst fitting model in both experiments is the non-information-theoretic continuous resource model. This model fitsthe data poorly because, unlike all the other models, it predicts nodifference in performance between the high- and low-varianceconditions. The non-information-theoretic slots�averaging modelis able to predict lower performance in the high-variance conditionbut only on trials where the probe item was not encoded inmemory. Therefore, it cannot account for the empirically observedperformance decrement at low set sizes (see Table 1) unless it isassumed that the slot capacity is limited to a single item. Further,in both experiments, the information-theoretic models substan-tially outperform their non-information-theoretic counterparts, de-spite having the same number or fewer parameters.
Figure 6 shows the resulting fit of the flexible encoding modelto the empirical data. The model fits were obtained by averagingover the model predictions for each individual subject. As can beseen by inspection of the figure, the empirical and model data arein close quantitative agreement (in nearly all cases, the modelpredictions fall within the confidence intervals for the observedhuman data). As a more rigorous test of the flexible encodingmodel’s ability to account for the human data, we also generatedsimulated data sets for both experiments using the model. Thesedata sets were obtained by running the model through the exactsequence of trials and stimuli given to the human subjects. Simu-lated responses were obtained using the mean parameter estimatesfor each of our subjects. To reduce the variability in the model’spredictions, 10 repetitions were generated for each trial completedby a human subject. As shown in Figure 8, the flexible encoding
model is able to account for the observed biases in memory. Wethen analyzed the model-generated data using the same psycho-metric function analysis that was applied to the empirical data.Figure 7 compares the estimated parameters of the psychometricfunctions for the human data and model-generated data. The mod-els are able to qualitatively capture both the psychometric slopeand the lapse rate of human performance.
In both experiments, the flexible encoding model was able to fit thedata better than the binomial encoding model when evaluated accord-ing to DIC score. We therefore examined the extent to which thepredicted encoding distribution differed between the two models.Recall that the binomial encoding model assumes a particular para-metric form for the encoding distribution and thus has just oneparameter (the encoding probability per item) to be estimated for eachcondition. Figure 10 plots the estimated probability of encoding eachstimulus item according to the binomial encoding model. Under theassumption that memory encoding follows a binomial distributionwith encoding probability p and set size of n possible items, thetrial-to-trial variance in the number of items encoded is given by n p(1 � p). For both experiments, the encoding probability is a decreas-ing function of the set size, but there is little or no difference in theencoding behavior in the two variance conditions.
Compared to the binomial encoding model, the flexible encod-ing model is completely unconstrained in terms of its allocation,such that the probabilities of encoding 0 . . . n items in eachcondition are treated as free parameters. Because of this lack ofconstraint, the flexible encoding model could reproduce theencoding behavior predicted by the slots�averaging model, thecontinuous resource model, or any possible distribution over itemsencoded. To compare the behavior of the binomial and flexibleencoding models, we computed the (binomial) encoding distribu-tions predicted by the binomial encoding model and comparedthese to the encoding distributions estimated according to theflexible encoding model. The distributions are overlaid in Figure11. As can be seen by inspection of the figure, the two modelspredict a highly similar pattern of behavior, although the flexibleencoding model introduces numerous additional free parameters.Further, the inferred encoding distributions from both models arequalitatively different than would be predicted by existing itemlimit theories. This is not due to any constraints or assumptions ofthe models, as the flexible encoding model would be capable ofreproducing the appearance of an item limit, if in fact the data weregenerated by such a process. In summary, although the flexibleencoding model is favored over the binomial encoding modelaccording to a Bayesian model comparison, a binomial encodingmodel where the encoding probability represents a decreasingfunction of set size appears to offer a concise account of theencoding process in visual working memory. However, we believethe more important result is that both models offer a significantimprovement in the ability to account for human performance overexisting models of visual working memory. Both models allow forsubstantial encoding variability but also assume that memoryprecision is directly tied in trial-by-trial fashion to the number ofstored representations.
6 As an approximate reference, differences in DIC score greater than 10are considered strong evidence in favor of the model with a lower DICscore (Spiegelhalter, Best, Carlin, & Van Der Linde, 2002).
822 SIMS, JACOBS, AND KNILL

For the information-theoretic slots�averaging model, we deter-mined the slot limit that had the highest probability for eachsubject. The most common estimated item limit in both experi-ments was found to be 3 items. The posterior mean item limit (ameasure that takes into account the uncertainty in each subject’sestimate) yields a similar result: an average of 3.87 items for theorientation experiment and 4.22 items for the line length experi-ment. These results closely correspond to previous estimates of3–4 items (D. E. Anderson et al., 2011; Cowan, 2001; Cowan &Rouder, 2009; Zhang & Luck, 2008). Although the estimated itemlimits for the present experiments are close to previous estimates,it remains the case that a discrete item-limit model offers a rela-tively poor account of the data compared to two alternative modelsthat do not assume the existence of an item limit in VWM.
The Appendix lists the posterior mean parameter estimates and95% credible intervals for all parameters that are common acrossthe information-theoretic models. Within each experiment, theparameter estimates are similar for each of the models considered,suggesting that the estimates are fairly robust to potential mis-
specification of the encoding mechanism in VWM. Capacity isreported as total capacity measured in bits, computed for item-limitmodels as (Capacity per Slot � Number of Slots).
The probability matching exponent (defined in Equation 9) iscredibly different than zero in both experiments, indicating that ontrials where a probed item was not encoded in memory, subjectswere able to guess the correct response at above-chance levels.This result is not surprising, given that it has previously beendemonstrated in a similar paradigm (Thiele et al., 2011). In the linelength experiment, subject performance rather closely approxi-mated probability matching, and in the orientation experimentperformance was slightly better (� � 3.3 for the best fittingmodel). This suggests that in the orientation experiment, subjectswere able to make better use of knowledge of the distribution overfeatures. Given that the mean orientation of arrows had a naturalreference point (the mean orientation was vertical) but the meanline length was more arbitrary, it is perhaps not surprising that wefind this difference between the two experiments. Future experi-ments might explore this result further by employing a less intu-
Orientation experiment Line length experiment
Model
Rel
ativ
e D
IC s
core
a b c d e f
4718
801729
270
28.47 0
Model
Rel
ativ
e D
IC s
core
a b c d e f
2742
461
704
288
49.83 0
a,b: Continuous resourcec,d: Slots+averaginge. Binomial encodingf. Flexible encoding
Non-information-theoreticInformation-theoretic
Figure 9. Comparison of alternative memory encoding mechanisms, evaluated according to deviance infor-mation criterion (DIC) score. The left figure shows the results for the orientation experiment. The right figureshows the line length experiment. Lower DIC scores indicate models that better fit the data. The numbers aboveeach bar indicate the DIC score relative to the best fitting model in each experiment.
0.0
0.2
0.4
0.6
0.8
1.0
Set size
Item
enc
odin
g pr
obab
ility
1 2 4 8
Low variance
High variance
0.0
0.2
0.4
0.6
0.8
1.0
Set size
1 2 4 8
Orientation experiment Line length experiment(a) (b)
Figure 10. Probability of encoding each stimulus item, according to the binomial encoding model. (a)Estimates for the orientation experiment. (b) Estimates for the line length experiment. Error bars indicate 95%confidence intervals.
823IDEAL OBSERVER ANALYSIS OF VWM
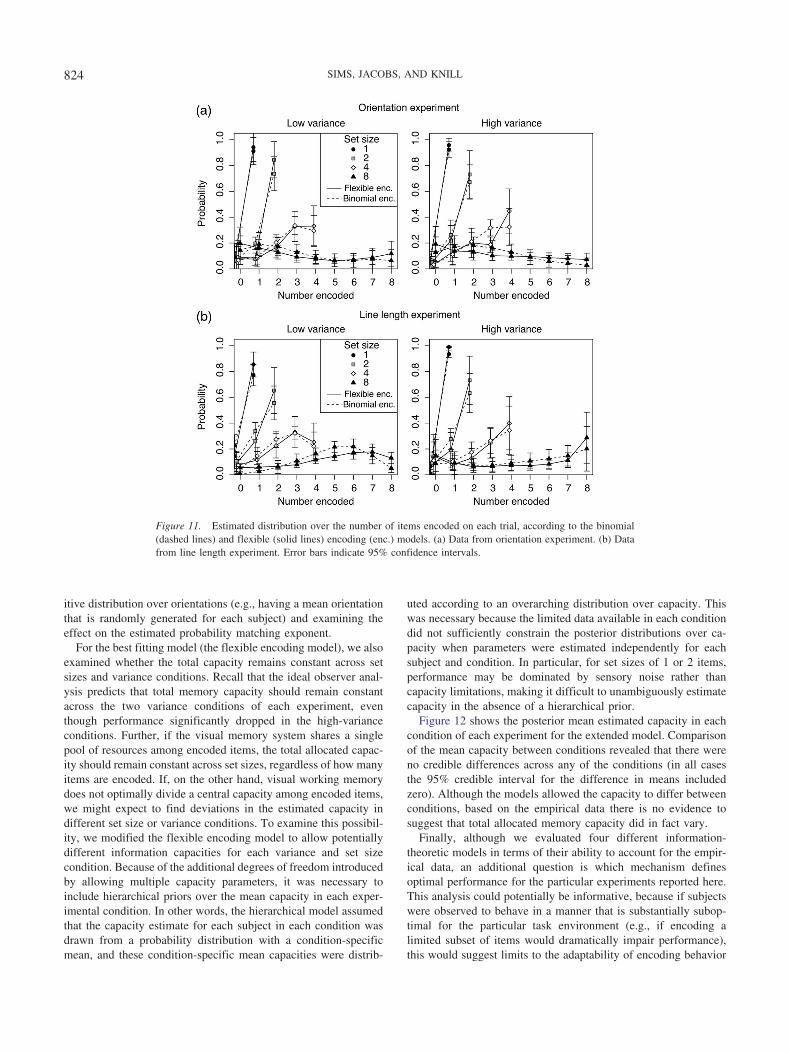
itive distribution over orientations (e.g., having a mean orientationthat is randomly generated for each subject) and examining theeffect on the estimated probability matching exponent.
For the best fitting model (the flexible encoding model), we alsoexamined whether the total capacity remains constant across setsizes and variance conditions. Recall that the ideal observer anal-ysis predicts that total memory capacity should remain constantacross the two variance conditions of each experiment, eventhough performance significantly dropped in the high-varianceconditions. Further, if the visual memory system shares a singlepool of resources among encoded items, the total allocated capac-ity should remain constant across set sizes, regardless of how manyitems are encoded. If, on the other hand, visual working memorydoes not optimally divide a central capacity among encoded items,we might expect to find deviations in the estimated capacity indifferent set size or variance conditions. To examine this possibil-ity, we modified the flexible encoding model to allow potentiallydifferent information capacities for each variance and set sizecondition. Because of the additional degrees of freedom introducedby allowing multiple capacity parameters, it was necessary toinclude hierarchical priors over the mean capacity in each exper-imental condition. In other words, the hierarchical model assumedthat the capacity estimate for each subject in each condition wasdrawn from a probability distribution with a condition-specificmean, and these condition-specific mean capacities were distrib-
uted according to an overarching distribution over capacity. Thiswas necessary because the limited data available in each conditiondid not sufficiently constrain the posterior distributions over ca-pacity when parameters were estimated independently for eachsubject and condition. In particular, for set sizes of 1 or 2 items,performance may be dominated by sensory noise rather thancapacity limitations, making it difficult to unambiguously estimatecapacity in the absence of a hierarchical prior.
Figure 12 shows the posterior mean estimated capacity in eachcondition of each experiment for the extended model. Comparisonof the mean capacity between conditions revealed that there wereno credible differences across any of the conditions (in all casesthe 95% credible interval for the difference in means includedzero). Although the models allowed the capacity to differ betweenconditions, based on the empirical data there is no evidence tosuggest that total allocated memory capacity did in fact vary.
Finally, although we evaluated four different information-theoretic models in terms of their ability to account for the empir-ical data, an additional question is which mechanism definesoptimal performance for the particular experiments reported here.This analysis could potentially be informative, because if subjectswere observed to behave in a manner that is substantially subop-timal for the particular task environment (e.g., if encoding alimited subset of items would dramatically impair performance),this would suggest limits to the adaptability of encoding behavior
Figure 11. Estimated distribution over the number of items encoded on each trial, according to the binomial(dashed lines) and flexible (solid lines) encoding (enc.) models. (a) Data from orientation experiment. (b) Datafrom line length experiment. Error bars indicate 95% confidence intervals.
824 SIMS, JACOBS, AND KNILL
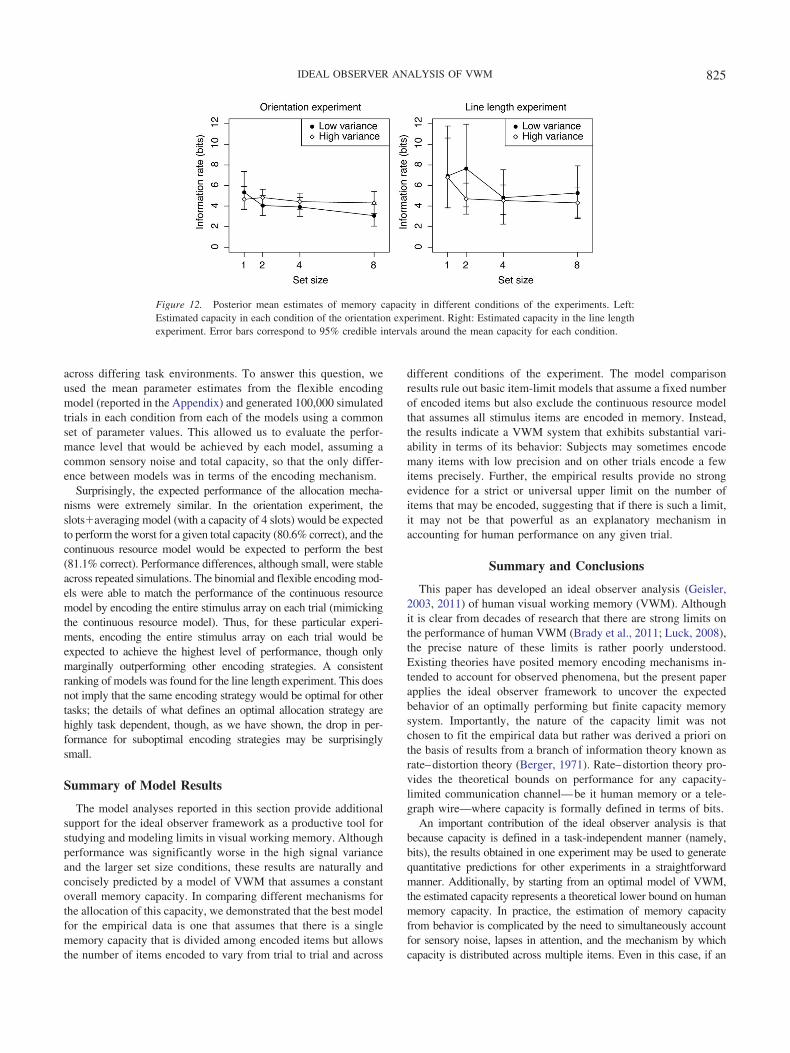
across differing task environments. To answer this question, weused the mean parameter estimates from the flexible encodingmodel (reported in the Appendix) and generated 100,000 simulatedtrials in each condition from each of the models using a commonset of parameter values. This allowed us to evaluate the perfor-mance level that would be achieved by each model, assuming acommon sensory noise and total capacity, so that the only differ-ence between models was in terms of the encoding mechanism.
Surprisingly, the expected performance of the allocation mecha-nisms were extremely similar. In the orientation experiment, theslots�averaging model (with a capacity of 4 slots) would be expectedto perform the worst for a given total capacity (80.6% correct), and thecontinuous resource model would be expected to perform the best(81.1% correct). Performance differences, although small, were stableacross repeated simulations. The binomial and flexible encoding mod-els were able to match the performance of the continuous resourcemodel by encoding the entire stimulus array on each trial (mimickingthe continuous resource model). Thus, for these particular experi-ments, encoding the entire stimulus array on each trial would beexpected to achieve the highest level of performance, though onlymarginally outperforming other encoding strategies. A consistentranking of models was found for the line length experiment. This doesnot imply that the same encoding strategy would be optimal for othertasks; the details of what defines an optimal allocation strategy arehighly task dependent, though, as we have shown, the drop in per-formance for suboptimal encoding strategies may be surprisinglysmall.
Summary of Model Results
The model analyses reported in this section provide additionalsupport for the ideal observer framework as a productive tool forstudying and modeling limits in visual working memory. Althoughperformance was significantly worse in the high signal varianceand the larger set size conditions, these results are naturally andconcisely predicted by a model of VWM that assumes a constantoverall memory capacity. In comparing different mechanisms forthe allocation of this capacity, we demonstrated that the best modelfor the empirical data is one that assumes that there is a singlememory capacity that is divided among encoded items but allowsthe number of items encoded to vary from trial to trial and across
different conditions of the experiment. The model comparisonresults rule out basic item-limit models that assume a fixed numberof encoded items but also exclude the continuous resource modelthat assumes all stimulus items are encoded in memory. Instead,the results indicate a VWM system that exhibits substantial vari-ability in terms of its behavior: Subjects may sometimes encodemany items with low precision and on other trials encode a fewitems precisely. Further, the empirical results provide no strongevidence for a strict or universal upper limit on the number ofitems that may be encoded, suggesting that if there is such a limit,it may not be that powerful as an explanatory mechanism inaccounting for human performance on any given trial.
Summary and Conclusions
This paper has developed an ideal observer analysis (Geisler,2003, 2011) of human visual working memory (VWM). Althoughit is clear from decades of research that there are strong limits onthe performance of human VWM (Brady et al., 2011; Luck, 2008),the precise nature of these limits is rather poorly understood.Existing theories have posited memory encoding mechanisms in-tended to account for observed phenomena, but the present paperapplies the ideal observer framework to uncover the expectedbehavior of an optimally performing but finite capacity memorysystem. Importantly, the nature of the capacity limit was notchosen to fit the empirical data but rather was derived a priori onthe basis of results from a branch of information theory known asrate–distortion theory (Berger, 1971). Rate–distortion theory pro-vides the theoretical bounds on performance for any capacity-limited communication channel—be it human memory or a tele-graph wire—where capacity is formally defined in terms of bits.
An important contribution of the ideal observer analysis is thatbecause capacity is defined in a task-independent manner (namely,bits), the results obtained in one experiment may be used to generatequantitative predictions for other experiments in a straightforwardmanner. Additionally, by starting from an optimal model of VWM,the estimated capacity represents a theoretical lower bound on humanmemory capacity. In practice, the estimation of memory capacityfrom behavior is complicated by the need to simultaneously accountfor sensory noise, lapses in attention, and the mechanism by whichcapacity is distributed across multiple items. Even in this case, if an
Figure 12. Posterior mean estimates of memory capacity in different conditions of the experiments. Left:Estimated capacity in each condition of the orientation experiment. Right: Estimated capacity in the line lengthexperiment. Error bars correspond to 95% credible intervals around the mean capacity for each condition.
825IDEAL OBSERVER ANALYSIS OF VWM

optimal model of performance can be defined for a given task, itremains possible to estimate a valid lower bound on capacity. That isto say, subjects may have a higher memory capacity but are limited byother factors, such as sensory noise, or they may use their capacity insuboptimal fashion (e.g., applying a suboptimal decoder to imperfectmemory representations). In this case, the ideal observer model fit toempirical data leads to a measure of the effective capacity of VWM,rather than its theoretical maximum capacity.
The ideal observer analysis does not yield a specific singlemodel of visual working memory. Instead, it defines a theoreticalframework for testing alternative models of visual memory. Thecentral component of this framework is the realization that quan-titative limits on human memory performance can be directlypredicted from a known memory capacity, and, conversely, aminimum memory capacity can be directly inferred from observedhuman performance. By applying this framework to empirical datacollected across two experiments, we could evaluate several alter-nate theories of the memory encoding process, including twoexisting models that have made competing claims regarding themechanisms of visual working memory.
Information-theoretic analysis of perceptual systems is not a newapproach (Attneave, 1954; Miller, 1956). One closely related area ofinvestigation is absolute identification (Garner, 1953; Luce, Green, &Weber, 1976), where subjects are presented with a unidimensionalstimulus drawn from a discrete set and must respond by identifyingwhich item out of the set was presented. By varying the set size, it ispossible to manipulate the informational demand of the task, and bymeasuring identification errors, one can estimate the channel capacityof the subject. Whereas absolute identification tasks examine theability to unambiguously assign stimuli to discrete categories, rate–distortion theory as applied to visual memory instead focuses on theability to minimize the introduction of error in storing and retrievingcontinuous feature values.
The present work is the first to apply rate–distortion theory asthe optimal solution to the problem of encoding and retrievingvisual information in a capacity-limited memory system. Perhapssurprisingly, a model with only weak constraints on performance(assuming only the existence of sensory noise and a finite limit onmemory capacity) was able to offer a parsimonious and quantita-tive account of empirical results obtained in two experiments,including the empirical validation of the predicted effects of ma-nipulating the variance of features in the task.
On the basis of the results obtained in two experiments and sub-sequent model comparisons, we conclude that when encoding multi-ple items in memory, people rely on a single, fixed memory capacitythat is distributed among encoded items. The empirical results andmodel comparisons also suggest deficiencies of two previous butcompeting models of VWM. The continuous resource model (Bays &Husain, 2008) predicts that there is no upper limit on the number ofitems encoded in VWM, and in its existing instantiations, it hasassumed that people encode all stimulus items in a scene. By contrast,the slots�averaging model (D. E. Anderson et al., 2011; Cowan &Rouder, 2009) predicts that there is a fixed upper limit on the numberof items that can be encoded. In the majority of instantiations of thismodel, the hypothesized mean capacity limit is 4 items (Cowan,2001), although evidence suggests there may be significant variationamong individuals (Rouder et al., 2008; Todd & Marois, 2005; Vogel& Machizawa, 2004). Discussions of this model have raised thepossibility of trial-to-trial variability in the number of stored repre-
sentations (Luck, 2008; Vogel et al., 2001), but to date, the magnitudeof encoding variability has not been directly estimated in fittingitem-limit models to human performance.
Based on the combined data from the two experiments, there is nostrong evidence to support a universal item limit in VWM: Theempirical results were better explained by a model that allowed forencoding variability but assumed the absence of an item limit. At thesame time, it was not found to be the case that subjects universallyencode all stimulus items in a display, as predicted by existingversions of the continuous resource model. Instead, it appears thathumans may exhibit substantial variability in how they allocate theirmemory capacity, sometimes remembering many items with lowprecision and sometimes remembering a few items precisely.
Recently, a closely related model has been proposed (Van den Berget al., 2012) in which trial-to-trial variability in encoding precision,rather than variability in the number of encoded items, was argued tobe the critical factor in accounting for human memory performance.According to this variable precision model, all stimulus items areencoded, but each receives an amount of resource (equivalent in theirmodel to precision) randomly drawn from a probability distribution,such that some stimulus items may be encoded with low precision.The variable precision model was shown to outperform traditionalitem-limit theories in two different experimental tasks (delayed esti-mation and change localization) and two different visual features(orientation and color). Like the best fitting model for our data, thevariable precision model assumes that variability in VWM, rather thanthe existence of a discrete item limit, accounts for the empirical factsof human performance. Thus, the two models are closely related andgain mutual support from their success in different experimentalparadigms. Further, the models are functionally similar in treatingmemory representations as noise-corrupted versions of physical fea-tures. The variable precision model (Van den Berg et al., 2012) treatsthe magnitude of encoding noise in memory as a free parameterestimated separately for each condition, and the information-theoreticframework offers a rational basis for predicting how memory preci-sion should vary with experimental parameters (including set size andthe prior distribution of features in the environment).
Relation to Other Empirical Results
How do the present conclusions differ from those of other recentstudies of visual working memory capacity? Previous attempts atdemonstrating the existence of item limits in visual working memoryhave focused on properties of simple psychometric functions fit toempirical data. One such property is whether the estimated slope ofthe psychometric function reaches a plateau with increasing set size.Item-limit models predict the existence of such a plateau, as increas-ing the set size beyond the item limit should have no effect on theprecision of memory representations. By contrast, the continuousresource model predicts that memory precision should monotonicallydecrease with increasing set size. In the empirical data reported here,there was limited evidence regarding the existence of a plateau in theslope of the psychometric function. The collective results from otherrecent studies also paint a mixed picture, with some studies showingno evidence for a plateau (Bays & Husain, 2008, supplemental ma-terial) and others showing its existence (D. E. Anderson et al., 2011;Zhang & Luck, 2008).
Several factors may limit the usefulness of this type of analysis.First, finding a plateau in group-averaged data does not imply the
826 SIMS, JACOBS, AND KNILL
existence of any such effect at the level of individual subjects(Rouder et al., 2008). Second, Bays and colleagues (Bays et al.,2009, 2011) have argued that a plateau in memory precision maybe accounted for by subjects misreporting the features for thewrong stimulus item, although this possibility has been challenged(D. E. Anderson et al., 2011). Third, and more important, it haspreviously been assumed that finding this effect constitutes defin-itive evidence for an upper limit on the number of items that maybe stored in visual working memory. The present results haveproved this assumption to be unfounded, as the best fitting modelswere able to reproduce the main features of human psychometricperformance without assuming the existence of an item limit (seealso Van den Berg et al., 2012).
In comparing these empirical results to other studies, it is alsoimportant to account for the possibility that methodological differ-ences may play a significant role. In the present experiments, subjectswere given a forced choice on each trial, whereas other experimentshave used a “cued recall” paradigm, in which subjects choose from acontinuum to indicate their response. The testing procedure used toassess visual memory has previously been shown to influence themeasured sensitivity of memory (Makovski, Watson, Koutstaal, &Jiang, 2010). Other methodological differences may be important aswell: In the present experiments, stimuli were presented at fixedretinal eccentricities and at predictable locations, and eye tracking wasused to ensure that subjects did not make eye movements during trials.These factors may have increased the probability of encoding moreitems in visual working memory.
The ideal observer analysis also generated a novel predictionthat was subsequently verified in two experiments. In particular,information theory predicts that the precision with which informa-tion can be stored in memory will vary as a function of thedistribution of the information source in the external environment.In particular, signals with low variance are fundamentally easier toencode than signals with high variance. In keeping with thisprediction, it was demonstrated that the accuracy of memorydecreased as the variance of the information source increased. Asimple information-theoretic model was able to parsimoniouslyaccount for this finding without any additional assumptions ormechanisms. To account for these results, non-information-theoretic models would have to postulate an additional mechanism.
Although the present analysis is the first to quantitatively predictthe effects of feature variance on performance, our empiricalresults are not unique. A recent study (Brady, Konkle, & Alvarez,2009) has demonstrated that people have the ability to “compress”visual information in memory and, hence, store more informationwhen redundancies are introduced in the stimuli. Brady and Alva-rez (2011) have demonstrated that ensemble statistics, such as themean size of task-relevant features in a display, influence thestorage of items in visual working memory. Other experimentshave demonstrated that there is a similarity advantage in visualworking memory (Lin & Luck, 2009; Mate & Baqués, 2009;Sanocki & Sulman, 2011), such that performance and capacityestimates tend to be higher when stimuli are homogeneous or lowvariance. Interestingly, Lin and Luck (2009) found that the advan-tage for low-variance stimuli held regardless of whether featurevariance remained constant for a block of trials or changed fromtrial to trial in unpredictable fashion. This suggests that subjectsmay be able to adapt memory representations based on the statis-tics of features on a single trial.
An interesting result from the experiments was that the estimatedmean capacity was similar for line length and orientation. It is tempt-ing to speculate that such a result implies that memory storage forlength and that for orientation draw on the same central capacity store.This would predict that in a task where subjects must encode orien-tation and length simultaneously, performance should be worse thanin the case of storing a single feature. This hypothesis has beenchallenged by several experimental studies that have shown no evi-dence for degradation in performance when multiple features arestored (Luck & Vogel, 1997; Vogel et al., 2001; Zhang & Luck,2008). However, completely independent storage of distinct featuresmay not be supported when the precision of memory representationsis taken into account (Fougnie, Asplund, & Marois, 2010).
Adaptation and Optimality in Visual WorkingMemory
One assumption of the ideal observer analysis is that humans haveaccess to accurate estimates of the uncertainty of their sensory sys-tems and the variance of features in the task environment. In applyingthe ideal observer models to the human data, we discarded the initialtrials from each experimental session. In theory, subjects may haveobserved enough evidence at this point to form relatively accurateestimates of the mean and variance of visual features. However, thepossibility remains that subjects inaccurately estimated these statis-tics. In order for VWM to be an optimal system, the coding schemeused to encode signals must be optimal with respect to the statistics ofthe source. This is not a feature unique to our analysis of VWM butrather a general result from information theory (Shannon & Weaver,1949): Efficient codes for information are fundamentally dependentupon the context in which that information occurs. If experimentalsubjects adopt inaccurate estimates of the signal variance, the truecapacity of VWM would be higher than the estimates obtained basedon the observed data, with the implication that subjects used thislarger capacity in a suboptimal manner.
In the neuroscience literature, there is significant interest in iden-tifying the adaptability of neural codes to the statistics of an informa-tion source (David, Vinje, & Gallant, 2004; Dean, Harper, & McAlp-ine, 2005; Fairhall, Lewen, Bialek, & de Ruyter van Steveninck,2001). Dean et al. (2005) examined the case of adaptation of neuralcodes in the mammalian auditory system to changes in auditorystimulus intensity—a particularly interesting case, as perceptible dif-ferences in sound intensity can vary over 12 orders of magnitude.They found that individual neurons could adapt their mean firing rateto improve coding accuracy in response to changes in a varietystimulus statistics, including changes to the variance of the stimuli.Such adaptation was observed to occur at the level of individualneurons extremely rapidly, on the order of seconds. This suggests atleast the possibility that human subjects would be able to optimallyadapt their encoded memory representations to the statistics of theinformation source. This possibility is bolstered by recent computa-tional simulations (Geisler, Najemnik, & Ing, 2009) that have char-acterized the optimal neural encoding scheme for natural visual fea-tures. The optimal stimulus encoders derived using this approach wasfound to be similar, at first approximation, to receptive fields found inprimary visual cortex. Investigating whether optimal neural encodingextends to visual working memory represents an important topic forfuture research.
827IDEAL OBSERVER ANALYSIS OF VWM
In tasks that place a minimum-precision requirement on memory,an endogenously controlled limit on the number of encoded itemsmay reflect an optimal strategy for completing the task. The idealobserver framework does not preclude the possibility that the alloca-tion of capacity among items is adaptive, for example, by adjustingthe encoding process to optimize performance in each individual task.Zhang and Luck (2011) have recently tested this possibility in severalexperiments that manipulated the precision demands on visual work-ing memory. They found that, regardless of task demands, there wasno empirical evidence for shifts in the number or precision of encodedmemory representations. In contrast, subjects did exhibit shiftingperformance with different task demands when evaluated on iconicmemory (a more immediate form of visual memory) as opposed tovisual working memory performance. Based on these results, inconjunction with our own, it appears that though memory represen-tations may be sensitive to the statistical regularities of an environ-ment, the encoding process itself (the selection of items to be stored)may not be under complete endogenous control or may possess onlylimited adaptability to changing task demands.
Potential Applications of the Framework
Although we have explored several different models of how mem-ory capacity is divided among multiple items in a scene, there remainnumerous other possibilities that warrant further investigation. Oneassumption common among the best fitting models is that capacity isevenly divided between encoded items. Alternatively, there may bevariance not just in the number of encoded items but also in terms ofhow that capacity is divided, such that some items receive a greatershare than others (Van den Berg et al., 2012). One possibility is thatwhen different objects in a scene have different complexities, thatmore complex objects will receive a greater proportion of the avail-able capacity. In at least one experimental test of this hypothesis(Barton, Ester, & Awh, 2009), it was found that the precision ofmemory representations appears to be independent of the complexityof other objects in a scene, suggesting that capacity may be allocatedevenly among items, regardless of their complexity. We do not claimthat the best fitting models reported here capture all details of visualworking memory in complete fidelity. Rather, the ideal observerapproach has allowed the specification of models that improve overexisting accounts, while rendering salient the relationships amongexisting models and allowing for their principled evaluation. It is ourhope that the theoretical approach developed in this paper will also beuseful in guiding the development of new experimental paradigmsand tests of models that are better suited for discriminating amongcompeting explanations.
Finally, another important aspect of human visual memory thatwas not addressed is the role of time (or more directly, forgetting)in governing performance. The present experiments used a fixedretention interval and therefore cannot address the issue of decayor interference in visual working memory. Other experiments havemore directly examined the role of time in visual memory. Eng,Chen, and Jiang (2005) found significant decrements in perfor-mance with retention intervals lasting 2 s. Zhang and Luck (2009)examined not only the effect of retention intervals lasting up to 10s but also how performance degraded over time. Using a cued-recall paradigm, they argued that memory representations do notgradually decay but rather are terminated abruptly. Such an abruptoffset could be incorporated in the present modeling framework by
assuming that encoded representations are disrupted at a rate givenby a specified hazard function. An interesting question that maypotentially be addressed using the ideal observer framework iswhether the memory representations for stimulus items of differentcomplexity may be disrupted at different rates or to greater extents.
In summary, the combined empirical and modeling results pre-sented here suggest that the most productive approach to understand-ing the nature of capacity limits in visual working memory may lie intreating memory as a communication channel that has been opti-mized, through evolution and development, toward the efficient cod-ing and storage of visual information. This approach of treatingbehavior as rationally or optimally adapted to a task environment hasbeen widely influential in investigating other aspects of vision (Gei-sler, 2011; Knill & Richards, 1996) and higher level cognition (J. R.Anderson, 1990). The results obtained in the present experiments arelargely consistent with such an optimal memory system. Future re-search may uncover properties of visual working memory that fail toconform to the basic predictions of the ideal observer framework.However, by starting with an ideal model of performance as a basicassumption, this paper provides an important reference to whichfuture experimental results and models can be compared.
References
Alvarez, G. A., & Cavanagh, P. (2004). The capacity of visual short-termmemory is set both by visual information load and by number of objects.Psychological Science, 15, 106 –111. doi:10.1111/j.0963-7214.2004.01502006.x
Anderson, D. E., Vogel, E. K., & Awh, E. (2011). Precision in visualworking memory reaches a stable plateau when individual item limitsare exceeded. Journal of Neuroscience, 31, 1128–1138. doi:10.1523/JNEUROSCI.4125-10.2011
Anderson, J. R. (1990). The adaptive character of thought. Hillsdale, NJ:Erlbaum.
Attneave, F. (1954). Some informational aspects of visual perception.Psychological Review, 61, 183–193. doi:10.1037/h0054663
Awh, E., Barton, B., & Vogel, E. K. (2007). Visual working memoryrepresents a fixed number of items regardless of complexity. Psycho-logical Science, 18, 622–628. doi:10.1111/j.1467-9280.2007.01949.x
Barton, B., Ester, E. F., & Awh, E. (2009). Discrete resource allocation invisual working memory. Journal of Experimental Psychology: HumanPerception and Performance, 35, 1359–1367. doi:10.1037/a0015792
Bays, P. M., Catalao, R. F. G., & Husain, M. (2009). The precision ofvisual working memory is set by allocation of a shared resource. Journalof Vision, 9(10), Article 7. doi:10.1167/9.10.7
Bays, P. M., & Husain, M. (2008, August 8). Dynamic shifts of limitedworking memory resources in human vision. Science, 321, 851–854.doi:10.1126/science.1158023
Bays, P. M., Wu, E. Y., & Husain, M. (2011). Storage and binding ofobject features in visual working memory. Neuropsychologia, 49, 1622–1631. doi:10.1016/j.neuropsychologia.2010.12.023
Berger, T. (1971). Rate distortion theory: A mathematical basis for datacompression. Englewood Cliffs, NJ: Prentice-Hall.
Brady, T. F., & Alvarez, G. A. (2011). Hierarchical encoding in visualworking memory: Ensemble statistics bias memory for individual items.Psychological Science, 22, 384–392. doi:10.1177/0956797610397956
Brady, T. F., Konkle, T., & Alvarez, G. A. (2009). Compression in visualworking memory: Using statistical regularities to form more efficientmemory representations. Journal of Experimental Psychology: General,138, 487–502. doi:10.1037/a0016797
Brady, T. F., Konkle, T., & Alvarez, G. A. (2011). A review of visualmemory capacity: Beyond individual items and toward structured rep-resentations. Journal of Vision, 11(15), Article 4. doi:10.1167/11.5.4
828 SIMS, JACOBS, AND KNILL

Brouwer, A.-M., & Knill, D. C. (2007). The role of memory in visuallyguided reaching. Journal of Vision, 7(5), Article 6. doi:10.1167/7.5.6
Brouwer, A.-M., & Knill, D. C. (2009). Humans use visual and remem-bered information about object location to plan pointing movements.Journal of Vision, 9(1), Article 24. doi:10.1167/9.1.24
Cowan, N. (2001). The magical number 4 in short-term memory: Areconsideration of mental storage capacity. Behavioral and Brain Sci-ences, 24, 87–114. doi:10.1017/S0140525X01003922
Cowan, N., & Rouder, J. N. (2009, February 19). Comment on “Dynamicshifts of limited working memory resources in human vision.” Science,323, 877c. doi:10.1126/science.1166478
Curby, K. M., Glazek, K., & Gauthier, I. (2009). A visual short-termmemory advantage for objects of expertise. Journal of ExperimentalPsychology: Human Perception and Performance, 35, 94–107. doi:10.1037/0096-1523.35.1.94
David, S. V., Vinje, W. E., & Gallant, J. L. (2004). Natural stimulusstatistics alter the receptive field structure of v1 neurons. Journal ofNeuroscience, 24, 6991–7006. doi:10.1523/JNEUROSCI.1422-04.2004
Dean, I., Harper, N. S., & McAlpine, D. (2005). Neural population codingof sound level adapts to stimulus statistics. Nature Neuroscience, 8,1684–1689. doi:10.1038/nn1541
Desimone, R., & Duncan, J. (1995). Neural mechanisms of selective visualattention. Annual Reviews of Neuroscience, 18, 193–222. doi:10.1146/annurev.ne.18.030195.001205
Eng, H. Y., Chen, D., & Jiang, Y. (2005). Visual working memory forsimple and complex visual stimuli. Psychonomic Bulletin & Review, 12,1127–1133. doi:10.3758/BF03206454
Fairhall, A. L., Lewen, G. D., Bialek, W., & de Ruyter van Steveninck,R. R. (2001, August 23). Efficiency and ambiguity in an adaptive neuralcode. Nature, 412, 787–792. doi:10.1038/35090500
Fougnie, D., Asplund, C. L., & Marois, R. (2010). What are the units ofstorage in visual working memory? Journal of Vision, 10(12), Article 27.doi:10.1167/10.12.27
Garner, W. R. (1953). An informational analysis of absolute judgments ofloudness. Journal of Experimental Psychology, 46, 373–380. doi:10.1037/h0063212
Geisler, W. S. (1989). Sequential ideal-observer analysis of visual discrim-inations. Psychological Review, 96, 267–314. doi:10.1037/0033-295X.96.2.267
Geisler, W. S. (2003). Ideal observer analysis. In L. Chalupa & J. Werner(Eds.), The visual neurosciences (pp. 825–837). Boston, MA: MITPress.
Geisler, W. S. (2011). Contributions of ideal observer theory to visionresearch. Vision Research, 51, 771–781. doi:10.1016/j.visres.2010.09.027
Geisler, W. S., Najemnik, J., & Ing, A. D. (2009). Optimal stimulusencoders for natural tasks. Journal of Vision, 9(13), Article 17. doi:10.1167/9.13.17
Gilks, W. R., Richardson, S., & Spiegelhalter, D. J. (1996). Markov chainMonte Carlo in practice. London, England: Chapman & Hall.
Hollingworth, A., Richard, A. M., & Luck, S. J. (2008). Understanding thefunction of visual short-term memory: Transsaccadic memory, objectcorrespondence, and gaze correction. Journal of Experimental Psychol-ogy: General, 137, 163–181. doi:10.1037/0096-3445.137.1.163
Irwin, D. E. (1991). Information integration across saccadic eye move-ments. Cognitive Psychology, 23, 420 – 456. doi:10.1016/0010-0285(91)90015-G
Knill, D. C., & Richards, W. (1996). Perception as Bayesian inference.New York, NY: Cambridge University Press.
Körding, K. P., & Wolpert, D. M. (2004). The loss function of sensori-motor learning. Proceedings of the National Academy of Sciences, USA,101, 9839–9842. doi:10.1073/pnas.0308394101
Kruschke, J. K. (2011). Doing Bayesian data analysis: A tutorial with Rand BUGS. New York, NY: Academic Press.
Lee, D., & Chun, M. M. (2001). What are the units of visual short-termmemory, objects or spatial locations? Perception & Psychophysics, 63,253–257. doi:10.3758/BF03194466
Lin, P.-H., & Luck, S. J. (2009). The influence of similarity on visualworking memory representations. Visual Cognition, 17, 356–372. doi:10.1080/13506280701766313
Luce, D. R., Green, D. M., & Weber, D. L. (1976). Attention bands inabsolute identification. Perception & Psychophysics, 20, 49–54. doi:10.3758/BF03198705
Luck, S. J. (2008). Visual short-term memory. In S. J. Luck & A. Hol-lingworth (Eds.), Visual memory (pp. 43–85). New York, NY: OxfordUniversity Press.
Luck, S. J., & Vogel, E. K. (1997, November 20). The capacity of visualworking memory for features and conjunctions. Nature, 390, 279–281.doi:10.1038/36846
Luria, R., Sessa, P., Gotler, A., Jolicoeur, P., & Dell’Acqua, R. (2010).Visual short-term memory capacity for simple and complex objects.Journal of Cognitive Neuroscience, 22, 496–512. doi:10.1162/jocn.2009.21214
Makovski, T., Watson, L. M., Koutstaal, W., & Jiang, Y. V. (2010).Method matters: Systematic effects of testing procedure on visual work-ing memory sensitivity. Journal of Experimental Psychology: Learning,Memory, and Cognition, 36, 1466–1479. doi:10.1037/a0020851
Mate, J., & Baqués, J. (2009). Visual similarity at encoding and retrieval inan item recognition task. Quarterly Journal of Experimental Psychology,62, 1277–1284. doi:10.1080/17470210802680769
Miller, G. A. (1956). The magical number seven, plus or minus two: Somelimits on our capacity for processing information. Psychological Review,63, 81–97. doi:10.1037/h0043158
Morey, R. D. (2011). A Bayesian hierarchical model for the measurementof working memory capacity. Journal of Mathematical Psychology, 55,8–24. doi:10.1016/j.jmp.2010.08.008
Myers, J. L. (1976). Probability learning and sequence learning. In W. K.Estes (Ed.), Handbook of learning and cognitive processes: Approachesto human learning and motivation (pp. 171–205). Hillsdale, NJ: Erl-baum.
Najemnik, J., & Geisler, W. S. (2005, March 17). Optimal eye movementstrategies in visual search. Nature, 434, 387–391. doi:10.1038/nature03390
Navarro, D. J., Griffiths, T. L., Steyvers, M., & Lee, M. D. (2006).Modeling individual differences using Dirichlet processes. Journal ofMathematical Psychology, 50, 101–122. doi:10.1016/j.jmp.2005.11.006
Oh, S.-H., & Kim, M.-S. (2004). The role of spatial working memory invisual search efficiency. Psychonomic Bulletin & Review, 11, 275–281.doi:10.3758/BF03196570
Olsson, H., & Poom, L. (2005). Visual memory needs categories. Proceed-ings of the National Academy of Sciences, USA, 102, 8776–8780.doi:10.1073/pnas.0500810102
Palmer, J. (1990). Attentional limits on the perception and memory ofvisual information. Journal of Experimental Psychology: Human Per-ception and Performance, 16, 332–350. doi:10.1037/0096-1523.16.2.332
Pashler, H. (1988). Familiarity and visual change detection. Perception &Psychophysics, 44, 369–378. doi:10.3758/BF03210419
Pelli, D. G. (1990). The quantum efficiency of vision. In C. Blakemore(Ed.), Vision: Coding and efficiency (pp. 3–24). Cambridge, MA: Cam-bridge University Press.
Platt, J. R. (1964, October 16). Strong inference. Science, 146, 347–353.doi:10.1126/science.146.3642.347
Rouder, J. N., & Lu, J. (2005). An introduction to Bayesian hierarchicalmodels with an application in the theory of signal detection. Psycho-nomic Bulletin & Review, 12, 573–604. doi:10.3758/BF03196750
Rouder, J. N., Morey, R. D., Cowan, N., Zwilling, C. E., Morey, C. C., &Pratte, M. S. (2008). An assessment of fixed-capacity models of visual
829IDEAL OBSERVER ANALYSIS OF VWM

working memory. Proceedings of the National Academy of Sciences,USA, 105, 5975–5979. doi:10.1073/pnas.0711295105
Rouder, J. N., Sun, D., Speckman, P. L., Lu, J., & Zhou, D. (2003). Ahierarchical Bayesian statistical framework for response time distribu-tions. Psychometrika, 68, 589–606. doi:10.1007/BF02295614
Sanocki, T., & Sulman, N. (2011). Color relations increase the capacity ofvisual short-term memory. Perception, 40, 635–648. doi:10.1068/p6655
Scolari, M., Vogel, E. K., & Awh, E. (2008). Perceptual expertise enhancesthe resolution but not the number of representations in working memory.Psychonomic Bulletin & Review, 15, 215–222. doi:10.3758/PBR.15.1.215
Shannon, C. E., & Weaver, W. (1949). The mathematical theory of com-munication. Champaign: University of Illinois Press.
Sims, C. R., Jacobs, R. A., & Knill, D. C. (2011). Adaptive allocation ofvision under competing task demands. Journal of Neuroscience, 31,928–943. doi:10.1523/JNEUROSCI.4240-10.2011
Sperling, G. (1960). The information available in brief visual presentations.Psychological Monographs: General and Applied, 74(11), 1–29. doi:10.1037/h0093759
Spiegelhalter, D. J., Best, N. G., Carlin, B. P., & Van Der Linde, A. (2002).Bayesian measures of model complexity and fit. Journal of the RoyalStatistical Society: Series B (Statistical Methodology), 64, 583–639.doi:10.1111/1467-9868.00353
Thiele, J. E., Pratte, M. S., & Rouder, J. R. (2011). On perfect working-memory performance with large numbers of items. Psychonomic Bulle-tin & Review, 18, 958–963. doi:10.3758/s13423-011-0108-7
Todd, J. J., & Marois, R. (2005). Posterior parietal cortex activity predictsindividual differences in visual short-term memory capacity. Cognitive,
Affective, & Behavioral Neuroscience, 5, 144–155. doi:10.3758/CABN.5.2.144
Tudusciuc, O., & Nieder, A. (2010). Comparison of length judgments andthe Müller–Lyer illusion in monkeys and humans. Experimental BrainResearch, 207, 221–231. doi:10.1007/s00221-010-2452-7
Van den Berg, R., Shin, H., Chou, W.-C., George, R., & Ma, W. J. (2012).Variability in encoding precision accounts for visual short-term memorylimitations. Proceedings of the National Academy of Science. Advanceonline publication. doi:10.1073/pnas.1117465109
Vogel, E. K., & Machizawa, M. G. (2004, April 15). Neural activitypredicts individual differences in visual working memory capacity.Nature, 428, 748–751. doi:10.1038/nature02447
Vogel, E. K., Woodman, G. F., & Luck, S. J. (2001). Storage of features,conjunctions, and objects in visual working memory. Journal of Exper-imental Psychology: Human Perception and Performance, 27, 92–114.doi:10.1037/0096-1523.27.1.92
Wilken, P., & Ma, W. J. (2004). A detection theory account of changedetection. Journal of Vision, 4(12), Article 11. doi:10.1167/4.12.11
Zhang, W., & Luck, S. J. (2008, May 8). Discrete fixed-resolution repre-sentations in visual working memory. Nature, 453, 233–235. doi:10.1038/nature06860
Zhang, W., & Luck, S. J. (2009). Sudden death and gradual decay in visualworking memory. Psychological Science, 20, 423–428. doi:10.1111/j.1467-9280.2009.02322.x
Zhang, W., & Luck, S. J. (2011). The number and quality of representa-tions in working memory. Psychological Science, 22, 1434–1441. doi:10.1177/0956797611417006
Appendix
Posterior Mean Estimates of Parameters Common Across Information-Theoretic Models
Model
Experiment and param-eter Slots�averaging Continuous resource Binomial allocation Flexible allocation
Orientation experimentLapse (low variance) 0.04 [0.033, 0.046] 0.054 [0.047, 0.061] 0.03 [0.024, 0.034] 0.035 [0.028, 0.041]Lapse (high
variance)0.074 [0.063, 0.084] 0.11 [0.10, 0.12] 0.06 [0.047, 0.071] 0.071 [0.059, 0.084]
Bias �0.59 [�0.81, �0.36] �0.59 [�0.79, �0.38] �0.72 [�0.95, �0.49] �0.71 [�0.94, �0.48]Sensory noise 4.62 [4.3, 4.93] 4.90 [4.57, 5.22] 4.3 [3.94, 4.63] 4.46 [4.11, 4.80]Total capacity (bits) 4.16 [3.63, 4.91] 3.91 [3.75, 4.08] 4.62 [4.05, 5.39] 4.47 [3.97, 5.10]Probability matching
exponent2.0 [1.44, 2.83] 3.3 [2.8, 3.86] 3.60 [2.94, 4.36]
Item limit 3.87 [3.57, 4.21]Line length experiment
Lapse (low variance) 0.10 [0.87, 0.11] 0.11 [0.096, 0.12] 0.065 [0.052, 0.078] 0.075 [0.061, 0.089]Lapse (high
variance)0.13 [0.11, 0.14] 0.18 [0.16, 0.19] 0.11 [0.098, 0.13] 0.12 [0.11, 0.14]
Bias 0.033 [0.03, 0.37] 0.027 [0.025, 0.03] 0.034 [0.003, 0.038] 0.045 [0.041, 0.049]Sensory noise 0.088 [0.083, 0.093] 0.094 [0.089, 0.99] 0.074 [0.068, 0.081] 0.080 [0.074, 0.086]Total capacity (bits) 4.94 [3.81, 6.29] 4.06 [3.66, 4.52] 4.21 [3.43, 5.23] 4.57 [3.60, 5.71]Probability matching
exponent1.20 [0.66, 1.93] 0.93 [0.78, 1.1] 1.03 [0.84, 1.25]
Item limit 4.22 [3.78, 4.64]
Note. 95% highest density credible intervals for the sample mean are given in brackets following each parameter.
Received June 2, 2011Revision received June 5, 2012
Accepted July 17, 2012 �
830 SIMS, JACOBS, AND KNILL