An Giang - viendinhduong.vnviendinhduong.vn/viewpdf.aspx?n=/TT Dinh duong 2014-Chuan/Eng/S Cuu...2....
4
MAIN RESULTS a. b. c. d. Note: Indicator Value Indicator Value No. of districts and towns 10 No. of hospitals 15 No. of wards, town districts, and commun 156 No. of polyclinics 11 No. of villages 852 No. of commune health center 156 Population No. of maternity homes - No. of children <5 years of age No. of doctors 930 No. of children <2 years of age No. of assistant doctors 1,246 (estimated to be 41.1% of the under 5) 41% No. of nurses 1,474 Percent ethnic minorities 5.3% No. of midwives/birth attendan 632 Poverty rate 8.5% No. of village health workers 852 1 General Statistics Office (GSO) Viet Nam. Available from: www.gso.gov.vn. Accessed February 10, 2012 Last update 11/1/2016 Among children under 5 years of age, the prevalence of stunting was 24%, underweight was 13.1% and wasting was 6.2%; while the prevalence of overweight and obesity was 5.3%. 74,425 181,083 This report is a part of the Vietnam Nutrition Surveillance System. Data collection is performed usually in the months from June to September annually, using cluster sampling and conducted by the Provincial Preventive Medical Center(s) under technical guidance from the National Institute of Nutrition. Basic characteristics 1 An Giang Nutrition profile 2014 2,150,594 The prevalence of women aged from 15 to 49 years with chronic energy deficiency was 9.3%. The rate of using iron pills in the 3 months before or during pregnant among mother with under 2 years child was 90.4% and the rate of using Vitamin A after delivery was 53.6%. Because IYCF indicators have just been integrated into the nutrition surveillance system since 2010, additional time would be needed to improve the data collection. The proportion of mothers exposed to breastfeeding or complementary feeding information in the last 3 months was 51.4%; main sources of information were mass media channels, especially TV. The proportion of mothers who met a health worker in the last 3 months was 90.9% The rate of early initiation of breastfeeding was 49.4%, continued breastfeeding at 2 years rate was 13.6% while the proportion of children under 6 months old using bottle and nipple remained quite high. The proportion of children aged from 6 to 23 months receiving a minimum acceptable diet was 34.6%. The proportion of children aged from 6 to 35 months receiving vitamin A supplementation was 89%.
Transcript of An Giang - viendinhduong.vnviendinhduong.vn/viewpdf.aspx?n=/TT Dinh duong 2014-Chuan/Eng/S Cuu...2....
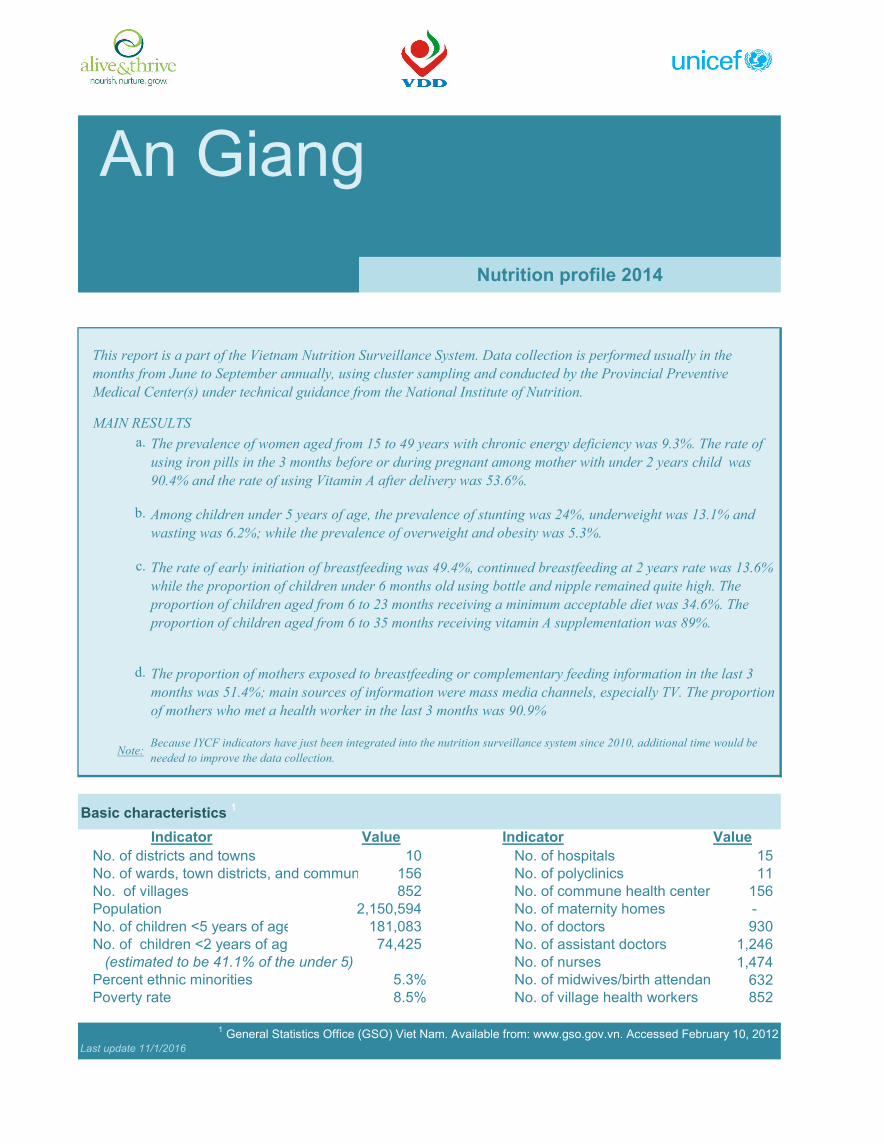
MAIN RESULTS
a.
b.
c.
d.
Note:
Indicator Value Indicator Value
No. of districts and towns 10 No. of hospitals 15
No. of wards, town districts, and communes 156 No. of polyclinics 11
No. of villages 852 No. of commune health centers 156
Population No. of maternity homes -
No. of children <5 years of age No. of doctors 930
No. of children <2 years of age No. of assistant doctors 1,246
(estimated to be 41.1% of the under 5) 41% No. of nurses 1,474
Percent ethnic minorities 5.3% No. of midwives/birth attendants 632
Poverty rate 8.5% No. of village health workers 852
1 General Statistics Office (GSO) Viet Nam. Available from: www.gso.gov.vn. Accessed February 10, 2012
Last update 11/1/2016
Among children under 5 years of age, the prevalence of stunting was 24%, underweight was 13.1% and
wasting was 6.2%; while the prevalence of overweight and obesity was 5.3%.
74,425
181,083
This report is a part of the Vietnam Nutrition Surveillance System. Data collection is performed usually in the
months from June to September annually, using cluster sampling and conducted by the Provincial Preventive
Medical Center(s) under technical guidance from the National Institute of Nutrition.
Basic characteristics 1
An Giang
Nutrition profile 2014
2,150,594
The prevalence of women aged from 15 to 49 years with chronic energy deficiency was 9.3%. The rate of
using iron pills in the 3 months before or during pregnant among mother with under 2 years child was
90.4% and the rate of using Vitamin A after delivery was 53.6%.
Because IYCF indicators have just been integrated into the nutrition surveillance system since 2010, additional time would be
needed to improve the data collection.
The proportion of mothers exposed to breastfeeding or complementary feeding information in the last 3
months was 51.4%; main sources of information were mass media channels, especially TV. The proportion
of mothers who met a health worker in the last 3 months was 90.9%
The rate of early initiation of breastfeeding was 49.4%, continued breastfeeding at 2 years rate was 13.6%
while the proportion of children under 6 months old using bottle and nipple remained quite high. The
proportion of children aged from 6 to 23 months receiving a minimum acceptable diet was 34.6%. The
proportion of children aged from 6 to 35 months receiving vitamin A supplementation was 89%.

2. An Giang
Source of information: National Nutrition Surveillance 2014 - National Institute of Nutrition
3. Wasting prevalence (WHZ<-2Z) among children under
5 years by age group (%)
6. Stunting prevalence (HAZ<-2Z) among children under
5 years by age group (%)
5. Underweight prevalence (WAZ<-2Z) among children
under 5 years by age group (%)
1. Chronic energy deficiency prevalence of mothers by
age group (%)
4. Malnutrition prevalence among children under 5 years
(%)
NUTRITION INFORMATION (2011 & 2014)
2. Vitamin A supplements: Knowledge and use among
mothers (%)
87.8
37.8
81.0
53.6
0
20
40
60
80
100
Knew/ heard about vitamin Acapsule
Took vitamin A after delivery
2011 (n=1423) 2014 (n=1337)
20.0
13.6
9.0
15.212.8
4.9
10.2 9.3
0
10
20
30
40
50
15-24 years 25-34 years 35-49 years 15-49 years
2011 (n=1340) 2014 (n=2205)
15.9
27.7
6.8
2.9
13.1
24.0
6.2 5.3
0
10
20
30
40
50
Underweight Stunting Wasting Overweight/obese
2011 (n=1526) 2014 (n=1538)
0
10
20
30
40
50
0-5 6-11 12-17 18-23 24-29 30-35 36-41 42-47 48-53 54-59
Age in months
2011 (n=1526) 2014 (n=1531)
0
10
20
30
40
50
0-5 6-11 12-17 18-23 24-29 30-35 36-41 42-47 48-53 54-59
Age in months
2011 (n=1524) 2014 (n=1530)
0
5
10
15
20
25
0-5 6-11 12-17 18-23 24-29 30-35 36-41 42-47 48-53 54-59
Age in months
2011 (n=1522) 2014 (n=1527)

3. An Giang
Source of information: National Nutrition Surveillance 2014 - National Institute of Nutrition
NUTRITION DURING THE LIFE CYCLE
13.6
42.5
90.876.2
0
20
40
60
80
100
Continued breastfeedingat 2 years (n=125)
Child deworming (last 6months) (n=852)
Vitamin Asupplementation (last 6
months) (n=402)
No bottle feeding(n=804)
(n=)
93.7 95.4
49.4 54.8
0
20
40
60
80
100
Child born in ahealth facility
(n=331)
Ever breastfed(n=667)
Early initiation ofbreastfeeding
(n=644)
No squeezing outcolostrum(n=651)
0%
20%
40%
60%
80%
100%
0-1 2-3 4-5 6-7 8-9 10-11
Age group in months
Infant and young child feeding practices by age
Not receiving any breastmilk
Breast milk &complementary foods
Breast milk & othermilk/formula
Breast milk & non-milkliquids
Breast milk & plainwater only
Exclusively breastfed
0.0
72.3
36.6
0
20
40
60
80
100
Predominantbreastfeeding
under 6 months(n=101)
No bottle feeding(n=184)
No prelactealfeeding in the first
days (n=328)
64.152.6
70.5
34.6
85.3
56.7
0
20
40
60
80
100
Continuedbreastfeeding at 1
year (n=92)
Minimum mealfrequency(n=468)
Minimum dietarydiversity (n=468)
Minimumacceptable diet
(n=468)
Consumption ofiron-rich or iron-fortified foods
(n=468)
No bottle feeding(n=483)
(n=)
24
-59
mo
nth
s6
-23
mo
nth
s0
-5 m
on
ths
Pre
con
cep
tio
n&
pre
gnan
cy
7.4
36.4
83.8
0
20
40
60
80
100
Non-pregnant/lactating
Pregnant
Iron folic acid supplementation duringlast 6 months (n=1136)
Iodized salt use(n=1469)
17.0
68.0
20.11.8
020406080
100
Non-pregnant(n=612)
First trimester(n=613)
Second semetre(n=613)
Multi-nutrientsupplementationduring pregnancy
(n=613)Iron tablet supplementattion

1. Exposure to nutrition information (%) 4. Sources of direct contact (%)
3. Topics of nutritional counseling (%)
Source of information: National Nutrition Surveillance 2014 - National Institute of Nutrition
4. An Giang
ACCESS TO NUTRITION INFORMATION AND SERVICES
5. Type of IYCF information (%)2. Sources of information from mass-media (%)
75.9
36.0
5.8
0
20
40
60
80
100
Communal healthcenter staff (n=464)
Village health worker/Nutrition volunter
(n=464)
Women union(n=464)
41.7 40.2 42.8
62.6 63.657.9
64.1
0
20
40
60
80
100
Baby s
hou
ld b
e b
reastf
ed
imm
edia
tely
aft
er
bir
th
Fe
ed o
nly
bre
ast m
ilk u
pto
6 m
onth
s
Not
to g
ive c
hild
any
wate
r, liq
uid
, h
one
y o
rfo
mula
r up
to 6
mo
nth
s
Con
tinue
bre
astfed
up to
24 m
onth
s
Receiv
ing
iro
nta
ble
t/M
MN
Fe
edin
g e
ggs, m
eat,
fis
hand
oth
er
an
imal sourc
efo
od a
fter
6 m
onth
s
Washin
g h
and
s w
ith s
oap
befo
re p
repa
ring f
oo
d/
fee
din
g c
hild
2014 (n=629)
48.8
35.5
46.3
33.5
0
20
40
60
80
100
Aboutbreastfeeding
Aboutcomplementary
food
Aboutbreastfeeding
Aboutcomplementary
food
Health staff Mass media
2014 (n=629)
51.4
90.9
0
20
40
60
80
100
See/ hear IYCF messages onmass-media last 3 months
(n=629)
Contact with health staff duringlast 3 months (n=464)
34.5
17.8
3.5 3.8 2.1
0
20
40
60
80
100
TV Radio/loudspeaker
Newspapers/magazines
Poster,flipcharts
Internet
2014 (n=629)