An Exploratory Study of Co-located Collaborative … Exploratory Study of Co-located Collaborative...
8
An Exploratory Study of Co-located Collaborative Visual Analytics around a Tabletop Display Petra Isenberg *, † Danyel Fisher † Meredith Ringel Morris † Kori Inkpen † Mary Czerwinski † * INRIA † Microsoft Research (a) Analysts begin by searching for data. (b) A document is pulled out of a search result list. (c) A document is zoomed to be read and analyzed. (d) The workspace can be flexibly ar- ranged and shared. Figure 1: Several different aspects of the Cambiera system in use during a document analysis task. ABSTRACT Co-located collaboration can be extremely valuable during complex visual analytics tasks. This paper presents an exploratory study of a system designed to support collaborative visual analysis tasks on a digital tabletop display. Fifteen participant pairs employed Cam- biera, a visual analytics system, to solve a problem involving 240 digital documents. Our analysis, supported by observations, sys- tem logs, questionnaires, and interview data, explores how pairs approached the problem around the table. We contribute a unique, rich understanding of how users worked together around the table and identify eight types of collaboration styles that can be used to identify how closely people work together while problem solving. We show how the closeness of teams’ collaboration influenced how well they performed on the task overall. We further discuss the role of the tabletop for visual analytics tasks and derive novel design implications for future co-located collaborative tabletop problem solving systems. Index Terms: K.5.3 [Information Interfaces and Presentation]: Group and Organization Interfaces 1 I NTRODUCTION Visual analytics tasks can have amorphous structure, ambiguous goals, and large amounts of data [14]. Many visual analytics prob- lems, therefore, can be best solved by groups of analysts working together, face-to-face. For example, Chin et al. [5] found that in- telligence analysts highly value the ability to collaborate face-to- face: “It’s when all of our analysts get together and work out the differences and challenge each other with facts that we get to a bet- ter and more prominent answer.” Despite these benefits, we have surprisingly few technologies to support co-located visual analyt- ics: instead, teams typically share one screen or work on separate * e-mail:[email protected] † e-mail:{danyelf|merrie|kori|marycz}@microsoft.com computers, side by side. New technologies, such as interactive sur- faces, offer increased screen real estate and multi-touch capabili- ties to build novel face-to-face collaborative workspaces. Yet, there have been few studies reporting on design and use of collaborative visual analytics workspaces for interactive surfaces. We try to fill this gap by providing a rich description of pairs working collab- oratively, face-to-face, on a visual analytics task, using a tabletop system designed specifically for these tasks. We studied teams of two people solving the VAST 2006 Challenge, an intelligence anal- ysis task that involves the exploration of a large text document col- lection. This task resembles many other scenarios in which pairs collaboratively attempt to solve complex problems over a large text corpus: for instance, lawyers making sense of a set of case files, military intelligence analysts trying to comb through millions of documents, co-authors researching old newspapers for help with a new story, or historians browsing through historic texts to bring past events into context. In these and many other tasks, analysts have considerable experience working face-to-face on traditional physical tables [5]. Our goal is to more fully understand the conse- quences of providing a digital tabletop analytics environment that incorporates the benefits of a shared space for synchronous collab- orative work as well as computational support for searching and data sharing. Studying and formalizing the nature of collaborative analysis activities within such an environment is valuable to inform our understanding of digital tabletop visual analytics systems and provides valuable design advice for future systems, as we shall dis- cuss. We begin by reviewing the Cambiera system [10], and then present a study and discuss our observations. Our goal is to address the digital table as a context for co-located visual analytics: to de- scribe how pairs approached the problem on the table effectively; to discuss what features helped pairs with the analysis task, and to describe what additional features would be even more beneficial in supporting complex problem solving on the tabletop. 2 RELATED WORK Our study is a rich examination of how teams communicate and coordinate face-to-face around a visual analytics tabletop system. While researchers have explored various tools for visual analytics support, our focus on co-located tabletop collaboration is unique
Transcript of An Exploratory Study of Co-located Collaborative … Exploratory Study of Co-located Collaborative...

An Exploratory Study ofCo-located Collaborative Visual Analytics around a Tabletop Display
Petra Isenberg∗,† Danyel Fisher† Meredith Ringel Morris† Kori Inkpen† Mary Czerwinski†∗INRIA †Microsoft Research
(a) Analysts begin by searching fordata.
(b) A document is pulled out of asearch result list.
(c) A document is zoomed to be readand analyzed.
(d) The workspace can be flexibly ar-ranged and shared.
Figure 1: Several different aspects of the Cambiera system in use during a document analysis task.
ABSTRACT
Co-located collaboration can be extremely valuable during complexvisual analytics tasks. This paper presents an exploratory study ofa system designed to support collaborative visual analysis tasks ona digital tabletop display. Fifteen participant pairs employed Cam-biera, a visual analytics system, to solve a problem involving 240digital documents. Our analysis, supported by observations, sys-tem logs, questionnaires, and interview data, explores how pairsapproached the problem around the table. We contribute a unique,rich understanding of how users worked together around the tableand identify eight types of collaboration styles that can be used toidentify how closely people work together while problem solving.We show how the closeness of teams’ collaboration influenced howwell they performed on the task overall. We further discuss the roleof the tabletop for visual analytics tasks and derive novel designimplications for future co-located collaborative tabletop problemsolving systems.
Index Terms: K.5.3 [Information Interfaces and Presentation]:Group and Organization Interfaces
1 INTRODUCTION
Visual analytics tasks can have amorphous structure, ambiguousgoals, and large amounts of data [14]. Many visual analytics prob-lems, therefore, can be best solved by groups of analysts workingtogether, face-to-face. For example, Chin et al. [5] found that in-telligence analysts highly value the ability to collaborate face-to-face: “It’s when all of our analysts get together and work out thedifferences and challenge each other with facts that we get to a bet-ter and more prominent answer.” Despite these benefits, we havesurprisingly few technologies to support co-located visual analyt-ics: instead, teams typically share one screen or work on separate
∗e-mail:[email protected]†e-mail:{danyelf|merrie|kori|marycz}@microsoft.com
computers, side by side. New technologies, such as interactive sur-faces, offer increased screen real estate and multi-touch capabili-ties to build novel face-to-face collaborative workspaces. Yet, therehave been few studies reporting on design and use of collaborativevisual analytics workspaces for interactive surfaces. We try to fillthis gap by providing a rich description of pairs working collab-oratively, face-to-face, on a visual analytics task, using a tabletopsystem designed specifically for these tasks. We studied teams oftwo people solving the VAST 2006 Challenge, an intelligence anal-ysis task that involves the exploration of a large text document col-lection. This task resembles many other scenarios in which pairscollaboratively attempt to solve complex problems over a large textcorpus: for instance, lawyers making sense of a set of case files,military intelligence analysts trying to comb through millions ofdocuments, co-authors researching old newspapers for help witha new story, or historians browsing through historic texts to bringpast events into context. In these and many other tasks, analystshave considerable experience working face-to-face on traditionalphysical tables [5]. Our goal is to more fully understand the conse-quences of providing a digital tabletop analytics environment thatincorporates the benefits of a shared space for synchronous collab-orative work as well as computational support for searching anddata sharing. Studying and formalizing the nature of collaborativeanalysis activities within such an environment is valuable to informour understanding of digital tabletop visual analytics systems andprovides valuable design advice for future systems, as we shall dis-cuss. We begin by reviewing the Cambiera system [10], and thenpresent a study and discuss our observations. Our goal is to addressthe digital table as a context for co-located visual analytics: to de-scribe how pairs approached the problem on the table effectively;to discuss what features helped pairs with the analysis task, and todescribe what additional features would be even more beneficial insupporting complex problem solving on the tabletop.
2 RELATED WORK
Our study is a rich examination of how teams communicate andcoordinate face-to-face around a visual analytics tabletop system.While researchers have explored various tools for visual analyticssupport, our focus on co-located tabletop collaboration is unique
and revealed novel patterns of interacting that have not before beenreported thoroughly. In this section, we discuss work that has in-spired our own through a focus on collaborative work with complexanalysis tasks and visualization support.
2.1 Distributed Collaborative Problem SolvingMost research projects exploring collaborative problem-solvinghave supported distributed, rather than face-to-face, collaboration.For example, Balakrishnan et al. [2] addressed the question of howteams can share visualizations remotely to solve a complex prob-lem. They found that a visualization was most effective when bothpartners had full access to the shared visualization and could bothsynchronously interact with it; in a follow-up study [3], they furtherfound that collaborators were more effective when they each hadcontrol over parts of the data. We include an implicitly shared con-text in our system, where we give each analyst independent accessto all data items and data interactions on the table. Brennan et al. [4]take a slightly different approach by requiring explicit sharing andmerging of data views during distributed analysis. This way, teammembers can work alone on a subtopic, and then switch to a sharedview that supports joint sensemaking. Like our system, Paul andMorris’ search-oriented CoSense [16] provides collaborators withawareness support: teammates can see each other’s web search his-tories, as well as the documents that they each have found, in orderto support collaborative information seeking. Keel’s system [13]for distributed analysts provided awareness by analyzing informa-tion from a team member’s workspace and suggesting relevant datato other remote analysts, allowing for implicit information sharing.
In contrast to these systems, ManyEyes [21] social visualizationsconnect people who may not have any previous relationship. Peo-ple can asynchronously share data, create visualizations, and col-laboratively explore, annotate, and comment on the visualizations.In contrast to these systems for distributed problem solving, ourwork addresses face-to-face collaboration around a shared displayand fundamentally differs in terms of the workspace setup and theability for team members to communicate quickly and effortlesslyabout the data on the surface. In addition, it allows team members todistinguish themselves in meaningful and useful ways. We includedsome of the features employed earlier for distributed systems—suchas support for parallel work and joint search histories—in our sys-tem and study, as they seem to be valuable.
2.2 Co-located Collaborative Problem SolvingTabletop technologies can allow teams to easily share tools and in-formation face-to-face, and researchers are still learning how best toleverage tables for complex tasks. Research on collaborative visualanalytics on tabletop displays is still in its infancy (e. g., [11]). Wetherefore discuss work from the Tabletop community that addressesmore complex analysis tasks.
WeSearch [15] is related to our work in that it supports search,browsing, and sensemaking activities. Team members can shareweb searches, snippets, and annotations during their investigations.The DTLens system [6] demonstrates how focus+context tech-niques can be used for exploring large maps and diagrams on an in-teractive tabletop. DTLens addresses an important issue for collab-orative problem solving: when multiple people simultaneously in-teract with information, parallel exploration may be hindered wheninterests between team members differ. DTLens resolves this witha notion of ownership, in which individuals can only edit their ownviews of the data. In contrast, CoTree, a collaborative tabletop sys-tem for the comparison and analysis of hierarchical data [9] allowscollaborators to use multiple independent views and visualizationsof the same dataset. These can be explored in parallel or broughttogether for comparison without any sense of ownership. WeSpace[22] addresses the issue of providing individual views, and parallelexploration by allowing researchers to bring their own visualiza-
Figure 2: Two search widgets. The top search widget (“bse” is mini-mized. The bottom widget is maximized; each vertical bar representsa document that contains the word “fda.” The documents are orderedby publication date. The fourth and fifth documents also have greenstripes and contain the word “bse.”
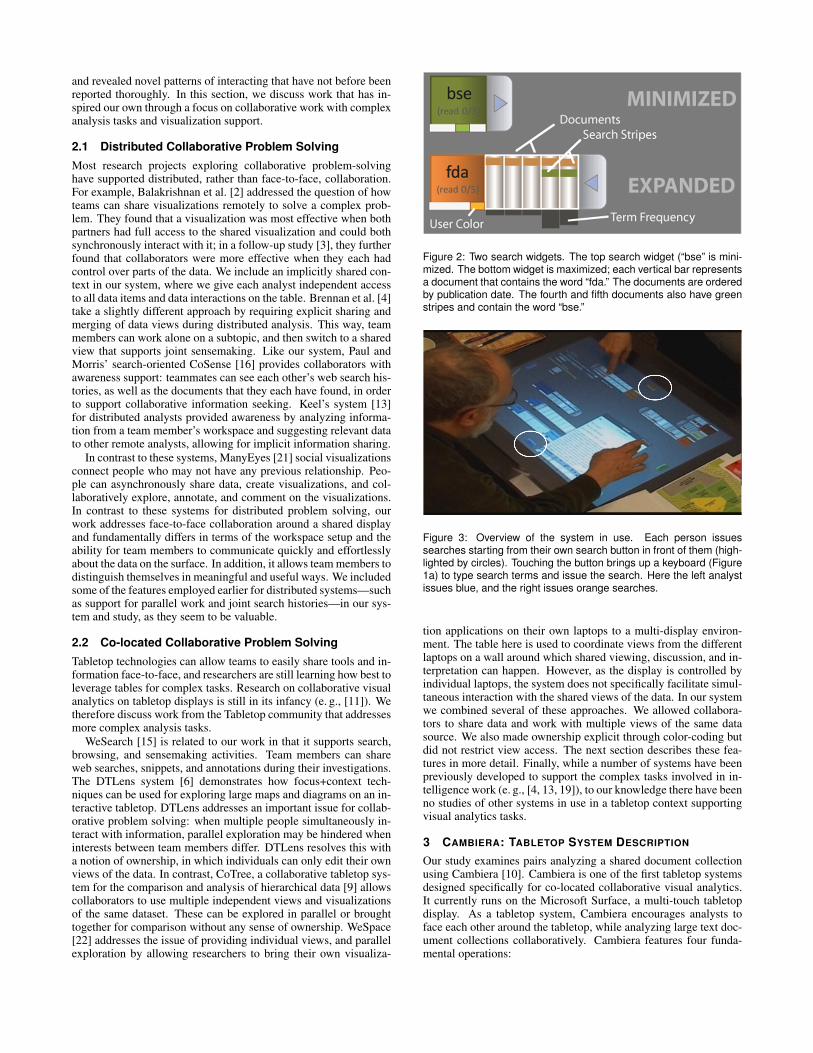
Figure 3: Overview of the system in use. Each person issuessearches starting from their own search button in front of them (high-lighted by circles). Touching the button brings up a keyboard (Figure1a) to type search terms and issue the search. Here the left analystissues blue, and the right issues orange searches.
tion applications on their own laptops to a multi-display environ-ment. The table here is used to coordinate views from the differentlaptops on a wall around which shared viewing, discussion, and in-terpretation can happen. However, as the display is controlled byindividual laptops, the system does not specifically facilitate simul-taneous interaction with the shared views of the data. In our systemwe combined several of these approaches. We allowed collabora-tors to share data and work with multiple views of the same datasource. We also made ownership explicit through color-coding butdid not restrict view access. The next section describes these fea-tures in more detail. Finally, while a number of systems have beenpreviously developed to support the complex tasks involved in in-telligence work (e. g., [4, 13, 19]), to our knowledge there have beenno studies of other systems in use in a tabletop context supportingvisual analytics tasks.
3 CAMBIERA: TABLETOP SYSTEM DESCRIPTION
Our study examines pairs analyzing a shared document collectionusing Cambiera [10]. Cambiera is one of the first tabletop systemsdesigned specifically for co-located collaborative visual analytics.It currently runs on the Microsoft Surface, a multi-touch tabletopdisplay. As a tabletop system, Cambiera encourages analysts toface each other around the tabletop, while analyzing large text doc-ument collections collaboratively. Cambiera features four funda-mental operations:

Search for documents: Each team member starts their analysiswith Cambiera by searching for relevant documents by calling oneof four on-screen keyboards from the search button in front of them(Figure 1a and Figure 3). Each keyboard specific to and orientedtowards just one analyst returns a color-coded search result wid-get which holds virtual representations of the documents returned(Figure 2). Frequency bars under each document represent the totalnumber of times the respective search term occurs in the document.The color hue of the widget is determined by the team member whoissued the search. While hues between search words are only sub-tly different (and each analyst may not remember them in detail),each person is vividly distinct; in addition, the analyst can touch adocument to see what words are associated with it.
Search result exploration: Each search widget can be expandedto see the returned list of documents ordered by their publicationdate (Figure 2). By running a finger across the document represen-tations, detail-on-demand information is shown for each document.This information includes who has previously issued the search,what other search terms (regardless of searcher) found the samedocument, and which sentences contained the search term.
Document analysis: documents can be pulled out of search re-sult lists (Figure 1b) and then freely placed in the workspace. Byperforming a zooming gesture the document’s text can be accessedwithin a document reader (Figure 1c).
Workspace organization: All objects in Cambiera can bemoved around the table, re-oriented, resized, or closed. Each an-alyst can place and stack documents and search results on the table-top as they find most useful (Figure 1d). An analyst can also spinthe documents around in order to push them to the other side, one ofthe several ways that Cambiera allows people to share documents.
One of the unique features of Cambiera is its support for co-located awareness. Each individual search widget is tagged witha unique, user-dependent color. Each document within the searchwidget in turn is annotated with colored stripes corresponding tothe search terms that have been found within them. Because eachsearch widget has its own color, the colored stripes on the searchresults indicate when they have been found by more than oneword. In Figure 2, for example, one team member has searched for“FDA” (Federal Department of Agriculture); another has searchedfor “BSE” (Bovine Spongiform Encephalitis). The colored stripesindicate that the last two documents found by the search for “fda”also contain the word “bse.” When documents are pulled out of asearch result list, they maintain the colored bars that indicate whichsearch generated them. In the document reader (Figure 1c), the texthighlights all search terms which have found this document, regard-less of which team member issued them. In addition, all states ofa document include a specific icon (in the search result list, mini-mized in the workspace, and maximized in the reader) which indi-cates whether the document has been read, by whom and the shad-ing of the document’s background color gives a relative indicationof read frequency. Since previous studies of collaborative data anal-ysis have shown that team members frequently switch to phases ofparallel work [12, 20], these awareness features were designed toencourage co-located team members to connect more closely withothers and to be able to more easily synthesize their individual anal-ysis results. We refer to the accompanying video for an overviewof the Cambiera system in use.
4 USER STUDY
To design visual analytics tabletop tools for co-located collabora-tive work we need to understand how these systems are used byteams. In particular, we need a better understanding of how teamscoordinate their activities over a tabletop and which specific systemfeatures are best suited to support effective co-located collaborativedata analysis in this context. Our study was designed to provide arich description of collaborative visual analysis on a tabletop dis-
play targeting this information need. In this exploration, we wereguided by questions of understanding collaborative analytics on thetabletop.
• How do teams work together and coordinate their work withthe tabletop?
• What patterns of collaboration do they carry out?• How can their work patterns be used to inform the design of
future interfaces for collaborative problem solving?
4.1 ParticipantsIt is extremely difficult to obtain professional intelligence analystsfor real-life intelligence analysis scenarios; therefore, we followedthe procedures used by the VAST 2006 Challenge [7], which pro-vides a baseline task that closely models an analysis scenario, butcan be carried out by non-analysts. We describe the task furtherbelow. We recruited 15 pairs of people who were familiar withdata analysis. Participants were required to have a Master’s (ormore advanced) degree, and to have self-reported as enjoying puz-zles or mysteries. The members of each pair knew each other andhad previously worked together in some form; subjects were co-workers, friends, family members, and married couples. Partici-pants ranged in age from 25–55; ten couples were mixed-gender;three both women; two both male. On average participants spent72 minutes (stddev(σ) = 12) working on the task.
4.2 The VAST 2006 ChallengeWe based our experiment around the VAST 2006 Challenge, code-named “Stegosaurus” [7], a scenario that entails finding a hiddenweapons-smuggling plot. Stegosaurus was developed by the Na-tional Visual Analytics Center at Pacific National Labs. We chose“Stegosaurus” because it is increasingly recognized as a standardvisual analytics task [1]. The dataset is available to the public todownload, and is usable by non-experts without training. Nonethe-less, it is a complex task that requires participants to connect andinfer facts buried in a set of several hundred documents. We used anextended version of the Stegosaurus document set containing 240digital and 6 paper documents. Cambiera does not currently sup-port search of non-textual materials like maps and images. Thus,we preloaded Cambiera with all of the newspaper and fact sheetarticles but provided paper print-outs of the map and other images.
The task comes with a vague goal of figuring out a car crash;from there, the analyst needs to work through the dataset. No sin-gle document tells the whole story—of the 246 documents, just tenhave true bearing on the story, while several others provide somebackground information but are not necessary, and the rest are irrel-evant. Solving the task requires carefully filtering out irrelevant ar-ticles, reading articles in detail, and making several intuitive leaps.In between stories about fruit-picking season, one document tellsus that people who ate at an apple festival got intestinal poisoning,probably from tainted meat. A second article says that a batch ofapples stored in a silo was contaminated with nerve gas. It requiressearching, reading, and intuition to recognize that the symptoms ofnerve gas were likely mistaken for intestinal poisoning, and thatthey came from the same apples. Collaboration has the potential toimprove the effectiveness of the analysis in several ways. Teamscan cover more documents in the same amount of time, can discussevolving hypotheses and contribute facts they may have found indi-vidually. At the same time, collaboration can be a mixed blessing ifteam members fail to share and/or synthesize their results. The goalof our evaluation is to study more closely how teams work togetherin solving this task with our tool, and to derive further requirementsand guidelines for tabletop visual analytics tools.
4.3 ProcedureOur study used the VAST 2006 challenge data loaded in Cambiera.Participants were seated on opposite sides of the table, and re-

ceived a fifteen-minute tutorial on the features of Cambiera usinga sample dataset, during which they were encouraged to experi-ment with the system and ask questions freely. They were read anintroductory letter to the “Stegosaurus” problem, which explainedthe task context. That letter includes a starting clue that suggesteda first document to read. Since our focus was on observing thepairs’ collaborative interactions with each other and with the sys-tem, and less on performance outcomes, we wanted to ensure thatthey were able to make progress in the task, and that they contin-ued working. For this reason, we provided assistance to teams whodid not progress in the task. The experimenter running the studywas familiar with the dataset, and so was able to monitor teams’progress. When teams stopped making progress, as judged by theexperimenter (e. g., reading and re-reading distracter documents orreporting to be stuck) the experimenter provided assistance. Dur-ing an assist, the experimenter did not provide new information, butrather asked the participants to clarify previous ideas that they hadraised. We maintained consistency of assists by using only one ex-perimenter, who followed a written protocol. Participants were alsoprovided with pens and notepads for taking notes, and a small setof auxiliary images that are part of the “Stegosaurus” scenario. Par-ticipants reported their results verbally at the end of the study. Weterminated the experiment when the team could produce a coherentstory when asked for their hypotheses, and ended all experimentsat one and a half hours. After the study, participants independentlyfilled out a questionnaire (due to a technical error, three pairs didnot fill out the questionnaire). The questionnaire elicited informa-tion on participant demographics and subjective awareness experi-ence. Finally, the experimenter interviewed the pair to understandhow they approached the problem and to get their feedback on thetechnology. Originally, we designed three experimental conditionsthat varied aspects of Cambiera’s visualization; in the different con-ditions, three different color schemes were used to subtly convey in-formation about which documents one’s partner had read and whichterms they had searched for. In a formal statistical analysis of thedata we did not find significant differences between the number ofsearches performed, documents read, documents/searches passedbetween participants, or facts connected in each condition. Thus,we report observations that apply to all pairs, regardless of condi-tion.
4.4 Data Analysis
In order to fully describe the event, we captured a variety of sources:each experimental session was video- and audio-recorded; in addi-tion, the software captured a screenshot every minute and a time-stamped event log for interactions with the tabletop. One experi-menter took notes in real time; a second experimenter engaged ina two-pass video coding in order to get a rich understanding ofthe ways in which teams solved the task. During the first videocoding pass the following information was coded: collaborationstyles based on a code set by Tang et al. [20], roles adopted byparticipants, use of awareness features, use of external information(shared or private notes), breakdowns or conflicts in group work,and how often workspace items were shared. After the first codingpass it became evident that the code set from Tang et al. [20] had tobe extended to accommodate the different study situation. Whereasthe original code set was developed for a situation in which partic-ipants shared the same representation, our participants could workwith data, representations, and views of the data in parallel. There-fore, we extended the code set to more clearly distinguish whenpeople shared views of the same data and when they were lookingat the same data but using copies of the same information itemsand thus had different views of the same information. During thesecond coding pass, the video coder also took more detailed time-stamped notes on when participants switched to different types ofcollaboration styles using the extended code set as well as extended
notes on which facts and documents teams found as they progressedthrough the task. Written transcripts of participants’ answers to thepost-session questionnaire were coded into higher-level categoriesincluding awareness (e. g., which information was missing or help-ful), work styles (strategies, roles, sharing, and collaboration), andtool features commented on (liked and missing features). The logdata was further parsed and quantitatively analyzed. Notes takenby participants and used during the experiment were also collectedand analyzed. Together, the detailed analysis of video, field notes,system logs, and interview data provided a rich understanding ofhow participants solved the task, worked with Cambiera, and howthey engaged with each other.
5 SOLVING A COMPLEX PROBLEM COLLABORATIVELY
With the exception of some research papers [1, 5] and the VASTcontest reports, there are few descriptions of how users work oncomplex analysis tasks, and none of them discuss collaborative as-pects in detail [18]. In this section, we describe the major strategiesour participants adopted to solve the complex VAST challenge.
5.1 Starting from a First ClueThe introductory letter read to the participants explicitly mentionedan initial document; all participants started by finding this initialdocument. Next, teams chose different strategies to collaborate ordivide their work: in nine of the teams, both partners worked to-gether to read the first article: either one member would wait whilethe other found the article, or both searched for it in parallel. Inthe other six teams, one team member volunteered to read the doc-ument; the other began to search for other terms they believed to berelevant (“conspiracy”), or searched for interesting locations on theprovided map (“missile silo sounds interesting”).
5.2 Iterative Searching and ReadingAfter working on the first document, teams engaged in an iterativeprocess of searching for and reading documents they had found.The task required participants to connect facts from a number ofdifferent documents; this is reflected in the large number of docu-ments that participants searched for, found, and read. Teams issuedon average 50 searches with 42 unique search terms. An averageof 90 of the 240 documents were then selected from these searches.70% of these documents were opened and read by one or both teammembers (63 documents on average). Interestingly, 58 documentson average were read more than once. We observed that partici-pants revisited previous documents after they or their collaboratorhad an insight about their work so far, or found new informationin other documents. The remaining 30% of all documents pulledout of the list were never opened but left on the tabletop. We sus-pect that these documents were kept as bookmarks or items to bechecked later, and then were later determined to be unnecessary.
5.3 Information Sharing and CollaborationAs participants worked on the dataset, they adopted different col-laboration styles. At times, they would work on the same problem,even reading a single document together; at other times, they wouldseparate to work on different problems. These different collabora-tion styles allowed them to flexibly investigate temporary hypothe-ses, test ideas, and continue to build a narrative. In order to moreclosely understand which information and views of the data spaceparticipants were sharing and collaborating on at a given moment,we coded their interactions based on their data views and personalinteractions. We identified the following eight different collabora-tion styles and activities that participants adopted (see Figure 4 forillustrations on each collaboration style):
DISC: Active discussion about the data or task. Limited systeminteraction (e. g., pointing to items or scrolling in docu-ments).
VE: View engaged. One person is actively working; the otherwatches and engages in conversation and comments on theobserved activities, but not interacting with the system.
SV: Sharing of the same view of a document or search result.Participants either look at the same document reader or thesame search result list together at the same time.
SIDV: Sharing of the same information but using differentviews of the data. Participants for example read the samedocument but using their own copies (views) of the docu-ment.
SSP: Work is shared to solve the same specific problem. Bothread different documents from a shared set. For exam-ple, participants issued a search for “injured driver,” di-vided the work and each person read one half of the docu-ments.
SGP: Work on the same general problem but from differentstarting points. For example, both participants searchfor documents to find information about the injured driverbut start from different searches (e.g. “injured driver” and“obituaries”) and consider different sets of documents.
DP: Work on different problems, and hence different aspectsof the task. For example, one person is interested in the in-jured driver, the other searches for events around the mis-sile silo.
D: Disengaged. One person is actively working, the other iswatching passively or is fully disengaged from the task.
During the video coding we recorded time-stamped event-logsfor each of these collaboration categories. We further grouped theminto those describing ’close’ collaboration (the first five codes) and’loose’ collaboration (the last three codes). Close collaboration wasgenerally characterized by active sharing of information and dis-cussion of hypotheses. During phases of close collaboration, teamsshared these temporary hypotheses, looked at related information,and pursued similar questions. During phases of loose collabora-tion, explicit verbal sharing of information and evolving hypothe-ses was less frequent as team members were looking at less relatedinformation. Our coding revealed that teams showed high task en-gagement, with very little time spent disengaged (D) from the task(under 1% of the time on average). Overall, we observed a ten-dency for groups to share information and hypotheses frequently,with eleven (of 15) groups spending over half of their time in closecollaboration. We refer to those eleven groups as closely coupled;the remaining four groups are loosely coupled.
In loosely-coupled teams, participants spent on average 60%of their time working in parallel, and only infrequently interactedwith their team members. Loosely coupled teams spent the dom-inant portion of their time pursuing different searches and ideas,but working on the same general problem (SGP). In SGP, teamswere trying to answer a common general question such as “whatis the involvement of Boynton laboratories” but starting from dif-ferent searches. The video coding revealed that 43% of their totaltask time was spent in this condition. In these groups, team mem-bers worked largely in their own part of the workspace with separatesearch results and documents; they would discuss (DISC) what theyhad found 7% of the time. The bottom row of Figure 5 shows oneloosely-coupled team.
Closely coupled groups spent on average 70% of their timeclosely interacting with the other team members. They spent themost time working from a shared set of documents (SIDV, taking24% of their total task time). They were also likely to examine thesame views as each other (SV, 13%). Further evidence for closeinteraction between participants in closely coupled groups is theoverall discussion time (DISC) with 11%, and the time spent dis-cussing and analyzing the same views (SV) of the data with 13% ofthe total task time, compared to just 5% for loosely coupled teams.The top row of Figure 5 shows one closely coupled team. How
much information participants shared and how frequently they con-nected to others had an influence on how well teams were able toconnect the facts and progress through the task. We discuss this inmore detail in Section 6.
5.4 Presenting the SolutionGroups were successful in finding the documents required to solvethe task. Eleven of the 15 groups found all ten critical documents;the remainder missed one or two. It is worth noting that while thedataset was large, all teams successfully found most of the criticaldocuments in the first half the experiment. While participants hadfound most of the relevant information by that time, however, theyhad typically not managed to connect the pieces of information theyhad into a coherent hypothesis. During the study, the experimenterpaused the teams half-way through to find out what they thoughtwas going on. Much to our surprise, members of several of theteams had radically different working hypotheses from their part-ners: in one dramatic example, one participant had been pursuing ahypothesis centered around a political intrigue, while the other wasworking on a terrorism question. As a result, the checkpoint turnedout to be accidentally invaluable for several of the teams. Thecheckpoint was sometimes the first time when participants wouldlink subtle details together: one person would express a hypothe-sis (“it was e-coli poisoning”) and the other would realize that anintuitive leap had been missed (“no, the apples were poisoned!”).After the checkpoint, however, teams began to better find the valueof coordinating; almost all of the teams had a unified story by thelast stage.
6 THE VALUE OF COLLABORATION
We observed a substantial degree of variance in how much teammembers chose to work together. Groups spent anywhere from 32%to 92% of their time in close collaboration. This variability mani-fested in different amounts of information sharing between groups,impacted how Cambiera’s features were used, and also led groupsto be more or less successful the task overall. In order to illustratehow different collaboration strategies impacted how well groupsperformed in the task and how they used Cambiera, we begin bydiscussing two different teams’ strategies in detail.
6.1 Strategy ExamplesGroup 2: Working Closely TogetherThe two participants in this group were close friends and co-workers. They found all ten critical documents, made all elevenconnections with no assists, and solved the complete task correctlyin 70 minutes. Both team members worked closely coupled for92% of the time (Figure 5, top). They had a clear work strategy:they searched and browsed the results in parallel but read interest-ing articles together, and exchanged 13 documents. They were ableto rapidly identify connections between facts, and moved throughthe study very efficiently. Since these participants worked veryclosely, with frequent communication throughout, they generallyhad very good awareness of what each other were searching for.Each made sure that their partner read important documents thatthey had found, so Cambiera’s awareness features were less criti-cal for this group. As a result, the pair used query coloring less totrack their own searches, and more as a way of finding documentsthat looked to be information-rich. In particular, they preferentiallyread documents that had several stripes (found by several searches),and that had not been read before.
Group 5: Failing to Combine Knowledge:Participants in Group 5 were friends, co-workers, and experi-enced puzzle solvers. They had coordinated multi-hundred-personpuzzle-solving competitions, and so felt very confident about theirability to solve the mystery. During the 69 minutes of their work,

SV SGP DP D
close collaboration loose collaboration
DISC VE SIDV SSP
Figure 4: Teams adopted eight different collaboration styles which influenced how much information was shared among them. In this image, theitem in SV represents one shared document (view). In SIDV both partners look at the same document (same color) but using their own views.In SSP team members read different documents from a common search (same shade of color), in SGP team members read documents on acommon general topic but starting from different searches, and in DP both read documents on different topics (different color).
92% Closely Coupled
33% Closely Coupled
Task time
Group 5
Group 2
Figure 5: Times two groups spent in close (yellow) and loose (blue) collaboration the time of the task. The top group spent 92% of its time inclose collaboration while the group on the bottom just spent 33% of their time closely coupled. White bars indicate times groups spent talking tothe experimenter to summarize current hypotheses or ask questions.
they found all critical documents but only found five connectionsand required assistance three times, which was among the worstperformance outcome of the study. Both participants reported thatthey were accustomed to working separately, trying to figure out apuzzle on their own. As a result, they adopted a loosely coupledwork style, working closely coupled only 33% of the time (Fig-ure 5, bottom). After reading the initial document together, theyeach chose a part of the problem that was of interest to them. Asthey worked, they would look for documents that might help theircurrent approach, and periodically mentioned their thoughts aloud.They spent substantial portions of the task unaware of each others’work. It was not until the experimenter asked for a status updatethat they began to realize what information they were missing. Thegroup spent much of the study working separately on different prob-lems (DP), periodically checking in. During the task, both partnersissued 78 searches; they later reported that they had gotten lost inthe sheer quantity of results they had found. Because they spentmost of the time working on different problems, they infrequentlyfound overlapping documents; as a result, they almost never usedCambiera’s awareness tools.
6.2 The Value of Close Collaboration
After closely studying the behavior of our groups we were inter-ested to find out whether the overall pattern of collaboration waslinked to how successfully groups were able to solve the task. Wecalculated a debrief score as proposed for judging the 2007 VASTcontest [17] from the debriefing of our participants. At the end ofthe study we asked participants to report the current hypotheses theyhad derived. We recorded correctly reported, incorrectly added, andmissing facts to form our score. Figure 6 gives an overview of thepercentage of time each group spent closely coupled (vertical axis)and their debriefing score (horizontal axis). Except for two outliers,groups that spent more time in close collaboration generally had ahigher debriefing score in our study.
Our study differed from the scoring of the VAST contest, how-ever, in that some groups received assists during the study. Whethera group required an assist is another indication of how well it wasable to work on the task. The four groups which required no as-sists spent over 69% of their time in close collaboration. Loosely
Debriefing Score2 3 4 5 6 7 8 9 10 11
0.30
0.35
0.40
0.45
0.50
0.55
0.60
0.65
0.70
0.75
0.80
0.85
0.90
0.95
Per
cent
Clo
sely
Cou
pled
Assists0
1
2
3
4
5
loosely coupled teams
4 most closely coupled teams
Group 5
Group 2
Figure 6: Relation between debriefing score, percentage of time agroup spent closely coupled, and number of assists per group.
coupled team required between 2–5 assists. The results for our fourmost loosely and closely coupled teams are presented in Table 1and highlighted in Figure 6.
These results suggest that coupling style was linked to teams’success in the task. Pairs that synchronized frequently on their dis-coveries, in general, did better than those that did not. They con-nected more facts and required fewer assists. In the task, many ofthe connections between documents and ideas were subtle and re-quired a leap of insight. For example, participants had to realize thatwhat seemed to be e.coli symptoms in one document might well bea poisoning in another document. Pairs who worked on the sameproblem (“let’s see if we can find other discussions of the poison”)were better able to make these connections, while pairs who workedcompletely independently (“I’ll work on the corruption story; youwork on the murder”) appeared to be less successful. For exam-ple, Group 5 (discussed in the previous section) is one example of agroup that did not work closely together, and did not perform well
Group Debriefing Score Assists Closely Coupled
7 6 2 32%5 5 3 33%8 4 5 39%3 3 3 46%
12 10 0 74%2 10 0 90%15 9 0 90%1 11 3 92%
Table 1: Debriefing score and assists for the four loosely coupledteams (top) and the four most closely coupled teams (bottom).
on the task overall (see Figure 6). The summaries that they gaveeach other infrequently included the critical facts that they neededto make connections. Similarly, working too separately was a detri-ment to other pairs.
Overall, teams that were more successful—that is, reported morecorrect and fewer incorrect facts, and got fewer hints—were onesthat spent more time closely coupled. Note that this correlationdoes not suggest causation: that is, it is unclear whether success onthe task leads to coupling or coupling leads to success. It is likely tobe a combination of both: in many teams, we observed pairs of par-ticipants working independently until one of them found somethingthat seemed promising. Frequently, finding a critical document dur-ing separate work led pairs to switch to a more closely coupled styleto discuss intermediate results, to read the critical document or otherrelated documents together, to interpret the facts found up to thatpoint, or to offer/ask for help. This was echoed during the debrief-ing session where eight of the fifteen pairs explicitly stated that theytended to work in a form of divide-and-conquer style. They wouldfirst go off and do individual work and then come together whenthey had found a partial solution or hypothesis to report or wantedto get the other person involved for validation.
6.3 Suitability of the Tabletop as a Collaborative VisualAnalytics Workspace
During the study, the tabletop was the collaborative center of users’engagement in the task. Cambiera was designed to take advantageof the tabletop setting through specific features that allowed par-ticipants to share and organize information freely similar to whatwould be possible in a physical setting. Two key benefits arosefrom using tabletop that would not have been as accessible ineither a multiple-display or a shoulder-to-shoulder configuration:artefact-centered information sharing and face-to-face interactions.Both sharing and face-to-face work enhanced collaboration: part-ners were able to point to and manipulate documents and searchesthat they felt were relevant, and point to documents that their part-ners could see. During discussion (DISC) periods, team membersdid not need to turn away from the table in order to talk face-to-face but instead discussions stayed focused on the shared infor-mation artefacts, while being able to easily pull in and comparerelated information. In the debriefing session, one team membersaid: “sometimes [my partner] and I fight about who gets to usethe computer so it was nice to share that. One person standing andanother sitting that’s never a collaborative act, here we’re assem-bling a whole thing together.” Others stated that working face-to-face helped them, “we kept talking the whole time and we assignedthings to each other.”
Several team members volunteered that they particularly likedthe direct-touch nature of the tabletop for sharing electronic docu-ments. In the debriefing session, 11 of the 15 pairs highlighted theease of sharing documents as one of their favorite and most usefulfeatures of Cambiera. Five pairs expressed that they particularly en-joyed working in a face-to-face setting. Last, the tabletop seemed
to allow people to think about the task in a different way: “I likedthe direct touch: it’s more human, less technical.” While some ofthis enthusiasm can be attributed to the novelty of touch input, allteams approached the table without hesitation and felt encouragedto interact with the system.
The face-to-face tabletop setting and the ability for both partnersto synchronously search and read was a strong benefit for the com-plex problem solving context. We observed several instances inwhich the collaborative setting contributed to participants makingprogress in the task. Team members shared and reflected on eachothers’ ideas, cross-validated hypotheses by sharing documents andresults, and engaged in repeated discussion about current hypothe-ses and strategies on how to proceed further. We observed all pairstalking to each other, gesturing toward searches and documents onthe tabletop, and generally utilizing the shared reference point ofhaving a tabletop in front of them. In the questionnaire, 23 of 24participants “agreed” or “strongly agreed” that they knew what theirpartners were working on, suggesting that the tabletop provided astrong context for mutual awareness.
We note that some teams felt that the Microsoft Surface tabletop,in its current form, was a constraint. At 2’×3’, and 1024×768 pix-els, team members often felt cramped, wanting a higher-resolutionand physically larger display for document reading. The lack ofa physical keyboard meant that typing was more cumbersome anderror-prone than on a physical keyboard. While many of the table-tops on the market suffer from similar difficulties, some projects arebeginning to explore larger-scale work surfaces [8] and integratedkeyboards.
7 IMPLICATIONS FOR DESIGN
In summary, our study found that working face-to-face around thetable was a successful way for pairs to solve the complex problem.The setting allowed participants to approach the problem quicklyand effectively. All participants immediately immersed themselvesin the task and made use of the various features Cambiera offered.One of the surprising findings of our study was that task success andtime spent working closely together were highly correlated. Thiswas not a challenge of information finding: every team found mostor all of the critical documents; the only question was whether theywere able to draw the connections between them.
Based on our findings, we draw some design implications forimproving Cambiera as well as other co-located collaborativeproblem-solving tools.
7.1 Design for Transient Behavior
The complex problem required collaborators to react to emerginginformation and hypotheses and required the team to frequently re-assess and change their current work strategies. As there was noobvious best way to solve the task, teams often started out with dif-ferent strategies. The support of a wide variety of work styles andcollaboration strategies is a challenge for the design of collaborativeproblem solving tools. It is insufficient to support just one strategy,since different team members employ different strategies, often inparallel, and pairs frequently shift strategies depending on the cur-rent stage of the task. Cambiera, for example, offered flexibilitythrough free workspace organization and repositioning of searchesand documents. Team members used Cambiera to engage in dif-ferent analysis activities in parallel: to search, read, and extractinformation at any given time without influencing others’ work. Byallowing team members to create their own copies of documentsand search results as needed, and by not forcing participants to ex-plicitly share resources, these flexible work behaviors were able toemerge. We recommend that collaborative systems continue to al-low teams to smoothly choose which collaboration style best fitstheir task requirements and work styles.

Cambiera, however, did not offer sophisticated storage or shar-ing mechanisms, but participants did request features for relatingdata to each other and sharing partially-assembled conclusions. Thechallenge in offering these mechanisms is to design them in a waythat they can easily and fluidly be changed, re-appropriated, or mor-phed depending on task progress and current questions that the teamis trying to answer. For example, we envision interactive mecha-nisms that can easily rearrange facts based on different semantic ar-rangements as well as team members’ preferred placements. Othercollaboration tools for complex tasks could similarly benefit fromflexible methods to arrange and share information, even outside ofan intelligence analysis task.
7.2 Encourage Closely Coupled WorkPairs were able to take advantage of the unique affordances of thetabletop—the face-to-face interaction and direct manipulation ofobjects—to organize their thoughts, share ideas, and work throughthe problem. Pairs that worked for too long in parallel were lesssuccessful in connecting the facts they found, and so had troublesolving the challenge. The awareness features built into Cambierawere meant to bring teams closer together by encouraging conver-sation about documents that both team members had read or found.While participants found this subtle awareness information usefuland valuable, we conclude that stronger indicators would be morebeneficial. These could make more obvious visual connections be-tween common information that team members are reading, that areplaced in close proximity, or that have been stored in the workspace.Collaborative annotations and notepads may also have encouragedthe loosely coupled teams to re-connect.
8 CONCLUSIONS
We presented a detailed exploratory study of a complex collabora-tive problem solving activity around a digital tabletop display. Westudied Cambiera, a tool for collaborative analysis work with textdocument collections. The contributions of this study were a set offindings on our digital tabletop setting as a context for co-locatedproblem solving. We explored its suitability, identified eight collab-oration styles which pairs adopted while solving the problem col-laboratively, and described how collaboration impacted their suc-cess in the task. In particular, our study showed that Cambiera—in the digital tabletop setting—was a successful work context forcomplex problem solving. Our task required teams to constantlyreact to new information, to re-interpret what they had found, andto re-assess their strategies. Hence, participants worked together ina variety of work styles, supported by Cambiera’s flexible collab-orative search, organization, and sharing mechanisms. We foundthat teams that connected most often about their individual findings,and worked closely together throughout, were more successful atthe task and required fewest assists. Based on these observations,we offered recommendations for features that could be used to im-prove co-located problem-solving tools more generally. In particu-lar, support for teams to make ad-hoc changes to all aspects of theircurrent work strategies as well as features that encourage them toshare information and connect with each other frequently, are worthconsidering.
ACKNOWLEDGEMENTS
We thank our participants for taking part in the study, our co-workers at Microsoft for participating in the pilot studies, SheelaghCarpendale for valuable feedback on the paper, and Chris North forintroducing us to the VAST challenge data and tasks.
REFERENCES
[1] C. Andrews, A. Endert, and C. North. Space to Think: Large High-Resolution Displays for Sensemaking. In Proc. of CHI, pages 55–64,New York, USA, 2010. ACM.
[2] A. D. Balakrishnan, S. R. Fussell, and S. Kiesler. Do visualizationsimprove synchronous remote collaboration? In Proc. of CHI, pages1227–1236, New York, USA, 2008. ACM.
[3] A. D. Balakrishnan, S. R. Fussell, S. Kiesler, and A. Kittur. Pitfalls ofinformation access with visualizations in remote collaborative analy-sis. In Proc. of CSCW, pages 411–420, New York, USA, 2010. ACM.
[4] S. E. Brennan, K. Mueller, G. Zelinsky, I. Ramakrishnan, D. S. War-ren, and A. Kaufman. Towards a Multi-Analyst, Collaborative Frame-work for Visual Analytics. In Proc. of VAST, pages 129–136, LosAlamitos, USA, 2006. IEEE Comp. Society.
[5] G. Chin, Jr., O. A. Kuchar, and K. E. Wolf. Exploring the analyticalprocesses of intelligence analysts. In Proc. of CHI, pages 11–20, NewYork, USA, 2009. ACM.
[6] C. Forlines and C. Shen. DTLens: Multi-user Tabletop Spatial DataExploration. In Proc. of UIST, pages 119–122, New York, USA, 2005.ACM Press.
[7] G. Grinstein, T. O’Connell, S. Laskowski, C. Plaisant, J. Scholtz,and M. Whiting. VAST 2006 Contest–A Tale of Alderwood. InProc. of VAST, pages 215–216, Los Alamitos, USA, 2006. IEEEComp. Society.
[8] B. Hartmann, M. R. Morris, H. Benko, and A. D. Wilson. AugmentingInteractive Tables with Mice & Keyboards. In Proc. of UIST, pages149–152, New York, USA, 2009. ACM.
[9] P. Isenberg and S. Carpendale. Interactive Tree Comparison forCo-located Collaborative Information Visualization. IEEE Trans-actions on Visualization and Computer Graphics, 13(6):1232–1239,Nov./Dec. 2007.
[10] P. Isenberg and D. Fisher. Collaborative Brushing and Linking for Co-located Visual Analytics of Document Collections. Computer Graph-ics Forum, 28(3):1031–1038, Juni 2009.
[11] P. Isenberg, M. Sedlmair, D. Baur, T. Isenberg, and A. Butz. Proceed-ings of the VisWeek workshop on Collaborative Visualization on In-teractive Surfaces—CoVIS 2009. Technical Report LMU-MI-2010-2,Ludwig Maximilias University Munich, Munich, April 2010.
[12] P. Isenberg, A. Tang, and S. Carpendale. An Exploratory Study ofVisual Information Analysis. In Proc. of CHI, pages 1217–1226, NewYork, NY, USA, 2008. ACM Press.
[13] P. E. Keel. Collaborative Visual Analytics: Inferring from the SpatialOrganization and Collaborative Use of Information. In Proc. of VAST,pages 137–144, Los Alamitos, USA, 2006. IEEE Comp. Society.
[14] B. Mirel. Interaction Design for Complex Problem Solving. MorganKaufmann, San Francisco, 2004.
[15] M. R. Morris, J. Lombardo, and D. Wigdor. WeSearch: Support-ing Collaborative Search and Sensemaking on a Tabletop Display. InProc. of CSCW, pages 401–410, New York, USA, 2010. ACM.
[16] S. A. Paul and M. R. Morris. Cosense: Enhancing sensemaking forcollaborative web search. In Proc. of CHI, pages 1771–1780, NewYork, USA, 2009. ACM.
[17] C. Plaisant, G. Grinstein, J. Scholtz, M. Whiting, T. O’Connell,S. Laskowski, L. Chien, A. Tat, W. Wright, C. Gorg, Z. Liu, N. Parekh,K. Singhal, and J. Stasko. Evaluating Visual Analytics at the 2007VAST Symposium Contest. IEEE Computer Graphics and Applica-tions, 28:12–21, 2008.
[18] A. Robinson. Collaborative synthesis of visual analytic results. InProc. of VAST, pages 67–74, Los Alamitos, CA, USA, 2008.
[19] J. Stasko, C. Gorg, and Z. Liu. Jigsaw: Supporting InvestigativeAnalysis Through Interactive Visualization. Information Visualiza-tion, 7:118–132, 2008.
[20] A. Tang, M. Tory, B. Po, P. Neumann, and S. Carpendale. Collabora-tive Coupling over Tabletop Displays. In Proc. of CHI, pages 1181–1290, New York, 2006. ACM Press.
[21] F. B. Viegas, M. Wattenberg, F. van Ham, J. Kriss, and M. McKeon.Many Eyes: A Site for Visualization at Internet Scale. IEEE Trans-actions on Visualization and Computer Graphics, 12(5):1121–1128,Nov./Dec. 2007.
[22] D. Wigdor, H. Jiang, C. Forlines, M. Borkin, and C. Shen. WeSpace:The Design Development and Deployment of a Walk-up and ShareMulti-Surface Visual Collaboration System. In Proc. of CHI, pages1237–1246, New York, USA, 2009. ACM Press.