An Exploratory Aggregate Analysis of Interstate Highway ... · An Exploratory Aggregate Analysis of...
22
An Exploratory Aggregate Analysis of Interstate Highway Bridge Deck Expenditure & Condition SeyedAli Ghahari, Julie Qiao, Samuel Labi 11 th International Bridge & Structures Management Conference April 25-27, 2017 Mesa, Arizona, USA
Transcript of An Exploratory Aggregate Analysis of Interstate Highway ... · An Exploratory Aggregate Analysis of...

An Exploratory Aggregate Analysis of Interstate Highway Bridge Deck Expenditure & Condition
SeyedAli Ghahari, Julie Qiao, Samuel Labi11th International Bridge & Structures Management ConferenceApril 25-27, 2017Mesa, Arizona, USA

Outline
Introduction
Data and Methodology
Results and Discussion
Concluding Remarks
Introduction
Data & Methodology
Results & Discussion
Conclusion
References
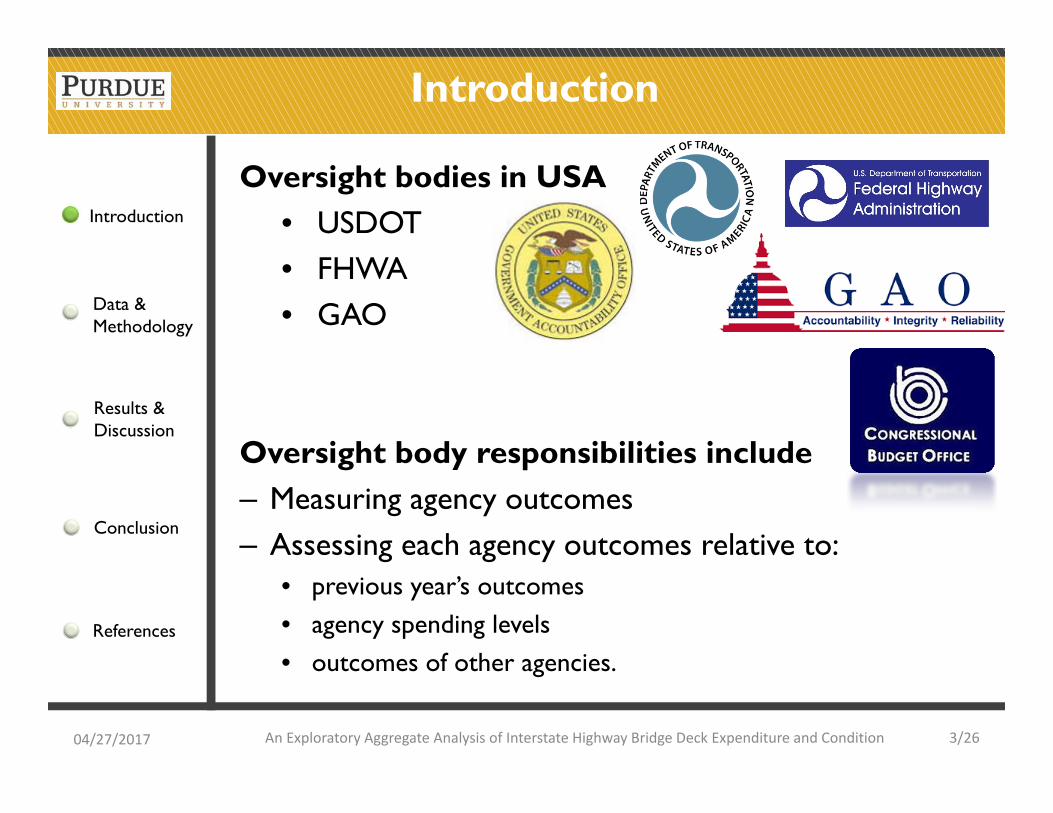
Oversight bodies in USA• USDOT• FHWA• GAO
Oversight body responsibilities include– Measuring agency outcomes– Assessing each agency outcomes relative to:
• previous year’s outcomes• agency spending levels• outcomes of other agencies.
Introduction
04/27/2017 An Exploratory Aggregate Analysis of Interstate Highway Bridge Deck Expenditure and Condition 3/26

Introduction
Data & Methodology
Results & Discussion
Conclusion
References
Scope and Objectives of this paper
Scope: Interstate highway bridge decks in USA
Objectives:
• Establish empirical relationship between deck expenditure and deck condition
• Compare relative performance across states
Introduction
04/27/2017 An Exploratory Aggregate Analysis of Interstate Highway Bridge Deck Expenditure and Condition 4/26

DATA
Introduction
Results & Discussion
Conclusion
References
Data & Methodology
Data
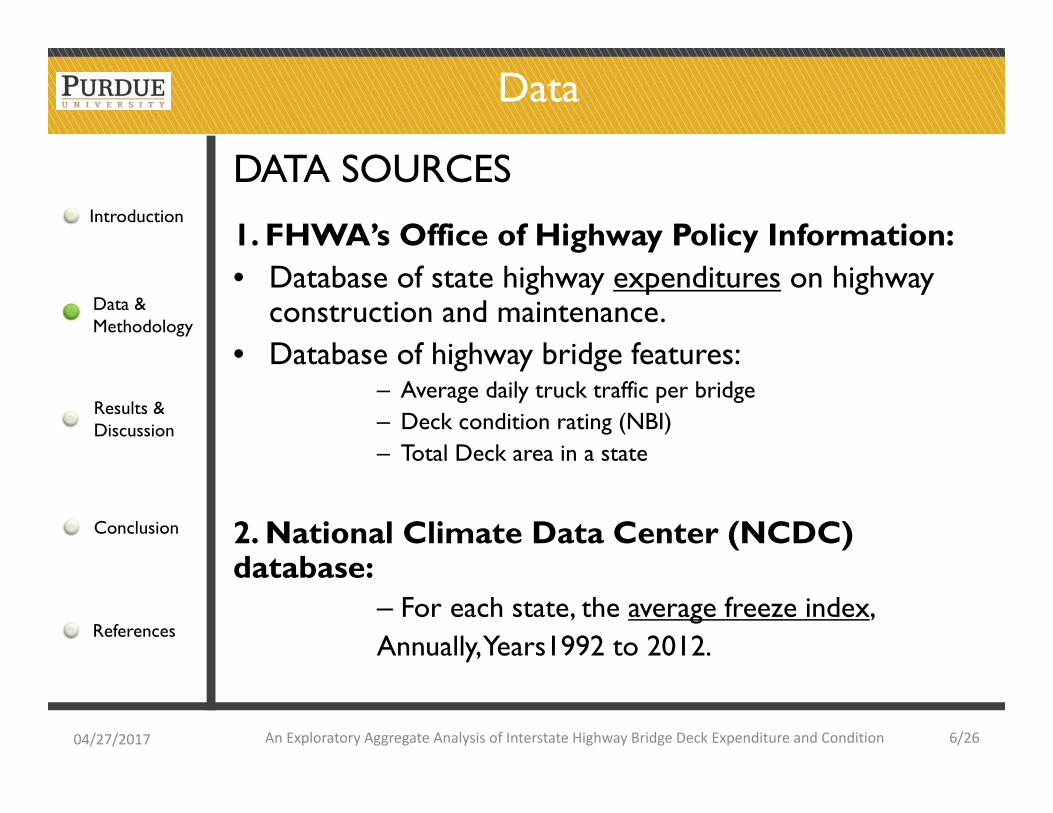
DATA SOURCES
1. FHWA’s Office of Highway Policy Information: • Database of state highway expenditures on highway
construction and maintenance. • Database of highway bridge features:
– Average daily truck traffic per bridge– Deck condition rating (NBI)– Total Deck area in a state
2. National Climate Data Center (NCDC) database:
– For each state, the average freeze index,Annually, Years1992 to 2012.
04/27/2017 An Exploratory Aggregate Analysis of Interstate Highway Bridge Deck Expenditure and Condition 6/26

Introduction
Results & Discussion
Conclusion
References
Data & Methodology
Data
Data on strength factors:• Total expenditure per ft2 of deck
Data on stress factors:• Traffic (truck) loads• Climate severity (Freeze index in degree-days)
Other data:• Total area of interstate bridge decks in a state
• Deck condition
04/27/2017 An Exploratory Aggregate Analysis of Interstate Highway Bridge Deck Expenditure and Condition 7/26

Introduction
Results & Discussion
Conclusion
References
Data & Methodology
Data
statesDECK_COND_058
5.992424 - 6.034351
6.034352 - 6.291041
6.291042 - 6.422594
6.422595 - 6.482234
6.482235 - 6.536973
6.536974 - 6.595408
6.595409 - 6.678516
6.678517 - 6.853323
6.853324 - 7.085179Distribution of the Average Deck Condition across the States, 10‐year average
(NBI Indices shown here as continuous variables)
04/27/2017 An Exploratory Aggregate Analysis of Interstate Highway Bridge Deck Expenditure and Condition 8/26
Introduction
Results & Discussion
Conclusion
References
Data & Methodology
Methodology
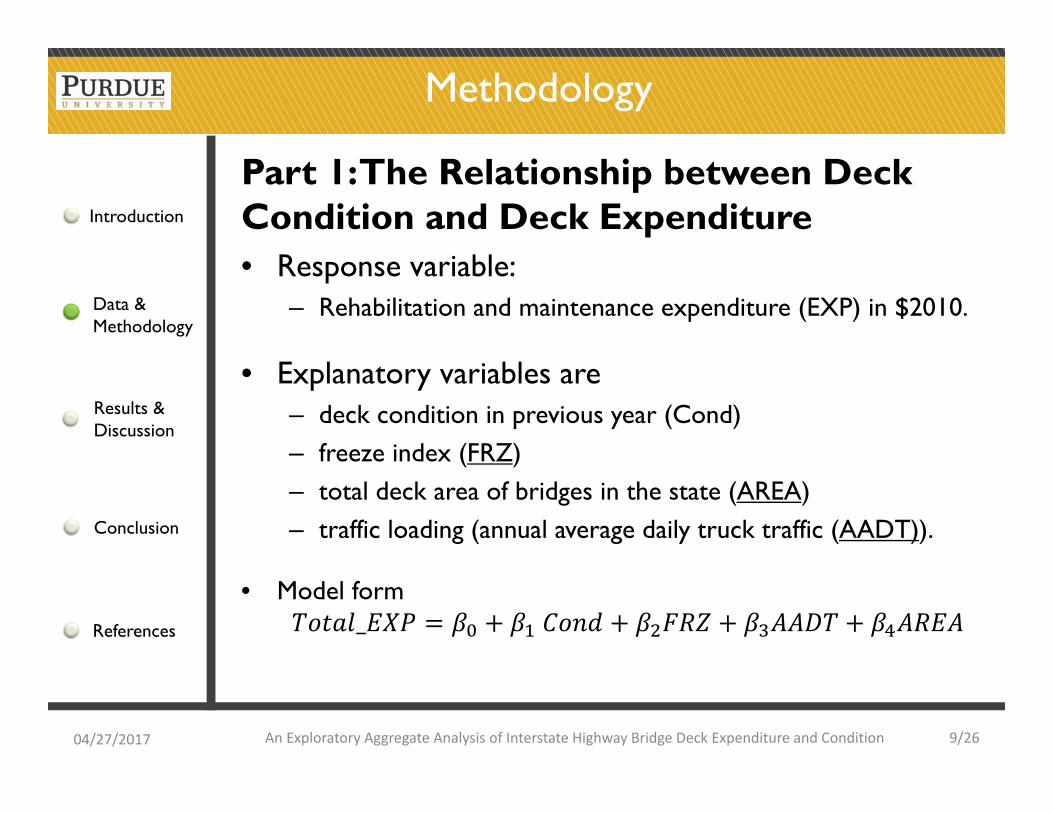
Part 1: The Relationship between Deck Condition and Deck Expenditure• Response variable:
– Rehabilitation and maintenance expenditure (EXP) in $2010.
• Explanatory variables are– deck condition in previous year (Cond)– freeze index (FRZ)– total deck area of bridges in the state (AREA)– traffic loading (annual average daily truck traffic (AADT)).
• Model form _
04/27/2017 An Exploratory Aggregate Analysis of Interstate Highway Bridge Deck Expenditure and Condition 9/26

Introduction
Results & Discussion
Conclusion
References
Data & Methodology
Methodology
Part 2: Assessing the Relative Performance across the States
Inputs:• Expenditure ($/ft2 of deck)• Average climate severity• Average truck traffic per bridge• Average condition of all decks
04/27/2017 An Exploratory Aggregate Analysis of Interstate Highway Bridge Deck Expenditure and Condition 10/26
Introduction
Results & Discussion
Conclusion
References
Data & Methodology
Methodology
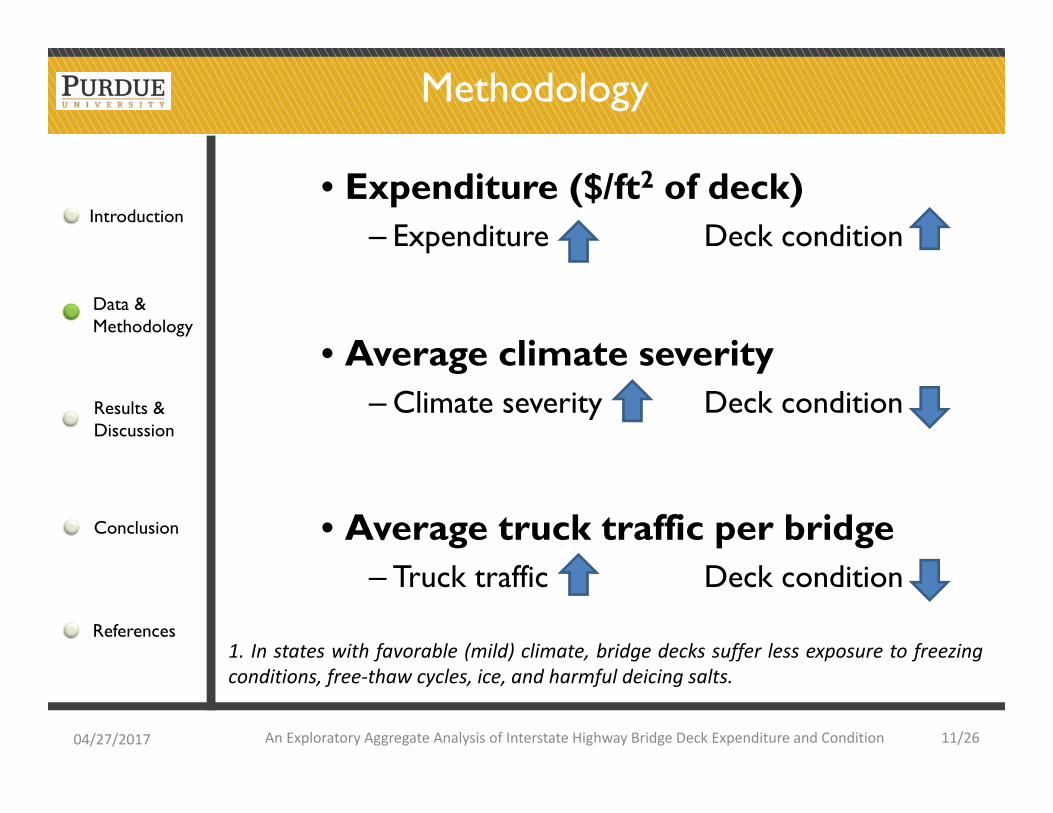
• Expenditure ($/ft2 of deck)– Expenditure Deck condition
• Average climate severity– Climate severity Deck condition
• Average truck traffic per bridge– Truck traffic Deck condition
04/27/2017 An Exploratory Aggregate Analysis of Interstate Highway Bridge Deck Expenditure and Condition 11/26
1. In states with favorable (mild) climate, bridge decks suffer less exposure to freezingconditions, free‐thaw cycles, ice, and harmful deicing salts.

Introduction
Results & Discussion
Conclusion
References
Data & Methodology
Methodology
Excellent performing states• Low expenditure ($/ft2 of deck)• Unfavorable climate• High truck traffic per bridge• Yet, good condition of decks
Poor performing states• High expenditure ($/ft2 of deck)• Favorable climate• Low truck traffic per bridge• Yet, poor condition of decks
04/27/2017 An Exploratory Aggregate Analysis of Interstate Highway Bridge Deck Expenditure and Condition 12/26

RESULTS & DISCUSSION

Introduction
Results & Discussion
Conclusion
References
Data & Methodology
Results
Part 1. The Relationship between Condition and Expenditure
• Inverse relationship between the deck condition and the expenditure
– A lower average condition in one year leads to higher expenditures the following year.
• The higher the total area of bridge deck, the higher the total expenditure per ft2 (but relationship is non-linear; hence, scale economies exist)
• A higher freeze index is generally associated with higher expenditure.
04/27/2017 An Exploratory Aggregate Analysis of Interstate Highway Bridge Deck Expenditure and Condition 14/26
_
R‐squared 0.3734 Adj R‐squared 0.3177 Root MSE 3.1e+5
Coef. t P>|t| [95% Conf. Interval]
AVG DECK CONDITION (NBI) ‐382373.4 ‐2.17 0.035 ‐736482 ‐28264.75
TOTAL DECK AREA 0.004872 2.91 0.006 0.0015 0.0882
FREEZE INDEX 29.7635 0.35 0.730 ‐143.1713 202.6985
AVG TRUCK TRAFFIC 0.01444 1.32 0.194 .007628 0.0365110
Constant Term 2562771 2.27 0.028 289499 4836043

Introduction
Results & Discussion
Conclusion
References
Data & Methodology
Results
1st Quadrant(Lowest performers)
2nd Quadrant(Fair‐good performers)
3rd Quadrant(Highest performers)
4th Quadrant(Fair‐good performers)
U.S. Average
U.S. Average
Relative performance across the states
04/27/2017 An Exploratory Aggregate Analysis of Interstate Highway Bridge Deck Expenditure and Condition 15/26
The position of a state in a quadrat can be a reflection of the prudent use of the taxpayer funds by the state agency.
On average, Low deck condition despite their favorable conditions (low truck traffic and mild climate) and high spending levels ($/ft2 of deck)
On average, Good deck condition, favorable conditions (low truck traffic and mild climate) and low spending levels ($/ft2 of deck)
On average, High deck condition despite their unfavorable conditions (high truck traffic and severe climate) and low spending levels ($/ft2 of deck)
On average, Low deck condition and unfavorable conditions (high truck traffic and severe climate) and high spending levels ($/ft2 of deck)
Rhode Island, District of Columbia, New Jersey, Alaska, Vermont, North Dakota, Oregon, West Virginia, Oklahoma, Idaho, Washington, MississippiNew York, Connecticut, Illinois, Massachusetts, Michigan, Pennsylvania
Delaware, Kentucky, Arkansas, Arizona, Louisiana, Texas, Georgia, Tennessee, Missouri, Kansas, Nevada, South Dakota, South Carolina, Alabama, Virginia, New
Hampshire, New Mexico, Florida, Montana, Maryland, Hawaii, Maine, North Carolina, Nebraska
Indiana, Utah, Iowa, Colorado, Minnesota, Ohio, Wisconsin, Wyoming, California

CONCLUSION

Introduction
Results & Discussion
Conclusion
References
Data & Methodology
Conclusion
• The framework shows how oversight agencies can increase the overall accountability of individual highway agencies.
• The observed differences in the state performance could be due to differences in:
o Agency supervision/audit qualityo Work culture in the agencyo Geotechnical conditions in the stateo Design/construction practiceso Material quality in the state’s quarries
• Results can help agencies seen/perceived as poorly performing, to carry out critical self-assessment to:
• identify the possible causes of such performance or• investigate reasons for any misperception.
04/27/2017 An Exploratory Aggregate Analysis of Interstate Highway Bridge Deck Expenditure and Condition 17/26

Introduction
Results & Discussion
Conclusion
References
Data & Methodology
Future Work
04/27/2017 An Exploratory Aggregate Analysis of Interstate Highway Bridge Deck Expenditure and Condition 18/26
• Key Assumption In Current Paper: One (1) degree-day of FRZ and One (1) truck have equivalent effects on deck damage, and hence on deck repair expenditure.
• Future papers could relax the above assumption by:
– Establishing appropriate weights between the deterioration factors and use these weights to determine the agencies’ quadrant positions
• Consider other model specifications; e.g., the lagged panel model.
• Consider average statewide values of other design variables that:o Constitute “stressors” or “strengtheners” of deck conditiono Measure the stability of the state quadrant position (performance
ranking) across the years
• Extend the work to the other bridge components (superstructure and substructure) and other highway functional classes

KEY REFERENCES

Introduction
Results & Discussion
Conclusion
References
Data & Methodology
Key References
• U.S. Department of Transportation. Policy and Governmental Affairs, Office of Highway Policy Information. 2016 [cited 2016 11-10-2016]; Available from: http://www.fhwa.dot.gov/policyinformation/statistics/2012/.
• U.S. Department of Transportation. NBI ASCII files, Bridges & Structures, Federal Highway Administration. 2016 [cited 2016 11-10-2016]; Available from: https://www.fhwa.dot.gov/bridge/nbi/ascii.cfm.
• U.S. Department of Transportation, Recording and Coding Guide for the Structure Inventory and Appraisal of the Nation's Bridges. Federal Highway Administration, 1995. FHWA-PD-96-001: p.p. 1-124.
• National Climate Data Center. U.S. Local Climatological Data. 2016 [cited 2016 11-10-2016]; Available from: https://www.ncdc.noaa.gov/data-access/quick-links#loc-clim.
• Liao, T., I. Kumar, M. Dojutrek, and S. Labi, Updating Secondary Climate at Tributes for Purposes of Transportation Infrastructure Management, in Journal of Infrastructure Systems2017.
04/27/2017 An Exploratory Aggregate Analysis of Interstate Highway Bridge Deck Expenditure and Condition 20/26

THANK YOU FOR YOUR ATTENTION

Q&A